the montana economy and unemployment insurance benefits barbara wagner, senior economist...
Post on 19-Dec-2015
214 views
TRANSCRIPT

The Montana Economy and Unemployment Insurance Benefits
Barbara Wagner,Senior [email protected]
406-444-5474
House Business and Labor Committee, 2011 Session
January 17, 2011

Today’s Topics
1. Montana’s economy in recession– How unemployed people differ from
unemployment claims
2. Montana’s economy in recovery
3. Future challenge: efficient job matching


Personal Income Growth by Quarter, U.S. and MT
2007.1
2007.2
2007.3
2007.4
2008.1
2008.2
2008.3
2008.4
2009.1
2009.2
2009.3
2009.4
2010.1
2010.2
2010.3
-2.5%
-2.0%
-1.5%
-1.0%
-0.5%
0.0%
0.5%
1.0%
1.5%
2.0%
2.5%
US Montana

U.S. and MT Unemployment Rates Since 2000
Source: Bureau of Labor Statistics, Current Population Survey and Local Area Unemployment Statistics.
2000 2001 2002 2003 2004 2005 2006 2007 2008 2009 20100.0
2.0
4.0
6.0
8.0
10.0
12.0
0
1
Recession MT
US


More Unemployed People than Unemployment Insurance Claims
2000 2001 2002 2003 2004 2005 2006 2007 2008 2009 20100
5,000
10,000
15,000
20,000
25,000
30,000
35,000
40,000
0
1
Unemployed Total Claims
Recession

New Claims vs. Change in the Unemployment Estimate
2000 2001 2002 2003 2004 2005 2006 2007 2008 2009 2010
-1,000
0
1,000
2,000
3,000
4,000
5,000
6,000
7,000
8,000
9,000
0
1
Recession
Change in Unemployed
New Claims
12-month moving average

Unemployed People is Different than Unemployment Insurance Claims
• Only about 1/3 of unemployed persons receive unemployment insurance benefits– Self-employed– Many do not qualify for benefits
• Reductions in the number of unemployed Montanans may not reduce the number of claims– Churning in the labor force– Some workers have frequent unemployment claims
even during periods of low unemployment

Indexed U.S. and MT Payroll EmploymentEmployment in Dec. 2007= 100%
Source: Current Employment Statistics, Seasonally Adjusted.
Jan-07
Mar-0
7
May-07
Jul-07
Sep-07
Nov-07
Jan-08
Mar-0
8
May-08
Jul-08
Sep-08
Nov-08
Jan-09
Mar-0
9
May-09
Jul-09
Sep-09
Nov-09
Jan-10
Mar-1
0
May-10
Jul-10
Sep-1090.0%
92.0%
94.0%
96.0%
98.0%
100.0%
102.0%
MT US

Employment in Selected Industries During Recession, Dec. 2007 Employment =100%
60.0%
65.0%
70.0%
75.0%
80.0%
85.0%
90.0%
95.0%
100.0%
105.0%
110.0%
De
c-07
Jan-
08
Feb-
08
Mar
-08
Ap
r-08
May
-08
Jun-
08
Jul-0
8
Au
g-08
Sep-
08
Oct
-08
No
v-08
De
c-08
Jan-
09
Feb-
09
Mar
-09
Ap
r-09
May
-09
Jun-
09
Jul-0
9
Au
g-09
Sep-
09
Oct
-09
No
v-09
De
c-09
Jan-
10
Feb-
10
Mar
-10
Ap
r-10
May
-10
Jun-
10
Jul-1
0
Au
g-10
Sep-
10
Oct
-10
No
v-10
Construction
ManufacturingMining and Logging
Education and Health Services Government
Trade and Transportation
Other Business Support Industries
Other Consumer Industries


Take Away Points- Montana’s Economy in Recession
• Huge job losses in Construction, Retail, and Manufacturing
• Most industries had job growth in 2010– Government and Construction did not
• Northeast Montana was the worst hit during the recession
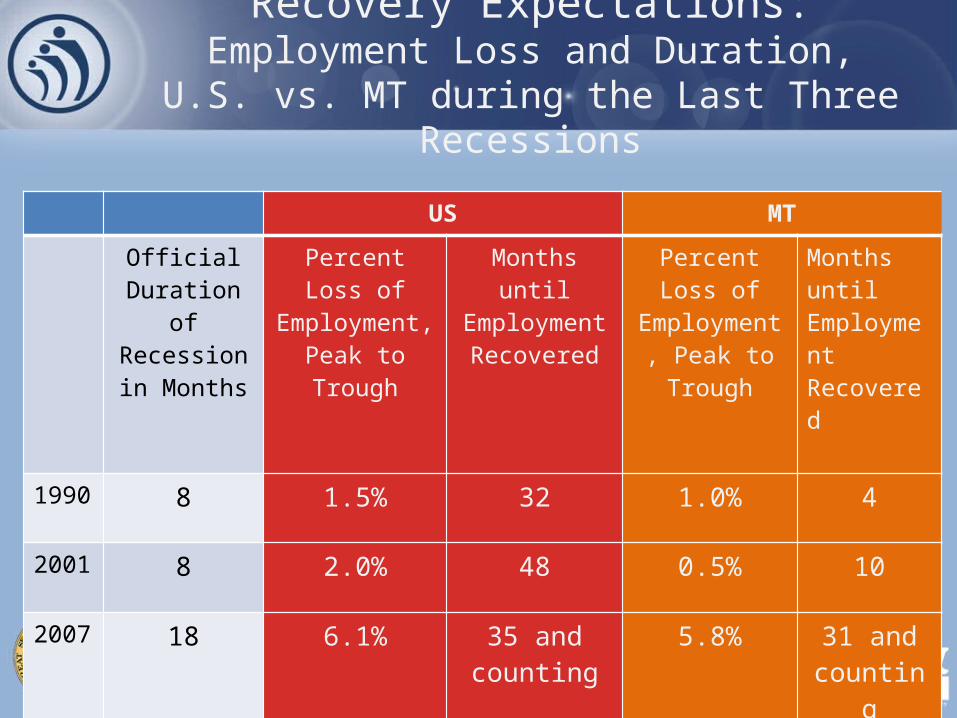
Recovery Expectations:Employment Loss and Duration, U.S. vs. MT
during the Last Three Recessions
US MT
Official Duration of Recession in
Months
Percent Loss of Employment,
Peak to Trough
Months until Employment Recovered
Percent Loss of Employment,
Peak to Trough
Months until Employment Recovered
1990 8 1.5% 32 1.0% 4
2001 8 2.0% 48 0.5% 10
2007 18 6.1% 35 and counting
5.8% 31 and counting

Recovery Expectations: Increased Labor Productivity Means Fewer Jobs
Source: Bureau of Labor Statistics, Quarterly Labor Productivity for the U.S.
1 2 3 4 1 2 3 4 1 2 3 4 1 2 3 4 1 2 3 4 1 2 32005 2006 2007 2008 2009 2010
85
90
95
100
105
110
115
Output Per Hour Output
Hours Worked
Recovery Expectations: Private Job Growth Has Been Slow due to Low
Consumer Spending and Uncertainty• Businesses have cash to hire more employees– Moody’s estimates $1-2 trillion in cash reserves
• Conflicting economic and political news creates uncertainty
• Recession may have long-term impacts on consumer spending– Consumer expenditures represent about 70% of GDP
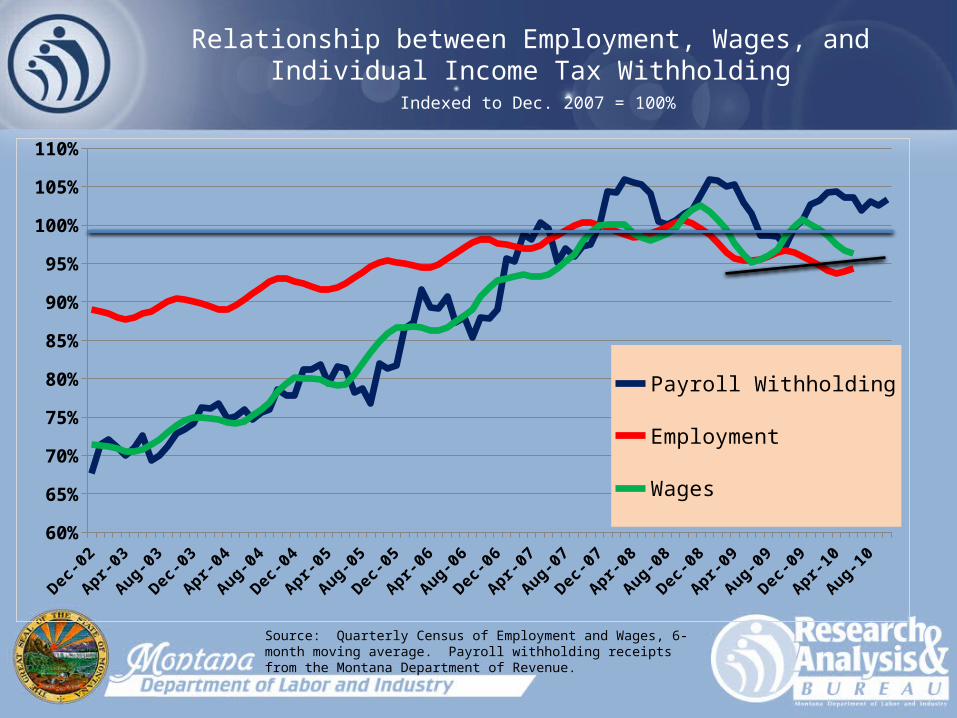
Relationship between Employment, Wages, and Individual Income Tax Withholding
Indexed to Dec. 2007 = 100%
Dec-02
Mar-0
3
Jun-03
Sep-03
Dec-03
Mar-0
4
Jun-04
Sep-04
Dec-04
Mar-0
5
Jun-05
Sep-05
Dec-05
Mar-0
6
Jun-06
Sep-06
Dec-06
Mar-0
7
Jun-07
Sep-07
Dec-07
Mar-0
8
Jun-08
Sep-08
Dec-08
Mar-0
9
Jun-09
Sep-09
Dec-09
Mar-1
0
Jun-10
Sep-1060%
65%
70%
75%
80%
85%
90%
95%
100%
105%
110%
Payroll Withholding
Employment
Wages
Source: Quarterly Census of Employment and Wages, 6-month moving average. Payroll withholding receipts from the Montana Department of Revenue.
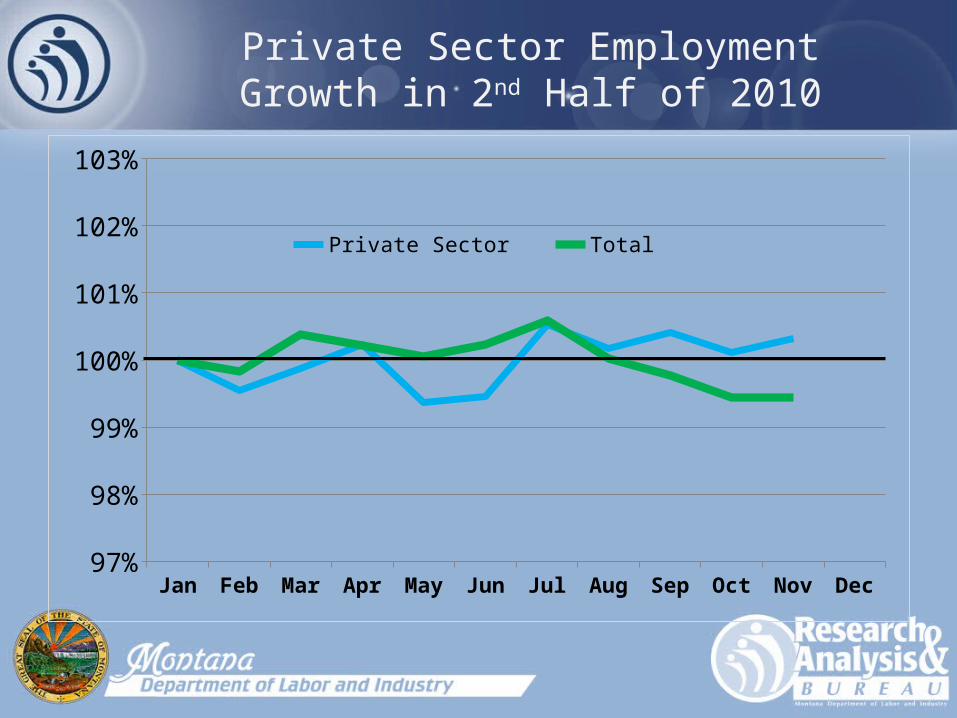
Private Sector Employment Growth in 2nd Half of 2010
Jan Feb Mar Apr May Jun Jul Aug Sep Oct Nov Dec97%
98%
99%
100%
101%
102%
103%
Private Sector Total

Take Away Points- Recovery Expectations
• Recovery has occurred in – Personal income – Wages– Slow private job growth
• Government job losses has increased unemployment rates throughout 2010
• Post-recession economy will be higher-skill jobs– Health Care, High-tech Manufacturing, Professional Services are
growing– Construction and Wood Products Manufacturing are not expected to
return to pre-recession levels for some time.

Today’s Topics
1. Montana’s economy in recession– How unemployed people differ from
unemployment claims
2. Montana’s economy in recovery
3. Future challenge: efficient job matching

Future Challenge: Structural Unemployment
Source: Bureau of Labor Statistics, JOLTS job openings and CES nonfarm payroll employment.
2,000
2,500
3,000
3,500
4,000
4,500
5,000
5,500
124,000
126,000
128,000
130,000
132,000
134,000
136,000
138,000
140,000U.S. Employment and Job Openings
Job Openings
Employment

Occupations with the Largest Losses Statewide
Occupation Estimated Recession
Losses
Projected Statewide Job
Growth, 2011
Years to Rehire
Carpenters -2,010 108 18.6
Retail Salespersons -1,400 250 5.6
Construction Laborers -1,070 75 14.4
Cashiers -850 126 6.8Bookkeeping, Accounting, and Auditing Clerks -700 182 3.8Truck Drivers, Heavy and Tractor-Trailer -620 113 5.5
Electricians -515 37 14.0Operating Engineers and Other Construction Equipment Operators -450 37 12.2Plumbers, Pipefitters, and Steamfitters -445 22 20
General and Operations Managers -435 31 14.3

Ten Growing Occupations with Unmet Demand for Workers
Occupation
Projected Annual Growth
Registered Nurses 98
Accountants and Auditors 72
Landscaping and Groundskeeping Workers 72
Sales Representatives, Wholesale and Manufacturing 70
Office Clerks, General 66
Cooks, Restaurant 63
Maintenance and Repair Workers, General 61
Nursing Aides, Orderlies, and Attendants 53
Personal and Home Care Aides 52
Lawyers 47

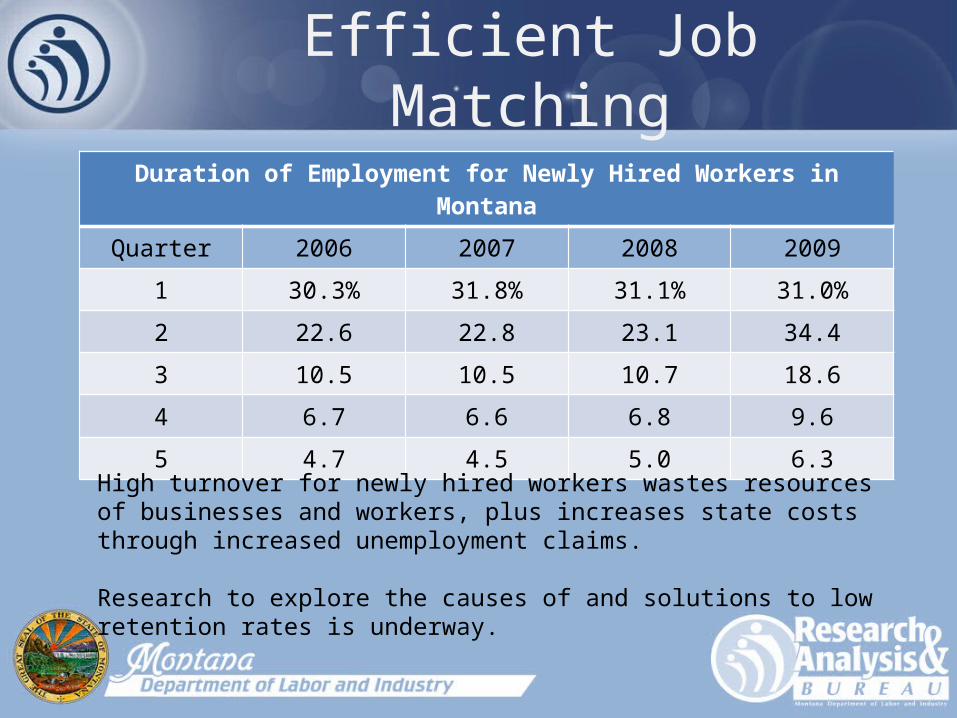
Efficient Job MatchingDuration of Employment for Newly Hired Workers in Montana
Quarter 2006 2007 2008 2009
1 30.3% 31.8% 31.1% 31.0%
2 22.6 22.8 23.1 34.4
3 10.5 10.5 10.7 18.6
4 6.7 6.6 6.8 9.6
5 4.7 4.5 5.0 6.3
High turnover for newly hired workers wastes resources of businesses and workers, plus increases state costs through increased unemployment claims.
Research to explore the causes of and solutions to low retention rates is underway.

QUESTIONS?
PRESENTATION, MONTHLY UPDATES, DATA, AND OTHER ECONOMIC RESEARCH AT
http://www.ourfactsyourfuture.org/