the mos memory market - smithsonian institution
TRANSCRIPT

OVERVIEW
Memory 1997 provides detailed coverage of the recents trends associated with DRAM, SRAM,EPROM, and flash memory IC devices. Market direction and technology inclinations for eachproduct segment are covered in separate sections. Details of the ROM and EEPROM markets arereferenced in this section.
The memory market is often looked upon to introduce new and innovative devices. Demandsfrom customers for more sophisticated and technically advanced systems necessitate that new ICproducts enter the market. When new products are introduced to the marketplace, existing ICcomponents are pushed further along the product lifecycle. Figure 1-1 provides ICE’s view ofwhere several memory ICs will be located in the 1997 product lifecycle.
INTEGRATED CIRCUIT ENGINEERING CORPORATION 1-1
1 THE MOS MEMORY MARKET
PRODUCT GROWTHINTRODUCTION MATURITY SATURATION DECLINE (OBSOLETE)
64K DRAM
RAMs HIGH SPEED CMOS/BiCMOS
SA
LE
S
32K EPROM
16K EPROMROMs
8M Flash32M Flash4M Flash 256K Flash
512K Flash
1M DRAM256K DRAM
256K SRAM 64K SRAM
16K SRAM
4K ECL SRAM
16K ECL SRAM
4M DRAM
1M SRAM
64K SRAM 16K SRAM1M SRAM
64K ECL SRAM
256K SRAM
1M ROM256K ROM
64K ROM4M ROM
64K PROM 32K PROM 16K PROM
1M EPROM 256K EPROM 64K EPROM
64K EEPROM256K EEPROM 16K EEPROM
128K PROM
128K EPROM512K EPROM
4K EEPROM32K EEPROM
16M ROM
4M EPROM
8M ROM
16M DRAM
4M SRAM
1M EEPROM
32M ROM
64M ROM
16M EPROM
4M EEPROM
64M DRAM
20175BSource: ICE, "Memory 1997"
1M Flash2M Flash
16M Flash64M Flash
Figure 1-1. Memory Product Lifecycle (1997)
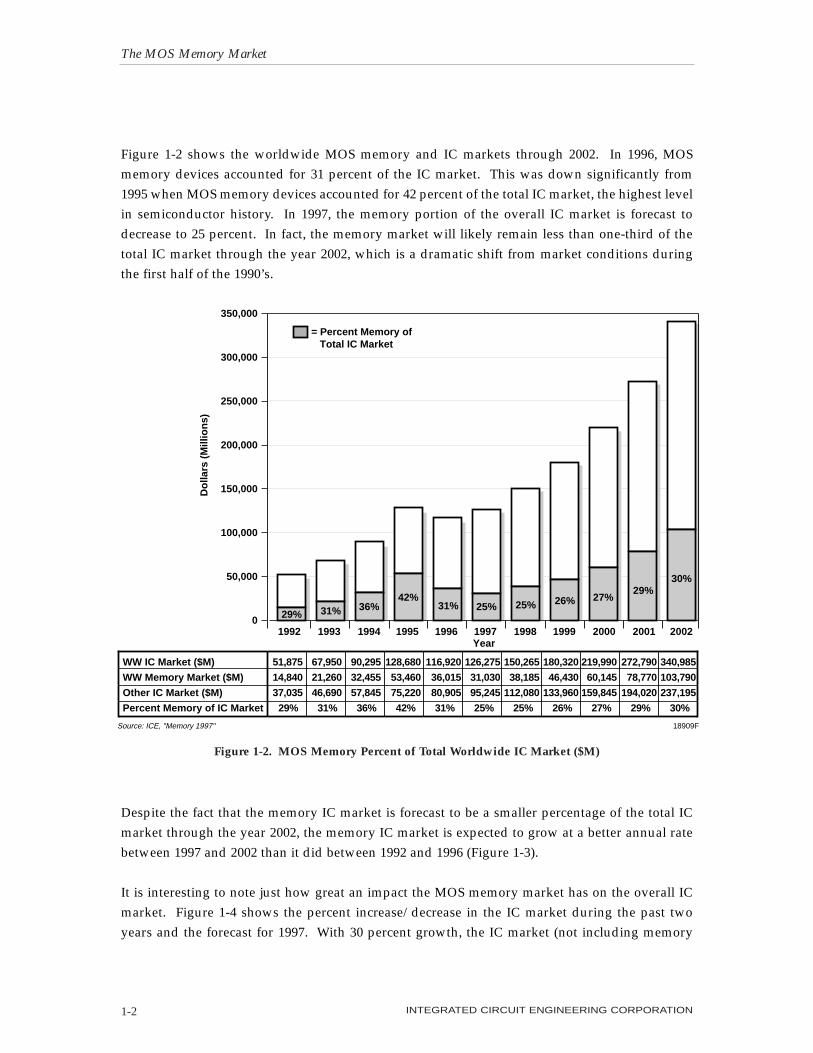
Figure 1-2 shows the worldwide MOS memory and IC markets through 2002. In 1996, MOSmemory devices accounted for 31 percent of the IC market. This was down significantly from1995 when MOS memory devices accounted for 42 percent of the total IC market, the highest levelin semiconductor history. In 1997, the memory portion of the overall IC market is forecast todecrease to 25 percent. In fact, the memory market will likely remain less than one-third of thetotal IC market through the year 2002, which is a dramatic shift from market conditions duringthe first half of the 1990’s.
Despite the fact that the memory IC market is forecast to be a smaller percentage of the total ICmarket through the year 2002, the memory IC market is expected to grow at a better annual ratebetween 1997 and 2002 than it did between 1992 and 1996 (Figure 1-3).
It is interesting to note just how great an impact the MOS memory market has on the overall ICmarket. Figure 1-4 shows the percent increase/decrease in the IC market during the past twoyears and the forecast for 1997. With 30 percent growth, the IC market (not including memory
The MOS Memory Market
INTEGRATED CIRCUIT ENGINEERING CORPORATION1-2
18909F
Do
llars
(M
illio
ns)
0
50,000
100,000
150,000
200,000
250,000
300,000
350,000
20022001200019991998199719961995199419931992
29% 31% 36%42%
31% 25% 25% 26% 27%29%
30%
= Percent Memory of Total IC Market
Year
Source: ICE, "Memory 1997"
WW IC Market ($M)
WW Memory Market ($M)
Other IC Market ($M)
Percent Memory of IC Market
51,875
14,840
37,035
67,950
21,260
46,690
90,295
32,455
57,845
128,680
53,460
75,220
116,920
36,015
80,905
126,275
31,030
95,245
150,265
38,185
112,080
180,320
46,430
133,960
219,990
60,145
159,845
272,790
78,770
194,020
340,985
103,790
237,195
29% 31% 36% 42% 31% 25% 25% 26% 27% 29% 30%
Figure 1-2. MOS Memory Percent of Total Worldwide IC Market ($M)

ICs) was extremely good in 1995 ($75.2 billion). However, when the MOS memory segment wasfactored in, the overall growth of the IC market increased 13 additional percentage points to 43percent, or $128.7 billion!
A similar impact was felt in 1996 when the total IC market was $116.9 billion. This represented adecrease of nine percent from the previous year. However, if the memory segment of this figureis excluded, the IC market actually witnessed eight percent growth in 1996.
Figure 1-5 provides a complete review of the MOS memory and IC markets for the years 1992-2002. Following three straight years of better than 40 percent growth (1993, 43%; 1994, 53%; 1995,65%), the 1996 MOS memory market experienced the “correction year” that was anticipated forsome time.
As will be discussed later, a great amount of new wafer fab capacity led to greatly reduced aver-age selling prices for memory products. This, in turn, led to the -33 percent reduction in the sizeof the 1996 MOS memory market. Excess wafer fab capacity is forecast to remain through 1997,which will likely keep the memory market surpressed.
The MOS Memory Market
INTEGRATED CIRCUIT ENGINEERING CORPORATION 1-3
Do
llars
(M
illio
ns)
18903F
Year
Source: ICE, "Memory 1997"
MOS Memory Market ($M)
Percent Change
103,790
32
14,840
21
21,260
43
32,455
53
53,460
65
36,015
–33
31,030
–14
38,185
23
46,430
22
60,145
30
78,770
31
1992-1996 CAGR = 25%1997-2002 CAGR = 27%
0
20,000
40,000
60,000
80,000
100,000
120,000
20022001200019991998199719961995199419931992–40
–30
–20
–10
0
10
20
30
40
50
60
70
Per
cen
t C
han
ge
Worldwide MOS Memory Market ($M)Percent Change
Figure 1-3. 1992-2002 MOS Memory Market CAGR

The MOS Memory Market
INTEGRATED CIRCUIT ENGINEERING CORPORATION1-4
–10
0
10
20
30
40
50
1996/19951997/1996
(FCST)1995/1994
Per
cen
t C
han
ge
Source: ICE, "Memory 1997" 22424
128,680
75,220
IC Market ($M)(Including Memory)
IC Market ($M)(Excluding Memory)
116,920
80,905
126,275
95,245
IC Market Growth (Including Memory)
IC Market Growth (Excluding Memory)
Year 1995 1996 1997
Figure 1-4. Effects of Memory Market on Total IC Market
WW IC Market ($M)
WW MOS Memory Market ($M)
WW Memory Percent Change
Percent Memory of Total IC
DRAM ($M)
SRAM ($M)
EPROM ($M)
Flash ($M)
ROM ($M)
EEPROM ($M)
Other Memory ($M)
Total MOS Memory ($M)
128,680
53,460
65%
42%
40,835
6,075
1,385
1,860
1,965
885
455
53,460
116,920
36,015
–33%
31%
25,130
4,745
1,105
2,610
1,340
920
165
36,015
1995 1996
126,275
31,030
–14%
25%
21,485
3,500
815
3,000
1,100
975
155
31,030
1997
51,875
14,840
21%
29%
8,525
2,890
1,250
270
1,225
480
200
14,840
67,950
21,260
43%
31%
13,140
3,295
1,350
740
1,625
700
410
21,260
1992 1993
90,295
32,455
53%
36%
23,420
3,755
1,390
865
1,890
720
415
32,455
1994
150,265
38,185
23%
25%
27,750
3,955
695
3,585
970
1,090
140
38,185
180,320
46,430
22%
26%
34,605
4,510
580
4,530
870
1,210
125
46,430
272,790
78,770
31%
29%
61,890
6,015
420
8,175
680
1,490
100
78,770
1998 1999 2000
219,990
60,145
30%
27%
46,080
5,275
500
6,050
775
1,355
110
60,145
2001
340,985
103,790
32%
30%
82,870
6,915
375
11,280
610
1,650
90
103,790
2002
18914HSource: ICE, "Memory 1997"
Figure 1-5. MOS Memory Market Forecast

Despite a one or two-year period of“slower” market growth, ICE showsin Figure 1-6 that the 10-year aver-age annual growth rate of the MOSmemory market looks bright. OnlyROMs, EPROMs, and the “othermemory” (i.e., FIFOs, etc.) cate-gories are shown experiencingdeclining markets through the year2002.
In terms of dollar volume, DRAMsmake up the majority of MOSmemory sales and are forecast to bethe dominant memory product through the year 2002 (Figure 1-7). In fact, ICE forecasts that inthe year 2002, 80 percent of the MOS memory market will be attributed to DRAM sales as shownin Figure 1-8.
The MOS Memory Market
INTEGRATED CIRCUIT ENGINEERING CORPORATION 1-5
DRAM
SRAM
EPROM
FLASH
ROM
EEPROM
Other Memory
Total Memory
26%
9%
–11%
45%
–7%
13%
–8%
21%
22425Source: ICE, "Memory 1997"
Figure 1-6. Ten Year Average Annual Growth Rates (1992-2002)
0
20,000
40,000
60,000
80,000
100,000
120,000
20022001200019991998199719961995199419931992Year
Do
llars
(M
illio
ns)
18902ESource: ICE, "Memory 1997"
DRAM ($M)
SRAM ($M)
EPROM ($M)
Flash ($M)
8,525
2,890
1,250
270
13,140
3,295
1,350
740
23,420
3,755
1,390
865
40,835
6,075
1,385
1,860
25,130
4,745
1,105
2,610
21,485
3,500
815
3,000
27,750
3,955
695
3,585
34,605
4,510
580
4,530
46,080
5,275
500
6,050
61,890
6,015
420
8,175
82,870
6,915
375
11,280
Figure 1-7. Dollar Volume of MOS Memory Product Segments

Flash memory sales accounted for three percent of the MOS memory market in 1995 and sevenpercent in 1996. Beginning in 1997 and lasting through at least the year 2002, the flash memorymarket is forecast to represent a double-digit percentage of the total MOS memory market.Meanwhile, as a percent of the total memory market, the SRAM, ROM, EPROM, and EEPROMmarkets will remain flat or decline over the next five years.
MOS memory unit shipments are also dominated by DRAMs as displayed in Figure 1-9. Notehow DRAM unit shipments continued upward even though this particular market tumbledalmost 40 percent in 1996.
Although DRAM unit demand remained strong, not all categories experienced an uptick in ship-ments in 1996. SRAMs, EPROMs, and ROMs each suffered through a decline in shipments in1996. All three categories are forecast to experience additional shipment declines in 1997. Figure1-10 provides an overview of the complete unit shipment forecast for MOS memory devices.Additional unit shipment detail is found in each product section.
The MOS Memory Market
INTEGRATED CIRCUIT ENGINEERING CORPORATION1-6
DRAMSRAM
ROMEPROM
EEPROMFLASHOTHERTOTAL:
–––––––
70%13%
4%3%3%7%
<1%$36.0B
DRAMSRAM
ROMEPROM
EEPROMFLASHOTHERTOTAL:
–––––––
69%11%
4%3%3%
10%<1%
$31.0 B
DRAMSRAM
ROMEPROM
EEPROMFLASHOTHERTOTAL:
–––––––
75%10%
2%1%2%
10%<1%
$46.4B
DRAMSRAM
ROMEPROM
EEPROMFLASHOTHERTOTAL:
–––––––
73%10%
2%2%3%
10%<1%
$38.2B
1999
1998
17213L
1997
1996
DRAMSRAM
ROMEPROM
EEPROMFLASHOTHERTOTAL:
–––––––
77%9%1%1%2%
10%<1%
$60.1B
2000
DRAMSRAM
ROMEPROM
EEPROMFLASHOTHERTOTAL:
–––––––
79%8%1%
<1%2%
10%<1%
$78.8B
2001 DRAMSRAM
ROMEPROM
EEPROMFLASHOTHERTOTAL:
–––––––
80%7%1%
<1%1%
11%<1%
$103.8B
2002
Source: ICE, "Memory 1997"
Figure 1-8. MOS Memory Product Marketshare

A brief review of regional MOS memory consumption is shown in Figure 1-11. Driven by sales ofnew computers and upgrades to existing computer systems, the North America region led theworld in the consumption of memory ICs in 1995 and in 1996. Furthermore, it is forecast to remainthe leading consuming region in 1997.
The ROW region (Korea, Taiwan, et al), increased its share of memory IC consumption during thepast few years. For many years, the ROW was primarily a consumer of memory ICs that wereinstalled in various electronic systems then shipped abroad. More recently, however, the ROW’sconsumption of memory ICs has been to meet the growing domestic demand created by a matur-ing market-driven economy. Strong local economies in this region (along with greater disposableincome) will only lead to further consumption of MOS memory devices in the ROW region in thecoming years.
The MOS Memory Market
INTEGRATED CIRCUIT ENGINEERING CORPORATION 1-7
0
1,000
2,000
3,000
4,000
5,000
6,000
7,000
������������������������������������������������������������������������������������������������������������������������������������������������������������������������
���������������������������������������������������������������������������������������������������������������������������������������������������������������������������������������������������������������������������������������������������������������������������������������������������������������������������������������������������������������������������������������������������������������������������������������������������������������������������������������������������������������������������������������������������������������������������������������������������������������������������������������������������������������������������������������������������������������������������������������������������������������������������������������������������������������������������������������������������������������������������������������������������������������������������������������������������������������������������������������������������������������������������������������������������������������������������������������������������������������������������������������������������������������������������������������������������������������������������������������������������������
���������������������������������������������������������������������������������������������������������������������������������������������������������������������������������������������������������������������������������������������������������������������������������������������������������������������������������������������������������������������������������������������������������������������������������������������������������������������������������������������������������������������������������������������������������������������������������������������������������������������������������������������������������������������������
199719961995199419931992
���������
��������
Year
Un
its
(Mill
ion
s)
22426Source: ICE, "Memory 1997"
DRAM (M)
SRAM (M)
EPROM (M)
Flash (M)
ROM (M)
EEPROM (M)
Other Memory
Total Memory Units (M)
1,482
888
443
26
363
329
175
3,706
1,499
901
425
73
411
500
251
4,060
1,920
770
433
112
418
700
585
4,938
2,477
1,095
498
235
421
766
600
6,092
2,762
964
370
359
345
1,106
300
6,206
3,064
880
330
554
305
1,300
310
6,743
Figure 1-9. MOS Memory Unit Shipments by Product

The MOS Memory Market
INTEGRATED CIRCUIT ENGINEERING CORPORATION1-8
0
1,000
2,000
3,000
4,000
5,000
6,000
7,000
8,000
1997199619951994199319920
5
10
15
20
25
Un
its
(Mill
ion
s)
Per
cen
t C
han
ge
Source: ICE, "Memory 1997" 22427
3,706
17
Total Memory Units (M)
Percent Change
4,060
10
4,938
22
6,092
23
6,206
2
6,743
9
Total Memory Units (M)
Percent Change
Figure 1-10. Total MOS Memory Unit Shipments
North America37%
Japan23%
Europe18%
ROW22%
18912J
North America38%
Japan19%
Europe18%
ROW25%
1995$53.5B
1997 (FCST)$31.0B
North America38%
Japan20%
Europe19%
ROW23%
1996$36.0B
Source: ICE, "Memory 1997"
Figure 1-11. MOS Memory Consumption by Region

Figure 1-12 leaves no doubt that the Japanese companies remain the largest producer of MOSmemory devices, although the ROW region remains a keen competitor. With numerous huge, newDRAM fabs slated to come on line in 1997 and 1998, Korea, Taiwan, and other countries in theROW region will likely make further in-roads into Japan’s dominance of memory IC production.
Regional production for each MOS memory segment is shown for 1996 in Figure 1-13. In 1996,Japanese firms supplied the biggest portion of DRAMs, SRAMs (the two largest memory mar-kets), and ROMs. However, as shown in Figure 1-14, ROW firms continued to gain additionalmarketshare in each of the product segments (DRAM and SRAM) where Japan dominated.
North American companies maintained their recent 10-15 percent marketshare in the DRAM seg-ment, while dominating the EPROM, EEPROM, and fast-growing flash memory markets. SGS-Thomson, the world’s leading EPROM manufacturer, was the source of Europe’s strong showingin the EPROM market and was also a contributor to the flash memory market.
Listed in Figure 1-15 are marketshare figures for the top five worldwide MOS memory suppliersin 1995 and 1996. Together, the five firms accounted for approximately half of all MOS memorysales during the past two years.
The MOS Memory Market
INTEGRATED CIRCUIT ENGINEERING CORPORATION 1-9
20173E
North AmericanCompanies
22%
North AmericanCompanies
21%
EuropeanCompanies
5%
EuropeanCompanies
4%
JapaneseCompanies
46%
JapaneseCompanies
45%
ROWCompanies
29%
ROWCompanies
28%
1996$36.0B
1995$53.5B
Source: ICE, "Memory 1997"
North AmericanCompanies
21%
EuropeanCompanies
5%
JapaneseCompanies
44%ROWCompanies
30%
1997 (FCST)$31.0B
Figure 1-12. MOS Memory Production

Samsung continued to set the pace as the leading supplier of MOS memory devices in 1996. Infact, it increased its marketshare in 1996. NEC, Toshiba, and Hitachi, three leading Japanese ICsuppliers, maintained their leading positions. New to the top memory IC supplier list in 1996 wasKorea’s Hyundai. Its 1996 memory sales were solely from DRAM devices.
The MOS Memory Market
INTEGRATED CIRCUIT ENGINEERING CORPORATION1-10
0
20
40
60
80
100
������������������������������������������������������������
����������������������������������������
������������������������������������
����������������
���� ����
4%
12%
35%
22%
3%
47%
28%
49%
2% 1%
78%
8%
58%52%
19%
33%
7%
38%
1%3%
EEPROM$785M
ROM$1,340M
SRAM$4,745M
EPROM$1,105M
DRAM$25,130M
������������������������
North AmericanCompanies
EuropeanCompanies
JapaneseCompanies
ROWCompanies
14516R
Per
cen
tag
e
87%
3%
9%
1%
Flash$2,610M
Source: ICE, "Memory 1997"
Figure 1-13. 1996 MOS Memory Production by Product Segment ($M)
0
20
40
60
80
100
1996199519941993
62%
25%
54%
28%
49%
33% 35%
49%
Per
cen
t
DRAM
0
20
40
60
80
100
1996199519941993
67%62%
6%10%
20% 22%
47%47%
Per
cen
t
SRAM
JAPAN
ROW =
=
Source: ICE, "Memory 1997" 21185B
Figure 1-14. ROW (Korea) Muscles Production from Japan

In Figure 1-16, ICE shows the memory IC usage by system type. Over the course of five years,end-use applications for memory devices changed very little while the market tripled in size.
THE ROM MARKET
Read-only memories (ROMs) represent the least expensive type of semiconductor memory. Theyare used primarily for storing data in electronic equipment such as laser printer fonts, dictionarydata in word processors, and sound-source data in electronic musical instruments. ROMs arealso used extensively in video game software. The ROM market grew well through the first halfof the 1990’s, coinciding closely with a jump in PC sales and other consumer-oriented electronicsystems (Figure 1-17).
The MOS Memory Market
INTEGRATED CIRCUIT ENGINEERING CORPORATION 1-11
Rank
1
2
3
4
5
Other
Total
Samsung
NEC
Hitachi
Toshiba
Hyundai
5,428
4,180
3,360
2,885
2,300
17,862
36,015
15
12
9
8
6
49
100
1996
Company Sales($M)
Marketshare(%)
—
—
Samsung
NEC
Hitachi
Toshiba
TI
7,545
5,630
5,028
4,535
3,555
27,172
53,465
14
11
9
8
7
50
100
1995
Company Sales($M)
Marketshare(%)
—
—
14495RSource: ICE, "Memory 1997"
Figure 1-15. Total MOS Memory Market Leaders
1991$12.3B
1996$36.0B
Computer68%
Communications10%
Consumer10%
Industrial8% Auto 2% Auto 2%
Military 1% Military 1%Industrial7%
Communications8%
Consumer13%
Computer70%
Source: WSTS/ICE, "Memory 1997" 21759A
Figure 1-16. Memory IC Usage by System Type

However, as shown in Figure 1-18, the ROM market declined significantly (-32 percent) in 1996.Among the reasons for the 32 percent decline in 1996 were the weak Japanese yen measuredagainst the dollar (109 yen to the dollar in 1996 versus 94 yen to the dollar in 1995). Since the ROMmarket is largely dominated by Japanese manufacturers and end users, it is closely tied to fluctu-ations in the yen.
Another factor contributing to the ROM market decline is the fact that one of the biggest end usersof these devices—video games—is moving toward CD-ROM-based machines. Additionally, othermemory products that afford greater functionality have become relatively cost competitive withROMs. As shown, ICE believes that the ROM market will continue to decline through the year2002.
Following several years of unit growth, ROM shipments also declined sharply (-18 percent) in1996 as shown in Figure 1-19. ICE anticipates this downward trend of ROM unit shipments tocontinue during the next five years as well.
The MOS Memory Market
INTEGRATED CIRCUIT ENGINEERING CORPORATION1-12
0
200
400
600
800
1,000
1,200
1,400
1,600
1,800
2,000
1996199519941993199219910.00
0.50
1.00
1.50
2.00
2.50
3.00
3.50
4.00
4.50
5.00
Mill
ion
s o
f D
olla
rs a
nd
Un
its
AS
P (
$)
Source: WSTS/ICE, "Memory 1997" 20607B
1,025
330
3.11
Market ($M)
Units (M)
ASP ($)
1,225
363
3.37
1,625
411
3.96
1,890
418
4.53
1,965
421
4.67
1,340
345
3.88
Market
Units
ASP
Figure 1-17. ROM Market History

The MOS Memory Market
INTEGRATED CIRCUIT ENGINEERING CORPORATION 1-13
Do
llars
(M
illio
ns)
Year
20348FSource: WSTS/ICE, "Memory 1997"
0
500
1,000
1,500
2,000
20022001200019991998199719961995199419931992
ROM Market ($M)
Percent Change
1,225
20
1,625
33
1,890
16
1,965
4
1,340
–32
1,100
–18
970
–12
870
–10
775
–11
610
–10
680
–12
–35
–30
–25
–20
–15
–10
–5
0
5
10
15
20
25
30
35
Per
cen
t C
han
ge
Figure 1-18. The ROM Market
Un
its
(Mill
ion
s)
Year
20608ASource: WSTS/ICE, "Memory 1997"
Total Units (M)
Percent Change
330
–8
363
10
411
13
418
2
421
1
305
–12
345
–18
0
50
100
150
200
250
300
350
400
450
1997199619951994199319921991
–20
–15
–10
-5
0
5
10
15
Per
cen
t C
han
ge
Figure 1-19. ROM Unit Shipments

Of the ROM units that continue to ship, more and more are high-density devices. Figure 1-20shows the trend toward high-density ROM devices. Most manufacturers kept their ROM pro-duction at the 4Mbit level. However, companies such as Sharp, NEC, and Macronix developedmask ROMs at and above the 32Mbit density.
Through the first half of the decade, the average selling price (ASP) for ROM devices increasedmostly due to the transition to higher density devices (Figure 1-21). Although the ROM ASPdeclined in 1996, a smaller ROM market moving toward higher densities may force ASPs to trendupward in the second half of the decade.
ROM consumption by geographic region is shown in Figure 1-22. Despite marketshare gainsmade by vendors in the ROW region, Japanese IC makers continued to hold a tight grip as theleading suppliers of ROM ICs (Figure 1-23). Together, Sharp and NEC held about half of the ROMmarket in 1995 and 1996. A few notes of activity from selected ROM suppliers are shown below.
The MOS Memory Market
INTEGRATED CIRCUIT ENGINEERING CORPORATION1-14
���������
������
0
50
100
150
200
250
300
350
400
450
�������������������������������������������������������������������������������������������������������������������������������������������������������������������������������������������������������������������������������������������������������������������������������������������������������������������������������������������������������������������������������������������������������������������������������������������������������������������������������������������������������������������������������������������������������������������������������������������������������������������������������������������������������������������������������������������
������������������������������������������������������������������������������������������������������������������������������������������������������������������������������������������������������������������������������������������������������������������������������������������������������������������������������������������������������������������������������������������������������������������������������������������������������������������������������������������������������������������������������������������������������������������������������������������������������������������������������������������������������������������������������������������������������������������������������������������������������������������������������������������������������������������������������������������������������������������������������������������������������������������������������������������������������������������������������������������������������������
199619951994199319921991
Un
its
(Mill
ion
s)
Source: WSTS/ICE, "Memory 1997" 20609A
200
130*
—
—
330
* Includes ≥4M densities.
≤2M
4M
8M
≥8M
159
204*
—
—
363
114
297*
—
—
411
100
130
73
115
418
86
124
83
128
421
61
91
84
109
345
Year
Total Units (M)
Figure 1-20. ROM Unit Shipments by Density

Sharp
Sharp remained the leading ROM supplier in 1996 and continued to bolster its portfolio of 3V,high-denisty ROMs. Additionally, it concluded that there was demand for 64Mbit ROM devicesand began mass producing these in 3Q96 using its 0.4µm process technology.
The MOS Memory Market
INTEGRATED CIRCUIT ENGINEERING CORPORATION 1-15
AS
P (
$)
Year
20610ASource: WSTS/ICE, "Memory 1997"
Total ASP ($)
Percent Change
3.11
12
3.37
8
3.96
18
4.53
14
4.67
3
3.88
–17
3.61
–7
0.00
0.50
1.00
1.50
2.00
2.50
3.00
3.50
4.00
4.50
5.00
1997199619951994199319921991–20
–15
–10
–5
0
5
10
15
20
Per
cen
t C
han
ge
Figure 1-21. ROM ASPs
16790M
Japan61%
Europe3%
ROW19%
NorthAmerica
17%
Japan57%
Europe3%
ROW22%
NorthAmerica
18%
1995$1,965M
1996$1,340M
Source: WSTS/ICE, "Memory 1997"
Figure 1-22. ROM Market by Region

Sharp targeted the 32-bit embedded applications market when it introduced two ROMs (1Mbit x32 and 2Mbit x 16) in late 1996. Designed especially for 32-bit embedded systems, Sharp expectsits new 3V devices to be a popular choice in applications such as font storage in laser and ink-jetprinters where cost is critical and performance demands are high. Sharp believes its new deviceswill help reduce overall parts count, eliminate some system overhead, and improve overall systemperformance.
NEC
In 4Q96, NEC began taking orders for high-speed 32Mbit mask ROMs that operate at 3V.Targeting office and game machine program and fixed-data storage applications, the devices wereinitially priced at $27.50. Initial shipments were to begin at the rate of 350,000 units per month.
Macronix
Based on its proprietary Flat ROM cell technology, Macronix developed and now offers a ROMfamily ranging from 4Mbits to 16Mbits. The devices are manufactured using a 0.8µm processtechnology. The company is eager to move to the 32Mbit density for its ROM products. At thislevel, the devices will be manufactured using 0.6µm design rules.
American Microsystems Inc. (AMI)
Although not a leading ROM supplier, AMI unveiled two high-speed (45ns and 70ns) 1Mbitdevices targeted for disk drive applications. Initial versions operated at 5V, but the companyplans to introduce parts based on 3.3V technology in 1997.
The MOS Memory Market
INTEGRATED CIRCUIT ENGINEERING CORPORATION1-16
14496T
RankCompany Sales
($M)Marketshare
(%)
1
2
3
4
5
Other
Total
Sharp
NEC
Macronix
Toshiba
Hitachi
375
280
204
170
160
151
1,340
28
21
15
13
12
11
100
Sharp
NEC
Samsung
Toshiba
Hitachi
500
400
230
255
245
335
1,965
25
20
12
13
13
17
100
19961995
Company Sales($M)
Marketshare(%)
—
—
—
—
Source: ICE, "Memory 1997"
Figure 1-23. ROM Market Leaders

Siemens
An interesting ROM development targeting the multimedia market is the Record-On-Silicon(ROS) device from Siemens. With a 50-percent reduction in die area compared with conventionalROM, the company claims the ROS could halve the cost of conventional ROM and push into mar-kets for non-semiconductor storage, such as compact disks and photographic film. A 64Mbit ver-sion of the device is planned for introduction in 1997.
Fujitsu
In recent years, a few ROM suppliers announced intentions to withdraw from the mask ROMbusiness. Fujitsu, for example, cancelled development efforts of its 32Mbit and other next-gener-ation ROM devices and stopped producing and shipping its line of 16Mbit-and-smaller productsin 1996.
THE EEPROM MARKET
EEPROMs (electrically erasable programmable read only memories) offer users excellent capabil-ities and performance. Two key advantages of using EEPROMs include in-system reprogramma-bility and small, bit by bit erasure capability.
The EEPROM market forecast through the year 2002 is shown in Figure 1-24. In 1996, theEEPROM market was up four percent after posting two years of 20-plus percent growth. ICE fore-casts that through the year 2002, the EEPROM market will average 11 percent growth per year.
EEPROM consumption by region is shown in Figure 1-25. Due in part to military use, NorthAmerica was the largest regional market for EEPROMs in 1996.
EEPROMs are available in either a serial or parallel version. Parallel devices are generallyfaster, offer high endurance and reliability, but also cost more than their serial counterparts.Parallel EEPROMs are found mostly in the military market. Serial EEPROMs, though gener-ally less dense and slower than parallel devices, are much cheaper and used in more of the“commodity” applications.
ICE estimates that serial EEPROMs accounted for 92 percent of the $885 million EEPROM marketin 1996 (Figure 1-26). With few exceptions, the largest serial EEPROM density shipping in volumewas the 64Kbit device. Companies such as Atmel, Xicor, and SGS-Thomson supplied the largemajority of these devices.
The MOS Memory Market
INTEGRATED CIRCUIT ENGINEERING CORPORATION 1-17

Until late in 1996, designers who needed more than 64Kbit of EEPROM had to use two or moresmaller serial EEPROMs connected in parallel. However, in 4Q96, SGS-Thomson pushed serialdensities to a new level with the introduction of its 128Kbit and 256Kbit devices.
The MOS Memory Market
INTEGRATED CIRCUIT ENGINEERING CORPORATION1-18
Do
llars
(M
illio
ns)
20347ESource: ICE, "Memory 1997"
EEPROM Market ($M)
Percent Change
480
19
700
43
885
23
920
4
975
6
1,090
12
1,210
11
1,490
10
1,650
11
720
20
1,355
12
Year
Per
cen
t C
han
ge
0
200
400
600
800
1,000
1,200
1,400
1,600
1,800
20022001200019991998199719961995199419931992–10
–5
0
5
10
15
20
25
30
35
40
45
Figure 1-24. EEPROM Market Growth
16792KSource: WSTS/ICE, "Memory 1997"
1996 $920M Europe
37%
ROW8%
North America
40%
Japan15%
Figure 1-25. 1996 EEPROM Market

The largest parallel EEPROMs built in volume during 1996 were 1Mbit devices. They were usedextensively, although not exclusively, in military applications. Parallel EEPROMs are of particularinterest in the military because they offer more flexibility than other kinds of solid-state memory.
Parallel EEPROMs can be found in military applications such as flight controllers, vehicle controlsystems, field communications equipment, secure radios, command and control systems, radar,and guidance subsystems. The lightness, ruggedness, and fast performance of parallel EEPROMsmake them well suited for harsh environments.
Consumer-oriented applications rep-resented the largest end-use of serialEEPROMs in 1996 (Figure 1-27). Ledby low-voltage parts, EEPROM sup-pliers in 1996 found a healthy andvibrant business in rapidly growingportable consumer and industrialapplications.
Small density serial EEPROMs wereused extensively in portable, bat-tery-powered devices includingpagers, modems, and cellular and cordless phones. They have also showed up in parameter andconfiguration setups in disk drives, printers, and industrial data-acquisition applications. In auto-motive applications, EEPROMs are used in air bags, antilock braking systems, and car radios.
Newer EEPROM applications include satellite communication boxes and monitors and sense-detect functions in memory modules. Suppliers are also excited about the potential of EEPROMsin the smart-card market.
The MOS Memory Market
INTEGRATED CIRCUIT ENGINEERING CORPORATION 1-19
1996$920M
Serial EEPROM92% Parallel EEPROM
8%
20413CSource: ICE, "Memory 1997"
Figure 1-26. 1996 EEPROM Market by Type
Consumer36%
Telecom20%
Industrial15%
Office 7%
Automotive8%
Military/Aerospace7%
Computer-Related7%
Units
19520DSource: ICE, "Memory 1997"
Figure 1-27. Serial EEPROM Applications

Most leading manufacturers have begun to offer their devices in low-voltage versions. SGS-Thomson’s Eagle Range serial EEPROM family, for example, supports operation as low as 1.8Vand its next generation will support 1V operation. In 3Q96, Atmel introduced the first 3V 1Mbitparallel EEPROM.
Innovative features have been added to EEPROMs by many manufacturers. In 1996, Xicor intro-duced Block Lock protection on two of its EEPROMs. By allowing a user to partition its devicewith 25, 50, or 100 percent write protection, Block Lock allows the combination of alterable datawith secured data.
Several vendors agree that EEPROM technology is facing increased competition from flashmemory. However, flash memory remains a mass-storage technology and is virtually unavailable(and not as cost effective) in densities under 1Mbit. EEPROMs, on the other hand, are mainly usedfor storing small amounts of data that are frequently changed.
Leading EEPROM suppliers are shown in Figure 1-28. Atmel, SGS-Thomson, and Xicor contin-ued to make strides in the market. For these and other companies that manufacture them, theEEPROM business should remain reasonably healthy and stable through 2002.
SGS-Thomson
To meet a growing need, SGS-Thomson developed its “Super Flash” device, a part that combinesnon-volatile flash technology and full-featured EEPROM functionality. A key benefit of a com-bined EEPROM/flash chip, compared with the common technique of simulating EEPROM inflash memory, is that the host controller can read the flash memory while an EEPROM write cycleis in progress. SGS-Thomson plans to introduce the part in 1997.
The MOS Memory Market
INTEGRATED CIRCUIT ENGINEERING CORPORATION1-20
14498R
RankCompany Sales
($M)Marketshare
(%)
1
2
3
4
5
6
SGS-Thomson
Atmel
Xicor
Microchip
National
Siemens
280
180
115
109
70
66
100
920
30
20
12
12
8
7
11
100
167
154
100
85
64
53
262
885
19
17
11
10
7
6
30
100
1996
Company Sales($M)
Marketshare(%)
SGS-Thomson
Atmel
Xicor
Microchip
National
Siemens
Other
Total
—
—
Source: ICE, "Memory 1997"
1995
Figure 1-28. EEPROM Market Leaders

Atmel
Atmel unveiled its line of in-system programmable (ISP) EEPROM-based serial memories thatprovide an alternative approach to programming 3.3V SRAM-based field programmable gatearrays. The devices are designed to compete against and replace existing one-time-programma-ble (OTP) EPROM solutions that must be physically removed in order to reprogram FPGA con-figuration code. Atmel believes its ISP EEPROM will save time and afford greater flexibility in thepre-production stage of the FPGA product life when code is still evolving.
Xicor
Xicor introduced its family (4Kbit, 8Kbit, and 64Kbit) of serial peripheral interface (SPI) EEPROMsthat features 5MHz speed (Figure 1-29). The chips are targeted for use in mobile wireless systemsand also include the company’s Block Lock and partitioned memory architecture. It is specifiedto operate from a battery power source over the range of 2.5V to 5.5V.
The company also announced that Yamaha (Japan) signed on to manufacture its EEPROMsunder the Xicor brand name and that both companies would cooperate in process technologydevelopment.
The MOS Memory Market
INTEGRATED CIRCUIT ENGINEERING CORPORATION 1-21
Xicor SPI 5MHzSPI 2MHzMicroWire 1MHzI2C 0.1MHzSource: Xicor/ICE, "Memory 1997" 22428
Figure 1-29. Xicor Speeds SPI EEPROMs

Hitachi
Hitachi introduced 64Kbit and 256Kbit EEPROMs that can operate from voltages as low as 2.2V.The low voltage will help designers implement systems that can use unregulated portable powersupplies and will provide a power savings of about 20 percent compared to devices that operateat 2.7V. Samples of the 64Kbit devices were delivered in April 1997 (volume 3Q97), while the256Kbit part was slated for volume production in 2Q97. Pricing in volume quantities was set at$5.00 for the 64Kbit device and $10.00 for the 256Kbit product.
The MOS Memory Market
INTEGRATED CIRCUIT ENGINEERING CORPORATION1-22