the motherhood penalty and female employment in urban india
TRANSCRIPT
Policy Research Working Paper 8004
The Motherhood Penalty and Female Employment in Urban India
Maitreyi Bordia Das Ieva Žumbytė
Social, Urban, Rural and Resilience Global Practice GroupMarch 2017
WPS8004P
ublic
Dis
clos
ure
Aut
horiz
edP
ublic
Dis
clos
ure
Aut
horiz
edP
ublic
Dis
clos
ure
Aut
horiz
edP
ublic
Dis
clos
ure
Aut
horiz
ed
Produced by the Research Support Team
Abstract
The Policy Research Working Paper Series disseminates the findings of work in progress to encourage the exchange of ideas about development issues. An objective of the series is to get the findings out quickly, even if the presentations are less than fully polished. The papers carry the names of the authors and should be cited accordingly. The findings, interpretations, and conclusions expressed in this paper are entirely those of the authors. They do not necessarily represent the views of the International Bank for Reconstruction and Development/World Bank and its affiliated organizations, or those of the Executive Directors of the World Bank or the governments they represent.
Policy Research Working Paper 8004
This paper is a product of the Social, Urban, Rural and Resilience Global Practice Group. It is part of a larger effort by the World Bank to provide open access to its research and make a contribution to development policy discussions around the world. Policy Research Working Papers are also posted on the Web at http://econ.worldbank.org. The authors may be contacted at [email protected].
Since the 1990s, India has seen robust economic growth, rising wages, steady fertility decline, increased urbaniza-tion, and expanded educational attainment for males and females. But unlike other countries that have undergone similar transitions, urban women’s employment has refused to budge, never crossing the 25 percent mark. This paper fills a critical gap in policy research on women’s employ-ment in India. The discussion is situated in the normative construction of motherhood and the gendered nature of caregiving in India. The analysis uses pooled data from six rounds of the National Sample Surveys to examine the effects of having a young child on mothers’ employment in urban India over 1983–2011. The analysis also looks at
household structure, and analyzes the effects of other house-hold members on women’s labor supply. The results show that although the onus of childbearing may have reduced, that of caregiving has increased. Having a young child in the home depresses mothers’ employment, an inverse relationship that has intensified over time. Further, living in a household with older children and women over the age of 50 is positively associated with women’s employ-ment. These results show that the care of young children is an increasingly important issue in women’s employment decisions, in a context where formal childcare is practically nonexistent. These results have significant implications for policy to raise women’s labor force participation in India.

The Motherhood Penalty and Female Employment in Urban India
Maitreyi Bordia Das ([email protected])1 and Ieva Žumbytė ([email protected])
1 Corresponding author

2
1. The Indian Conundrum
Since the 1990s, India has witnessed high economic growth, accompanied by rising real
wages, a steady decline in fertility and higher educational attainment for both males and females.
But a strange conundrum has simultaneously unfolded. It has to do with women’s employment. In
most other countries, overall prosperity, the freeing of women from the onus of childbearing and
their increased educational qualifications have gone hand in hand with their increased entry into
the labor market. However, in India female labor participation rates have stayed below 35 percent
for more than two decades, whereas the developing country average has been stable at around 50
percent (World Bank 2015a). In fact, women’s employment in India is among the lowest in the
world, and lower than in most countries of the same income level (Verick 2014). During the past
few decades, other countries in South Asia have experienced rising or flattened rates of female
employment, but in India the overall women’s labor force participation has declined since 2004.
For urban women in the 25-55 year age range, employment rates rose slightly from 22.7
percent in 1993 to 24.6 percent in 2004 but afterwards declined gradually to 22.2 percent in 2011.
In contrast, nearly all men in this age group (97 percent) are working in India and this proportion
has fluctuated only marginally (see Table 1). The aggregate decline in female labor force
participation has been driven primarily by the withdrawal of rural women from the labor market,
without commensurate increase in urban areas. Essentially, India has one of the lowest labor force
participation rates (LFPR) for urban women – one that has stayed consistently below 25 percent,
and in some states below 15 percent. This contrasts with our expectations that women in cities and
towns would be more likely to engage in market work, since urban areas are hubs for jobs..
Table 1. Labor Force Participation Rates (percent) for Women and Men Aged 25–55 Urban Areas, 1983–2011
1983 1993 2004 2007 2009 2011
Women 22.7 22.7 24.6 20.6 21.2 22.2
Men 97.3 97.1 96.9 97.0 97.0 97.2 Note: Data is presented for women aged 25-55 to exclude those who may be in education. This includes all women in the age range – not just wives of household heads. Source: India National Sample Survey data based usual principal status.
If we look at Indian women’s employment patterns in the context of broader demographic
change and drawing upon the experience of other countries, we find that the classic facilitators of
employment are in place. India’s total fertility rate (TFR) saw a 20 percent fall from 3.0 in 2001-

3
03 to 2.4 in 2011-13, based on the sample registration system (SRS). In urban areas, the TFR was
below replacement at 1.9 in 2011-13 (Registrar General of India, 2014). As a result, the number
of children per household has fallen dramatically. The size of the average urban household in the
National Sample Survey (NSS) during the period 2004-2011 declined from 4.3 to 4, and only a
little over 26 percent of households had at least one child of pre-school age (under 6 years old) in
2011. Educational attainment has also increased across the board, despite rising concerns about
the quality of education.
The Indian conundrum of low female labor force participation despite the existence of what
are considered enabling factors, has garnered considerable attention among scholars and policy
makers. Several studies and reportage have sought to explain these peculiar patterns. Some
discussion focuses on the possible under-measurement of women’s work (Kapsos et al. 2014;
IAMR and ILO 2013; Sudarshan and Bhattacharya 2009), while another set of explanations points
to the fact that more women are now enrolled in educational institutions, which accounts for their
unavailability for market work (Himanshu 2011; Rangarajan et al. 2011). However, enrollment in
higher education does not explain low rates of employment for those who have completed
schooling (e.g. women aged 25 and over) (Mahapatro 2013). Still other explanations point to an
“income effect,” where women withdraw from the labor market as household income rises,
especially in a culture where males are regarded as the main breadwinners (Klasen and Pieters
2015). The so-called U-shape where female labor force participation declines initially with
economic development, but then flattens and rises again, reflecting structural economic shifts has
also been implicated in explaining the Indian conundrum (Goldin 1994). Yet it is not clear at what
point of rising incomes should the “U” veer upwards, as it has not done so for India as yet (Lahoti
and Swaminathan 2015).
It is likely that the jobs available to women are not in keeping with either their aspirations
or their ambition; in other words, there are not enough “good jobs” that women would consider
engaging in (Chatterjee et al. 2015; Kapsos et al. 2014). It may also be possible that women’s
reservation wage is higher than that of men, given the many pressures on the former’s time. There
is widespread recognition in feminist circles, of constraints from (real and perceived) safety and
security, inadequate housing and transport that contribute to the overall opportunity cost of
engaging in the labor market. This is compounded by the fact that employers may have an implicit,
or in many cases an explicit bias against women doing certain kinds of work. Over a decade ago
4
Das and Desai (2003) and Das (2006) had argued that in fact, cultural and structural factors are
mutually reinforcing and the context that arises of the reinforcement hinders both women’s labor
supply decisions as well as the demand for their labor.
The puzzle we focus on in this paper is why urban mothers in the 25-55 age group, who
are more likely to be educated, have fewer children and reside in locations that are considered hubs
for jobs, have had labor force participation rates consistently below 25 percent. It may entirely be
possible that these women want to stay home with their children, but we believe that reality is
more complex than that. There is little empirical evidence on the manner and extent to which
urban mothers’ caregiving roles impede their ability to undertake market work. This paper
therefore fills a critical gap in policy research on women’s employment in India. Situating the
discussion in the normative construction of motherhood and gendered nature of caregiving in
India, it uses pooled data from six rounds of the NSS to examine the effects of having a young
child on mothers’ employment in urban India over the period 1983-2011. Second, it looks at
household structure and analyzes the effects of other household members on women’s labor
supply. The remainder of the paper is organized as follows. The next section is a review of studies
on the construction of motherhood, employment and the care of young children. Section 3
presents data and descriptive statistics. Section 4 lays out the analytic strategy and methods, section
5 describes the empirical findings, while the sixth and final section presents a discussion of the
findings and implications for policy and action.
2. Motherhood, the Care of Young Children and Women’s Work
Constructions of motherhood vary across cultures, but for the most part, mothers are the
primary caregivers of young children. Globally, women with a child of pre-school age are less
likely to be employed, provided other conditions remain the same.2 The competing demands of
market work and child-rearing lead women to make tradeoffs, especially during children’s infancy
and preschool years when the latter require intense supervision.3 Therefore, motherhood places a
“penalty” on almost all female workers, unless formal or informal institutions step in to share care
2 For a literature review of empirical studies, see Del Boca (2015); Kalb (2009); Anderson and Levine (2000) and Deutsch (1998). 3 Borrowed from socio-demographic literature, the so-called “maternal role incompatibility” argument posits that roles of mother and worker may be inherently incompatible (Rindfuss and Brewster 1996).

5
responsibilities with women or female wages are high enough to compensate for the monetary and
non-monetary costs of childcare.
Several analyses find that the presence of young children in the household is associated
with lower female labor force participation in India (Das 2006; Rani and Unni 2009; Bhalla and
Kaur 2011; Sengupta and Das 2014; Kapsos et al. 2014; Das et al. 2015; Sorsa et al. 2015). Both
Klasen and Pieters (2015) and Sorsa et al. (2015) find an increasing negative association between
urban married women’s employment and the presence of young children in the household.
Chatterjee et al. (2015) find that while young children constrain women’s employment, having
older parents or other elderly members in the household increases women’s LFPR, suggesting that
lack of child support restrains women’s ability to work. A recent decomposition of rural women’s
labor force participation finds that an increase in more educated women’s returns to home
production, relative to their returns in the labor market, may have depressed their labor force
participation rates in rural areas (Afridi et al. 2016). None of these studies however, undertakes a
detailed analysis of the relationship between having a young child and mothers’ employment nor
do they examine how household structure mediates the relationship.
The construction of motherhood exercises a strong normative pressure on women’s market
and domestic work. In India, as in many other countries, motherhood is assigned an exalted role;
conversely, women who are not perceived as fulfilling the role in the traditional sense are censured,
either overtly or covertly, both within the home and outside. In this context, child care is almost
entirely the responsibility of the mother. While Indian fathers are becoming increasingly involved
in child rearing, especially in urban areas, they are perhaps more involved after the child starts
school. In a publication that considered societal norms of a good wife and mother, respondents
from India, as elsewhere, characterized good motherhood as being about a mother putting her care
responsibilities uppermost. At the same time, respondents felt that working mothers are
discriminated against for abandoning their children and that children may be negatively affected
by their mother’s absence (Muñoz Boudet et al. 2013). Anecdotal evidence also shows that
working mothers may be discriminated against by employers for not being adequately committed
to the labor market (Johari 2015). Given this milieu, women feel that if they leave children with
non-family members they would be negligent mothers despite the fact that there is no conclusive
evidence of the relationship between maternal employment and children’s welfare, with a rich

6
body of literature showing effects in both directions (Desai and Jain, 1994; Kishor and
Parasuraman 1998; Glick 2002).
It is ironic that in India, as the burden of childbearing has reduced, the burden of
childrearing has increased over time (table 2). There could be two main reasons for this. First,
intergenerational co-habitation has declined, especially in urban areas, as families have become
more nuclear. Women have fewer potential helpers in child care and domestic responsibilities and
hence have fewer options (Tuli and Chaudhary 2010). According to NSS data, among those
married women (aged 25–55) who reported not being in the labor force in 2011, a significant
majority (70 percent) reported staying in the domestic realm, due to compulsion. While the
responses did not vary greatly by women’s education level, about one-third of women attending
domestic duties only said they would be willing to accept work outside the home, and most of
them (75 percent) wanted regular part-time jobs (World Bank 2011).
Second, it is possible that while the number of children per woman has declined, families
place greater emphasis on the quality of childrearing and make higher investments in children,
both as a route to social mobility and in response to pressure from schools. It is for instance,
possible that especially in recent years, mothers in urban areas spend more time tutoring and
mentoring their young children, as pre-schools insist on greater involvement of parents in the
child’s education. Palriwala and Neetha (2011) suggest that the elite and middle classes have
higher expectations of quality from child care providers, while Datta and Konantambigi (2007)
argue that while many middle and upper class mothers have few alternative care options, they are
pressured to provide early stimulation and education for their children. In another study, Basu and
Desai (2012) find children in one-child families to be advantaged: they are more likely to be sent
to private schools and English medium schools, and more likely to receive private tutoring in
addition to schooling, than children from larger families. Yet women in one-child families are less
likely to be employed than those in larger families.
In countries with established welfare systems, or with institutions that actively encourage
women’s participation in the labor market, affordable child care is a facilitator of women’s
employment, but in places that lack formal care arrangements, families and other informal
arrangements are indispensable (Del Boca 2002; Del Boca 2015). Parents may choose
grandparents or trusted relatives over low-quality private or public providers, to share care
responsibilities (Del Boca et al. 2005; Kuhlthau and Mason 1996; World Bank 2015b). Teenage

7
children are also often tasked to help with household responsibilities, including caring for younger
siblings, which has its own negative consequences for the older children. In developing countries,
potential caregivers in the household have been observed to be girls as young as age 6, when there
are younger siblings to be cared for, while in richer countries it is more common for a grandmother
to replace working mothers in child care (Hallman et al. 2005). 4 Francavilla et al. (2013) find that
if mothers work in India, children, especially in poorer households, may contribute to housework
or to household income, or simply stay inactive instead of attending school. The burden of
household chores and care of siblings was also found to be a significant factor in girls’ non-
enrollment and absence from school in poor families in the mid-1990s (Probe Team 1999).
Indian labor laws require that employers provide child care, but only a few provide
satisfactory facilities.5 Moreover, since the majority of women work in unregulated, informal jobs,
they do not have assured access to such facilities, even if they did exist. Regardless of laws,
institutional care facilities for children under the age of 6 are practically non-existent in rural areas
and very unsatisfactory in urban areas. Urban households tend to send their children—usually from
the age of 2 years—to pre-schools, that are for the most part unregulated but expensive and keep
the child only for a few hours. These facilities are not a viable child care option for women who
work full-time, or even part-time, especially if they have to travel some distance to get to their
place of work. For children under the age of two, there are even fewer child care options and
women have to either hire private help or ask for assistance from family and relatives.
Palriwala and Neetha (2011) argue that social policies for women and child welfare,
including crèche schemes have been developed mainly to address issues of children’s health and
well-being rather than of women’s employment. There are various non-state initiatives, of which
those offered by the Self-Employed Women’s Association (SEWA) and Mobile Crèche are among
the best known, but several private providers and employers are slowly realizing the importance
4 See Wong and Levine (1992) for urban Mexico; Connelly, DeGraff and Levinson (1996) for metropolitan Brazil; Maurer-Fazio et al. (2011) for urban China; Hallman et al. (2005) for urban slums of Guatemala City; Deutsch (1998) for slums of Rio de Janeiro; and Posadas and Vidal-Fernandez (2013) for the U.S. For the role of grandmothers in childcare, see Du and Dong (2010) for China; Compton and Pollak (2014) for the U.S.; Arpino et al. (2010) and Del Boca (2002) for Italy, though the latter study does not test whether grandmothers’ effect on women’s LFPR is through child care. 5 Section 48 of the Factories Act, 1948; Section 44 of the Inter State Migrant Workmen (RECS) Act, 1979; Section 12 of the Plantations Labour Act, 1951; Section 14 of the Beedi and Cigar Workers (Conditions of Employment) Act, 1966; Section 35 of the Building and other Constructions (Regulation of Employment and Conditions of Service) Act, 1996. See the list of protective provisions for women employees: http://labour.gov.in/content/division/women-labour.php

8
of child care to retain female workers. Most of these initiatives are small in scale and patchy,
compared to the vast needs for child care. SEWA and Mobile Crèche have long highlighted the
needs of especially the poorest informal women in large urban centers – women who work on
construction sites, street vendors, domestic workers, and others who work in taxing manual jobs,
for low wages. As yet however, there is not a similar lobby for the needs of educated women who
may want to work, but cannot.
Micro studies shine more granular light on women’s child rearing and domestic
responsibilities and their influence on urban women’s labor market decisions. Qualitative research
based on interviews with professional women, confirms accounts of women placing their
reproductive and caregiving roles above their jobs and careers, where domestic help is hard to find
and the employer does not provide child care facilities or flexible work options (Agarwal et al.
2012; Buddhapriya 2009; Valk and Srinivasan 2011). Sudarshan and Bhattacharya (2009), based
on a household survey in urban Delhi in 2006 found that 60 percent of respondents had quit work
after childbirth, and around 57 percent of working respondents felt that women should stop
working when their children are young. Among women who withdrew from the formal labor
market, the most common reason was that household work had become too burdensome. Both
working and nonworking women reported neglect of children and conflict over domestic chores
as the two factors that most constrained women’s employment.
Yet many women, not just the poorest, have to walk a fine balance between market work
and child care, and while a growing feminist discourse is drawing attention to this, empirical
studies are limited. A study in urban areas of Uttar Pradesh and Gujarat, found that women from
certain communities would forego wage work, saying it was mostly due to family responsibilities
and social norms (IAMR and ILO 2013). On average, working women spent 4–6 hours a day either
attending to household duties or taking care of the children or elderly. Some women with young
children preferred to work from home, when there was no one from the family to help with child
care. Based on interviews with female engineers, an article in Quartz cites the “maternal wall” as
the main barrier for Indian women to advance in their careers (Madhok 2015), while in a 2015 poll
of G20 countries, female respondents from India stated that balancing work with home was the
main issue they dealt with in their working lives, followed by few opportunities for flexible work
(Thomson Reuters Foundation 2015).
9
3. The Data and Its Description
This paper uses NSS data to study the relationship between mothers’ employment, presence
of young children and household structure. The NSS surveys are the largest and most frequently
used data sets on employment for India. We use six “thick” rounds of the Employment and
Unemployment schedules of the NSS: 1983, 1993–94, 2004–05, 2007–08, 2009–10 and 2011–12.
While the NSS include an extensive set of questions on employment and individual characteristics,
they do not have questions on child care or norms of motherhood and caregiving.
Our analytic sample comprises wives of household heads aged 25 to 55 years in urban
areas.6 The age range excludes women who may be in college or may have exited the labor market
due to early retirement. It is worth noting here that marriage in India is early and near universal
for women, with mean age at effective marriage in urban areas standing at 22.7 according to the
Census.7 Other analysis shows that marriage by itself is an important predictor of employment, in
that it depresses women’s labor force participation in several countries, and certainly in India (Das
and Desai, 2003; Das, 2006).
We have 25,000 to 29,000 observations for each year in our sample, and the pooled sample
has nearly 162,000 observations. The dependent variable is women’s employment, which is
estimated based on their activity in the last 365 days (i.e. whether a woman worked for the major
part of the year preceding the survey, also called usual principal status). The main variable of
interest is the presence of at least one young child under age 6 in the household, because by age 6
most children start going to school and require less intensive care. Other explanatory variables are
woman’s education, age, a squared term for age, region of residence and household characteristics
such as Scheduled Caste (SC), Scheduled Tribe (ST) and Other Backward Caste (OBC) status,
religion and household size.
In line with fertility decline in India, we observe that the share of women with children
under age 6 fell almost by half from 42.9 percent in 1983 to 23.2 percent in 2011. This has been
accompanied by a plunge in average household size, which dropped from a high of 5.8 in 1983 to
4.6 in 2011. The mean age at first birth for women aged 25 years and older in urban areas is
6 To capture the effects of children on mother’s employment we focus only on the spouse of household head as a unit of analysis and thus exclude other women who may be residing in the same household. However, other women in the household enter the analysis as explanatory variables in terms of possible childcare support to the wife of the household head, and our protagonist. 7 http://www.censusindia.gov.in/vital_statistics/srs_report/9chap%202%20-%202011.pdf

10
between 21.2 and 21.5 (Desai et al. 2010). Therefore, women in our sample would have
commenced childbearing, leading to a higher average household size than of the whole sample.
This is borne out in table A2. In addition, the share of households with at least one male is higher
than the share of households with at least one female, irrespective of age group in all survey rounds.
This is because single migrants to urban areas tend to be men and women usually migrate after
marriage. Table 2 shows only 16 percent of women (aged 25-55) with young children were in the
labor market in 2011, compared to 23.6 percent of women without young children. The difference
in LFPR of the two sets of women increased from 4.7 percentage points in 1983 to 7.5 percentage
points in 2011.8,9
Table 2. Labor Force Participation Rates for Married Women with and Without Children under Age 6 in Urban Areas, 1983–2011 (percent)
1983 1993 2004 2007 2009 2011 Female with no children under age 6 24.4 24.4 25.8 21.7 22.8 23.6 Female with at least one child under age 6 19.7 18.7 20.2 15.9 14.6 16.1 difference 4.7 5.7 5.6 5.8 8.2 7.5
Source: Authors’ estimates from the NSS for urban women aged 25-55, who are wives of household head.
We expect a lower likelihood of employment for younger women, those belonging to non-
SC/ST/OBC households and Muslim women. SC/ST women have been generally disadvantaged
and are among the poorest; therefore, they are more likely to work compared to non-SC/ST
women. They also tend to have weaker norms of male-female segregation (Das and Desai, 2003;
Das 2006). Religion, however, plays a complex role and its negative effects on employment are
stronger for Muslim women, due to a variety of reasons, of which lack of opportunities may be
one (see Das 2005). We also add the husband’s education and employment type as a proxy for
household income and socio-economic status.10
Further, we account for household structure to bring in the presence of potential caregivers.
In doing this, we include older females and males by age group, assuming that their presence in
8 The difference in LFPR between women with at least one young child and those without young children is statistically significant in all years. 9 We estimate the LFPR for women with children aged 6–7 and find that it is around 2–3 percentage points higher than the LFPR of women with children under age 6 in the period 2004–2011, whereas in the years before the difference was negligible. 10 The NSS surveys do not collect earnings information for self-employed workers (who constitute around half of employed persons) making it impossible to infer household income.
11
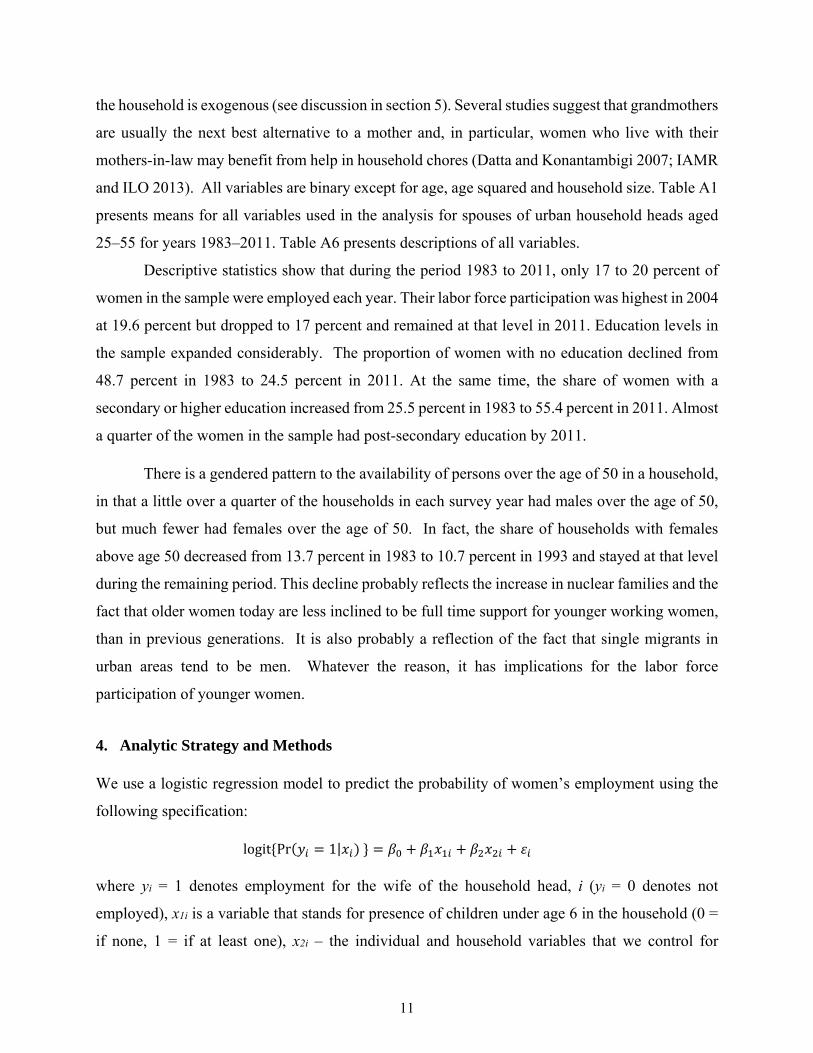
the household is exogenous (see discussion in section 5). Several studies suggest that grandmothers
are usually the next best alternative to a mother and, in particular, women who live with their
mothers-in-law may benefit from help in household chores (Datta and Konantambigi 2007; IAMR
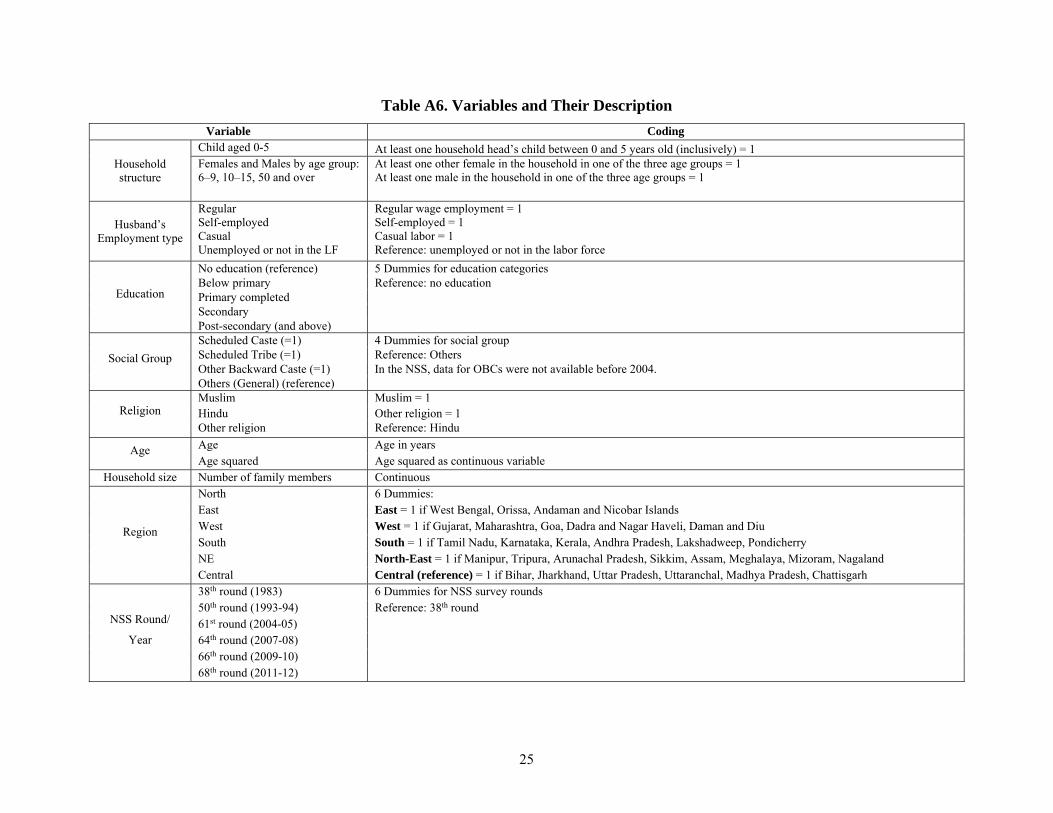
and ILO 2013). All variables are binary except for age, age squared and household size. Table A1
presents means for all variables used in the analysis for spouses of urban household heads aged
25–55 for years 1983–2011. Table A6 presents descriptions of all variables.
Descriptive statistics show that during the period 1983 to 2011, only 17 to 20 percent of
women in the sample were employed each year. Their labor force participation was highest in 2004
at 19.6 percent but dropped to 17 percent and remained at that level in 2011. Education levels in
the sample expanded considerably. The proportion of women with no education declined from
48.7 percent in 1983 to 24.5 percent in 2011. At the same time, the share of women with a
secondary or higher education increased from 25.5 percent in 1983 to 55.4 percent in 2011. Almost
a quarter of the women in the sample had post-secondary education by 2011.
There is a gendered pattern to the availability of persons over the age of 50 in a household,
in that a little over a quarter of the households in each survey year had males over the age of 50,
but much fewer had females over the age of 50. In fact, the share of households with females
above age 50 decreased from 13.7 percent in 1983 to 10.7 percent in 1993 and stayed at that level
during the remaining period. This decline probably reflects the increase in nuclear families and the
fact that older women today are less inclined to be full time support for younger working women,
than in previous generations. It is also probably a reflection of the fact that single migrants in
urban areas tend to be men. Whatever the reason, it has implications for the labor force
participation of younger women.
4. Analytic Strategy and Methods
We use a logistic regression model to predict the probability of women’s employment using the
following specification:
where yi = 1 denotes employment for the wife of the household head, i (yi = 0 denotes not
employed), x1i is a variable that stands for presence of children under age 6 in the household (0 =
if none, 1 = if at least one), x2i – the individual and household variables that we control for
logit Pr 1|

12
(i.e. women’s education, age, age squared, social class, religion, region of residence, household
size, husband’s education and employment type and dummies for presence of other household
members grouped by age and gender). β0 is an intercept, β1 is the coefficient of interest, which
shows the effects of the presence of young children, and β2 contains coefficients that capture other
individual and household level effects. Except for age and household size (which are continuous
variables), all variables are represented by dummy indicators.
We estimate logistic regressions for each year and in the pooled sample we include
dummies for the survey year with 1983 as a reference (see Table A6 for a list of variables and their
descriptions). We calculate odds ratios predicting women’s employment probability in three
logistic regression models. The first specification estimates the odds of being employed for
married women while controlling for presence of young children, women’s education and other
individual and household characteristics. Then, we add several variables to control for other
observable characteristics and test the robustness of the model. The second model adds husband’s
education and employment type. In the third model we add the presence of young females and
males as well as those aged over 50 in the household.
Limitations of data throw up several empirical challenges in measuring the association
between women’s employment, child care responsibilities and household structure; the complex
nature of these relationships may lead to confounding issues of endogeneity. First, it is possible
that labor market opportunities affect fertility decisions, (e.g. career-oriented women may decide
to postpone or not to have children), and our inability to control for this may lead to biased
estimates. Second, some variables may simultaneously affect household structure, fertility and
employment decisions, and we may omit a variable that cannot be measured. For instance, as new
employment opportunities open up for women, older household members may be more likely to
move into the household to help with child care needs. In addition, lack of data on formal child
care does not allow us to test whether the effect of other household members on women’s labor
supply is through child care. Yet, in India, with its norms of co-residence with the husband’s
family, we consider the presence of other household members as exogenous to the employment
decisions of mothers. Similar to Connelly et al. (1996), we do not try to explain household structure
or the joint time allocation decisions of all household members. While the possibility of reverse
causality and endogeneity cannot be fully excluded in our econometric specification, we assume
that in the short term, women’s fertility decisions as well as household structure are a given.

13
5. Results
The findings of this paper echo a rich global literature that testifies to the role young
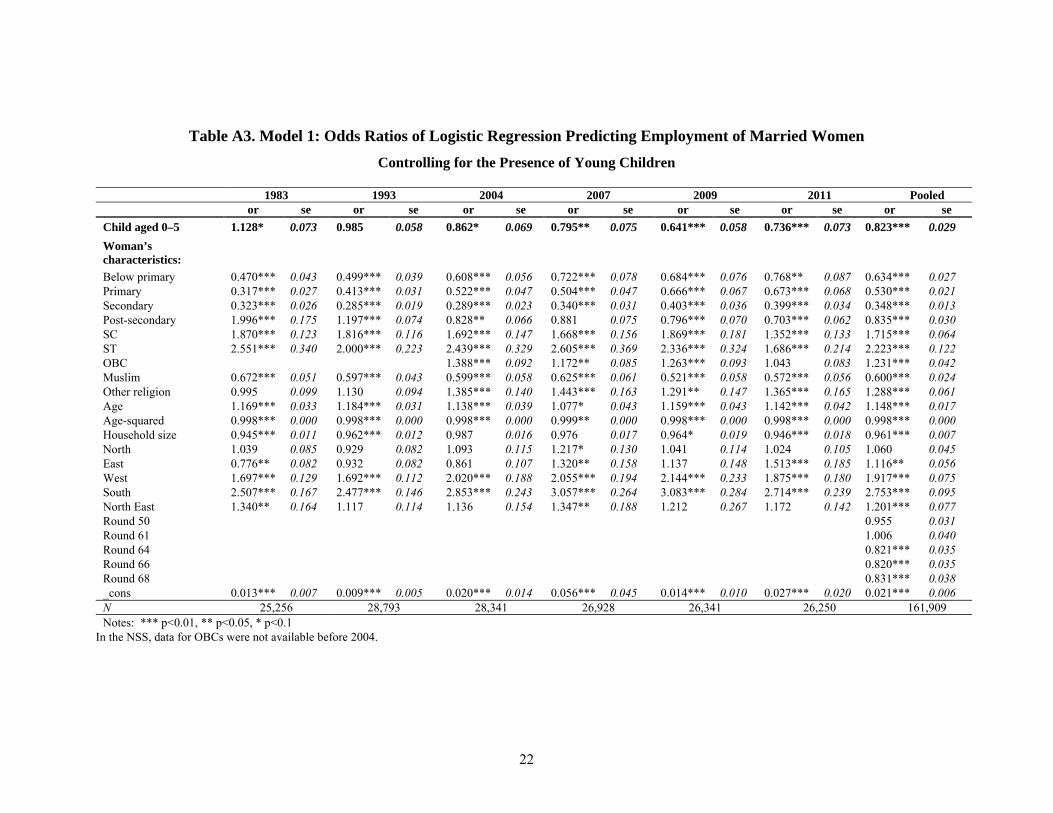
children play in women’s labor supply decisions. Table A3 shows the results of the first logistic
regression model, where we look at the association between women’s employment and the
presence of children under age 6 in the household in each survey round and in the pooled sample.
We find an increasing negative association between having a young child in the household and
women’s employment during the 1983–2011 period. While in 1983–2004 having a young child
was negatively associated with women’s employment (statistically significant only at the 10
percent level), after 2004 the likelihood of being employed for women with young children
decreased substantially. In 2011, the odds of being employed for women without a young child
were almost 1.4 times higher than for those with at least one young child. These results are in line
with other recent empirical work for India that identifies an increasing negative association
between having young children and women’s working (Klasen and Pieters, 2015; Sorsa et al. 2015;
Kapsos et al. 2014). Clearly, young children in a household impose huge demands on women’s
time and limit their employment potential, as evidenced by studies from other countries (e.g.
Cackley 1990; Connelly et al. 1996; Wong and Levine 1992; Deutsch 1998). However, as pointed
out earlier, since we cannot account for possible endogeneity—i.e. that labor market and fertility
decisions can be simultaneously determined —we do not establish the causal effects of care
responsibilities.
We also find that education has a complex relationship with women’s likelihood of being
employed. Those who are educated below primary level are more likely to be employed than those
with secondary education, but then post-secondary education raises the chances of employment
again. The reference category is uneducated women. We also find that over time, the positive
effect of post-secondary education has declined. It is likely, as Desai et al (2010) point out, that
the increasing number of women with higher education has been accompanied by their stronger
preference for white-collar jobs. However, as the supply of such jobs has not kept up with demand;
highly educated women withdraw from the workforce instead of accepting menial or low-status
jobs (Das and Desai 2003). According to Klasen and Pieters (2013), the share of white-collar
services in urban employment dropped from 19 to 17 percent between 1987 and 2009, while the
share of graduates in the working-age population increased from 11 to 21 percent during the same
period.

14
Consistent with the results of other empirical work, coefficients for demographic
characteristics show expected effects. SC, ST and OBC women are more likely to be employed
than are women from the “general category” (non-ST/SC/OBC). Younger women are less likely
to be employed but household size does not seem to matter much. Looking across regions, we
find that women from the South and West are more likely to be employed than women from other
regions. These findings are in keeping with our expectations and a large body of literature on
female labor force participation in India.
The second model adds husbands’ characteristics (education and employment type) to
proxy for household income level and socio-economic status (see Table A4). The effect of having
young children on women’s employment changes only marginally, and the negative association
remains intact. Women whose husbands have more education are less likely to be employed- this
stylized fact is in line with the work of Das (2006), Klasen and Pieters (2015) and Wong and
Levine (1992). In fact, the effects of husbands’ education have not changed much between 1983
and 2011. Women whose husbands had post-secondary education were three times less likely to
be working compared to those whose husbands were uneducated in 2011; essentially, the odds of
working for these women have remained unchanged for the past 30 years.
We also find that women whose husbands are in regular jobs are less likely to be employed.
While coefficients are highly significant for husbands with regular and self-employed jobs, they
are less so for husbands who are casual laborers. We suspect that higher household wealth and
socio-economic status (captured by husbands’ education and regular employment) allow women
to stay out of the labor force, unless there are attractive job opportunities and women’s employment
is socially acceptable (Kingdon and Unni 1997; Das 2006). Indeed, we observe that husbands’
characteristics do not lower the likelihood of being employed for women with post-secondary
education. Highly educated women are twice as likely to be working as women with no education,
even controlling for husbands’ characteristics and the presence of young children. In urban areas,
skilled women are more likely to be pulled into the labor market by higher earnings opportunities
and better jobs (Klasen and Pieters 2015; Kapsos et al. 2014; IAMR and ILO 2013). The
“motherhood penalty” for these women may also be lower as they are better positioned to find and
afford child care.
The third model (Table A5) adds the presence of potential caregivers, such as older girls
and boys and members over age 50 in the household. The presence of young children in the

15
household is still negatively associated with women’s employment, though the relationship is
weaker in 2007 and 2011. By contrast, we find that the presence of girls aged 6–15 is positively
associated with married women’s employment.11 Furthermore, we find that the presence of women
aged 50 and older in the household increases the likelihood of women’s employment. This effect
is strongly significant in all years. In the pooled sample, the odds of employment are 39 percent
higher for women living with females over age 50 in the household. Although the magnitude of
the effect declined over time (by around 18.6 percentage points during 1983–2011), the presence
of older females in the household suggests that older women function as mother surrogates in a
way that older girls living in the home do not.
As we turn to male members in the household, we find that the presence of young boys
(aged 6–9) is positively associated with women’s employment in the pooled sample and in the
years 1983 and 1993, though the relationship is weaker and not statistically significant for later
years. The presence of boys aged 10–15 in the household is also positively associated with
women’s employment but the relationship is not statistically significant for all years. The results
suggest that older boys may also contribute to housework (although less than girls), or perhaps
older children may also allow women to enter market work due to lower demands for their care
needs.
6. Discussion and Implications
To our knowledge, this paper is the first to empirically examine the relationship between
women’s care responsibilities and their decision to participate in the urban Indian labor market.
Social norms dictate that even if other family members help out, the ultimate responsibility of child
care rests on women, particularly on the mother. A culture that instills the responsibility of child
care so overwhelmingly into women, especially in their role as mothers, also makes it hard for
them to enter and stay in market work. It is also possible that parents today want to invest more
heavily in children than the previous generations did. This decision comes at the cost of mothers
staying out of the labor market and providing high quality care to children. It is particularly the
case for educated mothers, who use their skills in providing their children a better life, possibly in
11 We have also tested the effects of living with other household members, including them by their relationship status to the spouse of household head, rather than age group. Yet, these variables are not statistically significant for most years, hence we assume that grouping household members by age is more relevant in this analysis.

16
the expectation that their kids will fare better than they did, and the overall status and standing of
the family will be elevated. Whether this is altruism or “sacrifice”, or self-interest is the subject of
another, more philosophical discussion.
Indian women’s decision to enter and stay in the labor market has garnered more scholarly
and public attention in the last few years. We know that married women tend to stay out, and
mothers are even more likely to do so. Their decisions are likely influenced by a number of factors,
not just the mere presence or absence of child care. This includes the type of jobs available to
them, their wages, conditions of work, status in the workplace, travel time to the workplace,
whether they have enough flexibility to take time off when children need them, etc. Qualitative
interviews our team has conducted during 2014-2016 show that the perception of safety and
security both in the workplace and outside may have a lot to do with the overall package of
“conditions of work”. These considerations are difficult to measure with classic data sets but
together make up what is a black box of “opportunity cost” of market work for women. Often the
conditions of work and the norms of a “good mother” and “good wife” are too difficult to question
or to negotiate, even if women wanted to, and so staying home is a rational option. Opportunity
cost is likely calculated by husbands and wives, who understand the labor market and its likely
opacity, and juxtapose that with the needs of high quality care for their children, thereby making
well thought-out decisions on the costs and benefits of mothers entering the labor market.
What does this mean for policy and practice? It really depends on how much a government
wants to encourage women’s labor force participation. If indeed it does, there are several policy
levers, but they need to be implemented in tandem. Provision of affordable, high quality childcare,
safe transport, and implementation of extant enabling legislation are of course quick wins. It is
also fashionable to say that norms need to change, but in fact, change in norms often follows strong
policy interventions, and norms and behaviors respond well to incentives, as family policy across
the world has shown. In sum, unless the state, employers and families weave a web of support,
women are unlikely to enter the labor market.
Norms are indeed powerful in society and the economy and may affect not just intra-family
decision-making, but also the supply of institutional child care and the labor market in general
(Polanyi 1944). What are the chances that the pervasive societal belief that mothers of young
children should stay home, or that mothers will not leave their children to take up market work,
affects both private and public investment in child care centers? What are the chances that

17
employers do not hire mothers of young children because of the pervasive doubt about the latter’s
“attachment to the labor market”? The Pew Research surveys find that 84 percent of Indians agree
with the statement: “when jobs are scarce, men should have more right to a job than women” (Pew
Research Center 2010). Such attitudes are found to be negatively correlated with women’s labor
force participation across many countries and are a reflection of social norms that reinforce the
traditional role of women and also mediate the way institutions treat women and perpetuate gender
inequality in the labor market (Das et al. 2015; World Bank 2013). Norms are often self-
perpetuating, in that employers and investors look for what they expect to find. Unless they make
a concerted effort to question the conventional wisdom, norms will remain largely stubborn to
change.
The state can signal a more enabling vision for women and mothers in different ways.
Publicly funded information campaigns that value women as workers and project child care as a
shared responsibility in the home, are likely to remove some of the guilt that women often
experience when they leave children behind to go out to work. Such campaigns have been
effectively used in India and elsewhere to achieve health outcomes such as family planning,
immunization, or for literacy and to enroll participants in social programs such as conditional cash
transfers schemes. Both the state and the private sector in India are beginning to gingerly
experiment with options to attract larger numbers of female workers into the labor market. We
need a better understanding of what these initiatives are, how well they work and how they can
scale up.
Finally, there is the issue of data and the analysis of the complexity of Indian women’s
decision to stay out of the labor market. We need data that better capture norms, perceptions and
aspirations, in addition to conditions of work, transport, housing, and infrastructure. Better analysis
is also required about the mediating factors for women’s employment such as the extent to which
infrastructure and other services (such as toilets in the work place, hours of water supply in the
home, connectivity through transport and information technology) inhibit or encourage women’s
participation in the labor market, since women and men are differentially affected by the
availability of services.
In conclusion, this paper contributes to the understanding of urban India women’s decisions
to participate in the labor market by assessing the influence of young children in the household. It
finds that while the responsibility of child bearing has gone down due to the secular decline in

18
fertility, the onus of child rearing has gone up. Having a young child in the household reduces
urban mothers’ likelihood of being g employed and this effect has intensified over time. The
presence of mother surrogates, in the form of other women in the home, somewhat attenuates this
negative effect, but overall, the motherhood penalty is an important factor in womens’ decisions
to enter or stay in the labor market. There are various ways in which policy can help, but provision
of childcare will have to go hand in hand with other measures, and employers, the state and
households will have to make a coordinated effort to attract and keep urban women in the labor
market.

19
Table A1. Sample Means for Married Women (Wives of Household Heads), Aged 25–55
Year/Variables 1983 1993 2004 2007 2009 2011 Employed 18.4 18.0 19.6 16.7 17.1 17.2 Education No education 48.7 39.9 31.5 28.7 25.8 24.5 Below primary 10.8 9.9 8.0 7.5 7.7 8.1 Primary 14.9 13.2 13.4 12.8 12.3 12.0 Secondary 20.1 23.3 27.7 30.7 29.3 30.1 Post-secondary 5.4 13.7 19.4 20.3 24.9 25.3 Demographic characteristics SC 12.1 12.5 14.7 14.4 14.4 14.0 ST 3.4 3.0 2.9 2.7 2.7 3.5 OBC 0.0 0.0 36.0 38.4 39.5 41.9 Non-SC/ST/OBC 84.5 84.5 46.4 44.5 43.4 40.6 Hindu 78.7 80.2 79.8 80.0 80.5 79.8 Muslim 14.5 13.5 13.9 14.1 13.4 14.6 Other religion 6.8 6.4 6.3 5.9 6.1 5.7 Age 36.8 37.1 38.3 38.6 38.3 38.4 Household size 5.8 5.2 4.9 4.7 4.6 4.6 Region of residence North 14.3 13.8 15.2 14.7 14.4 13.5 Central 24.1 24.0 23.0 22.9 22.2 22.4 East 10.3 10.2 10.2 9.4 9.1 9.3 West 21.0 20.9 22.1 21.7 22.3 22.9 South 28.8 29.2 27.7 29.4 30.1 30.0 North East 1.5 1.9 1.9 1.9 2.0 1.9 Household structure Children aged 0–5 42.9 34.3 26.5 24.4 23.7 23.2 Females aged 6–9 27.8 22.5 18.1 16.4 15.7 15.1 Females aged 10–15 34.8 30.4 28.3 25.3 23.5 23.3 Females aged over 50 13.7 11.4 11.2 10.5 10.6 10.7 Males aged 6–9 29.8 25.1 19.3 18.0 18.1 17.1 Males aged 10–15 38.4 33.9 29.9 28.0 29.0 27.9 Males aged over 50 25.2 23.5 25.9 26.9 25.2 25.6 Husband’s characteristics
Education No education 23.0 19.1 15.1 14.6 13.2 12.7

20
Year/Variables 1983 1993 2004 2007 2009 2011 Below primary 13.7 11.6 9.1 7.4 7.2 7.7 Primary 16.7 13.1 13.1 11.5 10.8 10.9 Secondary 31.6 28.3 31.4 34.3 33.3 32.4 Post-secondary 15.0 28.0 31.4 32.2 35.4 36.3
Employment type Regular 45.9 45.5 39.9 40.7 40.8 41.2 Self-employed 31.3 32.7 37.9 37.9 36.4 37.6 Casual 11.2 12.2 11.6 12.6 14.4 12.3 Other 11.6 9.6 10.7 8.8 8.4 8.9 N 25,283 28,807 28,365 26,942 26,365 26,251
Source: Authors’ estimates using NSS Survey.

21
Table A2: Change in household size 1983-2011
1983 1993 2004 2007 2009 2011 All India 5.1 4.8 4.7 4.5 4.4 4.3 Urban 4.8 4.4 4.3 4.2 4.1 4.0 Analytic sample – wives aged 25-55 of urban household head head
5.8 5.2 4.9 4.7 4.6 4.6
22
Table A3. Model 1: Odds Ratios of Logistic Regression Predicting Employment of Married Women
Controlling for the Presence of Young Children
1983 1993 2004 2007 2009 2011 Pooled or se or se or se or se or se or se or se
Child aged 0–5 1.128* 0.073 0.985 0.058 0.862* 0.069 0.795** 0.075 0.641*** 0.058 0.736*** 0.073 0.823*** 0.029 Woman’s characteristics:
Below primary 0.470*** 0.043 0.499*** 0.039 0.608*** 0.056 0.722*** 0.078 0.684*** 0.076 0.768** 0.087 0.634*** 0.027 Primary 0.317*** 0.027 0.413*** 0.031 0.522*** 0.047 0.504*** 0.047 0.666*** 0.067 0.673*** 0.068 0.530*** 0.021 Secondary 0.323*** 0.026 0.285*** 0.019 0.289*** 0.023 0.340*** 0.031 0.403*** 0.036 0.399*** 0.034 0.348*** 0.013 Post-secondary 1.996*** 0.175 1.197*** 0.074 0.828** 0.066 0.881 0.075 0.796*** 0.070 0.703*** 0.062 0.835*** 0.030 SC 1.870*** 0.123 1.816*** 0.116 1.692*** 0.147 1.668*** 0.156 1.869*** 0.181 1.352*** 0.133 1.715*** 0.064 ST 2.551*** 0.340 2.000*** 0.223 2.439*** 0.329 2.605*** 0.369 2.336*** 0.324 1.686*** 0.214 2.223*** 0.122 OBC 1.388*** 0.092 1.172** 0.085 1.263*** 0.093 1.043 0.083 1.231*** 0.042 Muslim 0.672*** 0.051 0.597*** 0.043 0.599*** 0.058 0.625*** 0.061 0.521*** 0.058 0.572*** 0.056 0.600*** 0.024 Other religion 0.995 0.099 1.130 0.094 1.385*** 0.140 1.443*** 0.163 1.291** 0.147 1.365*** 0.165 1.288*** 0.061 Age 1.169*** 0.033 1.184*** 0.031 1.138*** 0.039 1.077* 0.043 1.159*** 0.043 1.142*** 0.042 1.148*** 0.017 Age-squared 0.998*** 0.000 0.998*** 0.000 0.998*** 0.000 0.999** 0.000 0.998*** 0.000 0.998*** 0.000 0.998*** 0.000 Household size 0.945*** 0.011 0.962*** 0.012 0.987 0.016 0.976 0.017 0.964* 0.019 0.946*** 0.018 0.961*** 0.007 North 1.039 0.085 0.929 0.082 1.093 0.115 1.217* 0.130 1.041 0.114 1.024 0.105 1.060 0.045 East 0.776** 0.082 0.932 0.082 0.861 0.107 1.320** 0.158 1.137 0.148 1.513*** 0.185 1.116** 0.056 West 1.697*** 0.129 1.692*** 0.112 2.020*** 0.188 2.055*** 0.194 2.144*** 0.233 1.875*** 0.180 1.917*** 0.075 South 2.507*** 0.167 2.477*** 0.146 2.853*** 0.243 3.057*** 0.264 3.083*** 0.284 2.714*** 0.239 2.753*** 0.095 North East 1.340** 0.164 1.117 0.114 1.136 0.154 1.347** 0.188 1.212 0.267 1.172 0.142 1.201*** 0.077 Round 50 0.955 0.031 Round 61 1.006 0.040 Round 64 0.821*** 0.035 Round 66 0.820*** 0.035 Round 68 0.831*** 0.038 _cons 0.013*** 0.007 0.009*** 0.005 0.020*** 0.014 0.056*** 0.045 0.014*** 0.010 0.027*** 0.020 0.021*** 0.006 N 25,256 28,793 28,341 26,928 26,341 26,250 161,909 Notes: *** p<0.01, ** p<0.05, * p<0.1
In the NSS, data for OBCs were not available before 2004.

23
Table A4. Model 2: Odds Ratios of Logistic Regression Predicting Employment of Married Women Controlling for Husband’s Characteristics
1983 1993 2004 2007 2009 2011 Pooled or se or se or se or se or se or se or se Child aged 0–5 1.051 0.069 0.947 0.057 0.850** 0.069 0.775*** 0.074 0.630*** 0.057 0.734*** 0.073 0.804*** 0.029 Husband’s education:
Below primary 0.774*** 0.058 0.809*** 0.059 0.859 0.087 0.711*** 0.084 0.727** 0.093 1.097 0.130 0.823*** 0.036 Primary 0.588*** 0.045 0.713*** 0.053 0.758*** 0.070 0.527*** 0.059 0.718*** 0.083 0.673*** 0.076 0.649*** 0.027 Secondary 0.347*** 0.031 0.447*** 0.036 0.514*** 0.050 0.394*** 0.045 0.425*** 0.046 0.445*** 0.047 0.427*** 0.018 Post-secondary 0.297*** 0.038 0.294*** 0.028 0.358*** 0.040 0.308*** 0.045 0.297*** 0.041 0.331*** 0.040 0.312*** 0.017
Husband’s employment:
Regular 0.476*** 0.039 0.445*** 0.034 0.444*** 0.045 0.526*** 0.058 0.582*** 0.062 0.595*** 0.061 0.518*** 0.022 Self-employment 0.655*** 0.052 0.593*** 0.044 0.517*** 0.053 0.596*** 0.065 0.561*** 0.056 0.648*** 0.065 0.589*** 0.024 Casual 1.145 0.104 1.075 0.092 0.738*** 0.081 0.996 0.122 0.725*** 0.078 0.836 0.095 0.874*** 0.040
Woman’s characteristics:
Below primary 0.668*** 0.065 0.672*** 0.055 0.716*** 0.069 0.940 0.110 0.845 0.102 0.871 0.103 0.798*** 0.037 Primary 0.553*** 0.052 0.654*** 0.055 0.727*** 0.071 0.773** 0.081 0.956 0.105 0.934 0.104 0.796*** 0.035 Secondary 0.774*** 0.077 0.627*** 0.051 0.493*** 0.046 0.651*** 0.075 0.707*** 0.073 0.710*** 0.073 0.659*** 0.029 Post-secondary 6.057*** 0.800 3.780*** 0.344 1.875*** 0.194 2.110*** 0.268 1.919*** 0.250 1.682*** 0.195 2.122*** 0.108 SC 1.632*** 0.113 1.589*** 0.105 1.548*** 0.140 1.439*** 0.141 1.661*** 0.162 1.247** 0.123 1.529*** 0.059 ST 2.155*** 0.268 1.790*** 0.196 2.219*** 0.313 2.261*** 0.327 2.162*** 0.313 1.633*** 0.205 2.017*** 0.111 OBC 1.295*** 0.088 1.067 0.080 1.172** 0.088 0.979 0.079 1.140*** 0.040 Muslim 0.576*** 0.046 0.524*** 0.039 0.535*** 0.053 0.545*** 0.056 0.475*** 0.053 0.510*** 0.050 0.533*** 0.022 Other religion 1.012 0.102 1.055 0.091 1.296** 0.132 1.380*** 0.154 1.210* 0.140 1.299** 0.147 1.225*** 0.057 Age 1.190*** 0.034 1.245*** 0.034 1.206*** 0.044 1.119*** 0.046 1.203*** 0.045 1.178*** 0.044 1.192*** 0.018 Age-squared 0.998*** 0.000 0.997*** 0.000 0.997*** 0.000 0.998*** 0.001 0.997*** 0.000 0.998*** 0.000 0.998*** 0.000 Household size 0.953*** 0.011 0.967*** 0.012 0.982 0.016 0.971 0.017 0.960** 0.019 0.939*** 0.018 0.959*** 0.007 North 1.035 0.086 0.954 0.085 1.125 0.121 1.286** 0.138 1.060 0.119 1.116 0.116 1.111** 0.048 East 0.762** 0.082 0.904 0.081 0.765** 0.096 1.243* 0.150 1.042 0.138 1.424*** 0.172 1.046 0.053 West 1.701*** 0.133 1.689*** 0.115 1.976*** 0.186 2.081*** 0.201 2.129*** 0.234 2.004*** 0.196 1.949*** 0.078 South 2.236*** 0.155 2.154*** 0.132 2.632*** 0.230 2.852*** 0.252 2.848*** 0.267 2.650*** 0.241 2.561*** 0.091 North East 1.342** 0.166 1.107 0.115 1.129 0.153 1.384** 0.192 1.233 0.280 1.211 0.145 1.225*** 0.080 Round 50 0.963 0.032 Round 61 1.037 0.042 Round 64 0.851*** 0.037 Round 66 0.839*** 0.038 Round 68 0.865*** 0.040 _cons 0.023*** 0.013 0.008*** 0.004 0.019*** 0.013 0.069*** 0.057 0.018*** 0.013 0.032*** 0.025 0.025*** 0.007 N 25,001 28,684 28,33 26,928 26,340 26,247 161,536 Notes: *** p<0.01, ** p<0.05, * p<0.1
In the NSS, data for OBCs were not available before 2004.

24
Table A5. Model 3: Odds Ratios of Logistic Regression Predicting Employment of Married Women
Controlling for the Presence of Other Females and Males in the Household 1983 1993 2004 2007 2009 2011 ALL or se or se or se or se or se or se or se Child aged 0–5 1.119* 0.074 1.003 0.062 0.998 0.083 0.828* 0.083 0.712*** 0.066 0.828* 0.088 0.887*** 0.033 Females aged 6–9 1.109* 0.065 1.190*** 0.068 1.203** 0.088 1.148 0.096 1.219** 0.103 1.330*** 0.140 1.202*** 0.042 Females aged 10–15 1.299*** 0.074 1.363*** 0.070 1.542*** 0.099 1.250*** 0.090 1.261*** 0.094 1.213*** 0.088 1.305*** 0.037 Females aged over 50 1.551*** 0.116 1.581*** 0.108 1.333*** 0.114 1.257** 0.121 1.366*** 0.136 1.365*** 0.137 1.387*** 0.053 Males aged 6–9 1.163*** 0.067 1.118** 0.060 1.093 0.079 1.021 0.089 1.115 0.091 1.117 0.094 1.100*** 0.035 Males aged 10–15 1.165*** 0.064 1.018 0.051 1.421*** 0.096 1.113 0.080 1.243*** 0.093 1.252*** 0.093 1.202*** 0.035 Males aged over 50 0.905 0.070 0.935 0.070 1.043 0.102 1.079 0.116 0.903 0.101 0.965 0.096 0.967 0.041 Husband’s education:
Below primary 0.779*** 0.058 0.800*** 0.058 0.881 0.087 0.715*** 0.085 0.732** 0.095 1.106 0.132 0.828*** 0.037 Primary 0.593*** 0.046 0.705*** 0.053 0.766*** 0.071 0.536*** 0.061 0.715*** 0.082 0.680*** 0.077 0.652*** 0.027 Secondary 0.347*** 0.031 0.442*** 0.036 0.528*** 0.051 0.398*** 0.046 0.421*** 0.046 0.446*** 0.047 0.428*** 0.019 Post-secondary 0.299*** 0.039 0.291*** 0.028 0.364*** 0.041 0.308*** 0.046 0.296*** 0.042 0.329*** 0.040 0.312*** 0.017
Husband’s employment:
Regular 0.462*** 0.037 0.442*** 0.034 0.441*** 0.045 0.529*** 0.059 0.580*** 0.061 0.603*** 0.063 0.516*** 0.022 Self-employment 0.639*** 0.051 0.590*** 0.043 0.512*** 0.052 0.594*** 0.065 0.555*** 0.056 0.649*** 0.067 0.583*** 0.024 Casual 1.105 0.099 1.062 0.090 0.715*** 0.077 0.988 0.122 0.704*** 0.076 0.824* 0.095 0.856*** 0.039
_cons 0.062*** 0.037 0.015*** 0.008 0.054*** 0.041 0.092*** 0.081 0.031*** 0.025 0.047*** 0.037 0.046*** 0.015 N 25,001 28,684 28,336 26,928 26,340 26,247 161,536
Notes: *** p<0.01, ** p<0.05, * p<0.1 In the NSS, data for OBCs were not available before 2004. The model also includes controls for the same woman’s characteristics as in the previous models.
25
Table A6. Variables and Their Description
Variable Coding
Household structure
Child aged 0-5 At least one household head’s child between 0 and 5 years old (inclusively) = 1 Females and Males by age group: 6–9, 10–15, 50 and over
At least one other female in the household in one of the three age groups = 1 At least one male in the household in one of the three age groups = 1
Husband’s Employment type
Regular Self-employed Casual Unemployed or not in the LF
Regular wage employment = 1 Self-employed = 1 Casual labor = 1 Reference: unemployed or not in the labor force
Education
No education (reference) 5 Dummies for education categories Below primary Reference: no education Primary completed Secondary Post-secondary (and above)
Social Group
Scheduled Caste (=1) 4 Dummies for social group Scheduled Tribe (=1) Reference: Others Other Backward Caste (=1) In the NSS, data for OBCs were not available before 2004. Others (General) (reference)
Religion Muslim Muslim = 1 Hindu Other religion = 1 Other religion Reference: Hindu
Age Age Age in years Age squared Age squared as continuous variable
Household size Number of family members Continuous
Region
North 6 Dummies: East East = 1 if West Bengal, Orissa, Andaman and Nicobar Islands West West = 1 if Gujarat, Maharashtra, Goa, Dadra and Nagar Haveli, Daman and Diu South South = 1 if Tamil Nadu, Karnataka, Kerala, Andhra Pradesh, Lakshadweep, Pondicherry NE North-East = 1 if Manipur, Tripura, Arunachal Pradesh, Sikkim, Assam, Meghalaya, Mizoram, Nagaland Central Central (reference) = 1 if Bihar, Jharkhand, Uttar Pradesh, Uttaranchal, Madhya Pradesh, Chattisgarh
NSS Round/
Year
38th round (1983) 6 Dummies for NSS survey rounds 50th round (1993-94) Reference: 38th round 61st round (2004-05) 64th round (2007-08) 66th round (2009-10) 68th round (2011-12)
26
References
Afridi, F., T Dinkelman and K Mahajan. 2016.” Why Are Fewer Married Women Joining the Work Force in India? A Decomposition Analysis over Two Decades” IZA Discussion Paper No. 9722. Accessed December 2016 from http://ftp.iza.org/dp9722.pdf
Agarwal, M., S. Narayanan, and N. Agarwal. 2012. “Organizational Strategies to Combat Stress of Returning Mothers in India – A Critical Analysis.” Proceedings of International Conference on Business Management and IS. http://www.ijacp.org/ojs/index.php/ICBMIS/article/view/93 (accessed September 24, 2015).
Anderson, P. M., and P. B. Levine. 2000. “Child Care and Mother’s Employment Decisions.” in Finding Jobs: Work and Welfare Reform, David Card and Rebecca Blank eds., New York: Russell Sage.
Arpino, B., C. Pronzato, and L. Tavares. 2010. “All in the Family: Informal Childcare and Mothers’ Labour Market Participation.” ISER Working Paper Series 24, Institute for Social and Economic Research, University of Essex.
Basu, A. M., and S. Desai. 2012. “Middle Class Dreams: India’s One-child Families.” Paper presented at 27th Conference of International Union for the Scientific Study of Population (IUSSP), 26- 31 August, Busan, Korea. http://iussp.org/sites/default/files/event_call_for_papers/One percent20child percent20families_IUSSP.pdf (accessed October 20, 2015).
Bhalla, S. S., and R. Kaur. 2011. “Labour Force Participation of Women in India: Some Facts, Some Queries.” Working Paper 40, Asia Research Centre, London School of Economics and Political Science, London.
Buddhapriya, S. 2009. “Work-Family Challenges and Their Impact on Career Decisions: A Study of Indian Women Professionals.” Vikalpa 34 (1): 31-45.
Cackley, A. P. 1990. “Female Migration in Brazil: The Role of Marital Status in the Migration Decisions and Wages of Women.” Ph.D. Dissertation, University of Michigan, Ann Arbor, 1990.
Chatterjee, U., Murgai, R., and M. Rama, M. 2015. “Job Opportunities along the Rural-Urban Gradation and Female Labor Force Participation in India.” World Bank Policy Research Working Paper 7412, World Bank, Washington, DC.
Compton, J., and R. A. Pollak. 2014. “Family Proximity, Childcare, and Women’s Labor Force Attachment.” Journal of Urban Economics 79: 72-90.
Connelly, R., D. S. DeGraff, and D. Levison. 1996. “Women’s Employment and Child Care in Brazil.” Economic Development and Cultural Change 44 (3): 619-656.
Das, M. B. 2005. “Structural Reasons for Muslim Women’s Low Workforce Participation in India” in In a Minority: Essays on Muslim Women in India (Ritu Menon and Zoya Hasan, eds) Oxford University Press
27
Das, M. B. 2006. “Do Traditional Axes of Exclusion Affect Labor Market Outcomes in India?” Social Development Paper 97, World Bank, Washington, DC.
Das, M., and S. Desai. 2003. “Why Are Educated Women Less Likely to Be Employed in India? Testing Competing Hypotheses.” Social Protection Discussion Paper 0313, World Bank, Washington, DC.
Das, S., S. Jain-Chandra, K. Kochhar, and N. Kumar. 2015. “Women Workers in India: Why So Few Among So Many?” IMF Working Paper 15/55, International Monetary Fund, Washington, DC.
Datta, V., and R. M. Konantambigi. 2007. Day Care for Young Children in India. Issues and Prospects. New Delhi: Concept Publishing Company.
Del Boca, D. 2002. “The Effect of Child Care and Part Time Opportunities on Participation and Fertility Decisions in Italy.” Journal of Population Economics 15 (3): 549-573.
Del Boca, D. 2015. “The Impact of Child Care Costs and Availability on Mothers’ Labor Supply.” ImPRovE Working Paper 15/04, Antwerp: Herman Deleeck Centre for Social Policy – University of Antwerp.
Del Boca, D., M. Locatelli, and D. Vuri. 2005. “Child-care Choices by Working Mothers: The Case of Italy.” Review of Economics of the Household 3 (4): 453-477.
Desai and Jain. 1994.Desai, S., & Jain, D. 1994. Maternal employment and changes in family dynamics: The social context of women's work in rural South India. Population and Development Review, 115-136.
Desai, S., A. Dubey, B. L. Joshi, M. Sen, A. Shariff, and R. Vanneman. 2010. Human Development in India: Challenges for a Society in Transition. New Delhi: Oxford University Press.
Deutsch, R. 1998. “Does Child Care Pay? Labor Force Participation and Earnings Effects of Access to Child Care in the Favelas of Rio de Janeiro.” IDB Working Paper 318, Inter-American Development Bank, Washington, DC.
Du, F., and Dong, X. Y. 2010. Women’s labor force participation and childcare choices in urban China during the economic transition. The University of Winnipeg, Department of Economics World Paper Number 4.
Francavilla, F., Giannelli, G. C., and L. Grilli. 2013. “Mothers’ Employment and their Children’s Schooling: a Joint Multilevel Analysis for India.” World Development 41: 183-195.
Glick, P. 2002. Women’s Employment and Its Relation to Children’s Health and Schooling in Developing Countries: Conceptual Links, Empirical Evidence, and Policies. Mimeo Cornell University, September 2002 Accessed December 2016 from http://www.cfnpp.cornell.edu/images/wp131.pdf
Goldin, C. 1994. “The U-shaped Female Labor Force Function in Economic Development and Economic History.” NBER Working Paper Series 4707.
28
Hallman, K., A. R. Quisumbing, M. Ruel, and B. de la Briere. 2005. “Mothers’ Work and Child Care: Findings from the Urban Slums of Guatemala City.” Economic Development and Cultural Change 53 (4): 855-885.
Himanshu. 2011. “Employment Trends in India: A Re-Examination.” Economic and Political Weekly 47 (37): 43-59.
India Census. Various Years. Accessed December 2016 from http://www.censusindia.gov.in/(S(dtszexbs3vui0y55pyjoae55))/Tables_Published/F-Series/f_series_tables_2001.aspx
Institute of Applied Manpower Research (IAMR) and International Labour Organization (ILO). 2013. Low Female Employment in a Period of High Growth: Insights from a Primary Survey in Uttar Pradesh & Gujarat. New Delhi, India: ILO.
Johari, A. 2015. “Women in Corporate India Complain Of another Bump: Getting Back on Track after Maternity Leave.” Scroll.in http://scroll.in/article/718166/women-in-corporate-india-complain-of-another-bump-get-back-on-track-after-maternity-leave (accessed September 24, 2015).
Kalb, G. 2009. “Children, Labour Supply and Child Care: Challenges for Empirical Analysis.” Australian Economic Review 42 (3): 276-299.
Kapoor-Mehta, S., I. Žumbytė, S. Goyal and M. Das. forthcoming. “A good opinion lost? How employer attitudes affect employment of women in regular jobs”. Draft.
Kapsos, S., A. Silberman, and E. Bourmpoula. 2014. “Why Is Female Labour Force Participation Declining So Sharply in India?” ILO Research Paper 10, International Labour Office, Geneva.
Kingdon, G. G. and J. Unni. 1997. “How Much Does Education Affect Women’s Labor Market Outcomes in India? An Analysis Using NSS Household Data.” Working Paper 92, Ahmedabad: Gujarat Institute of Development Research.
Kishor, S. and S. Parasuraman. 1998. Mother’s Employment and Infant and Child Mortality in India. National Family Health Survey Subject Report Number 8 International Institute for Population Sciences Mumbai, India and Macro International. Accessed December 2016 from http://citeseerx.ist.psu.edu/viewdoc/download?doi=10.1.1.495.7290&rep=rep1&type=pdf
Klasen, S., and J. Pieters. 2013. “What Explains the Stagnation of Female Labor Force Participation in Urban India?” IZA Discussion Paper 7597, The Institute for the Study of Labor, Bonn.
Klasen, S., and J. Pieters. 2015. “What Explains the Stagnation of Female Labor Force Participation in Urban India?” Policy Research Working Paper 7222, World Bank, Washington, DC.
Kuhlthau, K., and K. O. Mason. 1996. “Market Child Care versus Care by Relatives.” Journal of Family Issues 17: 561-578.

29
Lahoti, R., and H. Swaminathan. 2015. “Economic Development and Women’s Labor Force Participation in India.” Feminist Economics (1) 28.
Madhok, D. 2015. “What Happened to the Women who Graduated from IITs in the ‘90s?” Quartz India. http://qz.com/424276/what-happened-to-the-women-who-graduated-from-iits-in-the-90s/ (accessed September 24, 2015).
Mahapatro, S. R. 2013. “Declining Trends in Female Labour Force Participation in India: Evidence from NSSO.” Munich personal RePEc Archive Working Paper 44373.
Maurer-Fazio, M., R. Connelly, L. Chen, and L. Tang. 2011. “Childcare, Eldercare and Labor Force Participation of Married Women in Urban China, 1982-2000.” Journal of Human Resources 46 (2): 261-294.
Muñoz Boudet, A. M., P. Petesch, C. Turk, and A. Thumala. 2013. On Norms and Agency: Conversations about Gender Equality with Women and Men in 20 Countries. Washington, DC: World Bank.
National Sample Surveys (NSS). Various years. World Bank household survey database.
Palriwala, R., and N. Neetha. 2011. “Stratified Familialism: The Care Regime in India through the Lens of Child Care.” Development and Change 42 (4): 1049-1078.
Pew Research Center. 2010. “Gender Equality Universally Embraced, but Inequalities Acknowledged.” Washington, D.C. http://www.pewglobal.org/files/2010/07/Pew-Global-Attitudes-2010-Gender-Report-July-1-12-01AM-EDT-NOT-EMBARGOED.pdf (accessed September 30, 2015).
Polanyi, K. 1944. The great transformation: Economic and political origins of our time. Boston: Beacon Hill.
Posadas, J., and Vidal-Fernández, M. 2013. Grandparents’ childcare and female labor force participation. IZA Journal of Labor Policy 2(1): 14.
Probe Team. 1999. PROBE: The Public Report on Basic Education in India. New Delhi: Oxford University Press.
Rangarajan, C., P. I. Kaul, and Seema. 2011. “Where Is the Missing Labor Force?” Economic and Political Weekly 46 (39): 68-72.
Rani, U., and J. Unni. 2009. “Do Economic Reforms Influence Home-Based Work? Evidence from India.” Feminist Economics 15 (3): 191-225.
Registrar General of India. 2014.
Rindfuss, R. R., and K. L. Brewster. 1996. “Childrearing and Fertility.” Population and Development Review 22: 258-289.
Sengupta, A., and P. Das. 2014. “Gender Wage Discrimination across Social and Religious Groups in India.” Economic and Political Weekly 49 (21): 71.

30
Sorsa, P., P. Mares, M. Didier, C. Guimaraes, M. Rabate, G. Tang, and A. Tuske. 2015. “Determinants of the Low Female Labour Force Participation in India.” OECD Economics Department Working Paper 1207, OECD, Paris.
Sudarshan, R. M., and S. Bhattacharya. 2009. “Through the Magnifying Glass: Women’s Work and Labour Force Participation in Urban Delhi” Economic and Political Weekly 44 (48): 59-66.
Thomson Reuters Foundation. 2015. The five key issues facing women working in G20. Accessed Dec 28, 2016, http://www.womenatworkpoll.com/country/?id=india
Tuli, M., and N. Chaudhary. 2010. “Elective Interdependence: Understanding Individual Agency and Interpersonal Relationships in Indian Families.” Culture and Psychology 16 (4): 477-496.
Valk, R., and V. Srinivasan. 2011. “Work–family Balance of Indian Women Software Professionals: A Qualitative Study.” IIMB Management Review 23 (1): 39-50.
Verick, S. 2014. “Female Labor Force Participation in Developing Countries.” IZA World of Labor 87.
Wong, R., and R. E. Levine. 1992. “The Effect of Household Structure on Women’s Economic Activity and Fertility: Evidence from Recent Mothers in Urban Mexico.” Economic Development and Cultural Change 41 (1): 89-102.
World Bank. 2013. Inclusion Matters: The Foundation for Shared Prosperity. Washington, DC: World Bank.
World Bank. 2015a. World Development Indicators. Female Labor Force Participation, Modeled ILO estimate. Retrieved from http://data.worldbank.org/indicator/NY.GNP.PCAP.CD
World Bank. 2015b. Supply and demand for child care services in Turkey: a mixed methods study. Washington, D.C.: World Bank Group. http://documents.worldbank.org/curated/en/114451467999711217/Supply-and-demand-for-child-care-services-in-Turkey-a-mixed-methods-study