the mystery of original sin barry eichengreen, ricardo...
TRANSCRIPT

1
The Mystery of Original Sin
Barry Eichengreen, Ricardo Hausmann and Ugo Panizza*
August 2003
We are grateful to Alejandro Riaño for excellent research assistance.

2
1. Introduction
Previous chapters have shown that inability to borrow abroad in the domestic
currency (�original sin�) is an important factor in the macroeconomic and financial
instability of emerging markets. Indeed, it can be argued that this source of financial
fragility is a defining characteristic that differentiates emerging markets from their
advanced-economy counterparts. Closing the capital account (which forgoes the benefits
of foreign finance), accumulating massive amounts of international reserves (the yield on
which is generally substantially below the opportunity cost of funds), and/or increasing
the country�s reliance on short-term domestic debt at volatile interest rates (substituting
maturity mismatches) are three possible ways of preventing original sin from resulting in
dangerous currency mismatches, but each of these solutions has very significant costs.
Helping emerging markets to acquire the capacity to borrow abroad in their own
currencies should thus be a priority for officials striving to make the world a safer
financial place and at the same time seeking to quicken the pace, sustainability and
resilience of growth.
But defining and implementing appropriate solutions requires first that we
identify the distortion that gives rise to the problem. The economist�s instinctual reaction
is that the inability to borrow abroad in one�s own currency reflects the weakness of
policies and institutions. The bulk of the literature has thus focused on the shortcomings
of borrowing countries, in particular on the underdevelopment of their market-supporting
and policy-making institutions. A number of preceding chapters focus on these usual
suspects, on the instability and imperfect credibility of monetary and fiscal policies, for
example.

3
Yet evidence for the presumption that the incidence of original sin reflects the
instability of policies and the weakness of market-supporting institutions is meager. It is
based more on presumption and anecdote than fact. To our knowledge there exists no
systematic empirical study for a cross section of countries attempting to test the empirical
power of different explanations for original sin.
We seek to provide that systematic analysis here, making use of the indicators of
original sin defined and developed in Chapter 1 above. We present evidence on the
explanatory power of a series of alternative explanations. Our key � and surprising �
finding is that the conventional hypotheses have remarkably little explanatory power for
the phenomenon at hand. In other words, the standard policy and institutional variables
shed remarkably little light on why so many emerging markets find it so difficult to
borrow abroad in their own currencies, and they offer little in the way of an explanation
for why a small number of emerging markets have been able to escape this plight. Some
readers will find the absence of a smoking gun as counterintuitive; this is why we refer in
this chapter to the �mystery� of original sin. We therefore provide an extensive
sensitivity analysis establishing the robustness of our results in the appendix to this
chapter.
These results then prompt us to explore the possibility that the problem of original
sin has at least as much to do with the structure and operation of the international
financial system as with any weaknesses of policies and institutions. As we show,
country size is a robust factor accounting for the incidence of original sin, a fact that is a
telltale sign that economies of scale or network externalities may be at work in explaining
the structure of international finance. Moreover, emerging markets that have achieved

4
redemption from original sin have overcome the obstacles posed by the structure of the
international system only with the help of foreign entities -- multinational corporations
and international financial institutions -- that have found it attractive, for their own
reasons, to issue debt in the currencies of these countries. This observation leads us in
turn to offer in the next chapter a proposal for an international solution to the problem.
2. Original Sin and the Level of Economic Development
In Table 1 we explore the relationship between original sin and the level of
economic development as measured by the log of per capita GDP. We control for country
size and for the groupings across which the incidence of the phenomenon should differ.1
Three relevant dimensions of size are the log of total GDP, the log of total domestic
credit (valued in US dollars) and log of total trade. Table 1 uses the first principal
component of the three measures, which we call SIZE. All equations in the table are
estimated using weighted tobit.
Strikingly, the coefficient on per capita GDP is not significant at conventional
confidence levels. We ran several sensitivity checks to establish the robustness of this
surprising result. For example, we dropped the financial centers, which left the result
unaffected. We could only get a significant effect by dropping the regional dummies, but
this effect is not robust to changing the estimation technique to ordinary least squares.
Moreover, even this result is of limited explanatory power, in that it suggests that GDP
per capita cannot explain the within group difference in original sin.
In contrast to GDP per capita, the other variable included in these equations,
country size, is strongly correlated with original sin even when we control for country

5
groups. Ability to borrow abroad in one�s own currency seems to be heavily
concentrated among large countries.2
The fact that economic development is not strongly correlated with original sin
sets an ominous precedent for what follows. If original sin does not have a robust
relationship with the level of development, then country characteristics that are correlated
with the level of development are also unlikely to explain the variance in original sin.
But, to give these country characteristics their due, we examine a number of them in turn.
3. Monetary credibility
An obvious hypothesis about the causes of original sin is that the phenomenon is a
symptom of inadequate policy credibility, which tends to be a particular problem in
developing countries. This is the approach taken by Olivier Jeanne in Chapter 7, where he
finds that if the central bank is expected to have some low probability of a high burst of
inflation and depreciation, interest rates in pesos will be high. Borrowers will prefer to
denominate their obligations in dollars and go bankrupt in the event of the inflationary
crisis, rather than borrowing in pesos and going bankrupt because of high interest rates, if
the crisis is avoided. Moreover, as argued by Tirole (2002), foreigners will take account
of the fact that the government has less of an incentive to protect their property rights and
may choose to inflate away their claims if they denominate them in a unit that they can
manipulate. They will lend only in foreign currency, which is protected against inflation
1 As suggested by the evidence in chapter 2. 2 We have more to say about this below.
6
risk, or at short maturities, so that interest rates can be adjusted quickly to any
acceleration of inflation.
In this view, original sin is not a problem in itself; it is more of a symptom. It is
the miner�s canary, signaling the presence of weak institutions. Redemption can then be
achieved by pursuing institutional changes that enhance the authorities� anti-inflationary
credibility. The political and economic independence of the central bank should be
strengthened. Fiscal policy making should be centralized and rendered more transparent
and accountable, so as to make inflationary finance superfluous. Political support for
policies of price stability should be cultivated. The country should accumulate a track
record and develop a reputation for maintaining price stability. According to this view,
the standard advice given by the IMF and World Bank regarding macroeconomic policies
and institutional reforms is both necessary and sufficient for redemption from original
sin.
Unfortunately, there are problems with this easy conclusion. If inadequate anti-
inflationary credibility is the cause of original sin, then it should be possible to achieve
redemption simply by issuing inflation-indexed debt (Chamon, 2002) .3 Yet we do not
see very many countries able to issue internationally inflation-indexed debt in their own
currencies. In addition, while only governments have the capacity to inflate away debts
denominated in their own currency, corporations in many emerging markets also find
3 Tirole (2002) argues that governments could still attempt to influence the real exchange rate. However, the ability of the government to influence this relative price in a sustained manner is questionable and the political case for doing it is less compelling.

7
themselves unable to borrow abroad in that currency, despite the fact that this moral
hazard, to the extent that it even exists, is more indirect.4
We explore the cross-country correlation between original sin and monetary
credibility in Table 2. As a metric of monetary credibility we take different measures of
inflation for the 1980-1998 period. We regress these measures on OSIN3 after controlling
for country groupings and size. Again, we use tobit to estimate these equations. In
column 1 we use the average value of the log of inflation and find a positive but not
statistically significant relationship. In column 2, we substitute average inflation with the
log of maximum inflation over the period and find no significant relationship with
original sin. To test potential non-linearities in the relationship between inflation and
original sin we use in column 3 both the average log inflation and its square. We find that
none of the coefficients are significant. Column 4 uses the principal component of
average inflation and maximum inflation and finds no significant correlation with
original sin. The results are unchanged if we drop financial centers (column 5). Only if
we drop the country group dummies, inflation becomes statistically significant (column
6). But even this relationship seems to be driven by a few high inflation countries
(Figure 1). Thus, while inadequate anti-inflationary credibility may help explain the
inability of a few chronic high-inflation sufferers to borrow abroad in their own currency,
it cannot explain the extremely widespread nature of the phenomenon.
4 To explain this, Chamon (2002) and Aghion, Bacchetta and Banerjee (2001) argue that the existence of a positive correlation between default risk and devaluation risk means that the claim of dollar lenders on the residual value of a firm goes up relative to those that lend in domestic or CPI-indexed debt. Under these conditions, peso lenders will fear the contingent expropriation implied by future additional dollar borrowing by firms.

8
It could be argued that the estimated coefficient is attenuated by endogeneity. If
the debt is in dollars, the benefits from inflation are low. This would imply that original
sin causes low inflation and this reverse causation lowers the value of the estimated
coefficient. To deal with this problem we run an instrumental variable regression, using
as our instrument the Cukierman (1995) index of central bank independence. Equation 7
runs the same equation as (1) but for the sample for which we have the Cukierman index.
Equation (8) runs the instrumental variables regression on this sample (we use tobit in the
second stage). The estimated coefficient is now higher but still not significant. While this
suggests that endogeneity could be the cause of the weak relationship, even the
instrumental variables estimates do not provide any strong evidence for the fact that
original sin is significantly correlated with past inflation. It should also be noted, that we
use the 1980-1998 period to give inflation the maximum chance to explain original sin.
Had we presented the same equations using only the inflation in the 1990s, we would
have found even weaker results.
4. Fiscal Solvency and Original Sin
Other theories put greater emphasis on fiscal stories. The argument is that a
government that has weak fiscal accounts will have an incentive to debase the currency in
order to erode the real value of its obligations (Lucas and Stokey, 1983, Calvo and
Guidotti, 1990). The solution is to index the debt to some real price or to issue short-term
debt so as to increase the cost of eroding the debt with inflation.
We explore the relationship between original sin and fiscal fundamentals in Table
3. Equations 1, 2 and 3 use, alternatively, the debt-to-GDP ratio, the average deficit, and
9
the debt-to-revenue ratio. Equation 4 uses the principal component of these three
measures. While in a few cases we find a negative relationship between measures of
original sin and fiscal fundamentals, that relationship is never even close to being
significant at conventional confidence levels. Note that countries with more original sin
have less public indebtedness.
Following our findings in Chapter 2, there may be reason to worry about reverse
causality. Original sin lowers credit ratings � for any given level of debt � by making
debt service more uncertain. This limits the ability to accumulate debt and may cause an
attenuation bias in our estimates. Hence, we may be finding a negative result that is in
fact expressing the impact of original sin on the ability of governments to accumulate
debt, not the impact of public indebtedness on original sin. To address this possible
source of reverse causality we again employ an instrumental variable approach, where we
use the proportion of the population over 65 as an instrument for the fiscal fundamental.
The results are presented in equation 6; the key findings are unaffected.
Thus, we find no traction for fiscal interpretations of the causes of original sin.
There is little association of original sin with obvious fiscal fundamentals such as the
level or persistence of public debts and deficits. Indeed, one can point to any number of
emerging markets that have successfully maintained low inflation, avoided large budget
deficits, and followed international guidelines for the efficient design of their monetary
and fiscal institutions � Chile is a case in point for Latin America, while Korea is a good
example for Asia � but are nonetheless chronically unable to borrow abroad in their own
currencies.

10
5. The Strength of Institutions
It is sometimes argued that investors are reluctant to lend to governments and
corporations where the institutions designed to enforce their claims are weak or
unreliable and there is a significant danger of debt repudiation. Chamon (2002) and
Aghion, Bacchetta and Banerjee (2001) present a model in which when a company
defaults, its assets are distributed among the creditors in proportion to their nominal
claims on it. If depreciation and default risk are correlated, then domestic currency
lenders will likely see a double decline in the value of their claims when a default occurs:
they will receive a portion of the residual value of the company which will be diminished
by the concomitant depreciation. If all lending takes place simultaneously, domestic
currency lenders will charge for this effect. However, if lending takes place sequentially
firms will have an incentive to increase the proportion of foreign currency lending in
order to transfer part of the residual value of the defaulted company from old domestic-
currency lenders to new foreign-currency investors. In anticipation of this, the domestic
currency market will disappear. This mechanism can be overcome if bankruptcy courts
can enforce complicated contracts that for example, distinguish between creditors of
different seniority. But if these contracts are infeasible, then domestic currency lending
may be affected.
To test this hypothesis, we study the relationship between original sin and a measure
of rule of law (RULEOFLAW), drawn from Kauffman et al. (1999) that should proxy for
the quality of contract enforcement. Table 4 shows that the relationship between
institutional quality and original sin is neither statistically nor economically significant.
Using instead the La Porta et al. (1997) index of creditor rights yield similar results,

11
although the sample size is more limited in this case. These negative findings are not
entirely surprising, given the fact that these indexes of institutional quality are strongly
correlated with the level of development which we found (in Table 1) to have only a
weak relationship with original sin.
6. Trade Links
It can be objected that what matter are not institutions, which can always be
changed, at some cost, but the fundamental incentives for respecting one�s contractual
obligations. In terms of respecting the claims of foreigners, it can be argued that
countries that trade heavily with their creditors have an incentive to meet their contractual
obligations because failing to do so will provoke commercial retaliation or at minimum
interrupt the supply of trade credits. This was the insight of the early Eaton and
Gersovitz (1981) model of sovereign lending in the presence of potential repudiation,
where lending could be supported only in the presence of potential trade sanctions with
output costs. Exponents of this view point to Argentina in the 1930s, which was one of
the only Latin American countries to stay current on its debts, something that is
commonly explained by its exceptional dependence on the British export market and the
threat of tariff retaliation (Diaz-Alejandro 1984). More recently, Rose (2002) has shown
that borrowing countries that default on their debts in practice suffer a significant
reduction in trade with their creditors. Rose and Spiegel (2002) show further that
borrowers with economically consequential trade links to their creditors are significantly
more likely to service their debts.

12
This story linking the threat of trade sanctions to the credibility of financial
policies is appealing to the extent that it suggests that current account liberalization
provides an automatic solution to the problems posed by capital account opening.
However Table 5 finds no correlation between the incidence of original sin and the
standard measure of trade openness (exports as a share of GDP). The result is unchanged
if we drop financial centers and is robust to additional sensitivity tests.5
This result should not surprise us. Trade may explain the absence of opportunistic
defaults and the existence of debt markets, but it is hard to see why it should affect the
denomination of those debts, per se. Trade sanctions can be imposed whether debt is
denominated in the domestic or the foreign currency. And, if the presence or absence of
the potential for such sanctions is what determines ability to borrow, then we should also
see punishments meted out to countries that denominate their debt in their own currencies
but then depreciate the exchange rate, thereby eroding the value of creditors� claims. But,
in practice, we do not observe countries that issue in their own currency being punished
when the exchange rate weakens. In the last 30 years we have seen large trend or cyclical
depreciations in many of the countries that suffer least from original sin: Australia,
Canada, New Zealand, the UK and South Africa, to name five. In practice, these
depreciations have not triggered either trade or credit sanctions.
5 The results are also robust to dropping two outliers (Singapore and Suriname).

13
7. Political Economy Explanations
It can be argued that what is required to induce governments to respect the value
of the local currency (and of financial liabilities denominated therein) is a domestic
constituency of local-currency debt holders prepared to penalize a government that
debases the currency. If the median voter holds sovereign bonds, a government will
suffer political sanctions if it defaults opportunistically or inflates away the value of the
principal. By contrast, if foreigners are the main holders of public and private debts (the
argument continues), then there is likely to be a larger domestic political constituency in
favor of weakening the value of their claims. Foreign creditors, no fools they, will be
reluctant to lend in local currency unless protected by a large constituency of local savers.
This is the logic behind Tirole (2002): lending in the currency of the borrower is deterred
by a form of sovereign risk arising from the fact that the government cannot commit to
protect the rights of foreigners whose welfare it does not value. Redemption can therefore
be achieved by developing domestic financial markets.
Our crude measure of these influences is the size of the domestic financial system,
proxied alternatively by domestic credit normalized by GDP (DC_GDP), the ratio
between foreign liability (measured as the sum of bank claims and securities from the two
BIS databases described above) and domestic credit (FOR_DOM), and an index built
using the principal component of the previous two variables (SIZE_FIN). The theory

14
predicts that original sin should exhibit a negative correlation with DC_GDP, a positive
correlation with FOR_DOM and a negative correlation with SIZE_FIN.6
Table 6 shows that the relationship between size of the financial system and
original sin is not statistically significant in the case of DC_GDP and it is statistically
significant but with the wrong sign in the case of FOR_DOM. This is in part due to the
fact that Luxembourg is an outlier in this sample. If we drop it (equation 6) the
coefficient of FOR_DOM becomes positive but not statistically significant.
Even if there existed a relationship between original sin and size of the domestic
financial system, there would still be the question of what governments can do to
promote the development of a large constituency of domestic bondholders.7 Conceivably,
they could create a constituency of investors in long-term domestic-currency-
denominated debt at one fell swoop by using force majeure to change the currency
denomination of existing claims or eliminating from existing contracts provisions
indexing principal and interest to the exchange rate. Something along these lines occurred
in the United States in 1933, it is argued, when Franklin Delano Roosevelt disregarded
the gold clauses in U.S. government and corporate bonds in 1933 on devaluing the dollar
and his decision was upheld by the Supreme Court. Doing so did not demoralize the bond
markets because the economy�s improved growth prospects (with their positive
implications for the debt-servicing capacity of borrowers) more than outweighed the
effects of the dilution of investor rights (Kroszner 1999).
6 Since DC_GDP and FOR_DOM are supposed to have opposite effect on Original Sin SIZE_FIN was contructed with the negative of FOR_DOM. 7 There is also the problem that our measure of the size of the financial system does not capture the size of the domestic currency market. Countries may have a large, but dollarized, domestic financial system. Section 9 focuses on this issues and attempts at estimating what determines domestic original sin.
15
Whether a similar forced conversion would in fact reassure investors in emerging
markets today is another question.8 The problem with this argument is that it implies the
traditional trade-off between the positive effects associated with a more sustainable debt
achieved through force majeure and the negative reputational effects related to tampering
with the sanctity of contracts. Investors may react negatively if the second effect
dominates and become even more reluctant to absorb new debt issues on the margin. The
policy would then be counterproductive from the point of view of �redemption�, i.e. of
being able to have sustained market access in local currency going forward. 9
Another approach, less likely to alarm investors but also less capable of delivering
immediate results, would be to require banks, pension funds, and the social security
system to hold long-term, domestic-currency-denominated, fixed-rate debt. The
government could require the banks to hold domestic-currency-denominated bonds as
reserves. It could privatize the social security system and require pension funds to hold a
specified share of the retirement portfolios in such bonds. But, to the extent that the
government has the strength to promulgate such regulations � in effect, to twist the arms
of these individuals and institutions � the individuals and institutions in question will
presumably lack the leverage to throw a government engaging in opportunistic debt
management policies out of office. Hence other investors may lack assurance that there
exists an effective class of domestic stakeholders to constrain opportunistic policy.
8 To some extent the Argentine forced pesification of dollar claims bares some similarity with the US 1933 experiment. It involved allowing the currency to depreciate while limiting the wealth effects associated with the dollar-linked (instead of gold-linked) assets. 9 Why this contradiction was not more demoralizing in 1933 is an interesting issue that would reward further study.
16
Not everyone will be convinced by this critique; they will argue that emerging
markets should emulate the policies of financial repression used by Western European
governments after World War II.10 There, strict capital controls and tight restrictions on
the currency composition of newly issued debt securities succeeded in forcing residents
to hold long-term domestic-currency-denominated bonds by offering them few
alternative funding or investment opportunities, accelerating the creation of a domestic
investor constituency. But, even in postwar Europe, a quarter of a century and more was
required before those controls could be removed and foreign investors could be enticed
into absorbing significant volumes of domestic issues. Financial repression is no quick
fix, in other words. And, again, this approach � encouraging the development of some
markets by suppressing the operation of others � may be regarded by investors as
disturbingly contradictory and inconsistent.
Evidence from emerging markets suggests that these considerations may in fact
be at work and that capital controls may help the development of long term fixed rate
domestic markets in local currency but prevent the international acceptance of local
currency debt obligations. Recall from Chapter 1 that we were able to identify virtually
no countries that can borrow abroad in local currency but which has no long-term fixed-
rate domestic markets, suggesting that domestic market development is a necessary
condition for redemption from original sin. However, that analysis also suggested that it
is not a sufficient condition: we found a number of countries that suffer from
international original sin while having �achieved redemption� on the domestic front.
Hausmann and Panizza (2003) explore different potential explanations to distinguish
10 See for example Wyplosz (2001).

17
between these three groups of countries. Their most robust result relates to the role of
capital controls. The 7 countries that have been able to develop their domestic market but
still lack the capacity to borrow abroad in their own currency have levels of capital
control that are much higher than the countries in the two other quadrants (the difference
is always statistically significant at the 10 percent confidence level). This evidence is
suggestive of the idea that capital controls facilitate the development of domestic
markets, explaining why capital controls are higher in the countries located in the fourth
quadrant vis a vis the countries located in the second quadrant. However, while in place,
they hinder the capacity to use that currency in international borrowing, explaining thus
the difference between the countries in the third quadrant and the countries in the fourth
quadrant.
This pattern is clearly reminiscent of the European experience mentioned above.
It is also suggestive of the importance given by Bordo, Meisner and Redding in Chapter 5
to the World Wars in their impact on the development of domestic markets in the British
Dominions.
As a policy prescription this approach is likely to be especially problematic in
low-income countries where there exists only a limited pool of domestic savings and
domestic market liquidity is limited. Limiting foreign participation could be particularly
onerous. Moreover, the smaller the market, the less likely are foreign investors to
willingly hold debt securities denominated in the currency in question. (In fact, precisely
the same logic applies to residents.) This observation is key: it points to where to look
for the causes � and the solution � to original sin.

18
8. Putting Things Together
To this point we have tested the various theories of original sin one at a time and
only found a strong correlation between original sin and country size, along with a
somewhat weaker correlation between original sin and past inflation and original sin and
the level of development. We now jointly test the theories by running a set of multivariate
regressions that include explanatory variables for all theories.
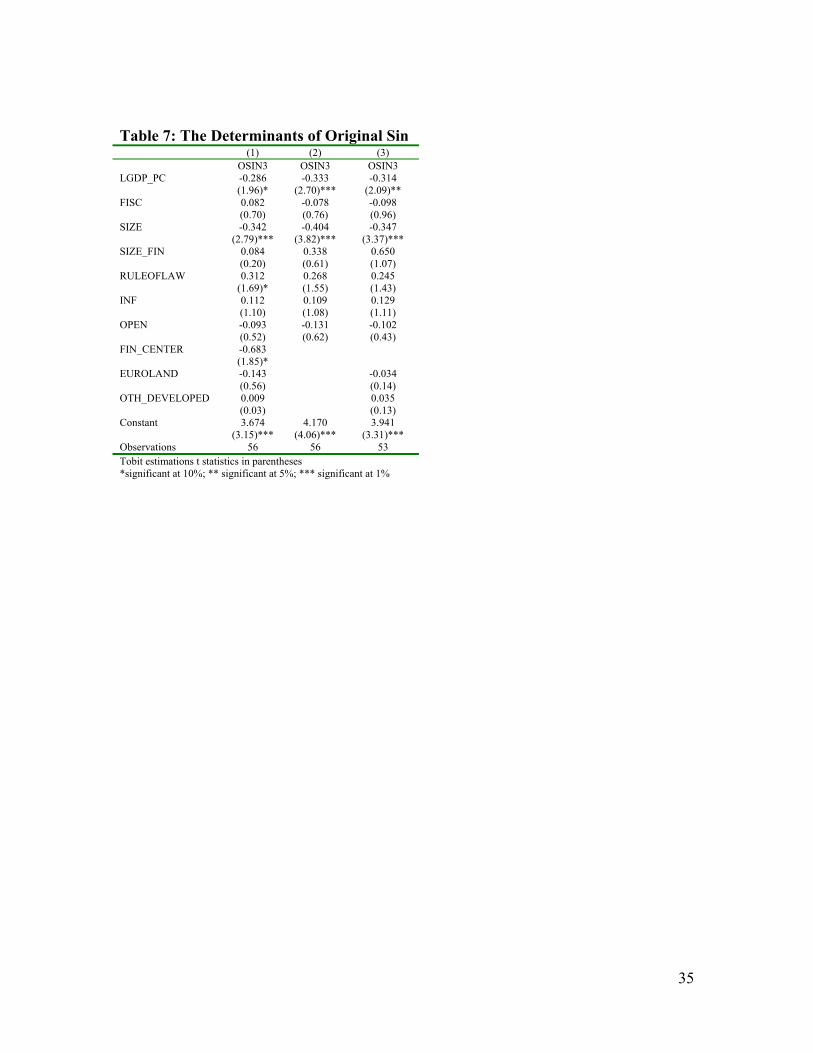
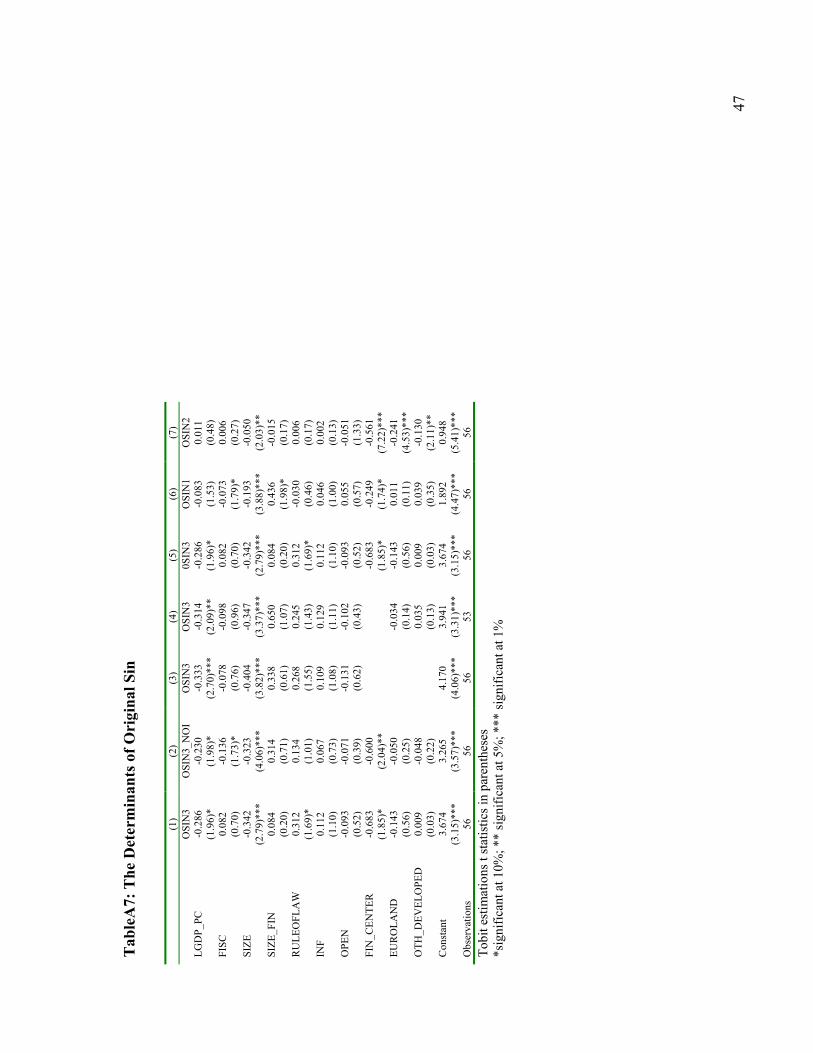
Table 7 reports a set of regressions that do and do not control for country groups
and financial centers. In the appendix, we also consider a measure of original sin that
excludes debt instruments issued by international organizations (OSIN3_NOI). The
results are basically unchanged: again, the only robust determinant of original sin is
country size. In some specifications, the level of development also appears statistically
significant (but economically small), but this result is not robust changes in measures of
original sin or estimation techniques. . As shown in the appendix, GDP per capita is not
significantly correlated with OSIN1 and OSIN2. Moreover, the correlation between GDP
per capita and OSIN3 is not robust to using weighted OLS with robust t statistics instead
of weighted tobit. Of the variables considered, only country size appears to be truly
robust.
9. International Causes
What accounts for the concentration of the world�s portfolio in few currencies and
for the fact that it is mainly large countries that seem to be able to issue foreign debt in
their own currencies? Obviously, each additional currency adds opportunities for
diversification, but with decreasing marginal benefits. At the same time, however, each

19
currency also adds costs and risks. In a world with transactions costs, the optimal
portfolio will have a finite number of currencies. The fact that few currencies survive is
indicative that with each additional currency, the benefits of diversification fall faster
than the costs.11
Imagine the following situation. There are two countries: one has N trees while
the other has 1 tree. All trees are identical in their expected income and its variance; the
large country just has more of them. Shocks to each tree are uncorrelated. Assume that
the exchange rate moves with the realization of relative output. If there were no
transactions costs of investing abroad, then it would be optimal to hold a globally
diversified portfolio: the large country would invest 1/(N+1) of its wealth in the small
country, while the latter would invest N/(N+1) in the large country. Now introduce costs
to international transactions. If all countries were of size 1, then the presence of
transaction costs would not affect the composition of the world portfolio. But if country
size differs, then the benefits of international diversification will be greater for the small
country than for the large one. There will be less appetite in the large country to hold the
currency of the small country, while there will still be a large appetite for the small
country to hold the assets of the large one. This is to say, large countries offer significant
diversification possibilities, while small countries do not. If the transaction costs
associated with international diversification are the same for investors in both countries,
then the world will choose to invest in a few large currencies. Notice that this is through
11 This is especially true if the additional currency exposes the investor to concentrated risks. Note that in making this argument we are paralleling the literature on portfolio diversification with transactions costs, in which it is shown that optimizing investors, faced with transactions costs, will include only a limited number of securities in their portfolios, balancing the diversification benefits of adding an additional

20
no fault of the small country, but a consequence of the existence of cross-border costs and
asymmetries in size and diversification.
An implication of this view is that even if we identify characteristics that have
allowed a few small countries to issue debt in their own currencies � say, like South
Africa, New Zealand or Poland � it would be a fallacy of composition to assume that, if
other small countries acquired those same characteristics, then they would all make it into
the world portfolio. Each successful country may limit the chances of the others, given
the declining marginal benefits of diversification.
A further implication of this approach is that country size matters for original sin.
Large countries have an advantage in shedding original sin because the large size of their
economies and currency issue makes it attractive as a component of the world portfolio.
In contrast, the currencies of small countries add little diversification benefits relative to
the additional costs they imply.
We explore this hypothesis further in Table 8. There we use three entirely
different measures of size: the log of total GDP, the log of total domestic credit (valued in
US dollars), and the log of total trade, in addition to again constructing the first principal
component (SIZE, as in previous tables). We also control for country groupings.
Equation 1 presents the regression with just the country groupings dummy. In equations 2
to 4 we use alternatively our three different measures of size. Equation 5 uses the
principal component of the three measures, as in the previous tables. In equations 6 and 7
we test for robustness with respect to dropping the financial centers and not controlling
for country groupings.
currency, which decline on the margin, against the transactions costs of purchasing additional securities,

21
The results show that all measures of size are robustly related to original sin. The
relationship between original sin and size is also economically important: the effects of
SIZE in Table 7 account for more than half of the difference in original sin between
developed and developing countries.12
SIZE can explain why large countries like the US and Japan do not suffer from
original sin. But what about Switzerland and, for that matter, the UK? Note that the
financial-center dummy in the equations in Table 9 remains large and significant even
after controlling for country size. This is another way of saying that the UK and
Switzerland are immune from the problem. But if becoming a financial center is
evidently another way of shedding original sin, this is much easier said than done.
Countries that either are or were major commercial powers (e.g. the US and Japan today,
Britain in the past) clearly have a leg up; the developing countries are not major
commercial powers, by definition. In addition, some countries have been able to gain the
status of financial centers as a quirk of history or geography (e.g. Switzerland, a
mountainous country at the center of Europe which was hard to take over and also small
enough to retain its neutrality, became a convenient destination for foreign deposits).
Network externalities giving rise to historical path dependence have worked to lock in
their currencies� international status: once the Swiss franc was held in some international
portfolios and used in some international transactions, it became advantageous for
additional investors and traders to do likewise. And because Britain was the world�s
leading industrial, trading and lending nation once upon a time, sterling acquired its
position as a prominent currency for the denomination of international claims, a luxury
which may not.

22
that the country enjoys to this day, albeit to a lesser and declining extent. These
observations are related to the literature on the determinants of key currency status
(Kiyotaki, Matsuyama and Matsui 1992), which explains the dominance of a small
number of currencies in international markets as a function of network externalities and
transactions costs. This literature does not deny that additional countries cannot gain
admission to this exclusive club, but it suggests that they face an uphill battle.
All this suggests that the global portfolio is concentrated in a very few currencies
for reasons largely beyond the control of the excluded countries.
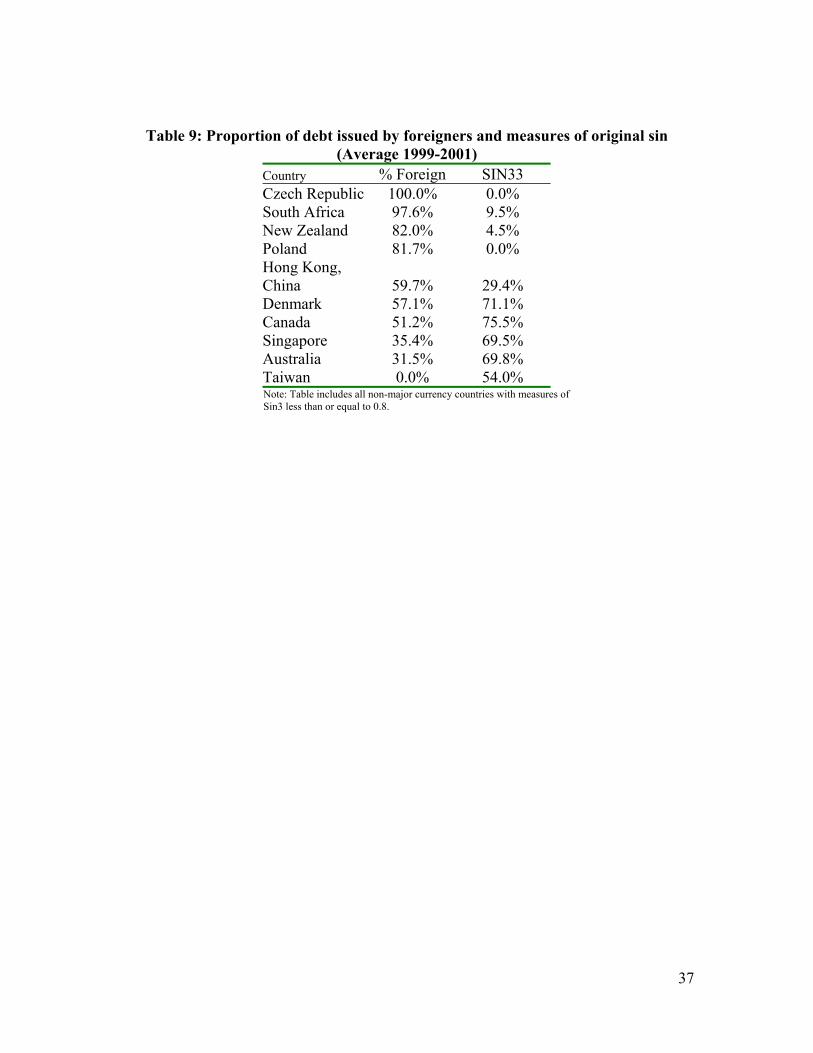
11. Lessons from Outliers
An interesting fact about the international issuance of bonds in exotic currencies
is that it is done mostly by non-residents. Table 9 presents data on the proportion of local
currency debt issued by foreigners in the non-major currency countries that have original-
sin OSIN3 ratings below 80 percent. As the table shows, over 80 percent of the cross-
border debt issued in the currencies of a number of these countries -- Poland, New
Zealand, South Africa and the Czech Republic -- was issued by foreigners. (See Figure
2). The proportion exceeds half of total issuance in the cases of Canada and Denmark.
Why would non-residents issue debt denominated in exotic currencies? Consider
the following case. The Inter-American Development Bank (IDB) has issued debt in New
Zealand dollars, in Greek drachmas and in Russian rubles, despite the fact that none of
these countries is a member of the Bank and their well-being is not a goal of the
institution. The reason is that the investment banks underwriting the IDB issue are able to
12 We also find that size is also significant in a sub-sample of developing countries.

23
swap the debt-service obligation back into U.S. dollars in such a way that the net cost of
borrowing for the IDB, inclusive of the swap, is less than or equal to the opportunity cost
of borrowing directly in U.S. dollars.
The investment bank is able to offer this swap because there are scarce
opportunities to hedge the currency mismatch; hence investors there are willing to pay a
premium for the privilege. Borrowers with foreign currency liabilities are willing to pay
for the swap to entice otherwise indifferent foreigners to issue internationally in local
currency.
Why the market favors this structure is an interesting question. One possibility is
that the markets value the ability to separate currency and credit risk. While the local-
currency debt issued by emerging market residents has both currency and credit risk and
the dollar debt issued by emerging market residents has only credit risk, the debt issued
by an international financial institution has only currency risk (and a small, uncorrelated
and well priced credit risk). Markets may prefer to separate these risks in order to
facilitate the pricing of risk and thus facilitate the development of market liquidity. In
addition, if there is a positive correlation between default and devaluation risk, as is likely
in potential sufferers of original sin, an instrument that has both sources of risk may be
inefficient in the sense that it will have each source of risk plus twice the covariance
between them. Under these conditions, the market may prefer to have those two risks in
separate instruments in order to get rid of the covariance term. The IFIs are particularly
well placed to issue bonds that have the currency risk without the country�s credit risk.
In fact, the international financial institutions (IFIs) have played a very significant
role in the international bond issuance in exotic currencies (see Table 10). The IFIs issued

24
almost half of all internationally-placed bonds in exotic currencies in the period 1992-98.
This includes countries like the Czech Republic, Portugal, Spain and South Africa. In the
more recent period, the relative participation of IFIs in these currencies has declined as
the market has found its footing, but it has increased in other newer entrants such as
Estonia, Taiwan and Trinidad and Tobago.
12. Conclusion
In attempting to understand the causes of original sin, this chapter has started by
rounding up the usual suspects. These shady characters turn out to have convincing
alibis. There is little systematic support for the view that the inability of emerging
markets to borrow abroad in their own currencies reflects the instability and imperfect
credibility of monetary and fiscal policies. There is little evidence that it reflects the
weakness of their market-supporting institutions, due to the manipulability of their
institutions of contract enforcement or an unfavorable constellation of political economy
forces. In a sense this is not surprising. The quality of monetary and fiscal policies and
the development of market-supporting institutions vary enormously across countries.
Contrast Chile with Venezuela, for example, or Korea with Indonesia. But while the
quality of institutions and policies varies enormously, original sin is very widespread; it is
all but universal in the developing world. Even emerging markets that have made major
investments in strengthening their policies and institutions have made relatively little
headway in redeeming themselves from original sin.
The widespread nature of original sin leads us to search for a source in the
structure and operation of the international financial system. To be clear, we are not

25
arguing that country policies are irrelevant. Strong policies and institutions at the
national level are clearly necessary to escape the problem. But they may not be sufficient
over the horizon relevant for practical policy decisions. Even countries with strong
policies and institutions apparently find it difficult to infiltrate their currencies into
international investment portfolios. On reflection, it is not hard to see why. Both theory
and evidence suggest that international portfolio diversification eventually encounters
diminishing returns. And, even in the era of modern information technology, there will
be significant costs to managing a portfolio of many exotic currencies that are obligations
of small economies, each with its own distinctive politics and circumstances. This
suggests that developing countries and their currencies, which are latecomers to the
international financial game, face an uphill battle when attempting to add their currencies
to the international portfolio. They do not enjoy first-mover advantages � to the contrary.
In turn, this suggests that the problem of original sin can more readily be addressed by an
international initiative that heightens the attractions of these currencies for international
investors. We propose one such initiative in the next chapter.

26
References
Aghion, Philippe, Philippe Bacchetta, and Abhijit Banerjee (2000), "Currency Crises and Monetary Policy in an Economy with Credit Constraints," mimeo, University College, London.
Calvo, Guillermo and Pablo Guidotti (1990), �Indexation and the Maturity of Government Bonds: An Exploratory Model,� in Rudiger Dornbusch and Mario Draghi (eds), Public Debt Management: Theory and History, Cambridge: Cambridge University Press, pp.52-82.
Chamon, Marcos (2001) "Why Can't Developing Countries Borrow from Abroad in their Own Currency," unpublished manuscript, Harvard University.
Corsetti, Giancarlo and Bartosz Mackowiak (2002) "Nominal Debt and Currency Crises," unpublished manuscript, Yale University.
Cuikerman, Alex (1995), Central Bank Strategy, Credibility and Independence, Cambridge: MIT Press.
Diaz-Alejandro, Carlos (1984), �Stories of the 1930s for the 1980s,� in Pedro Aspe Armella, Rudiger Dornbusch and Maurice Obstfeld, Financial Policies and the World Capital Market, Chicago: University of Chicago Press, pp.5-40.
Eaton, Jonathan and Mark Gersovitz (1981), �Debt with Potential Repudiation: Theoretical and Empirical Analysis,� Review of Economic Studies 48, pp.289-309.
Jeanne, Olivier (2002) "Monetary Policy and Liability Dollarization," unpublished manuscript, International Monetary Fund.
Kaufmann, D., A. Kraay and P. Zoido-Lobaton, 1999, �Aggregating Governance Indicators,� World Bank Policy Research Working Paper 2195.
Kiyotaki, Nobu, Kiminori Matsuyama and Akihiko Matsui (1992), �Toward a Theory of International Currency,� Review of Economic Studies 60, pp.283-307.
Kroszner, Randall (1999), �Is it Better to Forgive than to Receive? Evidence from the Abrogation of the Gold Clauses in Long Term Debt During the Great Depression,� unpublished manuscript, Graduate School of Business, University of Chicago.
La Porta, Rafael, Florencio Lopez-de-Silanes, Andrei Shleifer, and Robert Vishny (1997) "Legal Determinants of External Finance" Journal of Finance 52, pp. 1131-1150.
Lucas, Robert and Nancy Stocky (1983), �Optimal Fiscal and Monetary Policy in an Economy Without Capital,� Journal of Monetary Economics 12, pp.55-93.
27
Rose, Andrew (2002), �One Reason Countries Pay Their Debts: Renegotiation and International Trade,� NBER Working Paper no.8853.
Rose, Andrew and Mark Spiegel (2002), �A Gravity Model of Sovereign Lending: Trade, Credit and Default,� unpublished manuscript, University of California, Berkeley and Federal Reserve Bank of San Francisco.
Tirole, Jean (2002) "Inefficient Foreign Borrowing," Invited Lecture, LACEA 2002.
Wyplosz (2001), �Financial Restraints and Liberalization in Postwar Europe,� Financial Liberalization: How Far? How Fast? in Gerard Caprio, Patrick Honohan and Joseph Stiglitz (eds), Cambridge: Cambridge University Press.

28
Table 1: Original Sin and economic development (1) (2) (3) OSIN3 OSIN3 OSIN3 LGDP_PC -0.141 -0.128 -0.170 (1.59) (1.43) (2.99)*** SIZE -0.310 -0.310 -0.415 (3.37)*** (3.33)*** (4.51)*** FIN_CENTER -0.680 (1.99)* EUROLAND -0.126 -0.152 (0.62) (0.74) OTH_DEVELOPED 0.007 -0.021 (0.03) (0.10) Constant 2.522 2.414 2.833 (3.39)*** (3.24)*** (5.46)*** Observations 75 71 75 t statistics in parentheses (tobit estimations) *significant at 10%; ** significant at 5%; *** significant at 1%

29
Table 2: Original sin and monetary credibility (1) (2) (3) (4) (5) (6) (7) (8) Dropping
Financial centers
OLS same sample as 8
Instrumental
Variables OSIN3 OSIN3 OSIN3 OSIN3 OSIN3 OSIN3 OSIN3 OSIN3 AV_INF 0.306 0.436 (1.19) (0.69) AV_INF2 -0.116 (0.23) MAX_INF 0.067 (0.95) INF 0.085 0.083 0.175 0.022 0.314 (1.09) (1.07) (2.08)** (0.35) (1.13) SIZE -0.318 -0.318 -0.316 -0.318 -0.318 -0.503 -0.323 -0.319 (3.57)*** (3.54)*** (3.52)*** (3.55)*** (3.50)*** (5.75)*** (4.27)*** (4.30)*** FIN_CENTER -0.866 -0.897 -0.857 -0.881 -0.603 -0.550 (2.88)*** (2.99)*** (2.83)*** (2.93)*** (2.77)*** (2.52)*** EUROLAND -0.304 -0.329 -0.296 -0.315 -0.318 -0.360 -0.312 (2.12)** (2.31)** (1.99)* (2.21)** (2.21)** (2.80)*** (2.39)** OTH_DEVELOPED -0.199 -0.224 -0.192 -0.211 -0.213 -0.207 -0.155 (1.47) (1.67)* (1.37) (1.56) (1.57) (2.15)** (1.52) Constant 1.277 1.310 1.259 1.346 1.347 1.358 1.321 1.233 (10.87)*** (11.60)*** (8.83)*** (13.56)*** (13.46)*** (13.41)*** (14.07)*** (10.29)*** Observations 74 74 74 74 70 74 33 33 t statistics in parentheses (tobit estimations), the instrument for column 8 is Cukierman�s index of Central Bank Independence *significant at 10%; ** significant at 5%; *** significant at 1%

30
Figure 1: Original Sin and inflation
e( O
SIN
3 | X
)
e( AV_INF | X )-.246179 1.48963
-.893699
.363081
BRB
BHROMN
MLTBHSCYPPNGJOR
LUX
MUS
TTO
TUNMAR
SGPFIN
LKAGTM
PAK
AUT
DNK
MDA
SLV
NOR
CHE
CZE
THA
BEL
NET
SWE
AUS
SVN
ZWECAN
DOM
SVK
PHL
ISLJAM
KOR
IND
PRT
DEUJPN
ESP
FRAZAF
HUN
GBR
IDN
CRI
CHLGRC
ITA
USA
EST
SUR
COL
ECULVA
VEN
URY
MEX
POL
ISR
BGR
TUR
BOL
ROMKAZ
PER
RUS
ARG
NIC
UKR

31
Table 3: Original Sin and Fiscal Sustainability (1) (2) (3) (4) (5) (6) OSIN3 OSIN3 OSIN3 OSIN3 OSIN3 OSIN3
IV Estimations
DE_GDP2 -0.073 (0.50) DEFICIT 1.777 (0.92) DE_RE2 0.014 (0.24) FISC -0.025 -0.024 -0.061 (0.30) (0.28) (0.22) SIZE -0.350 -0.327 -0.354 -0.342 -0.345 -0.124 (3.71)*** (3.52)*** (3.51)*** (3.42)*** (3.40)*** (2.17)** FIN_CENTER -0.825 -0.926 -0.816 -0.839 -0.736 (2.72)*** (3.09)*** (2.57)** (2.66)** (4.12)*** EUROLAND -0.344 -0.361 -0.327 -0.348 -0.348 -0.149 (2.61)** (2.66)*** (2.22)** (2.48)** (2.46)** (1.21) OTH_DEVELOPED -0.275 -0.215 -0.245 -0.272 -0.272 -0.117 (2.18)** (1.54) (1.73)* (2.01)** (1.99)* (0.67) Constant 1.426 1.311 1.370 1.382 1.385 0.996 (11.99)*** (11.46)*** (10.06)*** (12.04)*** (11.93)*** (34.99)*** Observations 64 74 57 57 54 t statistics in parentheses (tobit estimations). The instrument for column 9 is OLD * significant at 10%; ** significant at 5%; *** significant at 1%

32
Table 4: Original Sin and institutions (1) (2) OSIN3 OSIN3 RULEOFLAW -0.050 -0.053 (0.46) (0.49) SIZE -0.323 -0.322 (3.53)*** (3.48)*** FIN_CENTER -0.883 (2.65)** EUROLAND -0.326 -0.325 (1.81)* (1.79)* OTH_DEVELOPED -0.203 -0.201 (1.03) (1.01) Constant 1.388 1.390 (13.17)*** (13.08)*** Observations 75 71 t statistics in parentheses (tobit estimations) *significant at 10%; ** significant at 5%; *** significant at 1%

33
Table 5: Original Sin and trade openness (1) (2) OSIN3 OSIN3 OPEN -0.174 -0.183 (1.28) (1.36) SIZE -0.359 -0.360 (3.74)*** (3.73)*** FIN_CENTER -0.937 (3.23)*** EUROLAND -0.360 -0.360 (2.71)*** (2.71)*** OTH_DEVELOPED -0.269 -0.270 (2.15)** (2.15)** Constant 1.515 1.523 (9.60)*** (9.64)*** Observations 75 71 t statistics in parentheses (tobit estimations) *significant at 10%; ** significant at 5%; *** significant at 1%

34
Table 6: Original Sin and Size of the Financial System (1) (2) (3) (4) (5) (6) (7) OSIN3 OSIN3 OSIN3 OSIN3 OSIN3 OSIN3 OSIN3
DC_GDP -0.332 -0.311 (1.49) (1.53) FOR_DOM -7.289 7.224 (2.15)** (0.86) SIZE_FIN 0.261 0.354 -0.918 (0.53) (0.70) (1.62) SIZE -0.290 -0.360 -0.326 -0.332 -0.320 -0.323 -0.306 (3.22)*** (4.02)*** (3.43)*** (3.42)*** (3.82)*** (3.72)*** (3.61)*** FIN_CENTER -0.753 -0.843 -0.997 -0.663 -0.895 -0.698 (2.40)** (3.02)*** (3.25)*** (2.33)** (3.23)*** (2.52)** EUROLAND -0.226 -0.301 -0.410 -0.421 -0.142 -0.299 -0.156 (1.37) (2.34)** (2.86)*** (2.92)*** (0.94) (2.42)** (1.09) OTH_DEVELOPED -0.224 -0.223 -0.278 -0.280 -0.187 -0.254 -0.200 (1.75)* (1.86)* (2.18)** (2.19)** (1.62) (2.16)** (1.76)* Constant 1.521 1.431 1.377 1.383 1.501 1.291 1.312 (10.13)*** (13.76)*** (13.44)*** (13.33)*** (10.94)*** (11.15)*** (14.44)*** Observations 74 73 72 68 73 72 71 t statistics in parentheses (tobit estimations) *significant at 10%; ** significant at 5%; *** significant at 1%
35
Table 7: The Determinants of Original Sin (1) (2) (3) OSIN3 OSIN3 OSIN3 LGDP_PC -0.286 -0.333 -0.314 (1.96)* (2.70)*** (2.09)** FISC 0.082 -0.078 -0.098 (0.70) (0.76) (0.96) SIZE -0.342 -0.404 -0.347 (2.79)*** (3.82)*** (3.37)*** SIZE_FIN 0.084 0.338 0.650 (0.20) (0.61) (1.07) RULEOFLAW 0.312 0.268 0.245 (1.69)* (1.55) (1.43) INF 0.112 0.109 0.129 (1.10) (1.08) (1.11) OPEN -0.093 -0.131 -0.102 (0.52) (0.62) (0.43) FIN_CENTER -0.683 (1.85)* EUROLAND -0.143 -0.034 (0.56) (0.14) OTH_DEVELOPED 0.009 0.035 (0.03) (0.13) Constant 3.674 4.170 3.941 (3.15)*** (4.06)*** (3.31)*** Observations 56 56 53 Tobit estimations t statistics in parentheses *significant at 10%; ** significant at 5%; *** significant at 1%

36
TABLE 8: Original Sin and Country Size (1) (2) (3) (4) (5) (6) (7) OSIN3 OSIN3 OSIN3 OSIN3 OSIN3 OSIN3 LGDP -0.113 (3.32)*** LTRADE -0.138 (3.67)*** LCREDIT -0.128 (3.67)*** SIZE -0.320 -0.320 -0.562 (3.52)*** (3.47)*** (6.16)*** FIN_CENTER -1.522 -1.013 -1.021 -0.833 -0.954 (5.39)*** (3.53)*** (3.69)*** (2.72)*** (3.19)*** EUROLAND -0.671 -0.418 -0.402 -0.298 -0.383 -0.385 (5.56)*** (3.48)*** (3.32)*** (2.12)** (2.86)*** (2.85)*** OTH_DEVELOPED -0.508 -0.331 -0.340 -0.229 -0.274 -0.275 (4.17)*** (2.86)*** (2.96)*** (1.79)* (2.15)** (2.15)** Constant 1.279 1.662 2.042 1.619 1.375 1.376 1.387 (15.95)*** (10.07)*** (8.34)*** (10.87)*** (13.77)*** (13.66)*** (13.14)*** Observations 90 80 88 75 75 71 75 Tobit estimations, t statistics in parentheses *significant at 10%; ** significant at 5%; *** significant at 1%
37
Table 9: Proportion of debt issued by foreigners and measures of original sin (Average 1999-2001)
Country % Foreign SIN33 Czech Republic 100.0% 0.0% South Africa 97.6% 9.5% New Zealand 82.0% 4.5% Poland 81.7% 0.0% Hong Kong, China 59.7% 29.4% Denmark 57.1% 71.1% Canada 51.2% 75.5% Singapore 35.4% 69.5% Australia 31.5% 69.8% Taiwan 0.0% 54.0% Note: Table includes all non-major currency countries with measures of Sin3 less than or equal to 0.8.

38
Figure 2: Original Sin in Exotic Currencies
0
0 .1
0 .2
0 .3
0 .4
0 .5
0 .6
0 .7
0 .8
0 .9
1
C z e c hR e p u b l i c
S o u thA f r i c a
N e wZ e a la n d
P o la n d H o n g K o n g D e n m a r k C a n a d a S in g a p o r e A u s t r a l ia T a iw a n
% F o r e ig n
O S IN 3

39
Table 10: Bonds in exotic currencies TYPE OF ISSUER
Total Debt (Bil USD)
Share of Instruments with fixed
interest rate
TOP 3 ISSUERS GOV. FIN. INST.
PRIVATECORP.
Czech Republic Int. Org Germany USA 1992-1998 0.93 100.0% 40.0% 21.0% 10.0% 8.0% 52.0% 0.0%
Germany Int. Org Nether. 1999-2001 1.11 80.0% 24.0% 22.0% 15.0% 3.0% 71.0% 4.0% Estonia Int. Org Finland 1999-2001 0.30 100.0% 99.0% 1.0% 0.0% 1.0% 0.0% Hong Kong Hong Kong Int. Org Australia 1992-1998 21.41 64.3% 40.0% 38.0% 8.0% 3.0% 43.0% 16.0%
Int. Org Hong Kong Australia 1999-2001 43.93 82.0% 29.0% 27.0% 17.0% 8.0% 59.0% 4.0% Poland Int. Org Poland USA 1992-1998 0.54 56.0% 43.0% 28.0% 12.0% 12.0% 14.0% 31.0%
Int. Org Germany Ireland 1999-2001 1.79 92.0% 34.0% 26.0% 7.0% 1.0% 63.0% 2.0% Portugal Int. Org UK USA 1992-1998 10.00 39.0% 40.0% 12.0% 11.0% 9.0% 43.0% 8.0% Singapore Singapore Hong Kong UK 1992-1998 2.30 15.0% 52.0% 45.0% 3.0% 0.0% 45.0% 55.0%
USA Singapore Int. Org. 1999-2001 12.74 99.8% 26.0% 15.0% 11.0% 20.0% 61.0% 8.0% Slovak Republic Int. Org Germany Nether. 1992-1998 0.46 100.0% 65.0% 20.0% 15.0% 0.0% 35.0% 0.0%
Int. Org Germany Austria 1999-2001 2.58 76.0% 44.0% 20.0% 12.0% 0.0% 44.0% 0.0% South Africa Int. Org Germany Nether. 1992-1998 2.99 97.0% 56.0% 18.0% 11.0% 7.0% 29.0% 8.0%
Int. Org Germany S. Africa 1999-2001 6.17 99.0% 48.0% 13.0% 13.0% 3.0% 33.0% 16.0% Spain Int. Org Spain Germany 1992-1998 36.48 87.0% 59.0% 9.0% 7.0% 11.0% 27.0% 3.0% Taiwan Int. Org Taiwan 1992-1998 3.04 0.0% 0.0% 100.0% 0.0% 0.0% 100.0% 1999-2001 7.06 94.0% 98.0% 2.0% 0.0% 0.0% 2.0% Thailand Hong Kong Thailand S. Korea 1992-1998 7.87 77.5% 34.0% 29.0% 14.0% 5.0% 55.0% 39.0%
Thailand USA Australia 1999-2001 12.15 5.0% 95.0% 4.0% 0.8% 0.0% 85.0% 15.0% Trinidad & Tobago Int. Org 1992-1998 0.40 100.0% 100.0% 0.0% 0.0% 0.0% 1999-2001 1.06 100.0% 100.0% 0.0% 0.0% 0.0%
Source: Own calculations based on data from the Bank for International Settlements.

40
Appendix
Table A1: Original Sin and the Level of Economic Development (Tobit estimates)
(1) (2) (3) (4) (5) OSIN3 OSIN3 OSIN3 OSIN1 OSIN2 LGDP_PC -0.141 -0.128 -0.170 -0.031 0.000 (1.59) (1.43) (2.99)*** (0.95) (0.03) SIZE -0.310 -0.310 -0.415 -0.199 -0.024 (3.37)*** (3.33)*** (4.51)*** (4.48)*** (1.43) FIN_CENTER -0.680 -0.254 -0.592 (1.99)* (2.15)** (9.69)*** EUROLAND -0.126 -0.152 -0.067 -0.267 (0.62) (0.74) (0.86) (6.36)*** OTH_DEVELOPED 0.007 -0.021 -0.074 -0.112 (0.03) (0.10) (0.90) (2.30)** Constant 2.522 2.414 2.833 1.498 0.991 (3.39)*** (3.24)*** (5.46)*** (5.42)*** (10.20)*** Observations 75 71 75 75 75 t statistics in parentheses *significant at 10%; ** significant at 5%; *** significant at 1%

41

42
Tab
le A
2: O
rigi
nal S
in a
nd M
onet
ary
Cre
dibi
lity
(1
) (2
) (3
) (4
) (5
) (6
) (7
) (8
) (9
) (1
0)
D
ropp
ing
Fina
ncia
l ce
nter
s
O
LS sa
me
sam
ple
as 8
In
stru
men
tal
Var
iabl
es
O
SIN
3 O
SIN
3 O
SIN
3 O
SIN
3 O
SIN
1 O
SIN
2 O
SIN
3 O
SIN
3 O
SIN
3 O
SIN
3 A
V_I
NF
0.30
6
0.43
6
(1
.19)
(0.6
9)
A
V_I
NF2
-0
.116
(0
.23)
MA
X_I
NF
0.
067
(0.9
5)
INF
0.
085
0.00
9 0.
005
0.08
3 0.
175
0.02
2 0.
314
(1.0
9)
(0.3
1)
(0.4
3)
(1.0
7)
(2.0
8)**
(0
.35)
(1
.13)
SI
ZE
-0.3
18
-0.3
18
-0.3
16
-0.3
18
-0.2
01
-0.0
24
-0.3
18
-0.5
03
-0.3
23
-0.3
19
(3
.57)
***
(3.5
4)**
* (3
.52)
***
(3.5
5)**
* (4
.51)
***
(1.4
4)
(3.5
0)**
* (5
.75)
***
(4.2
7)**
* (4
.30)
***
FIN
_CEN
TER
-0
.866
-0
.897
-0
.857
-0
.881
-0
.310
-0
.587
-0
.603
-0
.550
(2.8
8)**
* (2
.99)
***
(2.8
3)**
* (2
.93)
***
(3.0
3)**
* (1
0.38
)***
(2
.77)
***
(2.5
2)**
* EU
RO
LAN
D
-0.3
04
-0.3
29
-0.2
96
-0.3
15
-0.1
16
-0.2
63
-0.3
18
-0
.360
-0
.312
(2.1
2)**
(2
.31)
**
(1.9
9)*
(2.2
1)**
(2
.03)
**
(7.3
0)**
* (2
.21)
**
(2
.80)
***
(2.3
9)**
O
TH_D
EVEL
OPE
D
-0.1
99
-0.2
24
-0.1
92
-0.2
11
-0.1
28
-0.1
07
-0.2
13
-0
.207
-0
.155
(1.4
7)
(1.6
7)*
(1.3
7)
(1.5
6)
(2.1
7)**
(2
.57)
**
(1.5
7)
(2
.15)
**
(1.5
2)
Con
stan
t 1.
277
1.31
0 1.
259
1.34
6 1.
241
0.99
2 1.
347
1.35
8 1.
321
1.23
3
(10.
87)*
**
(11.
60)*
**
(8.8
3)**
* (1
3.56
)***
(2
5.50
)***
(7
8.09
)***
(1
3.46
)***
(1
3.41
)***
(1
4.07
)***
(1
0.29
)***
O
bser
vatio
ns
74
74
74
74
74
74
70
74
33
33
Rob
ust t
stat
istic
s in
pare
nthe
ses,
tobi
t est
imat
ions
, the
inst
rum
ent f
or c
olum
n 10
is C
ukie
rman
�s in
dex
of C
entra
l Ban
k In
depe
nden
ce
*sig
nific
ant a
t 10%
; **
sign
ifica
nt a
t 5%
; ***
sign
ifica
nt a
t 1%

43
Tab
le A
3: O
rigi
nal S
in a
nd F
isca
l Sus
tain
abili
ty
(1
) (2
) (3
) (4
) (5
) (6
) (7
) (8
)
OSI
N3
OSI
N3
OSI
N3
OSI
N3
OSI
N3
OSI
N1
OSI
N2
OSI
N3
IV
Estim
atio
ns
DE_
GD
P2
-0.0
73
(0.5
0)
D
EFIC
IT
1.
777
(0.9
2)
DE_
RE2
0.
014
(0.2
4)
FI
SC
-0
.025
-0
.024
-0
.015
0.
003
-0.0
61
(0.3
0)
(0.2
8)
(0.4
3)
(0.1
4)
(0.2
2)
SIZE
-0
.350
-0
.327
-0
.354
-0
.342
-0
.345
-0
.188
-0
.037
-0
.124
(3.7
1)**
* (3
.52)
***
(3.5
1)**
* (3
.42)
***
(3.4
0)**
* (3
.82)
***
(1.7
3)*
(2.1
7)**
FI
N_C
ENTE
R
-0.8
25
-0.9
26
-0.8
16
-0.8
39
-0
.411
-0
.537
-0
.736
(2.7
2)**
* (3
.09)
***
(2.5
7)**
(2
.66)
**
(3
.55)
***
(8.1
8)**
* (4
.12)
***
EUR
OLA
ND
-0
.344
-0
.361
-0
.327
-0
.348
-0
.348
-0
.138
-0
.224
-0
.149
(2.6
1)**
(2
.66)
***
(2.2
2)**
(2
.48)
**
(2.4
6)**
(2
.34)
**
(5.6
8)**
* (1
.21)
O
TH_D
EVEL
OPE
D
-0.2
75
-0.2
15
-0.2
45
-0.2
72
-0.2
72
-0.1
50
-0.1
00
-0.1
17
(2
.18)
**
(1.5
4)
(1.7
3)*
(2.0
1)**
(1
.99)
* (2
.44)
**
(2.2
4)**
(0
.67)
C
onst
ant
1.42
6 1.
311
1.37
0 1.
382
1.38
5 1.
237
0.99
7 0.
996
(1
1.99
)***
(1
1.46
)***
(1
0.06
)***
(1
2.04
)***
(1
1.93
)***
(2
3.07
)***
(6
3.29
)***
(3
4.99
)***
O
bser
vatio
ns
64
74
57
57
54
57
57
57
t sta
tistic
s in
pare
nthe
ses,
tobi
t est
imat
ions
. The
inst
rum
ent f
or c
olum
n 9
is O
LD
* si
gnifi
cant
at 1
0%; *
* si
gnifi
cant
at 5
%; *
** si
gnifi
cant
at 1
%

44
Tab
le A
4: O
rigi
nal S
in a
nd In
stitu
tions
(1)
(2)
(3)
(4)
O
SIN
3 O
SIN
3 O
SIN
1 O
SIN
2 R
ULE
OFL
AW
-0
.050
-0
.053
-0
.039
-0
.003
(0.4
6)
(0.4
9)
(0.9
0)
(0.1
9)
SIZE
-0
.323
-0
.322
-0
.206
-0
.024
(3.5
3)**
* (3
.48)
***
(4.5
3)**
* (1
.44)
FI
N_C
ENTE
R
-0.8
83
-0
.261
-0
.586
(2.6
5)**
(2.2
3)**
(9
.72)
***
EUR
OLA
ND
-0
.326
-0
.325
-0
.078
-0
.263
(1.8
1)*
(1.7
9)*
(1.0
9)
(6.7
1)**
* O
TH_D
EVEL
OPE
D
-0.2
03
-0.2
01
-0.0
77
-0.1
06
(1
.03)
(1
.01)
(0
.94)
(2
.22)
**
Con
stan
t 1.
388
1.39
0 1.
257
0.99
4
(13.
17)*
**
(13.
08)*
**
(24.
35)*
**
(80.
77)*
**
Obs
erva
tions
75
71
75
75
t s
tatis
tics i
n pa
rent
hese
s tob
it es
timat
es
*sig
nific
ant a
t 10%
; **
sign
ifica
nt a
t 5%
; ***
sign
ifica
nt a
t 1%

45
Tab
le A
5: O
rigi
nal S
in a
nd tr
ade
open
ness
(1
) (2
) (3
) (4
) (5
)
OSI
N3
OSI
N1
OSI
N2
OSI
N3
OSI
N3
OPE
N
-0.1
74
-0.0
88
-0.0
20
-0.1
83
-0.2
33
(1
.28)
(1
.34)
(0
.97)
(1
.36)
(1
.42)
SI
ZE
-0.3
59
-0.2
20
-0.0
32
-0.3
60
-0.6
00
(3
.74)
***
(4.7
0)**
* (1
.73)
* (3
.73)
***
(6.2
3)**
* FI
N_C
ENTE
R
-0.9
37
-0.3
13
-0.5
86
(3
.23)
***
(3.2
7)**
* (1
0.58
)***
EU
RO
LAN
D
-0.3
60
-0.1
09
-0.2
61
-0.3
60
(2.7
1)**
* (2
.11)
**
(7.4
1)**
* (2
.71)
***
O
TH_D
EVEL
OPE
D
-0.2
69
-0.1
26
-0.1
09
-0.2
70
(2.1
5)**
(2
.39)
**
(2.6
9)**
* (2
.15)
**
C
onst
ant
1.51
5 1.
311
1.01
2 1.
523
1.57
3
(9.6
0)**
* (1
8.17
)***
(4
5.62
)***
(9
.64)
***
(8.7
5)**
* O
bser
vatio
ns
75
75
75
71
75
t sta
tistic
s in
pare
nthe
ses,
tobi
t est
imat
ions
*s
igni
fican
t at 1
0%; *
* si
gnifi
cant
at 5
%; *
** si
gnifi
cant
at 1
%

46
Tab
le A
6: O
rigi
nal S
in a
nd S
ize
of th
e Fi
nanc
ial S
yste
m
(1
) (2
) (3
) (4
) (5
) (6
)
OSI
N3
OSI
N3
OSI
N3
OSI
N3
OSI
N1
OSI
N2
DC
_GD
P -0
.332
(1
.49)
FOR
_DO
M
-7
.289
(2
.15)
**
SIZE
_FIN
0.
261
0.35
4 0.
237
-0.0
04
(0
.53)
(0
.70)
(1
.39)
(0
.06)
SI
ZE
-0.2
90
-0.3
60
-0.3
26
-0.3
32
-0.2
13
-0.0
25
(3
.22)
***
(4.0
2)**
* (3
.43)
***
(3.4
2)**
* (4
.69)
***
(1.3
6)
FIN
_CEN
TER
-0
.753
-0
.843
-0
.997
-0.3
47
-0.5
90
(2
.40)
**
(3.0
2)**
* (3
.25)
***
(3
.57)
***
(10.
12)*
**
EUR
OLA
ND
-0
.226
-0
.301
-0
.410
-0
.421
-0
.144
-0
.266
(1.3
7)
(2.3
4)**
(2
.86)
***
(2.9
2)**
* (2
.77)
***
(7.3
5)**
* O
TH_D
EVEL
OPE
D
-0.2
24
-0.2
23
-0.2
78
-0.2
80
-0.1
36
-0.1
10
(1
.75)
* (1
.86)
* (2
.18)
**
(2.1
9)**
(2
.65)
**
(2.6
5)**
C
onst
ant
1.52
1 1.
431
1.37
7 1.
383
1.25
0 0.
994
(1
0.13
)***
(1
3.76
)***
(1
3.44
)***
(1
3.33
)***
(2
6.07
)***
(7
2.76
)***
O
bser
vatio
ns
74
73
72
68
72
72
t t st
atis
tics i
n pa
rent
hese
s
*sig
nific
ant a
t 10%
; **
sign
ifica
nt a
t 5%
; ***
sign
ifica
nt a
t 1%
47
Tab
leA
7: T
he D
eter
min
ants
of O
rigi
nal S
in
(1
) (2
) (3
) (4
) (5
) (6
) (7
)
OSI
N3
OSI
N3_
NO
I O
SIN
3 O
SIN
3 0S
IN3
OSI
N1
OSI
N2
LGD
P_PC
-0
.286
-0
.230
-0
.333
-0
.314
-0
.286
-0
.083
0.
011
(1
.96)
* (1
.98)
* (2
.70)
***
(2.0
9)**
(1
.96)
* (1
.53)
(0
.48)
FI
SC
0.08
2 -0
.136
-0
.078
-0
.098
0.
082
-0.0
73
0.00
6
(0.7
0)
(1.7
3)*
(0.7
6)
(0.9
6)
(0.7
0)
(1.7
9)*
(0.2
7)
SIZE
-0
.342
-0
.323
-0
.404
-0
.347
-0
.342
-0
.193
-0
.050
(2.7
9)**
* (4
.06)
***
(3.8
2)**
* (3
.37)
***
(2.7
9)**
* (3
.88)
***
(2.0
3)**
SI
ZE_F
IN
0.08
4 0.
314
0.33
8 0.
650
0.08
4 0.
436
-0.0
15
(0
.20)
(0
.71)
(0
.61)
(1
.07)
(0
.20)
(1
.98)
* (0
.17)
R
ULE
OFL
AW
0.
312
0.13
4 0.
268
0.24
5 0.
312
-0.0
30
0.00
6
(1.6
9)*
(1.0
1)
(1.5
5)
(1.4
3)
(1.6
9)*
(0.4
6)
(0.1
7)
INF
0.11
2 0.
067
0.10
9 0.
129
0.11
2 0.
046
0.00
2
(1.1
0)
(0.7
3)
(1.0
8)
(1.1
1)
(1.1
0)
(1.0
0)
(0.1
3)
OPE
N
-0.0
93
-0.0
71
-0.1
31
-0.1
02
-0.0
93
0.05
5 -0
.051
(0.5
2)
(0.3
9)
(0.6
2)
(0.4
3)
(0.5
2)
(0.5
7)
(1.3
3)
FIN
_CEN
TER
-0
.683
-0
.600
-0
.683
-0
.249
-0
.561
(1.8
5)*
(2.0
4)**
(1
.85)
* (1
.74)
* (7
.22)
***
EUR
OLA
ND
-0
.143
-0
.050
-0.0
34
-0.1
43
0.01
1 -0
.241
(0.5
6)
(0.2
5)
(0
.14)
(0
.56)
(0
.11)
(4
.53)
***
OTH
_DEV
ELO
PED
0.
009
-0.0
48
0.
035
0.00
9 0.
039
-0.1
30
(0
.03)
(0
.22)
(0.1
3)
(0.0
3)
(0.3
5)
(2.1
1)**
C
onst
ant
3.67
4 3.
265
4.17
0 3.
941
3.67
4 1.
892
0.94
8
(3.1
5)**
* (3
.57)
***
(4.0
6)**
* (3
.31)
***
(3.1
5)**
* (4
.47)
***
(5.4
1)**
* O
bser
vatio
ns
56
56
56
53
56
56
56
Tobi
t est
imat
ions
t st
atis
tics i
n pa
rent
hese
s
*s
igni
fican
t at 1
0%; *
* si
gnifi
cant
at 5
%; *
** si
gnifi
cant
at 1
%

48
TA
BL
E A
8: O
rigi
nal S
in a
nd C
ount
ry S
ize
(1
) (2
) (3
) (4
) (5
) (6
) (7
) (8
) (9
)
OSI
N3
OSI
N3
OSI
N3
OSI
N3
OSI
N3
OSI
N3
OSI
N3
OSI
N1
OSI
N2
LGD
P -0
.113
(3.3
2)**
*
LT
RA
DE
-0
.138
(3.6
7)**
*
LCR
EDIT
-0
.128
(3.6
7)**
*
SI
ZE
-0
.320
-0
.320
-0
.562
-0
.278
-0
.304
-0
.030
(3
.52)
***
(3.4
7)**
* (6
.16)
***
(2.1
2)**
(7
.31)
***
(1.9
5)*
FIN
_CEN
TER
-1
.013
-1
.021
-0
.833
-0
.954
(3
.53)
***
(3.6
9)**
* (2
.72)
***
(3.1
9)**
*
EUR
OLA
ND
-0
.418
-0
.402
-0
.298
-0
.383
-0
.385
-0
.047
-0
.262
(3.4
8)**
* (3
.32)
***
(2.1
2)**
(2
.86)
***
(2.8
5)**
*
(0
.95)
(8
.19)
***
OTH
_DEV
ELO
PED
-0
.331
-0
.340
-0
.229
-0
.274
-0
.275
-0
.065
-0
.107
(2.8
6)**
* (2
.96)
***
(1.7
9)*
(2.1
5)**
(2
.15)
**
(1.2
0)
(2.8
7)**
* C
onst
ant
1.66
2 2.
042
1.61
9 1.
375
1.37
6 1.
387
1.31
2 1.
299
0.99
4
(10.
07)*
**
(8.3
4)**
* (1
0.87
)***
(1
3.77
)***
(1
3.66
)***
(1
3.14
)***
(1
0.95
)***
(2
3.55
)***
(8
9.71
)***
O
bser
vatio
ns
80
88
75
75
71
75
54
75
71
Tobi
t est
imat
ions
, t st
atis
tics i
n pa
rent
hese
s
*s
igni
fican
t at 1
0%; *
* si
gnifi
cant
at 5
%; *
** si
gnifi
cant
at 1
%.