the national bureau of economic research - this …karen davis and roger reynolds the brookings...
TRANSCRIPT

This PDF is a selection from an out-of-print volume from the National Bureau of Economic Research
Volume Title: The Role of Health Insurance in the Health Services Sector
Volume Author/Editor: Richard N. Rosett
Volume Publisher: NBER
Volume ISBN: 0-87014-272-0
Volume URL: http://www.nber.org/books/rose76-1
Publication Date: 1976
Chapter Title: The Impact of Medicare and Medicaid on Access to Medical Care
Chapter Author: Karen Davis, Roger Reynolds
Chapter URL: http://www.nber.org/chapters/c3824
Chapter pages in book: (p. 391 - 436)

10The Impact ofMedicare andMedicaid on Accessto Medical Care
Medicare and Medicaid, initiated in 1966 under the JohnsonAdministration, were in the forefront of the Great Society pro-grams designed to help the poor and disadvantaged enjoy the fruitsof a growing and prosperous economy. They received the largestand most rapidly growing share of budgetary resources of all socialprograms enacted during that period. In fiscal 1975, governmentalexpenditures under the federal-state Medicaid program are ex-pected to be $13 billion, providing medical care services for 25million low-income people; Medicare is expected to spend $15billion on medical care services for 24 million elderly and disabledpeople.
Concern with the high cost of these programs has almost eclipsedthe substantial achievements of the programs in increasing accessto medical care services by many persons who formerly had to seekcharity care or do without much-needed care. To gain better
The views expressed here are those of the authors and not necessarily those of the officers,bustees, or other stsff members of The Brookings Institution. Financial support for this study hasbeen provided by the Robert Wood Johnson Foundation.
ial and
Average69 1967—1969
.3 —1.2
.2 +1.1
.4 —1.0
.5 +0.2
1.6 +0.5.3 +3.2.7 +1.1.5 —1.4
KARENDAVIS
andROGER
REYNOLDSThe Brookings Institution
sed by 25 per cent,15 per cent. These
uantity or quality ofantial (more than 25ge intestine, rectum,planation for thesere medical care.
dicare on mortality,tance, it would beattention could thenson to believe thatnce (e.g., infectiouse and region. Therect of Medicare onlation between suchit might be useful tonot experience any
do not do justice toiy own belief in thequestions.
391

perspective on the benefits of these programs, this paper will TABLE 1 Phyaddress three major questions: COlT
1. What impact have Medicare and Medicaid had on use of Age and IncomeGrmedical services by the poor and elderly, particularly inrelation to other persons with similar health problems? All ages
2. What factors account for uneven utilization of medical ser- Low incomevices by persons eligible for Medicaid? Middle income
3. To what extent do socioeconomic and demographic character- High incomeistics continue to affect the utilization of health services by the Ratio, high incorelderly?
Under 1.5 yearsLow incomeMiddle incomeHigh income
1. IMPACT OF MEDICARE AND MEDICAID ON Ratio, high inconUSE OF MEDICAL SERVICESRecent evidence indicates that Medicare and Medicaid have led to 15-64 years
marked improvements in contact with the medical system by poor Low incomeMiddle incomepersons and greatly increased the access of the elderly of all income High incomeclasses to institutional services such as hospital and nursing home
care. Andersen et al. (1972) report that in 1970, 65 of Ratio, high incorlow-income persons saw a physician during the year, comparedwith 56 per cent in 1963.' They also point out that poor pregnant 65 years and older
Low incomewomen began increasingly to visit physicians earlier—71 percent of Middle incomelow-income women received medical attention in the first trimester High incomeof pregnancy in 1970 as against 58 per cent in 1963. Results fromNational Health Surveys show that, while 11 out of every 100 Ratio, high incozelderly persons were hospitalized in 1962, 16 were hospitalized in RCES: U.S. Dep1968.2 Statistics,
Furthermore, these changes in use of services were not part of an States, Jul1971.
overall pattern. Utilization by higher-income persons remained 'low income isdefined as $4,000-$6,lstable over the period or declined slightly. Therefore, the poor above in 1964 and $10
made striking gains in use of services relative to higher-incomegroups. As shown in Table 1, in fiscal 1964 high-income personspaid 19 per cent more visits to a physician than low-incomepersons; by 1971, more low-income persons than high-income this period.persons were using such services. began toThere also were significant redistributions in institutional care. adjustmentPettingill (1972) reports that although days of hospital care for the the underaged increased at an annual rate of between 6 and 13 per cent in the Loewensteifirst three years following the inception of Medicare, days of care in the use oby persons under age 65 declined steadily.3 The share of hospital cutbacks indays spent by the elderly increased by six percentage points over
393 Imp392 Davis and Reynolds

s, this paper will
aid had on use ofly, particularly inth problems?on of medical ser-
character-tith services by the
DON
dicaid have led toal system by poorlerly of all incomeand nursing home0, 65 per cent of:e year, comparedhat poor pregnantier—71 percent ofthe first trimester
963. Results fromout of every 100re hospitalized in
,ere not part of anersons remainederefore, the poorto higher-incomeI-income personsthan low-income
high-income
TABLE 1 Physician Visits per Capita, by Age and Family-In-come Group, Fiscal Year 1964, Calendar Year 1971
Age and incomeGroupa 1964 1971
All ages 4.5 5.0Low income . 4.3 5.6Middle income 4.5 4.7High income 5.1 4.9
Ratio, high income to low income 1.19 , .88
Under 15 yearsLow income 2.7 4.0Middle income . 2.8 4.1High income 4.5 4.8
Ratio, high income to low income 1.67 1.20
15—64 yearsLow income 4.4 5.8Middle income 4.7 4.9High income 4.9 4.8
Ratio, high income to low income 1.11 .83
65 years and olderLow income 6.3 6.7Middle income 7.0 6.4High income 7.3 7.5Ratio, high income to low income 1.16 1.12
SOURCES: U.S. Department of Health, Education and Welfare, National Center for HealthStatistics, Volume of Physician Visits by Place of Visit and Type of Service, UnitedStates, July 1963—June 1964, Series 10, No. 18, (1965) and unpublished tabulations for1971.
a Low income is defined as under $4,000 in 1964 and under $5,000 in 1971. Middle income isdefined as $4,000—$6,999 in 1964 and $5,000.-$10,000 in 1971. High income is defined as $7,000 andabove in 1964 and $10,000 and above in 1971.
this period. In later years, hospital care of younger age groupsbegan to increase relatively faster, as might be expected as theadjustment to Medicare ended and private insurance coverage ofthe under age 65 group continued to expand.4 In addition,Loewenstein has found that Medicare induced a marked increasein the use of extended care facilities by the elderly.5 Administrativecutbacks in this benefit in 1969 later moderated these gains.
393 Impact of Medicaid on Access to Medical Care
r
care.pital care for the13 per cent in the
days of careshare of hospitalftage points over

Although these data and studies give solid support to the conten- Welfare StatLtion that Medicare and Medicaid have been largely successful in Although iiachieving their goal of ensuring access to medical care services for medical secovered persons, they are subject to several qualifications, persons ha
First, Medicaid does not provide medical care services for all those exclupoor persons, but only those falling within certain welfare well behincategories, such as single-parent families, and the blind, disabled, Data froiand aged. In 1974, an estimated 9 million persons with incomes tional Cenbelow the poverty level, or about 35 per cent of the poor, were medical carineligible for Medicaid. Therefore, gains in use of medical services poor persomay not be widely shared by all poor persons. coverage u
Second, greater equality in utilization of medical services among mind. At I-income classes may be misleading because poor persons generally Medicaid rhave more severe health problems than higher-income persons, effect at thand persons receiving welfare are less healthy as a whole than other eligible forpoor persons. Comparisons among persons of similar health status at that timican therefore be expected to indicate much wider differences in use persons unof services among income classes. that some
Third, even if utilization of services is adjusted for health needs welfare maof the population, the poor may still not participate in examining"mainstream" medicine, receiving care of comparable quality, evidence oconvenience, and style to that received by more fortunate persons. Medicaid rPoor persons may continue to be treated in crowded and dreary Asclinics, enduring long waits and receiving few amenities. Care may persons wbe discontinuous, episodic, fragmented, and impersonal if patients assistancesee different physicians or health personnel at each visit. Any given those poorlevel of care, as measured by physician visits or days of care in a on welfarhospital, may be less effective in terms of meeting the patient's above $15,health needs than the same level of care received by higher-income lems of tipatients in more amenable settings. services m
Finally, even if Medicare and Medicaid have assisted poor and misleadinlelderly persons as a whole in receiving care comparable to that Medicaidreceived by others, racial discrimination or variations in the availa-bility of medical resources may lead to a very uneven distributionof benefits among eligible persons. Health Stat
To sort out the simultaneous influence of health status, income, Incomecoverage under public programs, sociodemographic factors, and
Mavailability of medical resources requires sophisticated techniques ore imP(of analysis. Before turning to such an analysis, however, it services ainstructive to review briefly evidence on utilization rates and types determine
with highof care received by persons of various income classes, once some d' tadjustment is made for welfare eligibility and health status. not a JUS
394 Davis and Reynolds 395I

)ort to the conten-gely successful in1 care services forifications.e services for allcertain welfare
e blind, disabled,ns with incomes)f the poor, weremedical services
al services among)erSOfls generally-income persons,whole than otherliar health statuslifferences in use
for health needsparticipate in
parable quality,)rtunate persons.vded and dreary
Care mayrsonal if patientsivisit. Any givendays of care in a
the patient'sy higher-income
ssisted poor andnparable to that
in the availa-yen distribution
status, income,hic factors, andated techniqueshowever, it is
I rates and typessses, once someth status.
Welfare Status and Use of Medical ServicesAlthough the poor as a whole have made marked gains in the use ofmedical services relative to higher-income groups, not all poorpersons have received benefits from the Medicaid program. Forthose excluded from coverage, utilization of physician services lagswell behind other poor persons and higher-income persons.
Data from the 1969 Health Interview Survey (HIS) of the Na-tional Center for Health Statistics pennit some comparison ofmedical care utilization of poor persons receiving welfare and otherpoor persons. This categorization provides a rough indication ofcoverage under Medicaid, but several problems should be kept inmind. At the beginning of 1969, eleven states did not haveMedicaid programs (although all but two states had programs ineffect at the beginning of 1970), so that some persons, althougheligible for public assistance, were not receiving medical assistanceat that time. Furthermore, some states covered medically needypersons under Medicaid as well as public assistance recipients, sothat some of the utilization of services by poor persons not onwelfare may be influenced by the Medicaid program. Nevertheless,examining these two groups of poor persons provides some roughevidence of utilization of medical services by persons eligible forMedicaid relative to other poor persons.
As shown in Table 2, data from the 1969 HIS indicate thatpersons with incomes below $5,000 who were not on publicassistance averaged 4.7 physician visits compared with 6.6 visits forthose poor on welfare. The physician visit rate for poor persons noton welfare was actually less than that of persons with incomesabove $ 15,000—even before adjusting for the greater health prob-lems of the poor. Thus, the conclusion that the poor now useservices more than do higher-income persons is at least partiallymisleading because it does not distinguish among those eligible forMedicaid and other poor persons.
Health Status and Use of Services byIncome Classes
More important, however, is the fact that comparing use of medicalservices among income classes is misleading in any attempt todetermine whether the poor now have equal access to medical carewith higher-income persons inasmuch as such a comparison doesnot adjust for the more serious health problems of the poor.
395 Impact of Medicaid on Access to Medical Care

TA
BLE
2 P
hysi
cian
Vis
its b
y F
amily
Inco
me,
Pub
lic A
ssis
tanc
e S
tatu
s, a
nd A
ge G
roup
, 1 9
69a
and
olde
r for
All
Per
sons
Und
er 1
7Y
ears
Age
17—
44A
ge 4
5—64
Age
65
and
over
Adj
uste
dA
djus
ted
Adj
uste
dA
djus
ted
Adj
uste
dfo
rfo
rfo
rfo
rfo
r•
Hea
lth•
Hea
lthH
ealth
Hea
lthH
ealth
Una
djus
ted
Sta
tus
Una
djus
ted
Sta
tus
Una
djus
ted
Sta
tus
Una
djus
ted
Sta
tus
Una
djus
ted
Sta
tus
All
fam
ily in
com
es4.
64.
63.
83.
84.
44:
44.
94.
96.
66.
6
Und
er $
5,00
04.
93.
73.
03.
04.
84.
25.
84.
06.
56.
1A
id6.
64.
53.
73.
58.
95.
911
.25.
29.
06.
4N
o ai
d4.
73.
62.
83.
04.
54.
1.5.
43.
96.
36.
1$5
,000
—9,
999
4.2
4.6
3.6
3.9
4.3
4.5
4.8
5.2
6.1
6.8
$10,
000.
-14,
999
4.4
4.9
4.2
4.2
4.4
4.6
4.5
5.1
6.8
7.5
$15,
000
and
over
4.8
5.2
4.6
4.5
4.4
4.8
4.7
5.5
9.6
10.4
Rat
io, a
id to
no
aid,
inco
me
.
unde
r $5,
000
1.40
1.25
1.34
1.19
2.00
1.42
2.08
1.32
1.43
1.05
Rat
io, i
ncom
e ov
er$1
5,00
0 to
no
aid,
inco
me
unde
r $5,
000
1.02
1.44
1.67
1.53
1.00
1.17
.87
1.40
1.52
1.72
SOU
RC
E: E
stim
ated
from
the
1969
Hea
lth In
terv
iew
Sur
vey,
Nat
iona
l Cen
ter f
or H
ealth
Sta
tistic
s. Se
e A
ppen
dix
2 for
regr
essi
ons.
'in
divi
dual
sre
porti
ng fa
mily
inco
me
unkn
own,
thos
e un
der 1
7 fo
r who
m h
ead
of h
ouse
hold
edu
catio
n w
as u
nkno
wn,
and
thos
e 17
who
m in
divi
dual
edu
catio
n w
as u
nkno
wn.
:L
0 C 0.
-4 — -)
CD
8
CD
.C
,,
—.
rP
C,

J
There are many dimensions of ill health and the "medical need"for care, ranging from discomfort, pain, and debilitating conditionsto potentially fatal medical problems. Holding constant for healthstatus in an examination of utilization patterns among incomeclasses is difficult, both because data on these dimensions of healthare limited and because the range and intensity of these conditionsdiffer markedly so there is little consensus on which measures aremost analytically appropriate.
A crude adjustment, however, can be made using data suppliedj in the 1969 HIS. The survey includes data on several dimensions ofhealth status, including chronic conditions and limitation of activitythat may be considered indicators of a "health stock" and number ofdays during the year in which activity is restricted, which reflectsthe incidence of more episodic illness. Obviously, even thesemeasures of health status can vary markedly since two illnesses ofthe same duration may reflect quite different needs for medical
I care. Furthermore, some needs for medical care, such as maternityj care, may be accompanied by very little restriction of activity. In
spite of the limitations of these measures, however, they do permitI us to gain some insight into the effect of substantial differences in
need for services among income classes.— Table 2 indicates physician visit rates for persons of different
income classes if they were to experience the average level ofchronic conditions and restricted activity days of persons in their
age group. These results were derived from ordinary least— I squares regressions reported in Appendix 2, Table 1.6
Adjustment for health status leads to a striking change in utiliza-tion patterns. Instead of following a U-shaped pattern with low-income persons using services more than middle-income persons,utilization increases uniformly with income. Poor persons eligiblefor welfare use physician services about the same as middle-incomepersons with comparable health problems, whereas those low-income persons not on public assistance lag substantially behindother poor and middle-income persons in use of services. Childrenin families with above $15,000 visit physicians 53 per centmore frequently' than poor children not on welfare, whereas high-
elderly persons see physicians more than 72 per cent moreoften than poor elderly persons not on welfare.
0Quality and Convenience of Medical Care
Although the poor, particularly those on welfare, have mademarked gains in use of medical services relative to other income
397 Impact of Medicaid on Access to Medical Care
-j

and care inof recent mphysician h
Neverthethe same kcitizens. Oicare and diless conveispend 50physician ttraveling timinutes pe(and 43 mi:addition tosubstantialholds in srecipients ffor health s
2. DISTRIB(Althoughto higher-ithat not allreceiving:cipients inprogram dIn this secin use ofexperienc..
Medicaierable lee'services cservice. Alpersons wassistance,all stateshospital aiof supplelvices.
398 Davis and Reynolds 399 lmç
groups, there is evidence that the poor do not obtain care in thesame setting, from the same kind of physicians, and with the sameease and convenience as higher-income persons. Instead, thepoor—whether on welfare or not—are much more likely to receivecare from general practitioners than from specialists, in a hospitaloutpatient department rather than in a physician's office, and aftertraveling long distances and waiting substantially longer for care.
As shown in Table 3, the poor receive 70 per cent of their carefrom general practitioners, compared with 41 per cent for personswith family incomes over $15,000. Few poor children receive carefrom pediatricians. Higher-income women of child-bearing age arealso twice as likely as are poor women to be cared for by specialists.The proportion of care received from specialists does not vary appre-ciably among the poor on welfare and other poor.
Some differences among income classes also exist in the place inwhich care is obtained. Persons with family incomes above $15,000receive 87 per cent of their physician care in private settings (office,home, or telephone call to private physician) compared with only80 per cent for those with family incomes below $5,000. The pooron welfare are even less likely to receive care in private settings—only 75 per cent.
It is hazardous to draw inferences about the quality and adequacyof care from these differences in the extent of specialist care anddifferences in the setting of treatment. It may well be, contrary tocommon belief, that specialist care for children and pregnantwomen is no more efficacious than care from a general practitioner;
TABLE 3 Percentage of Physician Visits to Selected Kindsof Physicians, by Income, 1969
GeneralPractitioner
(all ages)
Pediatrician
(under 17 years)
Obstetrician!Gynecologist
(women 17—44 years)
All persons 59 32 21Under $5,000 70 18 13
Aid 73 21 6No aid 70 17 14
$5,000-9,999 61 30 23$10,000—14,999 51 40 24$15,000 and over 41 39 23
SOURCE: Calculated from the 1969 HealthStatistics.
Interview Survey, National Center for Health

)taifl care in thed with the same
Instead, thelikely to receivests, in a hospitaloffice, and afterlonger for care.ent of their carecent for personsren receive care[-bearing age areor by specialists.s not vary appre-
St 10 the place inabove $15,000
settings (office,pared with only5,000. The poorrivate settings—
ity and adequacyecialist care and.1 be, contrary ton and pregnantera! practitioner;
ected Kinds
'ynecoiogist
17—44 years)
21
13
614232423
al Center for 1-lealth
i
and care in a hospital outpatient department, incorporating the bestof recent medical research, may be better than care from a privatephysician long since departed from medical school.
Nevertheless, it is fair to conclude that the poor do not receivethe same kind of medical care received by most middle-incomecitizens. One manifestation of the pursuit of a desirable level ofcare and differences in the place in which care is obtained is theless convenient care received by low-income persons. The poorspend 50 per cent more time traveling and waiting to see aphysician than do higher-income persons. Combined waiting andtraveling time is also higher for the poor on welfare, a total of 81minutes per visit compared with 66 minutes for other poor persons(and 43 minutes for those with family incomes above $15,000). Inaddition to the higher prices for medical care, the poor also facesubstantial burdens on the nonmonetary resources of their house-holds in seeking medical care. Furthermore, although welfarerecipients for the most part pay no monetary price under Medicaidfor health services, they have assumed higher nonmonetary costs.
2. DISTRIBUTION OF MEDICAID BENEFITSAlthough it is clear that the poor have made striking gains relativeto higher-income groups in using medical services, it is also truethat not all the poor have shared equally in these gains. Persons notreceiving public assistance lag substantially behind Medicaid re-cipients in use of services. But even for those covered by Medicaid,program data suggest that benefits are very unevenly distributed.In this section we explore in greater detail the sources of variationsin use of services among public assistance recipients and theirexperience relative to other low-income persons.
Medicaid is a federal-state program in which states have consid-erable leeway to determine eligibility for benefits, range of medicalservices covered, and limits on benefits for any given type ofservice. About half the states provide coverage for medically needypersons who, although not sufficiently poor to qualify for publicassistance, are unable to meet the costs of medical bills.7 Althoughall states are required to provide certain basic services such ashospital and physician care, some states also provide a wide rangeof supplementary services such as drugs, dental, and clinic ser-vices. -
399I
Impact of Medicaid on Access to Medical Care

I
dures estabThese optional features of the Medicaid program give rise to bothsubstantial interstate variation in benefits. In 1970 payments per tion of thosichild recipient, for example, ranged from $43 in Mississippi to $240 may be relain Wisconsin.8 Furthermore, most states in the Deep South cover For exampionly about one-tenth of poor children, whereas in the Northeast but withnearly all poor, and many near-poor, children receive services. substitute FSimilar variations in benefits characterize the adult Medicaid ness of phcategories, influencedMedicaid benefits not only are unevenly distributed by state, but services bywhites and urban residents receive a disproportionately large share ment (whicof them. Payments per white recipient are 75 per cent higher than A complpayments per black recipient.9 Rural residents get few benefits would inchfrom the program. For example, poor children in rural areas have age, sex, ionly 11 per cent of their medical expenditures met by Medicaid, measures ocompared with 75 per cent for poor children in central cities.'° includeThese sources of variation in benefits may interact and reinforce availabilityone another. For example, benefits in the South maybe low because to the poorof the high incidence of black or rural poor persons who receive little controlledor no benefits because of family composition or discriminatory ad- This moministration of the program. Similarly, the low proportion of bene- was estimafits going to these groups may, in part, be a reflection of their 1969 HIS.'greater concentration in states choosing to maintain only limited characterisMedicaid programs. variables uFurthermore, some of the variation in benefits may be attributable Rather thaito factors associated with location or race such as education, health education,status, or availability of medical resources. To better understand the tion groupindependent influence of each of these factors, econometric tech- anotherniques are used below to estimate the utilization of hospital and reflect thephysician services by public assistance recipients. group. Cr(
more accuFactors Determining Utilization of GeograpMedicaid Services survey is]
location ofRecipients of Medicaid benefits make no direct payment for ser- and short-Ivices, and physicians are required to accept state-established reim- includedbursement levels as payment in full for services. Therefore, there is SMSA's,no price mechanism by which quantity of services demanded is persons, finecessarily equated with quantity of services that providers arewilling to supply.
Actual utilization of services, therefore, is the outcome of a restrictingrationing process that may be affected by desires of physicians medicallyregarding the patients they prefer to treat, willingness of patients to addition, tprovide the time and effort required to obtain services, and proce-
401 rn400 Davis and Reynolds
I

give rise to70 payments perississippi to $240eep South coverin the Northeastreceive services.adult Medicaid
uted by state, buttately large sharecent higher thanget few benefitsrural areas haveet by Medicaid,ntral cities)0
act and reinforcey be low becausevho receive littlescriminatory ad-portion of bene-flection of their
only limited
be attributableducation, healthr understand the
tech-of hospital and
)ayment for ser-stablished reim-ierefore, there ises demanded isat providers are
e outcome of as of physicians
ess of patients toices, and proce-
j
dures established by states administering the program that mayaffect both the total quantity of services available and the distribu-tion of those services among recipients. In addition, use of servicesmay be related to alternatives available to recipients and providers.For example, poor persons in areas with charity hospital facilities,but with few physicians willing to participate in the program, maysubstitute hospital care for care from private physicians. Willing-ness of physicians to participate, on the other hand, may beinfluenced by numbers of physicians in the area, demand for theirservices by non-poor patients, and level of Medicaid reimburse-ment (which varies from state to state).
A complete model of utilization under Medicaid, therefore,would include (1) patient characteristics, including health status,age, sex, race, education, family size, and working status; (2).measures of physician preferences among patients, which mightinclude many of the same patient characteristics as above; (3)availability of medical resources both to the entire population andto the poor covered by Medicaid; and (4) features of the programcontrolled by the states.
This model of the utilization of medical services under Medicaidwas estimated with data on 3,163 public assistance recipients in the1969 HIS.1' The survey provides much of the detail on individualcharacteristics that is required for this analysis. The health statusvariables used were chronic conditions and restricted activity days.
than single variables indicating age and head of householdeducation, dummy variables were used for several age and educa-tion groups to capture nonlinearities in these effects. In addition,another dummy variable was entered for females age 17 to 44 toreflect the greater utilization of prenatal and maternal care by thisgroup. Cross-product terms of race and region were specified tomore accurately indicate where racial inequalities may occur.'2
Geographical identification of individuals interviewed in thesurvey is limited. Using what information was provided on thelocation of individuals, measures of the availability of physiciansand short-term general hospital beds per 1,000 population wereincluded as follows: for persons living in the twenty-two largestSMSA's, figures for these particular areas were used; for otherpersons, figures for the census region broken down by SMSA andnon-SMSA residence were inserted.'3
Variation attributable to state program features is reduced byrestricting the sample to public assistance recipients, excludingmedically needy persons covered by Medicaid in some states. Inaddition, the analysis focuses on hospital and physician services,
401 Impact of Medicaid on Access to Medical Care

I
two basic services required by law and for which states may beexpected to less frequently impose stringent restrictions onbenefits.
A possible source of bias that may continue to exist in the resultsrelates to the absence of Medicaid programs in eleven states at thebeginning of the year of the survey. Since seven of these stateswere in the South, an attempt was made to alleviate this problem byintroducing a dummy variable for residence in the South. Thiseffort, however, proved to have no significant impact on the resultsand is not included in the results reported.
For comparison purposes, similar estimates of utilization arepresented for low-income persons (family income below $5,000)not receiving public assistance.'4 This is a heterogeneous group,including some medically needy Medicaid recipients, some work-ing poor with private health insurance, and some poor withouteither public or private coverage. Although the incidence of Medi-care and private insurance coverage in this group might be ex-pected to have a substantial impact on the utilization of services bythis group, such information was not available in the survey. Part ofthe role played by insurance coverage may, however, be reflectedin the variable that reflects working status.
For each dependent variable—physician visits in theprior to the interview and hospital episodes and days for thepreceding year—a large number of values are concentrated at zero.Since the classical least squares regression model is inappropriatein such cases, the Tobit estimation technique was used for thisanalysis.'5
TABLE 4 Tc01
Constant
Restricted activitdays
Chronic conditioi
Age 17—44
Age 45-64
Age 65 and over
Female
Female, age 17—
Head of househoeducation, 9.-iyrS.
Head of househoeducation,>yrs.
Family size
Working
¼
Econometric Results for the PoorThe results of the Tobit estimation of physician and hospitalutilization for public assistance recipients and other low-incomepersons are presented in Table 4. Chi-squares show that thecharacteristics included in the estimates contribute significantly tothe explanation of the utilization of health services in all cases.
As shown in Table 4, both health status variables—restrictedactivity days and chronic conditions—are highly significant inexplaining utilization by public assistance recipients and otherlow-income persons. The impact of health status is illustrated moreclearly in Table 5, which gives the expected values for physicianvisits, hospital episodes, and hospital days for varying hypotheticallevels of health status, with other independent variables held
Black—South
Black—outside.South
Physicians
Hospital beds
Chi-square
NOTE: t statistics i
'Persons with famil
402 Davis and Reynolds . 403I
Ii

h states may berestrictions on
:ist in the resultsyen states at theof these states
this problem bythe South. Thisct on the results
f utilization arebelow $5,000)
geneous group,nts, some work-e poor withoutidence of Medi-p might be ex-rn of services by
survey. Part ofrer, be reflected
i the two weeksd days for the
entrated at zero.is inappropriateLS used for this
n and hospitallow-income
show that thesignificantly toin all cases.
bles—restrictedsignificant in
ents and other.llustrated more
for physicianng hypotheticalvariables held
I
TABLE 4 Tobit Results—Public Assistance Recipients andOther Low-Income Persons, 1 969a
Public As
PhysicianVisits
sistance A
HospitalEpisodes
ecipients
HospitalDays
Other LoPhysician
Visits
w-IncomeHospitalEpisodes
Persons
HospitalDays
Constant —1.898(7.04)
—2.842(4.44)
—65.37(5.14)
—3362(28.36)
—3288(15.91)
—54.52(17.49)
Restricted activity 0.135 0.137 2.63 0.198 0.130 1.99days (9.99) (8.87) (8.71) (32.31) (22.53) (23.32)
Chronic conditions 0316(7.82)
0.196(4.23)
3.21(3.53)
0341(19.21)
0252(15.28)
3.93(15.97)
Age 17—44
Age 45-64
Age 65 and over
—0.363(1.32)
—0.172(0.87)
—0.424(2.15)
—0.157(0.51)0.065
(0.28)0.121
(0.53)
1.81(0.30)3.71
(0.81)5.92
(1.31)
—0.164(1.62)
—0.181(2.19)
—0.144(1.75)
0242(2.57)0.391
(5.09)0.578
(7.57)
4.67(328)6.47
(5.59)9.36
(8.14)Female —0.003
(0.02)—0380(2.52)
—7.81(2.62)
0.149(2.60)
—0.199(3.73)
—3.47(4.34)
Female, age 17—44 0.952(3.19)
1.960(5.83)
29.33(4.49)
0.519(4.88)
1241(12.83)
15.30(10.49)
Head of household —0.091 0205 4.91 0.129 0.181 235education, 9—12 (0.76) (1.51) (1.83) (2.45) (3.77) (325)yrS.
Head of household 0.565 0.001 —1.88 0.097 —0.053 —0.93education,> 12 (1.94) (<0.01) (026) (1.17) (0.69) (0.79)yrs.
Family size —0.136(428)
—0.105(2.88)
—2.37(326)
—0.078(5.06)
0.006(0.42)
0.01(0.05)
Working 0.060(026)
—0.099(0.38)
—0.57(0.11)
—0.019(0.32)
—0.323(5.77)
—532(629)
Black—South —0242(1.61)
—0.740(3.77)
—10.50(2.71)
—0.449(5.60)
—0.510(6.71)
—6.44(5.60)
Black—outside —0.336 —0.173 — 1.33 —0.050 —0.086 —137South (2.30) (1.04) (0.41) (0.54) (0.96) (1.02)
Physicians 0.108(1.01)
—0.187(1.47)
—2.04(0.82)
0261(5.39)
—0.066(1.44)
024(036)
Hospital beds — 0.164(1.11)
4.42(1.52)
— 0.023(0.52)
1.12(1.64)
Chi-square 391 331 294 2274 1730 1734
NOTE: I statistics in parentheses.a Persons with family income under $5,000.
403 Impact of Medicaid on Access to Medical Care

Physician visits 4.09 4.95 7.10 2.69 3.36 5.12Hospital .141 .162 .210 .090 .108 .151
admissionsHospital days 2.40 2.72 3.47 1.18 1.42 2.04
The duthe speciboth grouby MedicThe expeyears oldgroup, remean valeligible fcare recetion of cassessedhas beenin the he
FemahMedicaidpublic asmoremonetaryresults fcantly strrecipientthe last t'higher t]recipient
The efin the reIndividureceivedAmong pno disceswelfare i
Interp:must behousehol!benefitsmore effibased oneducatiothose wiAithougimore efrelativel
Average health status is defined as at the mean level of restricted activity days and chronic con-ditions for all low-income persons. Good health status is that at half the means. Poor health status isthat at twice the means.
constant at their mean values for the whole low-income population.In every case public assistance recipients make more use ofservices than other low-income persons. For example, a poorperson who is average with respect to health status would receive52 per cent more physician visits and undergo nearly twice as manydays of hospital care as a similar poor person not on welfareby reducing the price of care to zero, Medicaid has had a substantialimpact on utilization of those poor who are eligible for Medicaidbenefits.
Although poor persons with more severe health problems makemuch wider use of medical services, public assistance recipientsare somewhat less sensitive to health status as a determinant ofutilization than other poor persons. This occurs largely because ofthe high levels of utilization among Medicaid recipients in rela-tively good health. For example, as health status deteriorates from"good" to "poor," physician visits by public assistance recipientsincrease by 74 per cent compared with 90 per cent for otherlow-income persons.
Similarly, public assistance recipients show little sensitivity toage as a determinant of either inpatient or outpatient care, afteradjustment for health status. Only among the elderly, who receivesignificantly less ambulatory care than other public assistancerecipients, does age have a significant impact. On the other hand,substantial differences occur by age for other poor persons. Chil-dren receive more ambulatory care than adults age 45 to 64 andhospitalization increases uniformly with age, even with adjustmentfor health status.
404I
Davis and Reynolds 405
TABLE 5 Annual Predicted Utilization for Low-IncomePersons by Health Status and Welfare Eligibility,Adjusted for Other Characteristics, 1969
Health Statusa
Public Assistance Recipients Other Low-Income PersonsGood Average Poor Good Average Poor

Incomee Eligibility,1969
v-Income Persons
Average Poor
3.36 5.12.108 .151
1.42 2.04
days and chronic con-s. Poor health status is
ome population.:e more use ofxample, a poors would receive[y twice as manyii welfare. Thus,iad a substantialle for Medicaid
problems maketance recipientsdeterminant of
because ofcipients in rela-eteriorates fromtance recipients
cent for other
Je sensitivity totient care, after1y, who receiveiblic assistancethe other hand,r persons. Chil-
45 to 64 andwith adjustment
The dummy for women of ages 17 to 44 proves a good proxy forthe special health care needs of females of child-bearing age forboth groups. In this area the contrast in the amount of care receivedby Medicaid recipients and other poor women is especially sharp.The expected number of physician visits by females from 17 to 44years old, for instance, is 8.8 and 4.7 per year for members of eachgroup, respectively, when other variables are held constant at theirmean values. As shown earlier, although women in this age groupeligible for Medicaid have made substantial gains in the amount ofcare received, these gains are not equally reflected in the propor-tion of care received from specialists. Nonetheless, it can beassessed that maternity care has been one area in which Medicaidhas been especially successful in meeting an important deficiencyin the health care of the poor.
Females in other age groups have not shared equally underMedicaid. This suggests that the time constraints of women onpublic assistance may be more binding because their services aremore needed in the home. The effect of the constraint of non-monetary resources in welfare households is also evident in theresults for the family-size variable. Family size proves a signifi-cantly stronger constraint on the use of health services for Medicaidrecipients than for other low-income persons. The interpretation ofthe last two variables is supported by evidence earlier cited on thehigher traveling and waiting time spent by public assistancerecipients.
The effect of constraints on household resources is also evidentin the results for the variable indicating normal working status.Individuals not on public assistance who are regularly employedreceived significantly less care in hospitals than other poor persons.Among public assistance recipients, the working-status variable hasno discernible effect largely because such a small proportion of thewelfare population is in the labor force.
Interpretation of the results for head of household educationmust be tentative, although they do tend to show that persons inhouseholds in which the head has more education recognize thebenefits of more health care, but also organize to receive care on amore efficient basis. For public assistance recipients, differencesbased on head of household education are apparent for those witheducation between nine and twelve years for hospitalization andthose with better than a high school training for ambulatory care.Although prices do not serve as an incentive for such persons to bemore efficient in obtaining care, as was also reflected in therelatively strong influence of family size, nonmonetary constraints
405 Impact of Medicaid on Access to Medical Care

play a significant role in determining utilization in such house- TABLE 6 4holds. In other low-income households, education of the head F
seems to contribute to utilization if it is limited to some high school F
level training. That the level of utilization should not di'Ter be-tween those in households where the head has more than and less Putthan a high school education may reflect distortion created by the Physihouseholds in which the head is highly educated but is deferring Vis
medical attention with the expectation that the household's income White 5will improve. Black—None of the availability variables substantially affect the utiliza- South 4tion of health services, with the exception of ambulatory care Black—received by non-welfare poor persons. In part, this may reflect the outsideinappropriate measure of these variables, since the poor may be Southrestricted to a subset of all providers such as county hospitals orthose physicians practicing in low-income neighborhoods. Thereare also two economic forces that may contribute to this result. markedlyFirst, since Medicaid patients do not pay for the care, providers, ences beespecially with regard to ambulatory care, lack the ability to affect than forthe utilization patterns of these persons by ordinary economic significaimeans. Second, hospitals may be quite arbitrary in their hospitali- blacks anzation of poor persons in seeking to fulfill their occupancy goals and recipientcharity obligations. Such behavior is plausible since low-income than ampersons receive a large amount of ambulatory care at hospital values foutpatient departments, thus affording hospitals wide leverage over admittedwhether to admit these patients for inpatient treatment if there is a cipientsslack in occupancy levels, welfare
Separate estimates of utilization were obtained omitting the than for 1availability measures and including dummy variables for nonmet- Althouropolitan residence in the South and outside the South. Ambulatory determiiicare was lower in the rural South, but rural poor outside the Southdid not use ambulatory services significantly differently from urban size, woipoor (see Appendix 3, Table 1). However, the rural South variable constant,was not significant when the availability measures were also most phincluded (see Appendix 3, Table 2), perhaps because of the col- Discrimilinearity inherent in the construction of the availability measures. criminat
The race variables reveal that the benefits of Medicaid have not munitiesbeen shared equally by blacks and whites even after individual and . physiciafamily characteristics have been taken into account. Black patientsMedicaid recipients in all areas receive less ambulatory care, and allocateblack hospitalization rates are also lower in the South.'6 As shown patients.in Table 6, blacks do receive more care with Medicaid than they are requwould without it; the improvement in ambulatory care is greatest in patientsthe South and in hospital care outside the South. Medicaid also
406 Davis and Reynolds 407I
I

r such house-of the head
ie high schoolnot diTer be-than and lessreated by theit is deferringhold's income
ect the utiliza-bulatory carenay reflect thepoor may be
ty hospitals orrhoods. Thereto this result.Lre, providers,bility to affectary economicheir hospitali-ancy goals ande low-incomere at hospitalleverage overnt if there is a
omitting thees for nonmet-h. Ambulatoryside the Southtly from urbanSouth variable•es were alsoise of the col-lity measures.icaid have notindividual andcount. Blacktory care, and
As showncaid than theye is greatest inMedicaid also
TABLE 6 Annual Predicted Utilization for Low-IncomePersons, by Welfare Eligibility, Region, andRace, Adjusted for Other Characteristics
Public A
PhysicianVisits
ssistance Rec
HospitalEpisodes
ipients
HospitalDays
Other LoPhysician
Visits
w-lncome
HospitalEpisodes
Persons
HospitalDays
White 5.28 0.176 2.87 3.51 0.114 1.50Black—
South 4.23 0.089 1.73 2.33 0.067 0.95Black—
outsideSouth 3.88 0.151 2.70 3.36 0.105 1.37
markedly increases utilization by whites. Outside the South, differ-ences between the races are in fact greater for Medicaid recipientsthan for other low-income persons. Outside the South there is nosignificant difference in the number of physician visits betweenblacks and whites not on public assistance, whereas among welfarerecipients physician visits among whites are 24 per cent higherthan among blacks, holding other, variables constant at the meanvalues for all low-income persons. White welfare recipients areadmitted to hospitals nearly twice as often as black welfare re-cipients of similar characteristics in the South, while among non-welfare recipients admissions for whites are 70 per cent greaterthan for blacks.
Although it is not possible on the basis of this analysis todetermine definitely what accounts for the racial differences, someexplanations can be ruled out. For example, since education, familysize, working status, and availability of medical resources are heldconstant, racial differences cannot be traced to these factors. Themost plausible explanation for the difference is discrimination.Discrimination can be either overt or institutional.'7 Overt dis-criminatory practices are apparently still prevalent in some com-munities. For example, in one Alabama town, the four whitephysicians all maintain segregated waiting rooms, keep blackpatients waiting until all white patients have been seen, and thenallocate the remainder of the working day to the care of blackpatients. Those patients for whom time does not permit treatmentare requested to return the following day. Waiting times for blackpatients average between four and six hours.'8 Such discriminatorypractices obviously limit utilization by blacks.
407I
Impact of Medicaid on Access to Medical Care

Frequently, however, discrimination is institutionalized, arisingfrom segregated housing patterns, or past overt discriminatorypractices that affect current patterns of physician location, hospital programstaffing patterns, referral patterns, and patient preferences. Hearings of each o
financialon Civil Rights Act enforcement in Medicare and Medicaid re- to receivcently held by the House Judiciary Committee indicate that institu- need. Yetional discrimination is widespread. Among the causes cited are the loweconvenience of some institutions to black communities, farniliarit>' the poor,with some institutions from past associations, absence of a private Dataphysician causing patients to turn to charity hospitals, short supply, potentialof physicians in minority neighborhoods, and patients not informed
or aware that Medicaid benefits are available in private hospitals. vices perincomesSome practices, such as ambulance drivers taking black accident About hvictims to charity hospitals and expansion of hospital staffs re- services,stricted to specialists (whereas black physicians tend to be general for servipractitioners), may be either overt or "statistical" discrimination expensivdepending on whether the rules these decisions are Whites rdevised for the purpose of excluding blacks from some facilities or than eldsimply work out on average to exclude blacks.19 black peIn summary, substantial differences exist in the manner in which
health services are allocated among persons eligible for Medicaid represenand other low-income persons. Health status, however, is the major ing reim
countiesdeterminant of utilization for both groups, although public assist- for theance recipients' use of services is somewhat less sensitive to health Regionalstatus than that of other low-income persons. The poor not receiv- West weing public assistance receive substantially fewer services than three-quthose on welfare, even after adjustment for health status is made. locationDifferences by age in utilization that are evident for the poor not on Part owelfare are not apparent for those receiving public assistance. associateThere is evidence that nonmonetary effects have substituted for tion,monetary allocation of services among Medicaid recipients. As aresult blacks, females other than those of child-bearing age, and economthose in large families have not equally shared the gains made elderlyunder Medicaid. Unlik
substantrequired($50 in
3. DISTRIBUTION OF MEDICARE BENEFITS deductilthatUnlike Medicaid, Medicare is a uniform, federal program providing per centmedical care benefits to all elderly persons covered by the social than Mesecurity retirement program. Although the same set of benefits is The priavailable to all covered persons regardless of income, race, or allocatin
408 Davis and Reynolds 409

alized, arisingdiscriminatory.ation, hospitaluces. HearingsI Medicaid re-ite that institu-uses cited arees, familiarity
ce of a privates, short supplys not informed,ate hospitals.lack accident)ital staffs re-I to be generaldiscriminationdecisions are
ne facilities or
tnner in whichfor Medicaid
is the majorpublic assist-itive to health)or not receiv-services thantatus is made.he poor not onlie assistance.ubstituted forcipients. As a
age, ande gains made
ram providingI by the social
of benefits isome, race, or
geographical location, wide differences also exist in the Medicareprogram in the use of services and receipt of payments on the basisof each of these factors. It was originally hoped that the removal offinancial barriers to medical care would enable all elderly personsto receive medical care services largely on the basis of medicalneed. Yet, those elderly population groups in the poorest health arethe lowest utilizers of medical care services under the program—the poor, blacks, rural residents, and residents of the South.
Data from the Medicare program indicate that in 1968 estimatedpotential reimbursement for supplemental medical insurance ser-vices per person enrolled was twice as high for elderly persons withincomes above $15,000 as for persons with incomes below $5,000.About half of this difference reflects differences in quantity ofservices, whereas the other half represents a higher payment levelfor services (which in turn may be accounted for by a moreexpensive mix of services, better care, or pure price differences).Whites receive 60 per cent more payments for physician servicesthan elderly blacks, and more than double the payments per elderlyblack person enrolled in the South, with nearly all the differencerepresenting differences in percentage of eligible persons receiv-ing reimbursable services.20 Elderly persons in nonmetropolitancounties average $250 from Medicare annually compared with $360for the elderly in metropolitan counties with a central city.2'Regional differences are also substantial. Physician benefits in theWest were 40 per cent higher than in the South in 1968. Aboutthree-quarters of the variation in these benefits on the basis oflocation reflects differences in quantity of services received.22
Part of these large differences may be attributable to factorsassociated with income, race, and location—factors such as educa-tion, health status, and availability of medical resources. Again, toinvestigate the role played by each of these several factors, aneconometric analysis of utilization of medical services by theelderly was made using the 1969 HIS.
Unlike the Medicaid program, Medicare beneficiaries pay asubstantial portion Of the cost of physician services. The elderly arerequired to pay the first $60 of physician expenses during the year($50 in 1969), 20 per cent of all allowed charges in excess of thedeductible, and any excess of the actual charge for a service overthat determined by Medicare as reasonable. In 1972, on about 56per cent of Medicare claims, physicians agreed to charge no morethan Medicare allows; on the rest, they were not so restrained,23The price mechanism, therefore, may play a stronger role inallocating services to Medicare beneficiaries.
409I
Impact of Medicaid on Access to Medical Care

Two groups of elderly, however, are not subject to the deductibleand coinsurance amounts: those elderly Medicaid recipients whosestates "buy" them Medicare coverage and those elderly purchasingsupplementary private health insurance. Unfortunately, the 1969Health Interview Survey, although noting eligibility for publicassistance, does not indicate which elderly persons have privateinsurance as well as Medicare. Since higher-income elderly per-Sons are more likely to purchase supplementary private insurance,including income in an examination of utilization of medicalservices by the elderly will capture both the direct effect of incomeand possible lower net prices faced by higher-income persons whopurchase insurance. The dummy variable for public assistancerecipients should capture the effect of zero price for those elderlycovered by Medicaid and Medicare.
Health status is measured, as in the Medicaid model, by re-stricted activity days and chronic conditions, as well as a dummyvariable indicating some limitation of activity attributable tochronic conditions. Several additional proxies for health status areage, sex, and working status. The dummy variable for elderlypersons who consider working as their usual activity may alsoreflect a greater time constraint for working persons. Since Medi-care program data indicate that blacks in the South receive fewerbenefits than blacks in other areas, and still less than whites,separate race dummies for the South and areas outside the Southwere included in the analysis. Because of the limited education ofthe elderly, education was captured by a dummy variable for allpersons with nine or more years of education rather than morerefined educational classes.
Availability of medical resources, measured by physicians per1,000 persons and short-term general care hospital beds per 1,000population, was also introduced into the model. The appropriate-ness of including both supply and demand variables in a market inwhich price plays a major role has been addressed in other studies.With respect to physician services, Feldstein (1970) theorizes thatthe physician sets both price and supply such that excess demandexists for his services, whereas the consumer is simply a price-taker.24 Fuchs and Kramer (1972) suggest alternatively that demandis supply-induced. An increase in physicians per capita is likely toreduce travel and time costs to the patients. In addition, they argue,physicians may inflate demand when supply has some slack byusing their discretionary power to recommend to a patient his needfor more care.25 Again, with respect to hospital utilization, severalpossible arguments are the existence of excess demand, the
410 Davis and Reynolds 411
physician-tionship b
Data usSurvey ofsurvey incexcludedincome oisample sigression a
EconometriTobit reghospital .cequations
All mdiarethe physiequationsstatus sufa measurThus,
CompuTable 8independobservatideterminMorbiditslightly 1teristics.visits varbut no onphysicianaverage.
Whenincreaseaverage Imore phand not rhigher-inprovisior

the deductiblecipients whose
purchasingLtely, the 1969lity for publics have privateie elderly per-'ate insurance,)fl of medicalffect of incomee persons who)lic assistance
•r those elderly
model, by re-11 as a dummyLttributable to
status arele for elderlyivity may alsos. Since Medi-receive fewerthan whites,
side the Southd education of'ariable for all
than more
physicians per)eds per 1,000e appropriate-in a market in
i other studies.theorizes that
demandimply a price-ly that demandpita is likely toon, they argue,some slack byatient his needzation, severaldemand, the
physician-agent relationship, and the incompleteness of that rela-tionship because of peer group pressure on the physician.26
Data used in the analysis are also from the 1969 Health InterviewSurvey of the National Center for Health Statistics. In 1969, thesurvey included 11,970 persons age 65 and over. Observations wereexcluded from this analysis for persons for whom either familyincome or education was unknown or not reported, reducing thesample size to 10,573. Like in the Medicaid estimates, Tobit re-gression analysis is employed.
Econometric Results for the ElderlyTobit regression results are given in Table 7 for physician visits,hospital days, and hospital episodes. Chi-square tests indicate theequations to be statistically significant.
All indicators of morbidity contribute positively to utilization andare highly significant. Age, however, has a negative coefficient inthe physician visit equation and positive coefficients in the hospitalequations. Measures of morbidity apparently control for healthstatus sufficiently to permit the age variable to act predominantly asa measure of the physical accessibility of services to the elderly.Thus, the very old are less likely to seek ambulatory care butcompensate somewhat by utilizing more institutional care.
Computed annualized values of physician visits are shown inTable 8 for different incomes and health status levels, holding otherindependent variables constant at their mean values. The strikingobservation is that health status does play the predominant role indetermining the number of physician visits a person will make.Morbidity measures of twice the mean levels typically causeslightly less than twice as many visits as average morbidity charac-teristics. This relationship is stable for all income classes. Physicianvisits vary more among income classes for persons in better health,but no one in good health, for example, will ordinarily receive morephysician services than an elderly person whose health is onlyaverage.
When adjustment is made for health status, physician visitsincrease uniformly with income. As shown in Table 8, persons inaverage health and with incomes above $15,000 made 70 per centmore physician visits than low-income persons in similar healthand not receiving public assistance. The increase in utilization forhigher-income persons may occur either because the cost-sharingprovisions of Medicare are less of a deterrent to use as income rises
411 Impact of Medicaid on Access to Medical Care

TABLE 7 Tobit Results, Persons Age 65 and Over, 1969
PhysicianVisits
HospitalEpisodes
HospitalDays
Constant — 1.954
(4.85)—3.282(7.42)
—67.34(8.53)
Chronic conditions 0.314(13.91)
0.151(6.90) •
223(5.71)
Limited in activity 0302(3.93)
0.602(8.15)
11.98(9.10)
Age —0.018(3.40)
0.008(1.55)
0.15(1.76)
Restricted activity 0.120 0.115 2.02days (16.83) (17.24) (17.11)
Income $5,000—10,000 0.148(1.77)
0253(320)
3.71(2.63)
Income $10,000—15,000 0.301(2.25)
0.398(3.13)
4.14(1.81)
Income $15,000 + 0.720(5.01)
0.493(3.46)
7.98(3.15)
Public assistance 0.356 —0.056 — 1.10
recipient (2.60) (0.41) (0.45)Family size —0.066 0.015 0.43
(2.14) (0.54) (0.86)Female 0.143
(2.16)—0.062(0.99)
—125(1.12)
Individual education, 0.179 —0.021 —0.059 years and over (2.66) (0.33) (0.04)
Working —0.066(0.68)
—0.306(3.13)
—6.08(3.45)
Black—South — 0.559
(3.40)0.664
(4.16) •
—9.85(3.47)
Black—outside South —0.115(0.62)
—0.050(0.28)
1.78(0.58)
Physicians 0.187(2.80)
—0297(4.49)
—335(2.86)
Hospital beds — 0.072(120)
229(2.12)
Chi-square 899 811 786
NOTE: t statistics in parentheses.
TTABLE 8 A
S.D
Family Income
Under $5,000No aidAid
$ 5,000—9,999$10,000—14,999$15,000 and ovei
SOURCE: Calculate.Good health is defiAverage and poor hindicators used.
or becaussuppleme
Thesuggests tservices.cost-shariper cent ppublic asszation SW.
Utilizatever, theand lowesper centincome eurgencywill, for ti
Publicpitalizati(which ispublic aseliminatiiphysicianto substitless need
Racialaverage h
412 Davis and Reynolds 413 In

ver, 1969
HospitalDays
—67.34(8.53)223
(5.71)11.98(9.10)
• 0.15(1.76)2.O2
(17.11)3.71
(2.63)4.14
(1.81)7.98
(3.15)—1.10(0.45)0.43
(0.86)-125
(1.12)—0.05(0.04)
—6.08(3.45)
—9.85(3.47)1.78
(0.58)— 3.35
• (2.86)229
(2.12)
786
TABLE 8 Average Physician Visits for the Elderly, by HealthStatus and Family Income, Adjusted for OtherDeterminants
Family Income Good
Health Statusa
Average Poor
Under $5,000 S
No aid 2.78 5.64 10.47Aid 3.86 7.52 13.42
$ 5,000—9,999 3.14 6.60 11.70$10,000—14,999 3.75 7.27 12.98$15,000 and over 5.35 9.53 16.98
SOURCE: Calculated from Table 7 and tabulations from the 1969 HIS.'Good health is defined as no chronic conditions, limitation of activity, or restricted activity days.
Average and poor health are defined at the mean and twice the mean level of the three morbidityindicators used.
or because higher-income persons are more likely to purchasesupplementary private insurance and hence face a lower net price.
The significance of the public assistance recipients variablesuggests that reduction in net price has a positive impact on use ofservices. Persons on public assistance, and hence likely to havecost-sharing amounts paid by state Medicaid plans, receive 30 to 40per cent more services than other low-income persons not receivingpublic assistance, holding constant for other determinants of utili-zation such as health status, age, sex, race, and education.
Utilization of hospital services also increases with income; how-ever, the difference in average hospital days between the highest-and lowest-income groups is only 40 per cent as compared with a 70per cent spread for outpatient visits (see Table 9). The lowerincome elasticity for hospital care may reflect the greater medicalurgency of institutional care so that even lower-income personswill, for the most part, pay the hospital deductible (of $44 in 1969).
Public assistance recipients do not differ significantly in hos-pitalization from other elderly persons with incomes under $5,000,which is plausible for two reasons. There are no extra benefits forpublic assistance recipients under the hospital plan similar to theelimination of deductible and coinsurance amounts under thephysician plan. In addition, the elderly on welfare are more likelyto substitute physician visits for hospitalization, and thus they haveless need to enter the hospital than poor persons not on welfare.
Racial differences in the South are substantial. Although theiraverage health status is worse than for the population as a whole,27
413I
Impact of Medicaid on Access to Medical Care

physicianhowever,areas wh€average ciis that theurban parphysiciancovered 1
The elaofhospital cvary muchigh of L0.92 foun
The 1osions, incmore sevhospitalFeldsteinvices foradmiss ioi
Separasures revSouthelderly, I
deny (semeasuressignificai4).
TABLE 9 Average Hospital Utilization for the Elderly, byHealth Status and Family Income, Adjusted forOther Determinants
T
Family Income Good
Health Statusa
Average Poor
Hospital Episodes.
Under $5,000 .114 .210 .362$ 5,000—9,999 .140 .250 .427$10,000—14,999 .159 .285 .472$15,000 and over .177 .312 .512
Under $5,000 2.31
Hospital Days
4.21 7.21$ 5,000—9,999 2.78 4.93 8.16$10,000-14,999 2.85 5.02 8.29$15,000 and over 3.52 6.06 9.77
'See Table 8 for definitions of health status levels.
elderly Southern blacks receive fewer ambulatory services than anyincome group. Elderly blacks in average health in the South makehalf as many physician visits (2.91 visits per person) as otherpersons age 65 and over if their income is under $5,000, and theyreceive no public assistance and make two-thirds as many visits(6.67 visits per person) as others if they are in the highest-incomeclass. By contrast, differences in use of physicians by race are notevident outside the South. Medicare has made no attempt to insistthat physicians not discriminate among patients on the basis of race,arguing that Medicare merely reimburses patients for servicesreceived and does not enter into contractual agreements withphysicians.
Racial differences in hospital care also exist in the South, al-though Medicare has attempted to enforce nondiscriminatory prac-tices in hospitals.28 Elderly blacks in the South in average healthspend 2.84 days in the hospital whereas other elderly personsaverage 4.60 days. This suggests that discrimination in hospitalsmay be as extensive as that shown by individual physicians in theSouth, although physicians are not required to assert compliancewith provisions of the Civil Rights Act. In regions outside theSouth, blacks are not hospitalized significantly less than whites.
The availability of more physicians causes elderly persons to visit
414 Davis and Reynolds
TABLE 10
All residencesUrbanRural
SOURCE: CalculatMartin,Medical
415I

1physicians more often for reasons cited earlier. Table 10 shows,however, that the elasticity of supply is generally lower in thoseareas where the number of physicians per capita is the lowest (foraverage characteristics in those areas). An implication of this resultis that there is perhaps a surfeit of physicians in the Northeast andurban parts of the West, since a large proportion of small changes inphysician manpower in those areas may be absorbed by thosecovered by Medicare.
The elasticity of hospital episodes with respect to the availabilityof hospital beds is 0.47, whereas the elasticity estimated from thehospital day equation is 0.94. The hospital day elasticity does notvary much by region, ranging from a low of 0.88 in the West to ahigh of 1.01 in North Central states and is similar to the elasticity of0.92 found by Feldstein for the whole population.29
The local supply of physicians contributes negatively to admis-sions, indicating that physicians are inclined to hospitalize onlymore severe cases among the elderly. Overall, the elasticity ofhospital days with respect to physicians is —0.20, confirmingFeldstein's suggestion that "better organization of physicians' ser-vices for Medicare patients could generally reduce costly hospitaladmission."3°
Separate estimates of utilization omitting the availability mea-sures reveals that elderly persons in nonmetropolitan areas of theSouth make significantly fewer physician visits than the urbanelderly, but rural elderly both in the South and outside the Southexperience somewhat more hospital episodes than the urban el-derly (see Appendix 3, Table 3). Including both the availabilitymeasures and the geographical variables, however, eliminates thesignificance of the geographical variables (see Appendix 3, Table4).
TABLE 10 Elasticities of Physician Utilization with Respectto Physicians per Capita for the Elderly, by Regionand Residence for Characteristics in those Areas
AllRegions Northeast North Central South West
All residences .80 1.00 .74 .61 .93Urban .81 1.02 .77 .62 .94Rural .54 .88 .57 .47 .57
Elderly, byAdjusted for
Poor
es.
.362
.427.472.512
7.218.168.299.77
rvices than anyhe South makerson) as other,000, and theyas many visitsiighest-incomey race are not
ttempt to insistie basis of race,ts for services
with
the South, al-minatory prac-average healthlderly persons)fl in hospitalsysicians in thert complianceis outside thethan whites.)ersons to visit
I
SOURCE: Calculated with data from Table 7, tabulations from the 1969 HIS, Haug, Robark, andMartin, and Distribution of Physicians in the United States, 1970 (Chicago AmericanMedical Association, 1971). /
415 Impact of Medicaid on Access to Medical Care

I
Persons with more than eight years of education received sig-nificantly more ambulatory physician services, as did females.Education,, although important in explaining physician visits, doesnot eliminate the significance of income as a major determinant ofphysician utilization. Neither education nor sex were significant inthe hospital equations.
Elderly persons who still regularly work to earn an income arehospitalized less often and for shorter periods. The net effect of thefinancial constraint posed by losing time from being on the job is 38per cent fewer hospital days than nonworking persons, holdingother factors at their expected values. Working did not have animportant effect on ambulatory care.
In summary, once adjustment is made for health status and otherdeterminants, use of medical services increases uniformly withincome. Elimination of cost-sharing requirements under the physi-cian plan for Medicaid recipients, however, brings their utilizationup to that of the middle-income elderly. The results suggest thatdiscrimination against blacks in the South by physicians andhospitals may be substantial—racial differences cannot be attrib-uted solely to differences in income or education. Use of bothphysician and hospital services by the elderly is sensitive to theavailability of medical services.
4. IMPLICATIONS FOR NATIONAL HEALTHINSURANCEAn analysis of experience with utilization of medical services underMedicare and Medicaid yields three major implications in thecurrent consideration of national health insurance. First, financingmedical care can have, and has had, a major impact on helpingcovered persons receive needed medical care services. The majorfailure—at least of Medicaid—is not in what it tried to do, but inwhat was not attempted—namely, widespread coverage of all poorpersons regardless of welfare status. As a consequence, those poorpersons excluded from Medicaid—estimated at 9 million persons in1974—have failed to achieve adequate and equitable access tomedical services. Extension of medical care financing to thesepersons, either through reform of Medicaid or national healthinsurance, should be a top priority.
Second, experience with Medicare reveals that imposition ofuniform cost-sharing provisions (deductible and coinsurance
amounts)the basisMedicaidservices anating orSons whilcould hel
Third,of personbehind itwho appmedical c'face barnsupply ofprogramsgroups irresearchthe acces
APPENDIX
DefinitionsChronic
state o:monthonset.a
Limitedkindo'
Age: agRestricte
intervibecaus
Incometo $5,(
Incometo $10
Income$15,O(
aSee
416 Davis and Reynolds 417

received sig-as did females.'cian visits, does
determinant ofIre significant in
Ii an income are1net effect of the
the job is 38rsons, holding
lid not have an
tatus and otheruniformly withnder the physi-heir utilization.ts suggest thatphysicians andnnot be attrib-t. Use of bothensitive to the
services undercations in the'irst, financingLct on helping
The majorI to do, but inage of all poor
those poorlion persons inable access to
to theseational health
imposition ofCoinsurance
I
amounts) results in wide disparities in use of medical services onthe basis of income. However, eliminating these payments forMedicaid recipients enabled them to receive similar amounts ofservices as middle-income elderly persons. This suggests that elimi-nating or reducing cost-sharing provisions for all lower-income per-sons while retaining some cost-sharing for higher-income personscould help to achieve greater equality in access to care.
Third, both Medicare and Medicaid confirm that certain groupsof persons, even if covered by medical care financing plans, lagbehind in access to care. This is a serious problem for minorities,who appear to continue to face substantial discrimination in themedical care market. Rural residents and persons in the South alsoface barriers to utilization of services, largely as a result of a limitedsupply of medical manpower. Supplementary health care deliveryprograms designed to meet the special needs of these populationgroups must be an essential part of health care policy. Furtherresearch to determine the most effective approaches to improvingthe access to care of these groups is urgently needed.
APPENDIX 1
Definitions of Independent VariablesChronic conditions: number of conditions (any departures from
state of physical or mental well-being) occurring more than threemonths prior to interview or classified as chronic regardless ofonset.a
Limited in activity: 1 if chronic conditions limit the amount orkind of major or minor activity normally performed; 0 otherwise.
Age: age in years at last birthday.Restricted activity days: number of days in two weeks prior to the
interview a person reduces amount or kind of normal activitybecause of a specific illness or injury.
Income $5,000—.9,999: 1 if family income is greater than or equalto $5,000 and less than $9,999; 0 otherwise.
Income $1O,000—14,999: 1 if family income is greater than or equalto $10,000 and less than $14,999; 0 otherwise.
Income $15,000+: 1 if family income is greater than or equal to$15,000; 0 otherwise.
aSee DE-{EW, "Current Estimates—1969,' p. 41.
417I
Impact of Medicaid on Access to Medical Care
I

ftFamily size: number of related household members; coded 8 if
family has more than 8 members.Public assistance: 1 if person is recipient of public assistance
other than social security or pensions at time of interview andfamily income is less than $5,000; 0 otherwise.
Black—South: 1 if black living in the South; 0 otherwise.Black—outside South: 1 if black living outside the South; 0
otherwise.MDPC: nonfederal patient care physicians per 1,000 population
(see Section 1 for source and description of construction of thisvariable).
BedPC: number of nonfederal short-term general and other spe-cial hospital beds per 1,000 population (see Section 1 for sourceand description of construction of this variable).
Education 9+ years: 1 if education of individual is greater than 8years; 0 otherwise.
Work: 1 if major activity in twelve months prior to interview wasworking to earn a living or working as paid for a family businessor farm; 0 otherwise.
Female: 1 if female; 0 if male.Source (unless otherwise noted above): U.S. Department of
Health, Education and Welfare, National Center for HealthStatistics, "Current Estimates from the Health InterviewSurvey—1969," Vital and Health Statistics Series 10, Number 63(Washington, D.C.: U.S. Government Printing Office, 1971).
418 Davis and Reynolds 4191
±
TABLE 1
PhysicianVisits
Aid
Restricted actividays
Chronic conditio
R2
NOTE: t statistics I'Excluding individu
education was unkn
APPENDIX
TABLE 1
Constant
Restricted activdays
Chronic conditi
Age 17—44
Age 45—64
Age 65 and ove
Female
Female, 17—44
APPENDIX 2
TABLE 1 Ordinary Least Squares EstimatesVisits, by Age Group, 1 969a
of Physician
Physician 65 andVisits All Persons Under 17 17—44 45—64 over
Constant 1.50 1.02 1.92 0.88 2.27(16.52) (7.07) (11.91) (4.00) (8.13)
Income 1.01 0.93 0.32 1.22 0.73$5,000—9,999 (9.64) (5.60) (1.76) (4.97) (1.82)
Income 1.28 1.26 0.48 1.21 1.46$1O,000—14,999 (10.90) (6.97) (2.37) (4.43) (2.20)
Income 1.60 1.58 0.72 1.56 4.36$15,000+ (11.78) (7.44) (3.08) (5.34) (5.94)

1
419 Impact of Medicaid on Access to Medical Care
TABLE 1 (concluded)
PhysicianVisits All Persons Under 17 17-44
.
45—6465 andover
Aid
Restricted activitydays
Chronic conditions
0.92(3.60)0.08
(110.56)1.62
(41.46)
0.57(1.78)
0.14(93.39)
2.86(23.47)
1.76(3.18)
0.10(72.26)
2.02(26.36)
1.24(1.60)
0.06(46.88)
1.84(24.49)
0.31(0.40)0.04
(21.72)1.56
(14.17)
R2 .12 .19 .14 .13 .08
ers; coded 8 if
iblic assistanceF' interview and
herwise.the South; 0
000 populationtruction of this
and other spe-•on 1 for source
's greater than 8
interview was'amily business
)epartment ofter for Healthith Interview10, Number 63rice, 1971).
65 and5—64 over
).88 2.271.00) (8.13)1.22 0.731.97) (1.82)1.21 1.46[.43) (2.20)1.56 4.36
(5.94)
NOTE: t statistics in parentheses.Excluding individuals reporting family income unknown, those under 17 for whom head of householdeducation was unknown, and those 17 and older for whom individual education was unknown.
APPENDIX 3
TABLE 1 Tobit Results—Public Assistance Recipientsand Other Low-Income Persons, 1 969a.
Public
Physician
Assistance Recipients
Hospital Hospital
Other
Physician
Low-Income Persons
Hospital HospitalVisits Episodes Days Visits Episodes Days
Constant — 1.718 —2.507 —51.29 —2.950 —3264 —49.05(8.03) (10.25) (10.57) (27.89) (33.31) (33.20)
Restricted activity 0.134 0.136 2.60 0.198 0.129 1.99days (9,95)
0.318(7.88)
(8.81) (8.63) (32.32) (22.50) (23.29)Chronic conditions 0.205
(4.44)3.32
(3.66)0.342
(1920)0252
(1529)3.93
(15.96)Age 17—44
Age 45—64
—0.357(1.30)
—0.172(0.87)
—0.162(0.53)
—0.073(0.32)
1.63(027)3.65
(0.80)
—0.160(1.58)
—0.183(2.21)
0242(2.56)0.395(5.13)
4.66(328)6.51
(5.62)Age 65 and over —0.410
(2.08)—0200
(0.87)6.85
(1.52)—0.147(1.77)
0.580(7.59)
9.44(821)
Female —0.007(0.06)
—0.393(2.62)
—8.06(2.69)
0.150(2.63)
—0200(3.74)
—3.48(4.34)
Female, 17—44. 0.956 1.961 29.55 0.514 1241 1527

420 Davis and Reynolds
Chronic condition
Age 17—44
Age 45—64
Age 65+
Female
Female, age 17—4
Head of householeducation, 9—12
Head of householeducation, >12
Black—South
Black—outside
421 mi
TABLE 1 (concluded) TABLE 2 (coi
Public
PhysicianVisits
Assistance
HospitalEpisodes
Recipients
HospitalDays
Other
PhysicianVisits
Low-Income
HospitalEpisodes
Persons
HospitalDays
Head of household —0.126 0.140 3.88 0.123 0.175 2.23education, 9—12 (1.04) (1.02) (1.42) (2.33) (3.63) (3.06)yrs.
Head of household 0.522 —0.081 —3.26 0.088 —0.063 —1.16education > 12 (1.79) (0.33) (0.45) (1.05) (0.81) (0.99)yrs.
Family size
Working
—0.137(4.33)0.055
(0.23)
—0.097(2.69)
—0.091(0.35)
—2.33(3.23)
—0.50(0.10)
—0.079(5.12)
—0.020(0.32)
0.008(0.57)
—0.323(5.77)
0.04(0.17)
—5.31(6.27)
Black—South —0.168(1.08)
—0.558(2.89)
—8.27(2.16)
—0.454(5.52)
—0.518(6.84)
—6.90(6.03)
Black—outside —0.315 —0.129 0.22 —0.025 —0.111 —1.44South (2.16) (0.80) (0.07) (0.27) (1.27) (1.08)
Non SMSA—South —0.245(1.61)
—0.265(1.45)
—5.13(1.42)
—0269(4.41)
—0.003(0.05)
—1.47(1.77)
Non SMSA— 0.094 0.552 9.34 —0.186 —0.029outside South (0.60) (3.18) (2.70) (3.06) (0.52) (1.78)
Chi-square 394 345 303 2268 1736 1728
yrs.
NOTE: t statistics in parentheses.'Persons with family income under $5,000.
TABLE 2 Tobit Results—Public Assistance Recipients andOther Low-Income Persons, 1 969a
yrs.Family size
Working
Public Assistance Recipients
Physician Hospital HospitalOther Low-Income
Physician HospitalPersons
HospitalVisits Episodes Days Visits Episodes Days
Constant — 1.887 — 1.874 —51.40 —3.302 —3.010 —50.10(4.88) (2.67) (3.69) (18.77) (11.71) (13.00)
Restricted activity 0.134 0.135 2.60 0.198 0.130 1.99days (9.96) (8.76) (8.62) (32.31) (22.53) (23.33)
SouthPhysicians
Hospital beds
Non SMSA—Soul /
Non SMSA—outside South
Chi-square
NOTE: t statistics in'Persons with family i
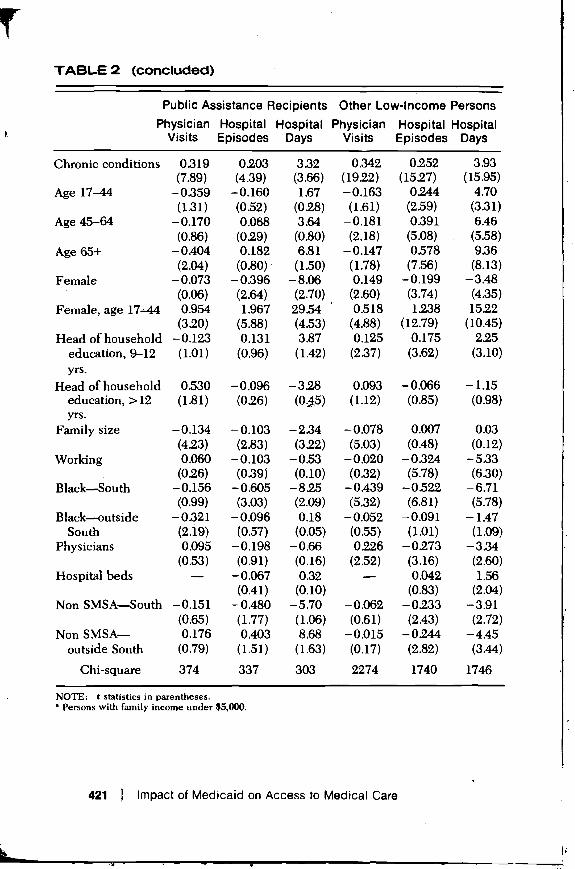
TABLE 2 (concluded)
-Income Persons
Hospital HospitalEpisodes Days
0.175 2.23(3.63) (3.06)
—0.063 —1.16(0.81) (0.99)
0.008 0.04(0.57) (0.17)
—0.323 —5.31
(5.77) (6.27)
—0.518 —6.90(6.84) (6.03)
—0.111 —1.44(1.27) (1.08)
—0.003 —1.47(0.05) (1.77)
—0.029 — 1.49(0.52) (1.78)
1736 1728
and
-Income Persons
Hospital HospitalEpisodes Days
3.010 —50.1011.71) (13.00)
0.130 1.99
(23.33)
yrs.Family size
Working
Black—South
Black—outsideSouth
Physicians
Hospital beds
3.93(15.95)4.70
(3.31)
6.46
(5.58)
9.36
(8.13)
—3.48
(4.35)
15.22
(10.45)
225(3.10)
—1.15
(0.98)
0.03
(0.12)
—5.33
(6.30)—6.71(5.78)
—1.47(1.09)
—3.34(2.60)1.56
(2.04)—3.91(2.72)—4.45
(3.44)
421 Impact of Medicaid on Access to Medical Care
Public Assistance Recipients Other Low-Income PersonsPhysician Hospital Hospital Physician Hospital Hospital
Visits Episodes Days Visits Episodes Days
Chronic conditions 0.319 0203 332 0.342 0.252(7.89) (4.39) (3.66) (1922) (1527)
Age 17—44 —0359 —0.160 1.67 —0.163 0.244(131) (0.52) (0.28) (1.61) (2.59)
Age 45—64 —0.170 0.068 3.64 —0.181 0391(0.86) (029) (0.80) (2.18) (5.08)
Age 65+ —0.404 0.182 6.81 —0.147 0.578(2.04) (0.80) (1.50) (1.78) (7.56)
Female —0.073 —0.396 —8.06 0.149 —0.199
(0.06) (2.64) (2.70) (2.60) (3.74)
Female, age 17—44 0.954 1.967 29.54 0.518 1238(320) (5.88) (4.53) (4.88) (12.79)
Head of household —0.123 0.131 3.87 0.125 0.175
education, 9—12 (1.01) (0.96) (1.42) (2.37) (3.62)yrs.
Head of household 0.530 —0.096 —328 0.093 —0.066education, >12 (1.81) (026) (1.12) (0.85)
—0.134 —0.103 —2.34 —0.078 0.007(423) (2.83) (322) (5.03) (0.48)
0.060 —0.103 —0.53 —0.020 —0324(026) (0.39) (0.10) (0,32) (5.78)
—0.156 —0.605 —825 —0.439 —0.522(0.99) (3.03) (2.09) (5.32) (6.81)
—0.321 —0.096 0.18 —0.052 —0.091(2.19) (0.57) (0.05) (0.55) (1.01)0.095 —0.198 —0.66 0226 —0.273
(0.53) (0.91) (0.16) (2.52) (3.16)— —0.067 0.32 — 0.042
(0.41) (0.10) (0.83)Non SMSA—South —0.151 —0.480 —5.70 —0.062 —0233
(0.65) (1.77) (1.06) (0.61) (2.43)Non SMSA— 0.176 0.403 8.68 —0.015 —0.244
outside South (0.79) (1.51) (1.63) (0.17) (2.82)
Chi-square 374 337 303 2274 1740 1746
NOTE: t statistics in parentheses.'Persons with family income under $5,000.

TABLE 3 Tobit Results—Persons Age 65 and Over, 1969 TABLE 4 T
422 Davis and Reynolds
Constant
Chronic conditio
Limited in activi
Age
Restricted actividays
Income $5,000_
Income $10,000.
Income $15,000
Public assistanorecipient
Family size
Female
Individual educ9 years and
Working
Black—South
Black—outside
Physicians
Hospital beds
Non SMSA—So
Non SMSA—oul
Chi-square
NOTE: t statistics i
423 fl
PhysicianVisits
HospitalEpisodes
HospitalDays
Constant — 1.691
(427)—3.403(9.15)
—62.43(9.44)
Chronic conditions 0.315(13.94)
0.153(7.00)
225(5.78)
Limited in activity
Age
0.306(3.98)
—0.018(3.42)
0.603(8.16)0.007
(1.51)
12.00(9.11)0.15
(1.75)Restricted activity 0.120 0.115 2.02
days (16.82) (17.23) (17.11)Income $5,000-9,999 0.160
(1.91)0233
(2.95)3.41
(2.42)Income $10,000—14,999 0.324
(2.42)0.370
(2.91)3.65(159)
Income $15,000+ 0.743(5.18) (321)
7.42(2.93)
Public assistance 0.383 —0.063 —1.14recipient (2.79) (0.46) (0.47)
Family size —0.067(2.17)
0.020(0.70)
.-0.48(0.96)
Female 0.143(2.16)
—0.061(0.97)
—124(1.11)
Individual education, 0.178 —0.027 —0.299 years and over (2.63) (0.42) (025)
Working —0.065(0.66)
—0.303(3.09)
—5.96(338)
Black—South —0.521(321)
—0.643(4.03)
—9.98(3.53)
Black-outside South —0.095(0.52)
—0.082(0.47)
1.41(0.46)
Non SMSA—South —0242(2.66)
0.169(2.01)
0.56(037)
Non SMSA—outside South —0.005(0.06)
0.179(2.43)
1.69(128)
Chi-square 898 800 799
NOTE: t statistics in parentheses.

jNOTE: C statistics in parentheses.
423 Impact of Medicaid on Access to Medical Care
ver, 1969 TABLE 4 Tobit Results—Persons Age 65 and Over, 1969
Physician Hospital HospitalVisits Episodes Days
HospitalDays
—62.43 Constant —2.072 —3.107 —63.22(9.44) (4.81) (6.55) (7.48)2.25 Chronic conditions 0.317 0.151 223
(5.78) (14.02) (6.90) (5.71)12.00(9.11)
Limited in activity 0.304(3.95)
0.603(8.17)
12.00(9.11)
0.15(1.75)
Age —0.018
(3.45)
0.008
(1.57)
0.16
(1.79)
2.02(17.11)
3.41(2.42)3.65
(1.59)7.42
(2.93)—1.14
Restricted activitydays
Income $5,000—9,999
Income $10,000—14,999
Income $15,000+
Public assistance
0.120(16:82)
0.145(1.73)0.309
(2.30)0.721
(5.02)0.370
0.115(17.24)
0.253(320)0.392
(3.08)0.492
(3.45)—0.044
•
2.02(17.11)
3.72(2.64)3.99
(1.74)7.94
(3.13)—0.82
(0.47)0.48
(0.96)—1.24
recipientFamily size
Female
(2.69)—0.063(2.05)0.144
(022)0.015
(0.55)—0.064
(034)0.43
(0.86)—1.30
(1.11)
—029(025)
—5.96(3.38)9.98
Individual education,9 years and over
Working.
Black—South
(2.17)
0.181
(2.67)—0.066(0.67)
—0.491
(1.02)
—0.025
(039)—0.304(3.10)
—0.670
(1.17)
—0.14
(0.12)—6.02(3.42)
—10.03(3.53)1.41
(0.46)0.56
(037)1.69
(128)
Black—outside South
Physicians
Hospital beds
Non SMSA—South
Non SMSA—outside South
(2.93)—0.122(0.67)0.257
(226)—
—0.015(0.11)0.180
(1.59)
(4.17)—0.055(0.32)
—0.422(3.76)0.079
(1.18)—0.159(124)
—0.137(1.24)
(3.52)1.64
(0.54)—6.41(3.23)2.50
(2.10)—3.82(1.67)
—3.44(1.75)
799
Chi-square 904 813 790

NOTES indepeivariabli
1. Ronald Andersen et at., Health Service Use: National Trends and Variations, index I
1953—1971, U S. Department of Health, Education and Welfare, October 1972,tables 5 and 15.
2. Charles L. Schultze et at., Setting National Priorities: The 1973 Budget(Washington, D.C.: The Brookings Institution, 1972), p. 225.
3. Julian H. Pettingill, "Trends in Hospital Use by the Aged," Social SecurityI where
Bulletin (July 1972), pp. 3—14. normal4. Insurance payments per person under age 65 increased from $62 in 1969 to 16. White
$100 in 1973, increasing the share of the total health bill paid by insurance from hence'29.9 per cent to 33.4 per cent. Barbara S. Cooper and Paula A. Piro, "Age 17. SeeDifferences in Medical Care Spending," Social Security Bulletin (May 1974), Econoipp. 3-14. discrim
5. Regina Loewenstein, "Early Effects of Medicare on Health Care of the Aged," 18. MelbalSocial Security Bulletin, 34 (April 1971). Confer
6. For example, to derive the adjusted figures for the under age 17 group, the 1974.coefficient on restricted activity days (0.14) was multiplied by the average
. 19. U.S. H(number of restricted activity days for all children, and the coefficient on Enforcchronic conditions (2.86) was multiplied by the average number of chronic Octobeconditions in children. These terms were added to the constant term to derive 20. See Kathe under $5,000, no aid, adjusted visit rate. Adjusted visit rates for other Care,"income groups are greater than this rate by an amount equal to the correspond- John Wing coefficients in Appendix 2. 21. Eugene
7. Medically needy persons eligible for Medicaid are those aged, blind, disabled, State,"or families with dependent children whose income net of medical expepses is Adminiwithin 133 per cent of the public assistance support level. u.s. m
8. Karen Davis, "National Health Insurance," in Barry Blechman et at., Setting tration,National Priorities: The 1975 Budget (Washington, D.C.: The Brookings In- 1973.stitution, 1974), Ch. 8. 23. Charle,
9. See Karen Davis, "Financing Medical Care: Implications for Access to Primary ance CCare," in Spyros Andreopoulos (editor), Primary Medical Care (New York: John of ReseWiley, 1974). 24. Martin
10. Ronald Andersen et at., Expenditures for Personal Health Services: National EconoiTrends and Variations, 1953—1970, U.S. Department of Health, Education and 25. VictorWelfare, Health Resources Administration, October 1973, Table A-il. Physici
11. The sample excludes fifty-four individuals for whom head of household of Ecoieducation was not reported. 26. Martin
12. Detailed specifications of the independent variables used are contained in InstitutAppendix 1. 27. The on
13. Source: Haug, Robark, and Martin, Distribution of Physicians in the United class. F /States, 1970 (Chicago: American Medical Association, 1971). income
14. This sample comprised 25,673 individuals. An additional 497 individuals 28. Howevwith head of household education unreported were omitted from the sample. site vis
15. James Tobin, "Estimation of Relationships for Limited Dependent Variables," cit.Econometrica, 26 (1958), pp. 24—36. 29. Martin
The tobit model specifies that an index I be generated such that: Dynaff30. Feldst
Y,=0forl,>e,
where Y is the value of the dependent variable, I is a linear continuation of the
424 Davis and Reynolds' 425
I

IL
ds and Variations,'are, October 1972,
The 1973 Budget
L" Social Security
om $62 in 1969 toby insurance fromula A. Piro, "AgeIletin (May 1974),
Care of the Aged,"
age 17 group, thed by the average
the coefficient onumber of chronic
tant term to derivesit rates for otherto the correspond-
d, blind, disabled,edical expenses is
man et al., Setting'he Brookings In-
Access to Primarye (New York: John
Services: Nationalth, Education andable A-il.ead of household
are contained in
ans in the United
1 497 individualsI from the sample.endent Variables,"
ich that:
independent variables to which Y is hypothetically related, and e is a N(0,S2)variable. The predicted expected value of the dependent variable given theindex I is given by
= F ( ) +
.
where F and f are the standard normal cumulative distribution and standardnormal density functions, respectively.,
16. White utilization patterns did not show significant regional differences, andhence were constrained to be equal in the South and outside the South.
17. See Ray Marshall, "The Economics of Racial Discrimination," Journal ofEconomic Literature (September 1974), for a discussion of different types ofdiscrimination.
18. Melbah McAfee, "Black Belt Community Health Center," paper presented atConference on Hunger in the South, University of North Carolina, June 23,1974.
19. U.S. House of Representatives, Committee on the Judiciary, Hearings on Title VIEnforcement in Medicare and Medicaid Programs, September 12, 17, 24, andOctober 1, 1973 (Washington, D.C.: U.S. Government Printing Office, 1974).
20. See Karen Davis, "Financing Medical Care: Implications for Access to PrimaryCare," in Spyros Andreopoulos (editor), Primary Medical Care (New York:John Wiley, 1974).
21. Eugene C. Carter, "Health Insurance for the Aged: Amounts Reimbursed byState," U. S. Department of Health, Education, and Welfare, Social SecurityAdministration, Office of Research and' Statistics, H1-32, October 19, 1971.
22. U.S. Department of Health, Education, and Welfare, Social Security Adminis-tration, Office of Research and Statistics, Medicare, 1968: Section 1, Summary,1973.
23. Charles B. Waldhausen, "Assignment Rates for Supplementary Medical Insur-ance Claims, Calendar Years 1970—72," Social Security Administration, Officeof Research and Statistics, H1-46, June 30, 1973.
24. Martin S. Feldstein, "The Rising Price of Physician Services," Review ofEconomics and Statistics, 52 (1970), pp. 121—133.
25. Victor R. Fuchs and Marcia J. Kramer, Determinants of Expenditures forPhysicians' Services in the United States, (New York: National Bureauof Economic Research, Occasional Paper No. 117, 1972).
26. Martin S. Feldstein, "Econometric Studies of Health Economics," HarvardInstitute of Economic Research, Discussion Paper No. 291, 1973.
27. The only exception is for those few blacks in the South in the highest-incomeclass. However, only 1 per cent of the black population in the South has familyincomes of $15,000 and above.
28. However, only 3 per cent of participating institutional providers are actuallysite visited to check for compliance. See House Judiciary Committee Hearings,op cit.
29. Martin S. Feldstein, "Hospital Cost Inflation: A Study of Nonprofit PriceDynamics," American Economic Review, 61 (1971), pp. 853—872.
30. Feldstein, "An Econometric Model of the Medicare System," p. 9.
continuation of the
J425 Impact of Medicaid on Access to Medical Care

that large
10 C 0 M M E NT Stion rates arnant of utili
John Rafferty . assistanceDepartment of Health, Education, and Welfare low-income
receive far
SUMMARY health statuSimilar e
The authors purpose is to address three broad questions pertaining to the Section 3. a
Medicare and Medicaid programs in the United States: What impact have effortto cap
these programs had on use of medical services by the poor and the elderly? net prices
What factors account for differences in the level of use of Medicaid by those have suppli
who are eligible? To what extent do social and demographic characteristics find that, otaffect the use of medical services by the elderly? The first three sections of the increaees
paper deal with each of these questions in turn, and a fourth section then covered by
discusses the implications of the empirical findings for a national health reqiJiremen
program. income eldSection 1, which deals with the general impact of Medicare and Medicaid South, both
on use, draws from a variety of sources. The authors indicate that, since evidence o
enactment of these programs, use of medical services by low-income hospital se
individuals has increased, and that low-income persons have gained on those services, bwith higher incomes. However, as the authors stress in this section of the equitably bpaper, this general observation may be quite misleading. First, Medicaid In the fin
provides services only for certain categories of the poor, leaving approxi- their findinmately 9 million poor uncovered. Second, there is evidence that the poor Medicaid hreceive lower-quality care and receive it in settings that are less convenient they indicaand less pleasant than is the case for the population at large. Third, the coverage fi
authors stress the fact that generalizations about levels of use by the poor and national h€..
the elderly may be misleading because of differences in health status sharing pro
between these groups and the population at large; they show that, although differences
the relationship between use levels and income levels tends to be U-shaped would incn
(with the poor and the wealthy receiving larger amounts of care than those in plan. Third
the middle-income groups), when health status is adjusted for, the relation- population
ship is positively sloped throughout. for minority
In sections 2 and 3, which deal individually with Medicaid and Medicare, .
respectively, an econometric model is estimated. This is presented as an any
a more complete model, which is very briefly described, butwhich is not considered feasible. The model that is estimated forthe Medicaidstudy consists of three independent regression equations, of which the CRITI UEindependent variables are physician visits, hospital episodes, and hospitaldays; twenty independent variables, including measures of health status, In this pameasures of resource availability, and sociodemographic variables appear in substantial
each equation. The three equations are estimated first for public assistance programs.
recipients and then for other low-income persons, using Tobit analysis, and tance, butthe resulting coefficients are then discussed. Among other things, they show a
426 Davis and Reynolds 427 Ir

pertaining to theWhat impact haver and the elderly?Aedicaid by thosehic characteristicsree sections of theourth section thena national health
are and Medicaiddicate that, sinceS by low-incomee gained on thosehis section of the
First, Medicaidleaving approxi-
nce that the poore less convenientlarge. Third, the
e by the poor andin health status
ow that, althoughs to be U-shaped
than those inI for, the relation-
id and Medicare,presented as anfly described, buti for the Medicaidns, of which thedes, and hospitalof health status,riables appear in)ublic assistancebit analysis, and
things, they show
I
that large variations in use occur among Medicaid eligibles, that blacks lagsubstantially behind whites, that education increases the use of physicianservices but not hospital services, that larger families have lower hospitaliza-tion rates and ambulatory visits, and that health status is the major determi-nant of utilization among the poor. However, use of services by publicassistance recipients is less sensitive to health status than is use by otherlow-income individuals, and the poor who are not on public assistancereceive far fewer services than those on welfare, even after adjustment forhealth status and other characteristics.
Similar equations are estimated for the analysis of Medicare benefits inSection 3, although here the equations also include income variables, in aneffort to capture not only the direct effect of income but also the possibly lowernet prices that are faced by higher-income persons who are more likely tohave supplementary insurance. In brief, with respect to Medicare, the authorsfind that, other things the same, the use of medical services by the elderlyincrea€es uniformly with income, but, for those individuals who are alsocovered by Medicaid as well as Medicare, the elimination of cost-sharingrequirements appears to raise their utilization rate to that of the middle-income elderly. The authors find much lower levels of use by blacks in theSouth, both for physicians and hospital services, which they interpret asevidence of racial discrimination. They find that use of both physician andhospital services by the elderly is sensitive to the availability of medicalservices, but they also conclude that available hospital beds are rationedequitably between the elderly and other age groups.
In the final section the authors then discuss three general implications oftheir findings for national health insurance. First, although Medicare andMedicaid have helped covered individuals receive needed medical care,they indicate that Medicaid has failed by not covering all of the poor;coverage for these individuals, therefore, is indicated as a top priority for anational health insurance program. Second, they indicate that the cost-sharing provision of Medicare leads to a wide disparity in use on the basis ofdifferences in income; therefore, a graduated cost-sharing arrangementwould increase the equitability of access under a national health insuranceplan. Third, experience with Medicare and Medicaid shows that somepopulation groups will lag in utilization even if they are covered, as is the casefor minority groups and residents of rural areas at the present time; therefore,supplementary programs for such groups would seem to be required underany national health insurance scheme.
CRITIQUEIn this paper Karen Davis and Roger Reynolds have presented a verysubstantial amount of useful information on the Medicare and Medicaidprograms, information that is not only of considerable policy impor-tance, but also carries significant implications for future research. Sincea discussant finds it necessary to focus on the weaknesses in, or the
427 Impact of Medicaid on Access to Medical Care

T'necessary qualifications to, the research under review, such negative corn- rnuch lessments tend to occupy the major portion of the discussant's time; this, however, Simply a rershould not be allowed to detract from the usefulness of much of the work necessary treported in this paper. Medicare and Medicaid represent the closest approx- used in disimations to national health insurance in the experience of the United States, occurred acand since analyses of these programs have been very few and far between, on the degthis broad study is very welcome indeed. . variation ca
One distinguishing feature of the paper, as alluded to in the summary changes ovabove, is that it presents and discusses a considerable number of individual problem, usfindings, far more than can be covered in this brief discussion. As a result, this the authors'review will be confined primarily to just a few of the broader, more general, of hospitalconsiderations even though this may fail to do full justice to the amount of from the croinformation the paper presents. expense of
My major concern really has to do with the interpretation of the statistical deficient,"results. First, I feel that this paper treads dangerously close to what another groups." Beconomist has called the "Regression Humbug Syndrome"; the equations that estimates,are estimated here do have the appearance of the reduced forms of supply- may well
demand models, but we are given no explicit theoretical understructure for in supply inthese regressions, nor a discussion of expected signs. The independent However, th
variables that appear in the equations appear to have been determined less with those con the basis of theoretical reasoning than on the basis of what data were health irisuavailable. In the absence of any explicit hypotheses to be tested, whatever have lookesignificant relationships do drop out of the regressions are then discussed, just the opp
and are explained on a more or less ad hoc basis. One danger is the tendency dramatic chto conclude, implicitly, that if no significant relationship appeared, no such under 65,relationship exists, which may be quite untrue. This general approach may be immediatel
more appropriate when the primary objective is prediction; here, however, was a subswhere our interest is less in prediction than in explanation and understanding cases, Whe
of structure, more explicit theoretical underpinnings would be desirable, question, b
One example of the difficulties which may appear in connection with this the elderly
kind of research approach is the interpretation of the finding of relatively low of what is s
levels of utilization, of both physicians and hospitals, on the part of blacks in the Davis-R
the South. The findings are very striking, and are of considerable interest and not: The fac
policy importance, but the interpretation of the cause of this disparity as clear, regions are
out-and-out racial discrimination is scientifically premature; at least, that the time when I
disparity in use is caused by discrimination cannot really be deduced from increase el
the present analysis, for we really don't know the degree to which the disparity therefore al
is attributable to demand as opposed to supply factors. Indeed, the authors' groups to i
interpretation does not seem like an entirely unreasonable one, but certainly caution is n
at least one plausible alternative is that, because of past discrimination, that occurn
blacks do not presently seek out care, so that the actual cause today is on the I will limdemand side rather than the supply side. This is not trivial, because the address or
appropriate policy for correcting such disparities would be very different in perhaps ret
each instance—requiring some kind of civil rights enforcement in the former, on health
and perhaps outreach and educational efforts in the latter case. availability
The second critical point I'll make also pertains to interpretation of results, have effecti
and I should hasten to add that although I feel that the point is important, it is a limitations
428I
Davis and Reynolds 429 lmi

ch negative corn-ime; this, however,much of the work
cl6sest approx-the United States,and far between,
o in the summarymber of individualon. As a result, thisler, more general,
to the amount of
n of the statisticalse to what anotherthe equations that
d forms of supply-understructure forThe independentn determined less)t what data weretested, whatever
'e then discussed,er is tendency
'ppeared, no suchI approach may ben; here, however,md understandingI be desirable.nnection with thisg of relatively lowe part of blacks in
interest anddisparity as clear,
e; at least, that thebe deduced from
vhich the disparitydeed, the authors'one, but certainlySt discrimination,
today is on thevial, because thee very different innent in the former,case.
of results,is important, it is a
much less pervasive problem in this paper than is the former one. This issimply a reminder that this study employs cross-sectional data, and that it isnecessary to be particularly cautious when the results of such an analysis areused in discussions in which our real interest is in variations that actuallyoccurred across time; the appropriateness of cross-sectional data dependson the degree to which those factors that determine the cross-sectionalvariationcan reasonably be assumed to be the same factors that caused thechanges I will again give just one illustration of this particularproblem, using a case in which I do have empirical reason for believing thatthe authors' interpretation of their findings is incorrect. This concerns the useof hospital services by the elderly, under Medicare. The authors concludefrom the cross-sectional analysis that the elderly 'do not receive care at theexpense of younger persons needing medical care where supply is mostdeficient," and that ". . . available beds are rationed equitably among all agegroups." Because of the weakness of the supply variables used for theseestimates, this conclusion should be somewhat tentative, but nevertheless, itmay well be that, cross-sectionally, use by the elderly responds to variationsin supply in essentially the same way as use by the population as a whole.However, that is not really the question at issue; rather, we are concerned herewith those changes over time that are directly attributable to the provision ofhealth insurance for the elderly, which is not quite the same thing. In fact, I
have looked into this specific question using time series data and obtainedjust the opposite resu It—that the introduction of Medicare coincided with verydramatic changes in hospital use by the non-elderly. Specifically, for patientsunder 65, diagnosis-specific lengths of stay were dramatically reducedimmediately after introduction of Medicare, and, for this younger group, therewas a substantial decline in admissions of the more discretionary types ofcases. Whether or not this shift was "appropriate" in some sense is a separatequestion, but I believe there is no doubt that the increased use of hospitals bythe elderly did come at the expense of younger patients, which is the oppositeof what is suggested by the cross-sectional results. Thus, I would argue thatthe Davis-Reynolds finding may itself be quite valid, but its interpretation isnot: The factors that determine the response of utilization to availability acrossregions are not the same as the factors that determined these responses overtime when Medicare was introduced; and, the introduction of NHI, which willincrease effective demand by some groups more than by others, shouldtherefore also be expected to cause the increase in use by the more favoredgroups to come at the expense of others. Again, my point is simply thatcaution is necessary in generalizing these cross-sectional results to changesthat occurred over time.
I will limit my critical comments to these two points, but I would like toaddress one other issue that I feel is very relevant here, an issue that isperhaps regarded by economists as the most pervasive and critical constrainton health economics research. This is the matter of limitations in theavailability of statistical data. I believe that the authors of this present paperhave effectively mined the data that were available to them, and many of thelimitations of their study are a simple function of the limitations in those data.
429 Impact of Medicaid on Access to Medical Care

I
However, I also think that in health economics we are at a point when we couldbenefit by observing the research approaches of people in other fields, suchas sociology and psychology. Unlike economists, who have been prone todesign their research around the data in hand, in these areas the research isoften designed first, and then, perhaps as one step in that design process, thesurvey instrument or the particular mechanism whereby the necessary datawill be generated is developed. Although our usual approach—that ofmassaging the secondary data we are able to acquire from others—has apleasing ring of efficiency, there is a question involving how often thatapproach is really cost effective. Therefore, perhaps economists shouldbecome more willing to generate the data required to answer the questionsthey want to raise. This does raise the monetary costs of doing research, but itis pertinent to note that, at the Bureau of Health Services Research, theproblem we have faced has been more often a problem of finding researchproposals of high technical quality rather than finding the dollars to supportwell-designed projects based on high-quality data. I feel this point is quiterelevant in this specific context; among the many contributions the authorsmake in their paper is to narrow old questions and identify new ones, but I
really doubt if very much can be done about answering those questionswithout some fairly heroic efforts on the part of researchers themselves togenerate the data that will be required.
Dorothy P. RiceSocial Security Administration
As is usual with Dr. Karen Davis' work, this paper is a fine piece of empiricism.The findings are significant in an important sense: two large governmentprograms—Medicare and Medicaid—are shown to have achieved what theyset out to do. This may be surprising to some economists because when onesearches the literature, one finds time and again that government programstoo often fail in their objectives. The paper is important because it comparesmedical care use for the low-income population receiving welfare and otherpoor persons, leading to the conclusion that extension of medical carefinancing to those poor persons excluded from Medicaid should be a toppriority reform.
After a few specific comments, I will compare some of the Davis-Reynoldsfindings with data from the Social Security Administration's Current MedicareSurvey for the population aged 65 and over.
With respect to Medicaid, the authors adjust the 1969 Health InterviewSurvey for health status and show that physician visits increase with income ifthe low-income persons not on public assistance are separated and their
physician use isincome. Althoughstatus" physicianequations inauthors did the e
In explainingauthors state".demanded is necwilling to supplyprice, since the Nschedules vary frfrom state to statrecognize that phbut do not expliciamong patients.analysis in Table
With respectutilization trends(quoted on pagpopulation rose1971 compared1,000 populationdeclined 3.4 percovered stay incdeclined 3.8 perenrollees hit a
I
declined 10.21971.' Thereyears that hasimplications of tl
In the sectiondiscuss data frothe actual meanistate that ". .
services than elother medical sehigher for whitedifference in ter"nearly all of thewhites and all opersons receivirthey determine$78.76 among\
reimbursementper person enroll
430 Davis and Reynolds
—I
431I
Impact

oint when we couldn other fields, suchave been prone toeas the research islesign process, thehe necessary dataapproach—that ofrom others—has ang how often thatconomists shouldwer the questions
ing research, but ites Research, thefinding research
dollars to supportthis point is quite
utions the authorsnew ones, but I
those questionsers themselves to
ce of empiricism.arge governmenthieved what theyecause when onernment programsause it compareswelfare and otherof medical careshould be a top
e Davis-ReynoldsCurrent Medicare
physician use is compared with that of persons with middle and higher familyincome. Although there is a verbal description of how the "adjusted for healthstatus" physician visits were estimated for Table 2, it is stIll not clear what theequations in Appendix 2 mean. Therefore, the reader has to trust that theauthors did the estimations correctly.
In explaining the factors determining the use of Medicaid services, theauthors state ". . . there is no price mechanism by which quantity of servicesdemanded is necessarily equated with quantity of services which providers arewilling to supply." Although quantity demanded may not be a function ofprice, since the Medicaid recipient does not pay for services, the fact that feeschedules vary from state to state means that the quantity supplied may varyfrom state to state as a function of the fee schedule. The authors appear torecognize that physicians may prefer to treat some patients rather than othersbut do not explicitly include fees paid as a measure of physician preferencesamong patients. A variable for this might be included in the regressionanalysis in Table 4.
With respect to the Medicare program, the authors fail to point out thatutilization trends observed for 1967—1969 do not hold for 1969—1971. Pettingill(quoted on page 392) also shows that Medicare admissions per 1,000population rose at an average annual percentage change of 0.3 from 1969 to1971 compared with 7.4 between 1967 and 1969. Covered days of care per1,000 population increased 12.6 per cent per year from 1967 to 1969 butdeclined 3.4 per cent per year between 1969 and 1971. Average length ofcovered stay increased 4.8 per cent per year during the earlier period anddeclined 3.8 per cent per year in the later period. ECF admissions per 1,000enrollees hit a peak in 1969, increasing by 15.7 per cent over 1968 butdeclined 10.2 per cent during 1969—1970 and 13.4 per cent during 1970—1971.1 There was an initial impact of Medicare coverage during the first threeyears that has reversed direction or tapered off in subsequent years. Theimplications of these more recent changes are not discussed by the authors.
In the section on "Distribution of Medicare Benefits," Davis arid Reynoldsdiscuss data from the Medicare program but could do a great deal to makethe actual meaning of their statements clear to the reader. For example, theystate that ". . . whites receive 60 per cent more payments for physicianservices than elderly blacks." It is true that reimbursement for physician andother medical services per person enrolled under SMI in 1968 was 62 per centhigher for whites than for all other races, but there was only a 15 per centdifference in terms of reimbursement per person served.2 The authors claim"nearly all of the difference" in reimbursement per person enrolled betweenwhites and all other races represents "differences in percentage of eligiblepersons receiving reimbursable services." The authors should indicate howthey determine this point. In 1968, reimbursement per person enrolled was$78.76 among whites and $48.44 among all other races. By definition,
Health Interviewse with income ifarated and their
reimbursement =per person enrolled
/ number served \ /I x reimbursement
number enrolledJ \per person served)
j.431 Impact of Medicaid on Access to Medical Care

If we let P = reimbursement per person served cost-sharining for tam
= number served low or highnumber enrolled services pe
those withthen the difference in reimbursement per person enrolled between whites and To the exteall other races can be expressed as would also
A(PQ) = ÷ +pay morehigher.
where, for example, represents the difference in reimbursement per It may b
person enrolled between whites and all other races, p0 represents reim- lished dat
bursement per person served among all other races, and represents the Medicare I
ratio of number served to number enrolled among all other races. With this Davis ai
equation, and assuming that the interaction term is distributed proportionately restricted
between the P and 0 terms, we can determine the proportion of the difference recipients
in reimbursement per person enrolled between the races that is attributable to sensitive
differences in reimbursement per person served and percentage of enrolled observed
persons receiving reimbursable services. Taking the necessary data from the table
1968 summary, we do not find that nearly all the difference stems from the covered s
proportion of enrollees served. Twenty-seven per cent is attributable to a welfare re
difference in reimbursement per person served of $199 among whites and gradients
$173 among all other races. because o
Additional questionable statements are made by the authors with respect to health. Thi
the factors affecting geographical and income differences in Medicare and the av
reimbursements. Reimbursement depends on meeting the deductible and as health
determining reasonable charges. Charges for some services may be disal- services a
owed more often than for other services and utilization of services may vary Davis-H
by geographic area, income class, etc. The extent to which charges are health stat
disallowed for a particular covered service may also vary by characteristics direct
such as geographic area and income class, seP/ices,
Davis and Reynolds argue that economic forces may contribute to lack of Reynolds
significant coefficients among the availability variables in their regression significant
equations for public assistance recipients and other low-income persons. variable ci
More specifically, 'since Medicaid patients do not pay for the care, providers, persons, i
especially with regard to ambulatory care, lack the ability to affect the what relati
utilization patterns of these persons by ordinary economic means." What do CMS table
the authors mean by "ordinary economic means?" We suspect they do not region, wit
assume a typical competitive economic market with equilibrium prices and Northeast
quantities responding to shifts in supply and demand. As the authors indicate, the West i
there is no one theory of market behavior that is generally accepted as the propoi
describing the market for physicians' services. The market for hospital more in th
services is also complex, and interpretation of the coefficients of the availabil- One tin
ity variables requires a detailed examination of the markets for these services, relation bi
In their concluding remarks, the authors state that "imposition of uniform although r
cost-sharing provisions (deductible and coinsurance amounts) results in wide may capti
disparities in use of medical services on the basis of income." They find Davis a
utilization among the elderly related to income, but it does not follow that programs"
432 Davis and Reynolds 433 Ii
j -

tween whites and
imbursement perrepresents reim-
Q0 represents ther races. With thisd proportionatelyof the differenceis attributable to
ntage of enrolledary data from thee stems from theattributable to a
mong whites and
rs with respect to
es may be disal-ervices may vary
charges arecharacteristics
itribute to lack oftheir regression
income persons.e care, providers,lity to affect themeans." What dopect they do notrium prices andauthors indicate,iiy accepted as
rket for hospitals of the availabil-r these services.sition of uniforms) results in wideome." They find
•!S not follow that
j
cost-sharing provisions cause these disparities. Furthermore, after account-ing for family size in determining whether a given annual family income waslow or high, Peel and Scharff (1973) found no difference in the number of SMIservices per user with charges between enrollees with high family incomes andthose with low to moderate family incomes and no public medical assistance.3To the extent that medical care prices vary geographically, equality in accesswould also require coinsurance rates to vary with prices if an enrollee is not topay more coinsurance for the same quantity of services where prices arehigher.
It may be interesting to compare the Davis-Reynolds findings with unpub-lished data from SSA's Current Medicare Survey (CMS) of a sample ofMedicare beneficiaries interviewed monthly for a period of fifteen months.
Davis and Reynolds find health status in terms of chronic conditions andrestricted activity days positively related to utilization, with public assistancerecipients using more services than other low-income persons and being lesssensitive to health status in their utilization (tables 4, 5). Similar results areobserved for Supplementary Medical Insurance enrollees in the accompany-ing table based on data from our Current Medicare Survey. Utilization ofcovered services increases as comparative, health status deteriorates, withwelfare recipients using many more services at each level of health. Thegradients are quite steep for both groups, but less so for welfare recipientsbecause of high utilization by welfare recipients with comparatively betterhealth. These conclusions apply both to the percentage of enrollees servedand the average number of services peç person served. Utilization increasesas health status deteriorates both because relatively more persons receiveservices and each recipient uses more.
Davis-Reynolds and CMS findings (not shown here) are consistent forhealth status and public assistance, and partly for race. Both surveys showdirect relationships between utilization of physicians' care and coveredservices, respectively, and health status and public assistance. Davis andReynolds report that blacks in the South make fewer physician visits, but nosignificant relation for blacks outside the South. But their black-outside Southvariable compares utilization by blacks outside the South with that of all otherpersons, including blacks in the South. It is difficult, therefore, to know justwhat relation exists between utilization by blacks compared with whites. TheCMS table shows more covered services per person served for whites in eachregion, with the differences between whites and all other races greater in theNortheast and West than in the South. (Number of enrollees of all other races inthe West is too small, however, to provide a reliable estimate.) Furthermore,the proportion of whites served exceeds the proportion of all other races bymore in the Northeast and North Central than in the South.
One final point is worth mentioning. Davis and Reynolds find a negativerelation between physician visits and age, whereas CMS shows a positive,although not highly significant, association. As they point out, however, agemay capture the effect of health status if the latter is not controlled.
Davis and Reynolds conclude that "supplementary health care deliveryprograms" designed to meet the special needs of minorities, rural residents,
433I Impact of Medicaid on Access to Medical Care
I

Cov
ered
Med
ical
Ser
vice
s un
der
the
Sup
plem
enta
ry M
edic
al In
sura
nce
Pro
gram
, by
Hea
lth C
ondi
tion
and
Wet
fare
Sta
tus,
and
by
Reg
ion
and
Rac
e, 1
969
Ave
rage
Ave
rage
Ave
rage
Num
ber
ofN
umbe
r of
Num
ber
ofN
umbe
rS
ervi
ces
Num
ber
Ser
vice
sN
umbe
rS
ervi
ces
Hea
lth C
ondi
tion
Ser
ved
Per
cent
age
of. P
er P
erso
nS
erve
dP
erce
ntag
e of
per
Per
son
Ser
ved
Per
cent
age
of p
er P
erso
nan
d R
egio
n(0
00's
)E
nrol
lees
Ser
veda
(000
's)
Enr
olle
esS
erve
da(0
00's
)E
nrol
lees
Ser
veda
Tot
alN
o W
elfa
reS
ome
Wel
fare
AU
hea
lth c
ondi
-13
,963
77.7
16.7
11,6
3375
.614
.22,
330
90.3
28.9
tiofls
b
Bet
ter
than
othe
rs5,
706
71.2
10.7
5,15
369
.89.
755
387
.6•1
9.6
Sam
e as
oth
ers
6,08
280
.014
.74,
980
78.4
13.2
1,09
688
.221
.6W
orse
than
othe
rs2,
175
92.4
37.7
1,49
490
.732
.868
196
.648
.2
Tot
alW
hite
All
Oth
er R
aces
All
regi
ons
15,5
9578
.717
.214
,440
79.1
17.5
1,11
273
.912
.6
Nor
thea
st4,
252
80.1
20.3
4,07
780
.820
.515
767
.113
.2
Nor
th C
entr
al4,
406
76.2
16.6
4,19
176
.516
.720
570
.916
.2
Sou
th4,
536
78.4
14.5
3,84
178
.814
.968
475
.812
.0
Wes
t2,
402
81.6
17.8
2,33
281
.618
.167
82.7
6.9
Incl
udes
in-h
ospi
tal v
isits
.E
xclu
des
unkn
own
cond
ition
s, C
ompa
rativ
e he
alth
sta
tus
is r
epor
ted
by th
e sa
mpl
e pe
rson
s at
the
begi
nnin
g ot
the
surv
ey.
'3 UI
z 0r'.
)
U)
C)
0)cn
CD
CD
2 C
t)
0 C
)o(
Dc,
-o 50B
CD
CD
-,C
D-'
C)
— C/)
?a

and persons in the South must be an essential part of health care policy. Thisstatement surely serves to whet the appetite. What are these supplementaryprograms? Are they medical service, manpower, or health insurance pro-grams? Would they supplement or replace existing programs? How would theybe financed?
Medicare and Medicaid have clearly accomplished a great deal towardincreasing access to medical care. Nevertheless, substantial gaps exist forcertain population groups. The solution to meet the special needs of thesepopulation groups clearly is not readily apparent.
NOTES1. Eugene Carter and Charles Fisher, Health Insurance br the Aged: Hospital and Extended Care
Admissions by State, Fiscal Year 1971,' Social Security Administration, Health InsuranceStatistics, Hl-42, March 12, 1973.
2. U.S. Social Security Administration, Office of Research and Statistics, "Medicare: HealthInsurance for the Aged, 1968, Section I: Summary," Washington, D.C., 1973, PP. 1—18, 19.
3. Evelyn Peel and Jack Scharif, 'Impact of Cost-Sharing on Use of Ambulatory Services underMedicare, 1969," Social Security Bulletin, October 1973.
a
0
C
a)
a
aaC0a
a
aaa'C
>.
a0a
0a
aa'Ca>aaC.E
(3aC0
.e>0—Q
II— w
435I
Impact of Medicaid on Access to Medical Care
-j.

ROBERTEVAI
University of BColu
THE ORGAINSURANC
To underone mustpowers b /provinciadefendedand 92 of
This paperHerbert KlanFuchs, Lee Sthe rest is ml
Data used ithe appendix.
437