the national lust cleanup backlog - us epa · the national lust cleanup backlog: ... presence of...
TRANSCRIPT
Printed on Recycled Paper
The Nat ional LUST Cleanup Backlog:A Study of Opportunit ies

The NaTioNal lUST CleaNUp BaCklog: a STUdy of opporTUNiTieS
SepTemBer 2011ii
F O R E W O R DThe Office of Underground Storage Tanks (OUST) within the U.S. Environmental Protection Agency (EPA) undertook this analysis to characterize the backlog of underground storage tank (UST) releases that have not finished cleanup. Using this report, EPA intends to enter into discussion with the states about specific strategies that could help reduce the backlog. The purpose of this document is to establish a common basis of understanding about the different types of releases within the backlog. The study presents a substantial amount of data analysis because the national program does not routinely collect this level of data. The national chapter includes a cumulative analysis and discussion of the data from the 14 states that participated in the study. Following the national chapter are 14 state chapters, explaining each state program and the detailed characteristics of the state’s backlog. Each state chapter has its own Executive Summary.
The national and state chapters present information and data findings characterizing the attributes of releases within the backlog (e.g., age, priority, and stage of cleanup). Classification of release attributes provides information that will allow state programs to focus on specific areas of the backlog that might benefit from backlog reduction efforts, such as unassessed releases or high priority releases. Along with each data finding, EPA identifies potential opportunities to help reduce the backlog. These opportunities come from successful backlog reduction efforts in the 14 states and other national initiatives that help drive backlog reduction. EPA offers these potential opportunities not as recommendations but as a starting point for discussion about strategies that might prove effective at reducing the backlog in some states. EPA recognizes that state programs vary and not every strategy or opportunity will apply to every state program. This report provides the basis for detailed discussion about where to focus limited resources with the ultimate goal of furthering national cleanup progress.
This study was done by EPA in cooperation with 14 state UST programs. The findings, opportunities, and next steps discussed in the study refer consistently to EPA and states. That being said, EPA wishes to express that addressing leaking underground storage tanks (LUSTs) in Indian country is also a high priority for the program. While this study does not specifically address Indian country, many of the potential opportunities discussed in this report might also apply to releases in Indian country. EPA intends to take the lessons learned in this state-focused study and work with our tribal partners to implement backlog reduction strategies.
ACKNOWLEDGEMENTEPA is grateful for the cooperation, time, and effort the 14 states contributed to this study. The UST staff of California, Florida, Illinois, Michigan, Montana, Nebraska, New Hampshire, New Jersey, New York, North Carolina, Pennsylvania, South Carolina, Texas, and Washington State provided data and expertise about their state programs without which this study could not have been accomplished.

The NaTioNal lUST CleaNUp BaCklog: a STUdy of opporTUNiTieS
SepTemBer 2011 iii
T A B L E O F C O N T E N T SForeword ................................................................................................................ ii
Table of Contents ................................................................................................... iii
List of Acronyms .................................................................................................... vi
National ChapterExecutive Summary ........................................................................................... ES-1
Introduction ........................................................................................................... 1
LUST Cleanup Backlog Study – Phase 1 ..................................................................3
LUST Cleanup Backlog Study – Phase 2 ..................................................................3
Analysis and Discussion .......................................................................................... 8
Analysis Factor: Age of Releases ............................................................................8
Analysis Factor: Stage of Cleanup .........................................................................12
Analysis Factor: Media Contaminated ..................................................................15
Analysis Factor: State Program Resources ............................................................20
Analysis Factor: Release Prioritization ..................................................................28
Additional Analyses ..............................................................................................31
Additional Proposed Reasons for the Backlog Not Analyzed in this Study ...........41
Potential Opportunities to Reduce the Backlog ..................................................... 42
Accelerating Corrective Action .............................................................................42
Pursuing Targeted Initiatives ................................................................................44
Improving Program Implementation ....................................................................45
Next Steps ............................................................................................................ 47
Conclusion ............................................................................................................ 49
State ChaptersCalifornia .......................................................................................................... CA-1
Florida ............................................................................................................... FL-1
Illinois ................................................................................................................. IL-1
Michigan ........................................................................................................... MI-1
Montana .......................................................................................................... MT-1
Nebraska .......................................................................................................... NE-1
New Hampshire ............................................................................................... NH-1
New Jersey ........................................................................................................NJ-1
New York .......................................................................................................... NY-1
North Carolina ..................................................................................................NC-1
Pennsylvania ..................................................................................................... PA-1
South Carolina .................................................................................................. SC-1
Texas ..................................................................................................................TX-1
Washington State ............................................................................................WA-1
Appendix A: Data Compilation and Analytic Methodology ..................................A-1
Appendix B: Phase 1 Report ................................................................................ B-1

The NaTioNal lUST CleaNUp BaCklog: a STUdy of opporTUNiTieS
SepTemBer 2011iv
L ist of F igures in the Nat ional ChapterFigure 1. National LUST Cleanup Backlog, FY 1989 – FY 2009 .................................... 2
Figure 2. LUST Cleanups Completed Nationally, FY 2000 – FY 2009 ........................... 2
Figure 3. LUST Confirmed Releases Nationally, FY 2000 – FY 2009 ............................ 2
Figure 4. Rank of State LUST Cleanup Backlogs, by 2006 and 2009 End of Year Reporting ..................................................................................................... 4
Figure 5. Contribution of 14 Participating States to the National LUST Backlog in 2006 ............................................................................................................. 4
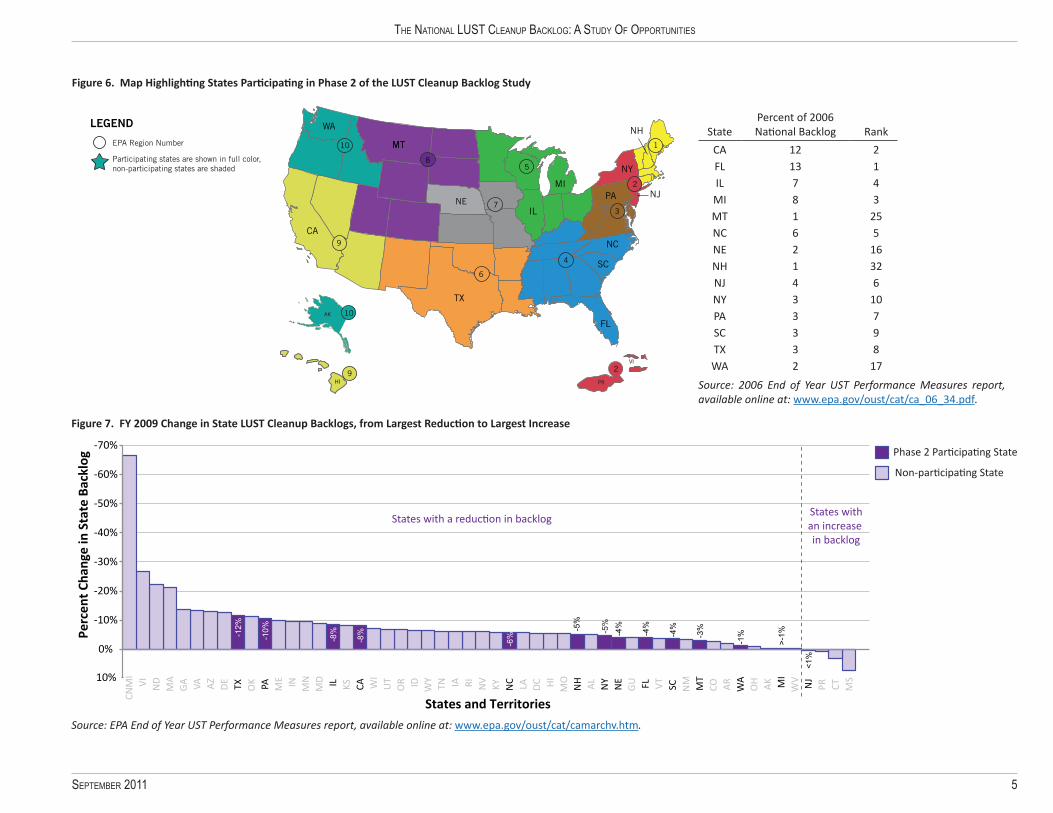
Figure 6. Map Highlighting States Participating in Phase 2 of the LUST Cleanup Backlog Study .............................................................................................. 5
Figure 7. FY 2009 Change in State LUST Cleanup Backlogs, from Largest Reduction to Largest Increase ..................................................................... 5
Figure 8. Percentage of Confirmed LUST Releases That Remain Open or Have Been Closed in 14 States ............................................................................. 8
Figure 9. Age Distribution of Open LUST Releases in 14 States .................................. 9
Figure 10. Percentage of Open and Closed LUST Releases, by Participating State ..... 9
Figure 11. Age Distribution of Open LUST Releases, by Participating State .............. 10
Figure 12. Age Distribution of Closed LUST Releases in 14 Participating States ....... 10
Figure 13. Age Distribution of Closed LUST Releases, by Participating State ............ 11
Figure 14. Age of Closed LUST Releases in 14 States at Time of Closure, by Year .... 11
Figure 15. Distribution of Open LUST Releases in 13 States by Stage of Cleanup .... 13
Figure 16. Distribution of Open LUST Releases by Stage of Cleanup, by Participating State ................................................................................... 13
Figure 17. Distribution of Open LUST Releases 10 Years Old or Older in 13 States, by Stage of Cleanup ................................................................................. 14
Figure 18. Age Distribution of Open LUST Releases in 13 States by Stage of Cleanup .................................................................................................... 14
Figure 19. Distribution of Open LUST Releases in 11 States by Media Contaminated .......................................................................................... 16
Figure 20. Distribution of Open LUST Releases by Media Contaminated, by State .. 16
Figure 21. Distribution of Open LUST Releases per Year in 11 States, by Known Media Type (1990 – 2008) ....................................................................... 17
Figure 22. LUST Cleanups Completed Nationally, FY 1990 – FY 2009 ....................... 17
Figure 23. Distribution of Closed Releases per Year in 11 States, by Known Media Type (FY 1990 – 2008) .................................................................. 18
Figure 24. Distribution of LUST Releases with Contaminated Groundwater and Soil by Stage of Cleanup in 11 States ....................................................... 18
Figure 25. Distribution of LUST Releases with Contaminated Groundwater and Soil, by Stage of Cleanup and State ......................................................... 19
Figure 26. Median Age of Open LUST Releases with Groundwater and Soil Impacts, by Participating State ................................................................ 19
Figure 27. Age of State Fund Eligible Cleanups, by Stage of Cleanup, by State ........ 22
Figure 28. Age of State-Funded Cleanups, by Stage of Cleanup, by State ................ 22
Figure 29. State Fund Eligibility in FL, NC, NH, SC, and TX ........................................ 22
Figure 30. Percentage of LUST Releases to be Financed with State Funds, 11 States ....................................................................................................... 23
Figure 31. Age of Privately-Financed Cleanups by Stage of Cleanup, by State ......... 24
Figure 32. Percentage of Pre-1994 LUST Releases with Unknown FR in 11 Participating States .................................................................................. 25
Figure 33. Pre-1994 LUST Releases with Unknown FR in 11 Participating States, by Stage of Cleanup ................................................................................. 25
Figure 34. Pre-1994 LUST Releases with Unknown FR, by Participating State .......... 25
Figure 35. Average State Fund Spending at Active and Closed LUST Cleanups, by State ........................................................................................................ 26
Figure 36. Average Cost per Completed LUST Cleanup ............................................ 26
Figure 37. Average Caseloads of Oversight Staff in States with State Cleanup Funds ....................................................................................................... 27
Figure 38. Priority Ranking of LUST Releases Among Eight Participating States with Priority Data, by State ...................................................................... 29
Figure 39. Stage of Cleanup of High Priority LUST Releases in Eight Participating States ....................................................................................................... 29
Figure 40. Age Distribution of High Priority LUST Releases in the Confirmed Release or Site Assessment Stages in Eight Participating States ............. 29
Figure 41. LUST Release Priority Among Eight States with Priority Data .................. 30
Figure 42. Open LUST Releases Above and Below the Cleanup Threshold for Three States with Statutory Priority ........................................................ 30

The NaTioNal lUST CleaNUp BaCklog: a STUdy of opporTUNiTieS
SepTemBer 2011 v
Figure 43. Use of MNA/Passive Remediation vs. Active Remediation at LUST Releases in the Remediation Stage, by State ........................................... 32
Figure 44. Age Distribution of LUST Releases Undergoing MNA/Passive Remediation, by State ............................................................................. 32
Figure 45. Presence of Free Product at Open LUST Releases in California ............... 33
Figure 46. Age of Open LUST Releases with Free Product Present in California ....... 33
Figure 47. Presence of Free Product at Open LUST Releases in South Carolina, by Stage of Cleanup ................................................................................. 34
Figure 48. Age of Open LUST Releases with Free Product Present in South Carolina.................................................................................................... 34
Figure 49. Recalcitrance of RPs of Open LUST Releases in New Jersey and Texas .... 34
Figure 50. Use of IC/ECs at LUST Releases, by State - 1994 to 2008 ......................... 36
Figure 51. Number of LUST Releases with Single Party Affiliation, in 12 Participating States .................................................................................. 38
Figure 52. Open LUST Releases in 12 States by Type of AP/RP ................................. 38
Figure 53. Percent of Open LUST Releases Located Within One Mile of Five or More Releases, by Participating State ..................................................... 39
Figure 54. LUST Cleanups in Florida and Along the Tamiami Scenic Highway Route in Florida ....................................................................................... 39
L ist of Tables in the Nat ional ChapterTable 1. Net Backlog Reduction Nationally, FY 2000 – FY 2009 .................................. 2
Table 2. State Methods of Financing LUST Cleanups ................................................ 21
Table 3. Types of LUST Release Prioritization by State............................................... 28
Table 4. Example of Tiered Approach to RBDM ........................................................ 35
Table 5. Affiliated or Potentially Responsible Parties with Ten or More Releases, by State ....................................................................................................... 38
Table 6. LUST Release Attributes and Their Value to Managers ............................... 40
The NaTioNal lUST CleaNUp BaCklog: a STUdy of opporTUNiTieS
SepTemBer 2011vi
L I S T O F A C R O N Y M S ANCOVA Analysis of Covariance
ANOVA Analysis of Variance
AP Affiliated Party
ARRA American Recovery and Reinvestment Act
ASTSWMO Association of State and Territorial Solid Waste Management Officials
BTEX Benzene, Toluene, Ethylbenzene, and Xylenes
CERCLA Comprehensive Environmental Response, Compensation, and Liability Act
CHAID Chi-squared Automatic Interaction Detection
CRT Classification and Regression Tree
DOD United States Department of Defense
EDB Ethylene Dibromide
EPA United States Environmental Protection Agency
ESA Expedited Site Assessment
FR Financial Responsibility
FY Fiscal Year
IC/ECs Institutional/Engineering Controls
LSP Licensed Site Professional
LUST Leaking Underground Storage Tank
MCL Maximum Contaminant Level
MNA Monitored Natural Attenuation
MSA Multi-Site Agreement
MT DEQ Montana Department of Environmental Quality
MTBE Methyl Tertiary Butyl Ether
NC DOT North Carolina Department of Transportation
NH DES New Hampshire Department of Environmental Services
NY DEC New York Department of Environmental Conservation
OUST Office of Underground Storage Tanks
PA DEP Pennsylvania Department of Environmental Protection
PFP Pay for Performance
PRP Potentially Responsible Party
PVI Petroleum Vapor Intrusion
QUEST Quick, Unbiased, Efficient Statistical Test
RBCA Risk-Based Corrective Action
RBDM Risk-Based Decision-Making
RCRA Resource Conservation and Recovery Act
RP Responsible Party
UST Underground Storage Tank
The NaTioNal lUST CleaNUp BaCklog: a STUdy of opporTUNiTieS
SepTemBer 2011 ES-1
E X E C U T I V E S U M M A R YLeaks from underground storage tanks (USTs) represent a threat to America’s finite groundwater and land resources. Even a small amount of petroleum released from a leaking underground storage tank (LUST) can contaminate groundwater, the drinking water source for nearly half of all Americans. From the beginning of the UST program to September 2009, more than 488,000 releases were confirmed from federally-regulated USTs nationwide.1 Cleaning up LUST releases is a joint federal and state responsibility under Subtitle I of the Resource Conservation and Recovery Act (RCRA). The states are the primary implementers of the UST program, and they have made significant progress addressing these releases. The numbers show the tremendous effort and achievement states made since the beginning of the program. By the end of fiscal year (FY) 2009, states completed 388,331 national LUST backlog cleanups. This substantial number represents closure of 80 percent of the national total of confirmed releases. In addressing these releases, individual states developed approaches to assist with the reduction of the backlog. These approaches can assist states in addressing the remaining national cleanup backlog of 100,165 open confirmed releases (as of FY 2009).2 To further address the LUST cleanup backlog and examine potential opportunities to foster backlog reduction, the United States Environmental Protection Agency (EPA) invited 14 states to participate in a national backlog characterization study. These 14 states include the ten states with the largest backlog numbers for FY 2006, when the selection process began, plus an additional four states to represent the remaining EPA regions.
EPA defines the LUST cleanup backlog as those releases that have not reached “cleanup completed” status. Many of the releases in the backlog are currently being addressed but have not completed cleanup; nationally, 95 percent of releases are reported to have initiated site assessment or cleanup activities. However, the LUST cleanup backlog also includes a significant number of legacy releases that are in a long-term cleanup process or are awaiting cleanup. Many releases have been in cleanup for several years, often because they are complex and difficult cleanups. Other releases might be close to closure but have not reached closure status because of a state’s need to address higher priority releases first.
1 The count of releases includes multiple releases at individual facilities.2 EPA, Semi-Annual Report of UST Performance Measures End of Fiscal Year 2009.
September 30, 2009. www.epa.gov/oust/cat/ca_09_34.pdf.
The ten states with the largest backlogs accounted for 61 percent of the national LUST cleanup backlog.3 The remaining four states added five percent. Collectively, these states represented a significant portion of the remaining national backlog. These 14 states provided EPA with the data from their LUST cleanup programs for this study. EPA analyzed the data to better understand trends and patterns within the LUST cleanup backlog. The report includes analyses from both a national perspective based on the aggregate data collected from the 14 states and a state-by-state perspective based on the individual state information. In both the national and state chapters, EPA identifies data findings and then highlights potential backlog reduction opportunities associated with those findings. EPA will use this study to lay the groundwork for discussions with all states and other stakeholders on how to continue reduction of the national LUST cleanup backlog, develop targeted backlog reduction strategies, and further cleanup progress.
While analyzing state data, EPA discovered the availability and quality of data varied across the states. Recognizing that state databases were not purposefully designed to support this study, EPA and the states agree that a one-time data collection might not entirely reflect the ongoing work at all the releases in the LUST cleanup backlog. In order to depict the available data as accurately as possible, EPA worked closely with the 14 states to ensure that the correct data elements were selected for analysis based on each state-specific program and accurately discussed any data limitations or caveats within the context of the report. EPA analyzed the following areas using the data from the 14 participating states, as available.
3 EPA used the 2006 End of Year Report to determine the top ten backlog states and the associated percentages. EPA, Semi-Annual Report of UST Performance Measures End of Fiscal Year 2006. November 14, 2006. www.epa.gov/oust/cat/ca_06_34.pdf.
The NaTioNal lUST CleaNUp BaCklog: a STUdy of opporTUNiTieS
ES-2 September 2011
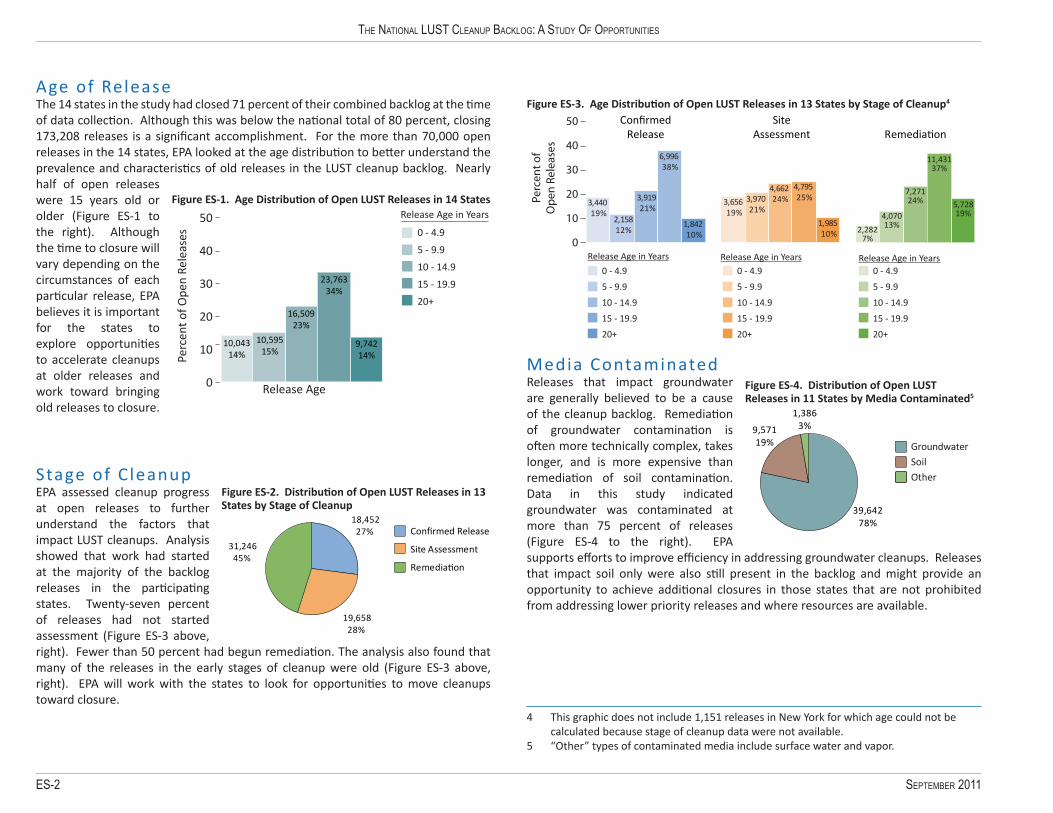
Age of Release The 14 states in the study had closed 71 percent of their combined backlog at the time of data collection. Although this was below the national total of 80 percent, closing 173,208 releases is a significant accomplishment. For the more than 70,000 open releases in the 14 states, EPA looked at the age distribution to better understand the prevalence and characteristics of old releases in the LUST cleanup backlog. Nearly half of open releases were 15 years old or older (Figure ES-1 to the right). Although the time to closure will vary depending on the circumstances of each particular release, EPA believes it is important for the states to explore opportunities to accelerate cleanups at older releases and work toward bringing old releases to closure.
Stage of C leanupEPA assessed cleanup progress at open releases to further understand the factors that impact LUST cleanups. Analysis showed that work had started at the majority of the backlog releases in the participating states. Twenty-seven percent of releases had not started assessment (Figure ES-3 above, right). Fewer than 50 percent had begun remediation. The analysis also found that many of the releases in the early stages of cleanup were old (Figure ES-3 above, right). EPA will work with the states to look for opportunities to move cleanups toward closure.
Media ContaminatedReleases that impact groundwater are generally believed to be a cause of the cleanup backlog. Remediation of groundwater contamination is often more technically complex, takes longer, and is more expensive than remediation of soil contamination. Data in this study indicated groundwater was contaminated at more than 75 percent of releases (Figure ES-4 to the right). EPA supports efforts to improve efficiency in addressing groundwater cleanups. Releases that impact soil only were also still present in the backlog and might provide an opportunity to achieve additional closures in those states that are not prohibited from addressing lower priority releases and where resources are available.
4 This graphic does not include 1,151 releases in New York for which age could not be calculated because stage of cleanup data were not available.
5 “Other” types of contaminated media include surface water and vapor.
Figure ES-1. Age Distribution of Open LUST Releases in 14 States
50
40
30
20
10
0 Release Age
Perc
ent o
f Ope
n Re
leas
es
10,04314%
10,59515%
16,50923%
23,76334%
9,74214%
0 - 4.9
5 - 9.9
10 - 14.9
15 - 19.9
20+
Release Age in Years
Figure ES-2. Distribution of Open LUST Releases in 13 States by Stage of Cleanup
Conrmed Release
Site Assessment
Remediation
18,452 27%
19,658 28%
31,246 45%
Figure ES-4. Distribution of Open LUST Releases in 11 States by Media Contaminated5
39,64278%
9,57119%
1,3863%
GroundwaterSoil Other
Figure ES-3. Age Distribution of Open LUST Releases in 13 States by Stage of Cleanup4
50
40
30
20
10
0
Perc
ent o
fO
pen
Rele
ases
ConrmedRelease
SiteAssessment Remedia on
2,2827%
4,07013%
7,27124%
11,43137%
5,72819%
0 - 4.9
5 - 9.9
10 - 14.9
15 - 19.9
20+
Release Age in Years
0 - 4.9
5 - 9.9
10 - 14.9
15 - 19.9
20+
0 - 4.9
5 - 9.9
10 - 14.9
15 - 19.9
20+
Release Age in Years Release Age in Years
3,440 19%
3,656 19%
2,15812%
3,970 21%
3,919 21%
4,662 24%
6,996 38%
4,795 25%
1,842 10%
1,985 10%

The NaTioNal lUST CleaNUp BaCklog: a STUdy of opporTUNiTieS
SepTemBer 2011 ES-3
Cleanup F inancing Cleanup financing and state program staffing to oversee LUST cleanups are fundamental resources that affect a state’s ability to address its backlog. EPA analyzed available financing data from the 14 participating states, including the type of financial responsibility (FR) mechanism in use for releases in the backlog, cleanup costs where available, and state resources for cleanup oversight. Data and discussions with state staff indicated the following:
• Insufficient state fund financing leads to the indefinite postponement of many state-financed cleanups;
• Many releases in states with UST cleanup funds were considered ineligible for state fund financing;
• Many old privately-financed cleanups remain in the early stages of cleanup; • On average, states were spending more money per ongoing cleanup than was
spent to complete earlier, closed cleanups; and• State fund staff caseloads had doubled since 1998 and included a greater
proportion of complex groundwater cleanups (Figure ES-5 below).
Large staff workloads and funding limitations affect the reduction of the backlog. EPA believes reducing cleanup costs, streamlining cleanup oversight, using alternative and/or integrated sources of financing, and positioning responsible parties (RPs) to act more promptly provide further opportunities to strengthen resources available to reduce state backlogs.
Figure ES-5. Average Caseloads of Oversight Staff in States with State Cleanup Funds
Ave
rage
Num
ber o
f Rel
ease
spe
r Sta
ff M
embe
r
1996
1995
1994
1997
1998
1999
2000
2001
2002
2003
2004
2005
2006
2007
2008
2009
9374
96 95 101120
130
130
156172
152
172
171
182
177
207
0
50
100
150
200
250
Release Pr ior i ty EPA recognizes state programs do not have sufficient staff and financial resources to advance all LUST releases through the cleanup process simultaneously. Several states have implemented prioritization systems to direct their limited funding and staff oversight resources to the highest priority sites first. Of the eight states in this study using LUST-specific priority systems, open releases exist in all priority categories, including high priority (Figure ES-6 below). One of the significant findings of the study is that 956 high priority releases had not started site assessment and, more importantly, 60 percent of these high priority releases were 10 years old or older (Figure ES-7 below). This is an area of the study where EPA spent substantial time responding to state concerns that this number was potentially inflated due to data quality issues. EPA revised the original number to account for specific data quality comments, but the revised data continued to show high priority releases that had not started site assessment. EPA intends to work with the states to address any data quality issues concerning high priority releases and to ensure risks to human health and the environment from high priority releases are addressed as quickly as possible.
Figure ES-7. Age Distribution of High Priority LUST Releases in the Confirmed Release Stage in Eight Participating States
0 - 4.9
5 - 9.9
10 - 14.9
15 - 19.9
20 +
Unknown
Release Age in Years26127%
12213%
19921%
28730%
849%
30%
Conrmed Release(956 releases)
Figure ES-6. LUST Release Priority Among Eight States with Priority Data
8,63019%
17,50339%
11,64826%
6,99016%
High
Medium
Low
Unknown
The NaTioNal lUST CleaNUp BaCklog: a STUdy of opporTUNiTieS
ES-4 September 2011
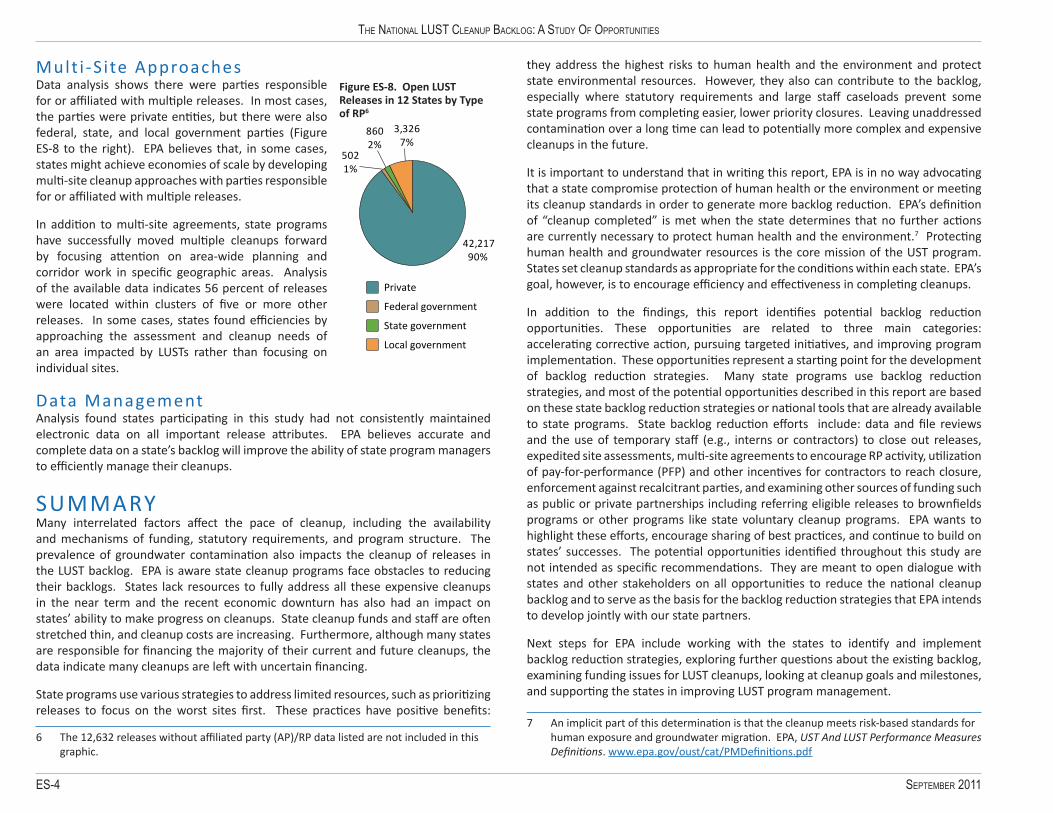
Mult i -S i te ApproachesData analysis shows there were parties responsible for or affiliated with multiple releases. In most cases, the parties were private entities, but there were also federal, state, and local government parties (Figure ES-8 to the right). EPA believes that, in some cases, states might achieve economies of scale by developing multi-site cleanup approaches with parties responsible for or affiliated with multiple releases.
In addition to multi-site agreements, state programs have successfully moved multiple cleanups forward by focusing attention on area-wide planning and corridor work in specific geographic areas. Analysis of the available data indicates 56 percent of releases were located within clusters of five or more other releases. In some cases, states found efficiencies by approaching the assessment and cleanup needs of an area impacted by LUSTs rather than focusing on individual sites.
Data ManagementAnalysis found states participating in this study had not consistently maintained electronic data on all important release attributes. EPA believes accurate and complete data on a state’s backlog will improve the ability of state program managers to efficiently manage their cleanups.
SUMMARY Many interrelated factors affect the pace of cleanup, including the availability and mechanisms of funding, statutory requirements, and program structure. The prevalence of groundwater contamination also impacts the cleanup of releases in the LUST backlog. EPA is aware state cleanup programs face obstacles to reducing their backlogs. States lack resources to fully address all these expensive cleanups in the near term and the recent economic downturn has also had an impact on states’ ability to make progress on cleanups. State cleanup funds and staff are often stretched thin, and cleanup costs are increasing. Furthermore, although many states are responsible for financing the majority of their current and future cleanups, the data indicate many cleanups are left with uncertain financing.
State programs use various strategies to address limited resources, such as prioritizing releases to focus on the worst sites first. These practices have positive benefits:
6 The 12,632 releases without affiliated party (AP)/RP data listed are not included in this graphic.
they address the highest risks to human health and the environment and protect state environmental resources. However, they also can contribute to the backlog, especially where statutory requirements and large staff caseloads prevent some state programs from completing easier, lower priority closures. Leaving unaddressed contamination over a long time can lead to potentially more complex and expensive cleanups in the future.
It is important to understand that in writing this report, EPA is in no way advocating that a state compromise protection of human health or the environment or meeting its cleanup standards in order to generate more backlog reduction. EPA’s definition of “cleanup completed” is met when the state determines that no further actions are currently necessary to protect human health and the environment.7 Protecting human health and groundwater resources is the core mission of the UST program. States set cleanup standards as appropriate for the conditions within each state. EPA’s goal, however, is to encourage efficiency and effectiveness in completing cleanups.
In addition to the findings, this report identifies potential backlog reduction opportunities. These opportunities are related to three main categories: accelerating corrective action, pursuing targeted initiatives, and improving program implementation. These opportunities represent a starting point for the development of backlog reduction strategies. Many state programs use backlog reduction strategies, and most of the potential opportunities described in this report are based on these state backlog reduction strategies or national tools that are already available to state programs. State backlog reduction efforts include: data and file reviews and the use of temporary staff (e.g., interns or contractors) to close out releases, expedited site assessments, multi-site agreements to encourage RP activity, utilization of pay-for-performance (PFP) and other incentives for contractors to reach closure, enforcement against recalcitrant parties, and examining other sources of funding such as public or private partnerships including referring eligible releases to brownfields programs or other programs like state voluntary cleanup programs. EPA wants to highlight these efforts, encourage sharing of best practices, and continue to build on states’ successes. The potential opportunities identified throughout this study are not intended as specific recommendations. They are meant to open dialogue with states and other stakeholders on all opportunities to reduce the national cleanup backlog and to serve as the basis for the backlog reduction strategies that EPA intends to develop jointly with our state partners.
Next steps for EPA include working with the states to identify and implement backlog reduction strategies, exploring further questions about the existing backlog, examining funding issues for LUST cleanups, looking at cleanup goals and milestones, and supporting the states in improving LUST program management.
7 An implicit part of this determination is that the cleanup meets risk-based standards for human exposure and groundwater migration. EPA, UST And LUST Performance Measures Definitions. www.epa.gov/oust/cat/PMDefinitions.pdf
Figure ES-8. Open LUST Releases in 12 States by Type of RP6
42,217 90%
502 1%
860 2%
3,326 7%
Private
Federal government
State government
Local government
42,217 90%
502 1%
860 2%
3,326 7%
Private
Federal government
State government
Local government
The NaTioNal lUST CleaNUp BaCklog: a STUdy of opporTUNiTieS
SepTemBer 2011 1
I N T R O D U C T I O NCleanup of leaking underground storage tanks (LUSTs) is regulated under Subtitle I of the Resource Conservation and Recovery Act (RCRA). One of the primary goals of the RCRA statute is to protect America’s resources. Leaks from underground storage tanks (USTs) represent a threat to America’s groundwater and land resources. Even a small amount of petroleum released from an UST can contaminate groundwater, the drinking water source for nearly half of all Americans. In surveys of state water programs, 39 states and territories identified USTs as a major source of groundwater contamination.8 As the reliance on our resources increases due to the rise in population and use, there is a correspondingly greater need to protect our finite natural resources.
The United States Environmental Protection Agency (EPA) undertook this study to lay the groundwork for discussion about the remaining LUST cleanups in the program. The report presents findings based on the data collected from the states participating in the study and then introduces potential opportunities for backlog reduction based on state backlog reduction efforts and tools available within the national program. All parties, including EPA and the states, have limited resources. Therefore, it is useful to collect and highlight more detailed opportunities about greater efficiencies gained, leveraging resources and state program successes. These opportunities are not recommendations for specific states but serve as examples of options for states to consider. State programs differ and the impact of issues faced by each state might differ. In addition, states have varying requirements that will determine the effective approaches in each state. EPA and the states will have to work jointly to determine the best approaches for backlog reduction for states and the national program. This report is the foundation for these discussions.
EPA’s UST program is primarily implemented by states and territories. Subtitle I of RCRA allows state UST programs approved by EPA to operate in lieu of the federal program. States implement the release prevention, detection, and cleanup requirements promulgated by EPA. State cleanup programs have a great deal of flexibility in how to pursue and complete LUST cleanups. On a semi-annual basis, EPA compiles national LUST cleanup measures provided by state cleanup programs to track the national progress in cleaning up releases. The states have made significant progress cleaning up LUST releases. From the beginning of the UST program to September 2009, states confirmed 488,496 releases from federally-regulated USTs nationwide, and the states
8 EPA, National Water Quality Inventory: 2000 Report, pp. 50-52. www.epa.gov/305b/2000report/chp6.pdf.
completed cleanups at 388,331 releases (80 percent of the national total).9 However, LUST releases that had not been cleaned up (open releases) remained in every state. This group of open releases is commonly referred to as the LUST cleanup backlog. The backlog is a function of the number of confirmed releases and the number of cleanups completed each year. EPA recognizes the term backlog can be misleading if it is interpreted to mean that nothing has been done at these releases. This interpretation is not supported by EPA or the performance data collected nationally by EPA. Based on EPA’s 2009 semi-annual report of UST performance measures, most of the releases in the national backlog were in assessment or remediation at the time data were collected for this study. In fact, assessment or cleanup was reported to have started at 463,000 releases nationally (95 percent of the national backlog). Many states regulate additional releases beyond the scope of federally-regulated releases (e.g., above ground storage tanks), but this report only covers the backlog of open releases at federally-regulated USTs.
Although states had made great progress in cleaning up LUST releases, the backlog remained sizable at the time this study began. For the first several years of the UST program, many more releases were discovered than were cleaned up, often because older releases were being discovered and reported to the states and EPA along with new releases. This led to an increase in the number of LUST cleanups through the early 1990s. The national backlog reached a high of 172,363 open releases in fiscal year (FY) 1995 and steadily decreased to 100,165 releases at the end of FY 2009 (Figure 1, page 2). Collectively, as the states completed cleanups at a faster pace than new releases were discovered the LUST cleanup backlog has reduced in size, but the annual net reduction of the LUST cleanup backlog has declined since 2000.10 The annual number of closures decreased almost every year since FY 2000 (Figure 2, page 2), while the annual number of newly confirmed releases decreased sharply between FY 2000 and FY 2001 and trended downward more gradually from FY 2002 to FY 2009 but remained above 7,000 (Figure 3, page 2). The annual net backlog reduction since 2000 ranged from 8,688 to 4,460 (Table 1, page 2).
9 EPA, Semi-Annual Report of UST Performance Measures End of Fiscal Year 2009. September 30, 2009. For detailed definitions of UST Performance Measures, see: www.epa.gov/OUST/cat/PMDefinitions.pdf. Fiscal year 2009 performance measures were the most recent data at the time of this analysis.
10 New releases include newly discovered releases. States often do not have information on when the release actually occurred, so a release that is new to the program might have occurred years ago.

The NaTioNal lUST CleaNUp BaCklog: a STUdy of opporTUNiTieS
2 September 2011
11 Data are based on annual cleanups completed and annual confirmed releases.
Figure 1. National LUST Cleanup Backlog, FY 1989 – FY 2009
14,4
34
70,8
19
100,
150 12
9,01
3
149,
957
163,
119
172,
363
164,
805
163,
476
168,
140
168,
896
162,
633
150,
085
142,
705
136,
265
129,
827
119,
242
113,
915
108,
768
102,
798
100,
165
0
20,000
40,000
60,000
80,000
100,000
120,000
140,000
160,000
180,000
200,000
1989
1990
1991
1992
1993
1994 1995
1996
1997
1998
1999
2000
2001
2002
2003
2004 2005
2006
2007
2008
2009
Fiscal Year
Nati
onal
Bac
klog
(N
umbe
r of
Ope
n Re
leas
es)
Source: EPA End of Year UST Performance Measures report, available online at: www.epa.gov/oust/cat/camarchv.htm.
Figure 3. LUST Confirmed Releases Nationally, FY 2000 – FY 2009
20,
834
19,
074
15,
769
18,
518
14,
285
15,
394
14,
493
13,
862
12,
768
12,
944
0
5,000
10,000
15,000
20,000
25,000
2000
2001
2002
2003
2004 2005
2006
2007 LU
ST C
lean
ups
Com
plet
ed N
ation
ally
Fiscal Year
2008
2009
Source: EPA End of Year UST Performance Measures report, available online at: www.epa.gov/oust/cat/camarchv.htm.
Figure 2. LUST Cleanups Completed Nationally, FY 2000 – FY 2009
16,3
74
11,0
33
10,5
22
9,83
0
7,77
9
7,26
9
8,36
1
7,57
0
7,36
4
7,16
8
0
2,000
4,000
6,000
8,000
10,000
12,000
14,000
16,000
18,000
20002001
20022003
20042005
20062007
20082009
Fiscal Year
Con
rmed
LU
ST
Rele
ases
Nati
onal
ly
Source: EPA End of Year UST Performance Measures report, available online at: www.epa.gov/oust/cat/camarchv.htm.
Table 1. Net Backlog Reduction Nationally, FY 2000 – FY 200911
FY Net Backlog Reduction
2000 4,460
2001 8,041
2002 5,247
2003 8,688
2004 6,506
2005 8,125
2006 6,132
2007 6,292
2008 5,404
2009 5,776

The NaTioNal lUST CleaNUp BaCklog: a STUdy of opporTUNiTieS
SepTemBer 2011 3
In addition, even though states report work starting at almost 95 percent of the releases nationally, this study reveals many releases remaining in the backlog take a long time to reach closure. Characteristically, these releases were very old, and most affect groundwater. Many of the releases impacting groundwater have been in cleanup for several years, often because they are complex and difficult cleanups. Some of the releases might have been close to closure but resources were shifted to address higher priority releases. At other releases, work had stalled due to funding or statutory limitations. This report seeks to highlight different characteristics of releases in the LUST cleanup backlog and develop a basis for discussion about what can potentially be done to improve backlog reduction for the releases in each subset. Preventing releases will also play a role in backlog reduction, and EPA expects the number of new releases to stay low over time, given ongoing release prevention efforts.
Many interrelated factors contribute to the large size of the backlog and the length of time to address it, including the characteristics of the sites remaining in the backlog as well as the characteristics of individual state LUST cleanup programs. In fact, features of individual state programs will likely prove to be a key factor in backlog reduction. Until 2006, EPA had not performed an in-depth analysis of the national LUST cleanup backlog, limiting what was known about the national cleanup backlog and the declining pace of cleanups. At that time, EPA began a multi-phased effort to more accurately characterize the backlog, better understand the potential reasons for the decline in the annual number of cleanups completed, and identify opportunities to mitigate this decline.
It is important to understand that in writing this report, EPA is in no way advocating that a state compromise protection of human health or the environment or meeting its cleanup standards in order to generate more backlog reduction. EPA’s definition of “cleanup completed” is met when the state determines that no further actions are currently necessary to protect human health and the environment.12 Protecting human health and groundwater resources is the core mission of the UST program. States set cleanup standards as appropriate for the conditions within each state. EPA’s goal is, however, to encourage efficiency and effectiveness in completing cleanups.
12 An implicit part of this determination is that the cleanup meets risk-based standards for human exposure and groundwater migration. EPA, UST And LUST Performance Measures Definitions. www.epa.gov/oust/cat/PMDefinitions.pdf
LUST CLEANUP BACKLOG STUDY – PHASE 1 Phase 1 of the national backlog study analyzed November 2006 data compiled from 45 participating states and territories to develop a general characterization of the national backlog.13 Where available, data included the age, media contaminated, and geographic location of releases in these states. The scope of this examination was limited, but the results of the Phase 1 backlog study indicated that, as of 2006, in the 104,884 open releases of those 45 states:14
• 64% of releases were concentrated in ten states; • 54% were 10 years old or older; • 59% impacted groundwater resources;15
• 16% impacted soil only, 40% of which had been in the backlog for 10 years or more;
• 4% impacted media other than groundwater or soil;• 21% lacked documentation of the media contaminated; and• There was an estimated $2.3 billion cleanup budget shortfall for the 24 states
with relevant data that could be analyzed.16
LUST CLEANUP BACKLOG STUDY – PHASE 2The Phase 1 backlog study provided a glimpse into possible reasons for the decline in the reduction of the cleanup backlog and formed the basis for further inquiry into the existing national backlog. EPA began Phase 2 of the backlog study in 2008. It was divided into three steps: identification of participating states; data identification, compilation, and standardization; and data analysis. This report describes the findings from the Phase 2 data analysis and introduces opportunities for discussion among EPA and states on ways to further reduce the cleanup backlog. Relevant issues and data from Phase 1 are also noted in this report.
13 A more complete discussion of the Phase 1 effort and results can be found in Appendix B.
14 The 45 states analyzed in Phase 1 accounted for 104,884 releases out of a national total for FY 2006 of 113,915 releases.
15 Because 21 percent of releases in Phase 1 lacked documentation of the media contaminated, this percentage likely underestimates the number of releases actually impacting groundwater. Of the releases with media contamination data in Phase 1, 75 percent impacted groundwater.
16 Estimate based on the number of unfinanced cleanups in each state and each state’s average cleanup cost at closure.

The NaTioNal lUST CleaNUp BaCklog: a STUdy of opporTUNiTieS
4 September 2011
Ident i f icat ion of Part ic ipat ing States
Using EPA’s 2006 End of Year UST Performance Measures report, EPA identified the states with the top ten largest contributions to the national backlog and, therefore, the highest number of opportunities for cleanups. By partnering with the top ten states, EPA analyzed 61 percent of releases in the FY 2006 national LUST cleanup backlog (Figures 4 and 5 to the right).17 Partnering with an additional state from each of the four EPA regions not represented by the top ten states provided coverage of all EPA regions and included an additional 5 percent of the FY 2006 national cleanup backlog. The final group of participants included 14 states from across all ten EPA regions (Figure 6, page 5). Figure 4 also shows the number of releases in the backlog remained relatively proportionate between 2006 and 2009. In using 2009 data from these 14 states, EPA continued to capture data on the majority of the LUST cleanup backlog.
EPA believes in order to effectively reduce the national cleanup backlog, states and EPA must develop backlog reduction strategies that work well in states with the largest backlogs. It is important to note the selection of the ten states with the largest backlogs does not indicate these states have poorly performing programs. A large backlog in a state does not necessarily indicate that a state has a higher release rate or a slower cleanup rate; the population of the state and its number of tanks can contribute to a high number of releases, and, therefore, to a large backlog.
EPA compared the change in backlog size during FY 2009 among 54 states and territories, and the analysis revealed that 50 states and territories managed to decrease their backlogs while only four had an increase in backlog size (Figure 7, page 5).18 The majority of state backlogs decreased between 1 and 10 percent. Of the 14 states in this study, 11 states reduced their backlogs by between 1 and 10 percent, while Texas achieved a 12 percent backlog reduction.
17 This percentage is based on all 56 states and territories included in the 2006 End of Year UST Performance Measures report: www.epa.gov/oust/cat/ca_06_34.pdf.
18 The net backlog reduction rate was calculated as the difference between new releases reported in FY 2009 and cleanups completed in FY 2009, shown as a percentage of a state’s FY 2008 backlog. South Dakota is not included in this graphic due to inconsistent reporting in performance measures, and American Samoa is not included because it does not have a backlog.
Figure 4. Rank of State LUST Cleanup Backlogs, by 2006 and 2009 End of Year Reporting
0
2,000
4,000
6000
8,000
10,000
12,000
14,000
16,000
FL
CA
MI
IL
NC
NJ
PA
TX
SC
NY
NE
WA
M
T
Y A N
H
Num
ber
of O
pen
Rele
ases
States and Territories
2006 - Participating State2008 - Participating State
2006 - Non-Participating State2008 - Non-Participating State
WI
IN
OH
KY G
A KS
IA AL
AZ
MO
O
R LA WV
MN
W M CO
CT TN
N
M
MD
VT VA A
K PR
O
K UT
MS
AR HI
RI
DC DE
NV
SD
ID
ME
ND
G
U
VI
CNM
I A
S
Source: EPA End of Year UST Performance Measures report, available online at: www.epa.gov/oust/cat/camarchv.htm.
Figure 5. Contribution of 14 Participating States to the National LUST Backlog in 2006
69,48961%
5,9415%
38,10734%
Top 10 States
Four States Added to Cover EPA Regions
Other States and Territories
Source: 2006 End of Year UST Performance Measures report, available online at: www.epa.gov/oust/cat/ca_06_34.pdf.
The NaTioNal lUST CleaNUp BaCklog: a STUdy of opporTUNiTieS
SepTemBer 2011 5
Figure 6. Map Highlighting States Participating in Phase 2 of the LUST Cleanup Backlog Study
Figure 7. FY 2009 Change in State LUST Cleanup Backlogs, from Largest Reduction to Largest Increase
Source: EPA End of Year UST Performance Measures report, available online at: www.epa.gov/oust/cat/camarchv.htm.
-12%
-10%
-8%
-8%
-6%
-5%
-5%
-4%
-4%
-4%
-3%
-1%
>-1%
<1%
0%
-10%
-20%
-30%
-40%
-50%
-60%
-70%
CNM
I VI
N
D
MA
GA VA
A
Z D
E TX
OK PA
M
E IN
MN
M
D
IL
KS
CA
WI
UT
OR ID
W
Y TN
IA
RI
N
V KY
N
C LA
DC HI
MO
N
H
AL
NY
NE
GU
FL
VT
SC
N
M
MT
CO
AR
WA
OH
A
K MI
WV
NJ
PR
CT
MS
States and Territories
States with a reduction in backlogStates withan increase in backlog
Perc
ent C
hang
e in
Sta
te B
ackl
og
10%
Phase 2 Participating State Non-participating State
StatePercent of 2006 National Backlog Rank
CA 12 2FL 13 1IL 7 4MI 8 3MT 1 25NC 6 5NE 2 16NH 1 32NJ 4 6NY 3 10PA 3 7SC 3 9TX 3 8WA 2 17
Source: 2006 End of Year UST Performance Measures report, available online at: www.epa.gov/oust/cat/ca_06_34.pdf.
10
9
8
6
7
5
4
3
2
1MT
CA
TX
IL
MI
FL
SC
NC
PA
NY
NJ
NH
NE
MT
*Source: EPA End of Year UST Performance Measures report, available online at www.epa.gov/oust/cat/camarchv.htm
PR
VI2
HI
LEGEND
EPA Region Number
Participating states are shown in full color, non-participating states are shaded
AK
% of 2006 National State Backlog* Rank
CA 12 2FL 13 1IL 7 4MI 8 3MT 1 25NC 6 5NE 2 16NH 1 32NJ 4 6NY 3 10PA 3 7SC 3 9TX 3 8WA 2 17
10
9
WA10
9
8
6
7
5
4
3
2
1MT
CA
TX
IL
MI
FL
SC
NC
PA
NY
NJ
NH
NE
MT
*Source: EPA End of Year UST Performance Measures report, available online at www.epa.gov/oust/cat/camarchv.htm
PR
VI2
HI
LEGEND
EPA Region Number
Participating states are shown in full color, non-participating states are shaded
AK
% of 2006 National State Backlog* Rank
CA 12 2FL 13 1IL 7 4MI 8 3MT 1 25NC 6 5NE 2 16NH 1 32NJ 4 6NY 3 10PA 3 7SC 3 9TX 3 8WA 2 17
10
9
WA

The NaTioNal lUST CleaNUp BaCklog: a STUdy of opporTUNiTieS
6 September 2011
Data Ident i f icat ion, Compi lat ion, and Standardizat ion
EPA solicited comments from state program staff on the potential reasons for their backlogs. State program staff proposed a number of possible reasons for their backlogs and the factors affecting the pace of cleanup. EPA compiled these proposed reasons, complemented the list with the results from the Phase 1 study, and used the combined list to help identify attributes of interest for analysis. EPA did not have the data to evaluate whether every reason listed below actually affected the pace of cleanups but wanted to list all of the reasons given by the states.
• States with more stringent cleanup standards have longer cleanup times and more expensive cleanups.
• The backlog is composed of many old releases with groundwater impacts that take longer to clean up.
• Low priority cleanups, often with soil-only contamination, are sometimes deferred indefinitely.
• Some old releases are not being actively addressed.
• Current open cleanups of older complex releases are more costly than cleanups completed in the past.
• Some state programs are underfunded and/or understaffed and cannot move all cleanups forward.
• The use of separate organizations for LUST cleanup and enforcement dilutes attention to cleanup.
• The type and implementation of financial responsibility (FR) mechanisms affect the pace of cleanups.
• Cleanups where property transactions occur might receive staff priority before other cleanups.
• Older releases involve contaminants that require more time and resources to fully remediate.
• Cleanups relying on monitored natural attenuation take a long time to close.
• Small businesses take longer than large businesses to clean up releases.
• States are burdened with addressing a large number of abandoned “orphan” releases.
• Releases remain in the backlog due to a lack of economic incentives for responsible parties (RPs) to close the releases and redevelop the sites.
• Recalcitrant RPs delay cleanups.
• Releases at active facilities take longer to clean up.
• In some states, releases that are cleaned up based upon a health and environmental threat priority system do not begin remediation until approved by the state.
• State statutory requirements that restrict the use of funds to a prioritization system can limit the number of cleanups that are actively addressed.
For the Phase 2 analysis, EPA relied on detailed data from participating states’ databases. EPA attempted to examine the listed proposed reasons as part of the backlog analysis effort. EPA assumed that many factors, including the type of FR mechanism, use of institutional or engineering controls, treatment technologies, and release priority could influence the pace of cleanup. EPA developed the list of attributes necessary to examine these factors in more detail and distributed it to participating states to aid in their data assembly efforts. In April 2008, EPA contacted state program managers to compile information on state program characteristics as well as a list of all the LUST-related data fields managed by each state program. Once the states shared lists of their data fields with EPA, EPA assessed each data field for accuracy, completeness, relation to attributes of interest in the analysis, and electronic availability. In November 2008, EPA held conference calls with staff at each state agency to discuss data quality and to identify final lists of data fields for compilation and analysis. Between November 2008 and July 2009, state staff provided EPA with data drawn from state databases, reports, and other sources in a variety of formats, including text, database, Excel, and PDF files. EPA organized, standardized, and compiled these data into databases for analysis. All data analyzed in this report were collected during this timeframe, except where noted (e.g., Phase 1 data). In many cases, the states did not have available data allowing for release-specific analysis of every proposed reason given above.
EPA compiled the data from the states into two major classifications: release attributes and program attributes. Examples of release attributes include the type of media contaminated, contaminants present, and the presence of free product. Examples of program attributes include cleanup standards, release prioritization systems, and other program structure elements. See Appendix A for a more detailed discussion of data identification, collection, standardization, and categorization.
Data Analys is
From the inception of the Phase 2 study, EPA intended to perform extensive analyses covering a large number of factors impacting state LUST cleanup backlogs. EPA expected that information on basic release characteristics, remedial technologies, spending on cleanups, current cleanup status, and other relevant data would be
The NaTioNal lUST CleaNUp BaCklog: a STUdy of opporTUNiTieS
SepTemBer 2011 7
stored in state databases. However, data quality and availability ultimately limited the scope of the analysis. For example, while state program managers mentioned that limited funding and the increasing cost of cleaning up releases are important factors affecting their state backlogs, a lack of detailed data on cleanup costs and funding availability limited the extent to which analysis could be performed.
Despite these limitations, EPA successfully employed statistical methods to analyze the available data and characterize the backlog in each state; see Appendix A for the description of the statistical methods used. Open releases were analyzed based on release age (i.e., the number of years since the release was confirmed) and stage of cleanup (i.e., how much progress had been made toward remediation or closure). Using the release age and stage of cleanup, EPA studied the additional characteristics of the releases that tend to persist in the backlog and have seen little progress toward cleanup completion (i.e., closure). EPA then identified findings for each area of analysis.
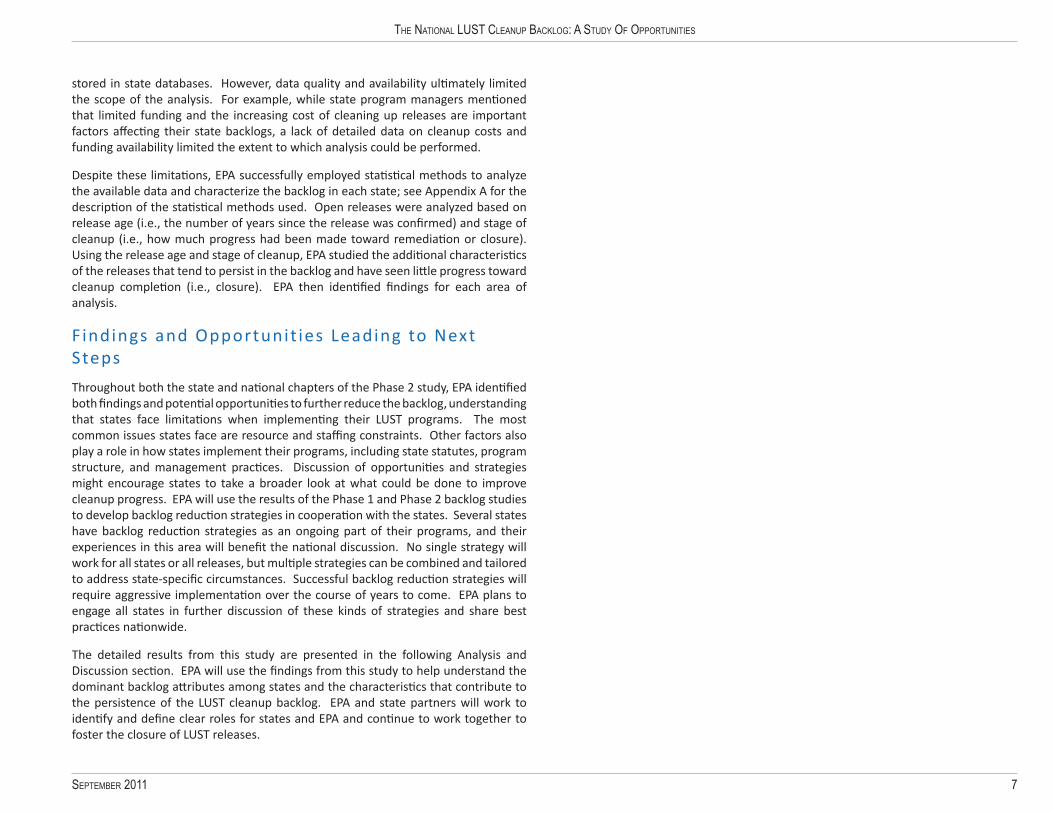
F indings and Opportunit ies Leading to Next Steps
Throughout both the state and national chapters of the Phase 2 study, EPA identified both findings and potential opportunities to further reduce the backlog, understanding that states face limitations when implementing their LUST programs. The most common issues states face are resource and staffing constraints. Other factors also play a role in how states implement their programs, including state statutes, program structure, and management practices. Discussion of opportunities and strategies might encourage states to take a broader look at what could be done to improve cleanup progress. EPA will use the results of the Phase 1 and Phase 2 backlog studies to develop backlog reduction strategies in cooperation with the states. Several states have backlog reduction strategies as an ongoing part of their programs, and their experiences in this area will benefit the national discussion. No single strategy will work for all states or all releases, but multiple strategies can be combined and tailored to address state-specific circumstances. Successful backlog reduction strategies will require aggressive implementation over the course of years to come. EPA plans to engage all states in further discussion of these kinds of strategies and share best practices nationwide.
The detailed results from this study are presented in the following Analysis and Discussion section. EPA will use the findings from this study to help understand the dominant backlog attributes among states and the characteristics that contribute to the persistence of the LUST cleanup backlog. EPA and state partners will work to identify and define clear roles for states and EPA and continue to work together to foster the closure of LUST releases.
The NaTioNal lUST CleaNUp BaCklog: a STUdy of opporTUNiTieS
8 September 2011
A N A L Y S I S A N D D I S C U S S I O N The results of the Phase 2 analysis show that many interrelated factors contribute to the persistence of the national LUST cleanup backlog. Most LUST releases contaminate groundwater resources and require significant time and money to reach closure. Although this basic characteristic of LUST contamination is a major driver of the persistence of the backlog, states also face a variety of issues in addressing LUST releases. The limited availability of financing for LUST cleanups severely impacts state programs’ ability to move all cleanups toward remediation and closure. The recent economic downturn has impacted the states’ ability to implement their programs. In addition, state statutes, program structures, and management affect how they address their backlog. These influential factors are discussed in this section, along with the aggregate data findings from the 14 participating states. EPA also introduces potential opportunities that states could use to reduce certain areas of their LUST cleanup backlogs. These potential opportunities are discussed in greater detail later in this report. EPA presents these opportunities to foster discussions with the states and other stakeholders on possible approaches to addressing the LUST cleanup backlog and improving cleanup progress. Many of these opportunities are derived from state activities that support state backlog reduction efforts.
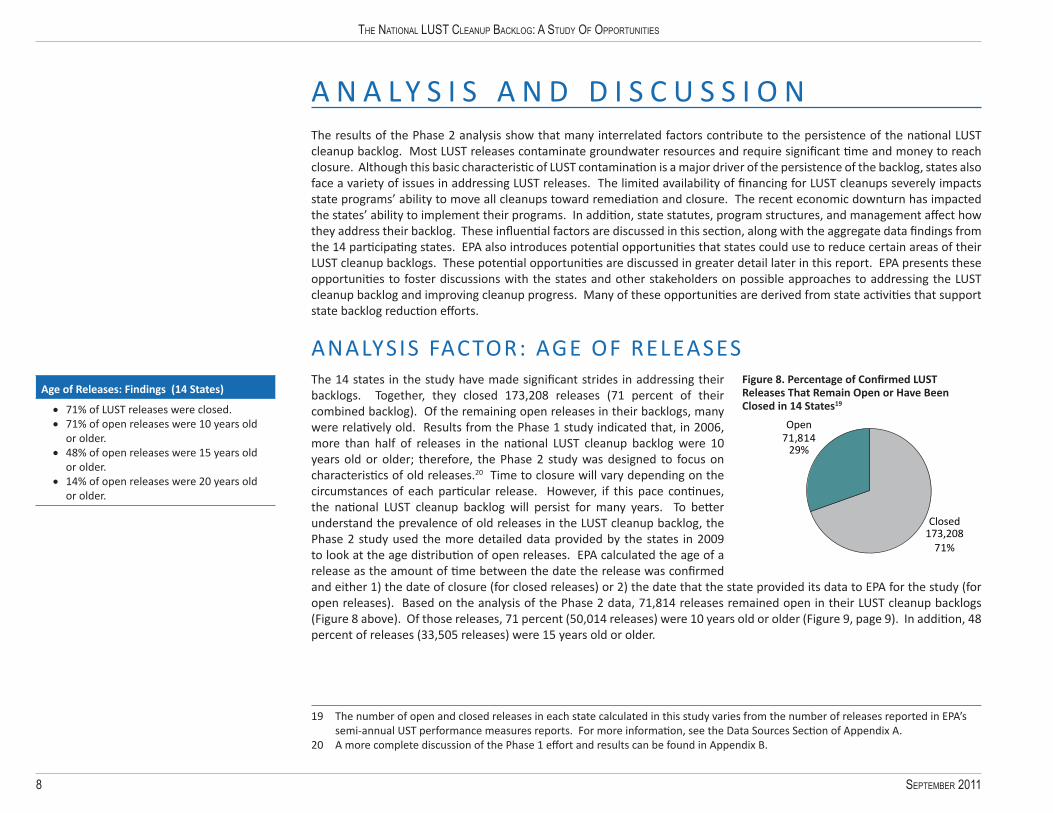
ANALYSIS FACTOR: AGE OF RELEASESThe 14 states in the study have made significant strides in addressing their backlogs. Together, they closed 173,208 releases (71 percent of their combined backlog). Of the remaining open releases in their backlogs, many were relatively old. Results from the Phase 1 study indicated that, in 2006, more than half of releases in the national LUST cleanup backlog were 10 years old or older; therefore, the Phase 2 study was designed to focus on characteristics of old releases.20 Time to closure will vary depending on the circumstances of each particular release. However, if this pace continues, the national LUST cleanup backlog will persist for many years. To better understand the prevalence of old releases in the LUST cleanup backlog, the Phase 2 study used the more detailed data provided by the states in 2009 to look at the age distribution of open releases. EPA calculated the age of a release as the amount of time between the date the release was confirmed and either 1) the date of closure (for closed releases) or 2) the date that the state provided its data to EPA for the study (for open releases). Based on the analysis of the Phase 2 data, 71,814 releases remained open in their LUST cleanup backlogs (Figure 8 above). Of those releases, 71 percent (50,014 releases) were 10 years old or older (Figure 9, page 9). In addition, 48 percent of releases (33,505 releases) were 15 years old or older.
19 The number of open and closed releases in each state calculated in this study varies from the number of releases reported in EPA’s semi-annual UST performance measures reports. For more information, see the Data Sources Section of Appendix A.
20 A more complete discussion of the Phase 1 effort and results can be found in Appendix B.
Figure 8. Percentage of Confirmed LUST Releases That Remain Open or Have Been Closed in 14 States19
173,208Closed
71%
71,814Open
29%
Age of Releases: Findings (14 States) • 71% of LUST releases were closed.• 71% of open releases were 10 years old
or older.• 48% of open releases were 15 years old
or older. • 14% of open releases were 20 years old
or older.

The NaTioNal lUST CleaNUp BaCklog: a STUdy of opporTUNiTieS
SepTemBer 2011 9
Age of Releases: Discuss ion
The 14 states had closed 173,208 releases and 71,814 open releases remained in their LUST cleanup backlogs (Figure 8) at the time data were compiled. Consistent with EPA policy, closed releases include those where a confirmed release does not actually require remediation but is counted as both a release and a completed cleanup. Although the 14 states closed 71 percent of releases overall, the percent of closed releases varied significantly by state. For example, Florida closed approximately half of its confirmed releases, whereas New York closed 91 percent of its confirmed releases (Figure 10 below). This range in the number of closures can indicate a state program’s success at completing cleanups but could also be partially attributed to the way that a state tracks and defines closed releases.
Data L imitat ionRelease date data were not available for 1,162 open releases (2 percent of backlog). Therefore, 1,162 releases are not included in any graphics that depict release age. In addition, there is variability in the closure data. For example, New York’s efforts to avoid duplication in its database might have overstated its number of closures.
Figure 9. Age Distribution of Open LUST Releases in 14 States
50
40
30
20
10
0 Release Age
Perc
ent o
f Ope
n Re
leas
es
10,04314%
10,59515%
16,50923%
23,76334%
9,74214%
0 - 4.9
5 - 9.9
10 - 14.9
15 - 19.9
20+
Release Age in Years
Figure 10. Percentage of Open and Closed LUST Releases, by Participating State
NC24,812
74%
26%
FL31,630
MI21,792
NJ10,791
MT3,211
IL22,899
NH2,298
SC9,264
WA6,414
NE6,122
PA15,230
TX25,610
NY26,683
Open
Closed
91% 49%63% 58%60%63%88% 80% 71% 69% 68% 68%
9%
51%
12%
20%
CA38,266
73%
27% 29% 31% 32% 32%37% 37%
40% 42%
State:Total Number of Releases:
0
100
Perc
enta
ge
The NaTioNal lUST CleaNUp BaCklog: a STUdy of opporTUNiTieS
10 September 2011
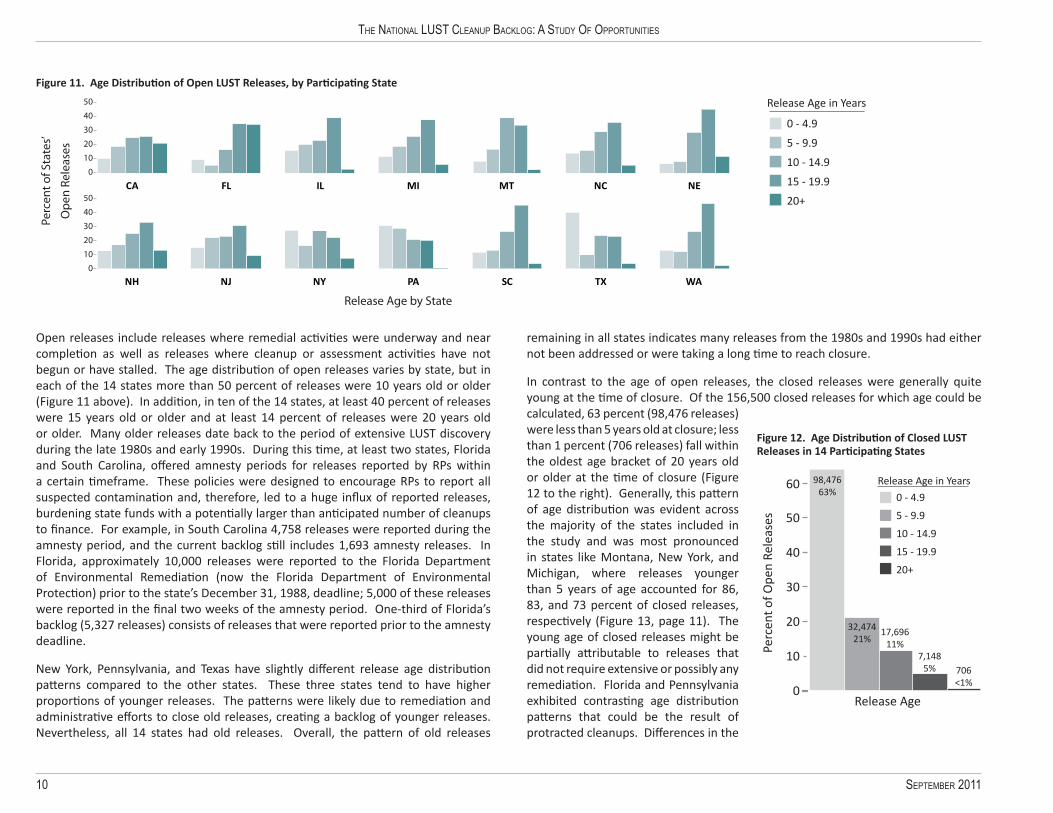
Open releases include releases where remedial activities were underway and near completion as well as releases where cleanup or assessment activities have not begun or have stalled. The age distribution of open releases varies by state, but in each of the 14 states more than 50 percent of releases were 10 years old or older (Figure 11 above). In addition, in ten of the 14 states, at least 40 percent of releases were 15 years old or older and at least 14 percent of releases were 20 years old or older. Many older releases date back to the period of extensive LUST discovery during the late 1980s and early 1990s. During this time, at least two states, Florida and South Carolina, offered amnesty periods for releases reported by RPs within a certain timeframe. These policies were designed to encourage RPs to report all suspected contamination and, therefore, led to a huge influx of reported releases, burdening state funds with a potentially larger than anticipated number of cleanups to finance. For example, in South Carolina 4,758 releases were reported during the amnesty period, and the current backlog still includes 1,693 amnesty releases. In Florida, approximately 10,000 releases were reported to the Florida Department of Environmental Remediation (now the Florida Department of Environmental Protection) prior to the state’s December 31, 1988, deadline; 5,000 of these releases were reported in the final two weeks of the amnesty period. One-third of Florida’s backlog (5,327 releases) consists of releases that were reported prior to the amnesty deadline.
New York, Pennsylvania, and Texas have slightly different release age distribution patterns compared to the other states. These three states tend to have higher proportions of younger releases. The patterns were likely due to remediation and administrative efforts to close old releases, creating a backlog of younger releases. Nevertheless, all 14 states had old releases. Overall, the pattern of old releases
remaining in all states indicates many releases from the 1980s and 1990s had either not been addressed or were taking a long time to reach closure.
In contrast to the age of open releases, the closed releases were generally quite young at the time of closure. Of the 156,500 closed releases for which age could be calculated, 63 percent (98,476 releases) were less than 5 years old at closure; less than 1 percent (706 releases) fall within the oldest age bracket of 20 years old or older at the time of closure (Figure 12 to the right). Generally, this pattern of age distribution was evident across the majority of the states included in the study and was most pronounced in states like Montana, New York, and Michigan, where releases younger than 5 years of age accounted for 86, 83, and 73 percent of closed releases, respectively (Figure 13, page 11). The young age of closed releases might be partially attributable to releases that did not require extensive or possibly any remediation. Florida and Pennsylvania exhibited contrasting age distribution patterns that could be the result of protracted cleanups. Differences in the
Figure 11. Age Distribution of Open LUST Releases, by Participating State
50
40
30
20
10
0
Perc
ent o
f Sta
tes’
Ope
n Re
leas
es
CA
NH
FL
NJ
IL
NY
MI
PA
MT
SC
NC
TX
NE
WA
50
40
30
20
10
0
Release Age by State
0 - 4.9
5 - 9.9
10 - 14.9
15 - 19.9
20+
Release Age in Years
Figure 12. Age Distribution of Closed LUST Releases in 14 Participating States
50
40
30
20
10
0Release Age
Perc
ent o
f Ope
n Re
leas
es
60 98,47663%
32,47421%
17,69611%
7,1485% 706
<1%
0 - 4.9
5 - 9.9
10 - 14.9
15 - 19.9
20+
Release Age in Years
50
40
30
20
10
0Release Age
Perc
ent o
f Ope
n Re
leas
es
60 98,47663%
32,47421%
17,69611%
7,1485% 706
<1%
0 - 4.9
5 - 9.9
10 - 14.9
15 - 19.9
20+
Release Age in Years

The NaTioNal lUST CleaNUp BaCklog: a STUdy of opporTUNiTieS
SepTemBer 2011 11
distribution of closed releases by age among the states might also be related to state policies toward release prioritization and closure, which will be discussed later in this report.
Note that closures reported each year include completed remedial work in addition to newly discovered, easily closed releases. In most cases, the data available for this study do not document whether a closed release actually required remediation. EPA performed an analysis of the age of releases at the time of closure from 1998 to 2008. The data show that closure for younger releases (less than 5 years old) dropped over time from 60 percent in 1998 to approximately 40 percent in recent years (Figure 14 below). Conversely, a larger percentage of releases closed in recent years were 10
years old or older at closure than those releases closed before 2001. The presence of a larger percentage of closures in the late 1990s and early 2000s that were less than 10 years old is expected due to the age of the program. In addition, approximately half of all releases 5 years old or less were closed in one year or less. These closed releases were expected to include primarily releases that were confirmed but did not require remediation and easier-to-remediate sites. The data show that state programs continue to achieve closures in a relatively short period of time for some releases while slowly gaining closures at older releases.
Figure 13. Age Distribution of Closed LUST Releases, by Participating State
0 - 4.9
5 - 9.9
10 - 14.9
15 - 19.9
20+
Release Age in Years100
80
60
40
20
0
100
80
60
40
20
0
Perc
ent o
f Sta
tes’
Clos
ed R
elea
ses
Release Age by State
CA
NH
FL
NJ
IL
NY
MI
PA
MT
SC
NC
TX
NE
WA
Figure 14. Age of Closed LUST Releases in 14 States at Time of Closure, by Year
0%
20%
40%
60%
80%
100%
1998 1999 2000 2001 2002 2003 2004 2005 2006 2007 2008
Perc
ent o
f Ann
ual
Clos
ures
Closure Year
Unknown
Release Age
1 - 4.9 years0 - 0.9 years
5 - 9.9 years10 + years

The NaTioNal lUST CleaNUp BaCklog: a STUdy of opporTUNiTieS
12 September 2011
Factors Contr ibut ing to the Age of the Cleanup Backlog
The LUST cleanup backlog consists of newly confirmed releases added to the backlog each year, along with the persistent older releases. As discussed in the Introduction, EPA collected several proposed reasons for the ongoing LUST cleanup backlog. Many of the reasons were factors that contribute to the older age of releases. EPA sought to evaluate the relationship between the age of releases and these other release attributes to determine what role each attribute plays in the LUST cleanup backlog. Many interrelated factors influence the age of a state’s backlog, such as how far along in the cleanup process releases tend to be, whether a release contaminates soil or groundwater, the type of financing mechanisms in place for a cleanup, and the priority level assigned to a release by a state. The following Analysis Factor sections discuss these relationships and associated opportunities. EPA believes it is important for the states to explore opportunities to accelerate cleanups at older releases and work toward bringing old releases to closure.
ANALYSIS FACTOR: STAGE OF CLEANUPTo further understand the factors driving the age of releases in the LUST cleanup backlog, EPA assessed cleanup progress at open releases. This analysis shows the backlog was mainly composed of releases that were being addressed, although 27 percent had not started assessment or remediation. However, the analysis also found releases were taking a long time to move through the stages of cleanup and many releases were in the early stages of cleanup. Data findings showed releases stalled in the cleanup process.
Stage of Cleanup: Findings (13 States)
• 45% had begun remediation.• 28% had begun site assessments but not
remediation.• 27% were confirmed but had not begun
site assessments.• 50% of releases 10 years old or older had
not begun remediation. Data L imitat ionApproaches to cleanup progress differ among the states. Some state programs initiate cleanup and then proceed through the entire cleanup process until closure. Other state programs address immediate threats and then use their resources to address other releases. Because addressing an immediate threat might involve remedial action, some of these releases were counted in the Remediation stage even though comprehensive site assessments had not been completed. In contrast, some releases were included in the Site Assessment stage because they re-entered site assessment after starting remediation when the state found additional contamination or pathways needing assessment. In this analysis, whether a release was placed in site assessment or remediation depended upon how the state tracks the data.
Data were not available to categorize open releases in New York by stage of cleanup, so these releases were excluded from this discussion and accompanying graphics. Data were not available to distinguish between releases in the Confirmed Release and Site Assessment stages in Washington State. Washington State staff reported that assessment activities had occurred at most releases, so these releases were categorized as Site Assessment stage releases. Similarly, data were not available to distinguish between the Site Assessment and Remediation stages in Michigan. The Michigan Department of Environmental Quality reported that remedial activities had occurred at most releases with site assessments, so these releases were categorized as Remediation stage releases. Montana stated its data likely underestimate the numbers of releases in assessment and remediation.

The NaTioNal lUST CleaNUp BaCklog: a STUdy of opporTUNiTieS
SepTemBer 2011 13
Stage of C leanup: Discuss ion
All open releases were classified into one of three stages of cleanup: Confirmed Release (comprehensive site assessment not yet underway), Site Assessment (comprehensive site assessment underway), and Remediation (remedial activities underway).21 EPA acknowledges that, in practice, cleanups often follow a more iterative process where assessment and remediation happen simultaneously. In some states, not all releases enter an official remediation stage if the contamination is addressed during site assessment and is then closed after monitoring. New Jersey, for example, estimates that 25 to 35 percent of its releases, including groundwater releases, will not have a formal remedial workplan. Discussions with state program staff ensured stage classification was as accurate as possible based on state data and practices.
21 It should be noted that not all states use these three categories to track cleanup progress and that states vary in how they track project status in their databases.
Based on the submitted data, many releases remained in the early stages of the cleanup process. Among the 13 states in this analysis, remedial activities had begun at only 45 percent of open releases, leaving 38,110 open releases in the Site Assessment stage or earlier in the process (Figure 15, to the left). This percentage is probably an underestimate of releases with remedial activities. State programs track cleanup progress differently, and not all programs document the initiation of remedial activities as a distinct milestone.22
The 13 states analyzed had wide-ranging stage-of-cleanup distributions. For example, only 21 percent of releases in South Carolina were in the Remediation stage, whereas 83 percent of releases in New Hampshire had entered the Remediation stage (Figure 16 below). However, the actual remedial activity at a release in the Remediation stage varied among the states, and not all releases in the Remediation stage were actively addressed. For example, a significant percentage of releases in the Remediation stage in New Hampshire were undergoing passive remediation and will take a long time to reach closure.23
The overall range of distributions across the stages of cleanup was partly due to differences in states’ approaches to cleanup. Several state programs address releases based on priority where lower priority releases are deferred until the higher priority releases are addressed. South Carolina, Florida, and North Carolina have
22 Stage of cleanup is based on state-specific classifications. The methods for tracking the cleanup progress of a LUST release differ among states. See Appendix A for additional information.
23 For more information, see the New Hampshire state chapter.
Figure 15. Distribution of Open LUST Releases in 13 States by Stage of Cleanup
Conrmed Release
Site Assessment
Remediation
18,452 27%
19,658 28%
31,246 45%
Conrmed Release
Site Assessment
Remediation
18,452 27%
19,658 28%
31,246 45%
Figure 16. Distribution of Open LUST Releases by Stage of Cleanup, by Participating State
Confirmed Release
Site Assessment
Remediation
NJ 4,268
CA 10,274
MT 1,189
NH 745
SC 2,942
WA 2,003
NE 1,771
NC 6,343
PA 3,084
MI 9,169
FL 16,121
TX 2,968
IL 8,479
State:Total Number of Releases:
0
100
Perc
enta
ge
83% 74% 70% 67% 61% 45% 44% 40% 38% 31% 29% 26% 21%
17% 26% 14% 33% 31% 36% 42% 31% 49% 30% 16%
16%
8%
19% 55%18% 31%
68% 22% 44%63%
*categories with less than 1% are not labeled

The NaTioNal lUST CleaNUp BaCklog: a STUdy of opporTUNiTieS
14 September 2011
statutes that direct them to only fund work at the highest priority releases and are prohibited from starting work at lower priority releases until the higher priority ones are addressed. Based on South Carolina’s 2009 data, 41 percent of the releases in site assessment were awaiting funding to proceed with work.24 Florida’s percentage was even higher due to recent funding cuts resulting in 86 percent of its releases awaiting funding to begin cleanup. Other differences in approach include cases where states conduct early remediation activities to address risks and then move on to other releases, whereas other states complete closure at a release before addressing the next release. Variations in data tracking can also influence the distribution. The small percentages of releases in the Confirmed Release stage in California and New Jersey were due to those state programs counting all confirmed releases as having assessments underway even if a full site assessment had not begun. Whereas with New Hampshire, all releases have the initial site assessment completed within a year of reporting. The overall distribution pattern was generally indicative of the type of work needed to complete closures. Strategies to address the type of work will vary by state. For example, states having programs with a large percentage of releases not in remediation might focus on completing site assessments.
Data findings supported the statement that the LUST cleanup backlog had many old releases and that many of these old releases were in the early stages of cleanup. Data showed 50 percent of the releases 10 years old or older were still in the Confirmed Release or Site Assessment stage at the time of data collection (Figure 17 to the right). The delay in action on so many releases is an ongoing cause of the backlog. For example, of the 18,645 releases in the Confirmed Release stage for which age could be calculated, 69 percent (12,929 releases) were 10 years old or older (Figure 18 above, right). In addition, 26 percent of all releases that were 10 years old or older had not begun site assessments (Figure 17). Although some states have said the data underestimate progress of releases into site assessment or remediation for their state, a significant percentage of releases in the backlog had not started remediation. This pattern suggests many releases were stalled. Outside of resource limitations or statutory provisions, site assessment activities can typically begin soon after a release
24 The South Carolina legislature, with support from the petroleum industry, recently provided additional funding for LUST cleanups in 2010 that will result in an additional $36 million over the next few years and allow South Carolina to address a significant percentage of its backlog. See the South Carolina state chapter for more information.
is identified and can often be completed in a relatively short timeframe. However, resource, staff, and statutory provisions are often the limiting factors. The finding that a significant number of releases had not begun the often lengthy remedial process indicates potential opportunities for states and EPA to promote or require quick action to complete site assessments, as resources are available.
There were a total of 30,782 releases in the Remediation stage for which age could be calculated (Figure 18). Of that total, 80 percent (24,430 releases) were 10 years old or older, including 19 percent (5,728 releases) that were 20 years old or older (Figure 18). Half of all releases included in all stages of cleanup that were 10 years old or older were in the Remediation stage (Figure 17). With most available data, EPA could not discern when remedial activities were initiated, so it is not clear how many releases are in long-term remediation, which ones have stalled, and which ones have just started remediation (i.e., a 15 year old release in the Remediation stage might have only just entered the Remediation stage). However, if many of these releases had been in the Remediation stage for a long period of time, states might explore opportunities to optimize remediation. Systematic review and optimization of remedial designs could assist states in making progress toward closure and reduce overall remediation time. EPA recognizes there are resource implications in such periodic reviews. Such costs need to be balanced against other program priorities. In the long term, however, establishing processes that enhance efficiency and cost-effectiveness should save program resources.
25 This graphic does not include 1,151 releases for which age could not be calculated (97 in the Confirmed Release stage, 590 in the Site Assessment stage, and 464 in the Remediation stage).
Figure 17. Distribution of Open LUST Releases 10 Years Old or Older in 13 States, by Stage of Cleanup
12,75726%
11,442 24%
24,430 50%
Conrmed Release
Site Assessment
Remediation
12,75726%
11,442 24%
24,430 50%
Conrmed Release
Site Assessment
Remediation
50
40
30
20
10
0
Perc
ent o
fO
pen
Rele
ases
ConrmedRelease
SiteAssessment Remedia on
2,2827%
4,07013%
7,27124%
11,43137%
5,72819%
0 - 4.9
5 - 9.9
10 - 14.9
15 - 19.9
20+
Release Age in Years
0 - 4.9
5 - 9.9
10 - 14.9
15 - 19.9
20+
0 - 4.9
5 - 9.9
10 - 14.9
15 - 19.9
20+
Release Age in Years Release Age in Years
3,440 19%
3,656 19%
2,15812%
3,970 21%
3,919 21%
4,662 24%
6,996 38%
4,795 25%
1,842 10%
1,985 10%
Figure 18. Age Distribution of Open LUST Releases in 13 States by Stage of Cleanup25

The NaTioNal lUST CleaNUp BaCklog: a STUdy of opporTUNiTieS
SepTemBer 2011 15
Stage of C leanup: Potent ia l Opportunit ies
To reduce the national LUST cleanup backlog, EPA and the states need to look for opportunities to address old releases that have not begun cleanup as well as those releases in long-term remediation. EPA identified the following potential opportunities to move releases through the stages of cleanup toward closure. Some states already employ some or all of these opportunities and have found them successful in moving releases forward. These potential opportunities discussed here and later in this report are not an exhaustive list; other productive opportunities could certainly be explored as well.
• Promote expedited site assessments.• Consider the use of a systematic process to explore opportunities to accelerate cleanups and reach closure, such as:o periodic review of release-specific treatment technologies to optimize cleanups; o review of site-specific cleanup standards; and o use of institutional/engineering controls (IC/ECs).
• Consider creating incentives for contractors to complete cleanups (e.g., pay-for-performance (PFP) contracts).• Emphasize enforcement where cleanups have stalled.
ANALYSIS FACTOR: MEDIA CONTAMINATEDGroundwater is an important natural resource at risk from petroleum contamination. In general, remediation of groundwater contamination is more technically complex, takes longer, and is more expensive than remediation of soil contamination. Therefore, larger numbers of releases affecting groundwater is a likely cause of the persistence of the LUST cleanup backlog. In fact, the data show that most LUST releases contaminate groundwater resources.
Releases that contaminate soil only are of concern because they represent a potential threat to groundwater resources and contaminate properties in neighborhoods and communities where they can result in direct exposure to contamination (e.g., utility workers, children playing in the dirt, or vapors intruding in the home). Although contaminated soil can typically be cleaned up faster than contaminated groundwater, many old releases with soil-only impacts are still unaddressed or are in the early stages of cleanup.
Media Contaminated: Findings (11 States)
• 78% of releases impacted groundwater resources.
• 19% impacted soil only.• 3% impacted other media only (e.g.,
surface water).
Data L imitat ionReleases in three states were not included in the analysis of the type of media contaminated. Data for releases in Nebraska were not available; data for releases in New York were not considered accurate by the state; and data were missing for 96 percent of releases in Illinois. In addition, the type of media contaminated were not specified for 8,507 of the 59,106 releases in the 11 states for which data were available. Therefore, percentages reported in this section were calculated based on the 50,599 releases with a known type of media contaminated. Because data accuracy for the type of media contaminated depends on the frequency of updates to each state database, the information presented in this section might not be an accurate reflection of current conditions. For example, Montana and Florida commented that many of the releases listed as impacting soil only also probably impact groundwater. Montana stated its data likely underestimate the numbers of releases in assessment and remediation.

The NaTioNal lUST CleaNUp BaCklog: a STUdy of opporTUNiTieS
16 September 2011
Media Contaminated: Discuss ion
The Phase 1 backlog study indicated that the majority of the LUST cleanup backlog consists of releases with groundwater contamination. However, a significant number of old releases contaminating soil only also remain open. To expand on these findings, the Phase 2 backlog study identified and characterized old releases in relation to contaminated media. This national analysis classified media contamination into three categories: groundwater contamination, soil-only contamination, and “other” media contamination, which includes vapor and surface water contamination.26
Evaluating the petroleum vapor intrusion (PVI) pathway is becoming increasingly important to states and the national program. There was not a
26 Groundwater contamination can include releases with other types of media contamination as well. For a detailed description of media contamination classifications, see Appendix A.
great deal of release-specific data on vapor to analyze for this study. EPA is currently developing additional guidance specifically to address PVI at Subtitle I UST sites.
The results from the Phase 2 analysis show that releases contaminating groundwater constituted most of the LUST cleanup backlog. Among open releases from the 11 states with available data on media contaminated (50,599 releases), 78 percent (39,642 releases) impacted groundwater resources, 19 percent (9,571 releases) impacted soil only, and 3 percent (1,386 releases) impact other media types only, such as surface water (Figure 19 to the left). This distribution was similar to that found in the Phase 1 study, where groundwater, soil, and other media contamination were found to make up 75, 20, and 5 percent of releases with known media contamination, respectively. The percentages for the type of media impacted differed among the 11 states, but groundwater contamination was always more prevalent than soil contamination. For example, releases impacting groundwater comprised nearly 100 percent of the backlog in Michigan and New Hampshire, while Florida and Pennsylvania had significantly higher occurrences of releases that contaminate soil only (Figure 20 below). However, Florida program staff informed EPA that most releases listed as contaminating soil only were also believed to have contaminated groundwater resources due to the shallow nature of groundwater throughout Florida. In addition,
Figure 19. Distribution of Open LUST Releases in 11 States by Media Contaminated
39,64278%
9,57119%
1,3863%
GroundwaterSoil Other
39,64278%
9,57119%
1,3863%
GroundwaterSoil Other
Figure 20. Distribution of Open LUST Releases by Media Contaminated, by State
Groundwater
Soil
Other
*categories with less than 5% are not labeled
State:Total Number of Releases:
0
100
Perc
enta
ge
56%
40%
PA
65%
33%
FL
68%
31%
WA
71%
17%
11%
CA
74%
26%
NC
78%
21%
MT
83%
17%
NJ
85%
11%
TX
96%
SC
99%
NH
100%
MI3,084 16,121 2,003 10,274 6,343 1,189 4,268 2,968 2,942 745 9,169

The NaTioNal lUST CleaNUp BaCklog: a STUdy of opporTUNiTieS
SepTemBer 2011 17
Florida had 4,509 releases for which the media contaminated were either unknown or not tracked in its database. Most of these releases are believed to impact groundwater, according to Florida staff.
According to the states, one of the most predominant reasons for the national LUST cleanup backlog was that the backlog has more releases with groundwater impacts now than in the past. Although it is true that the current backlog included a higher percentage of releases with groundwater impacts, this study reveals groundwater contamination has always been the largest part of the backlog (Figure 21 above). Releases that impact groundwater made up 78 percent of the cleanup backlog as of FY 2008, up from 67 percent in FY 1990. Because of the difficulty associated with remediating groundwater contamination, the presence of so many releases impacting groundwater suggests that releases in the backlog will require significantly more time and money on average per closure than cleanups completed in the past. This pattern is likely contributing to the reduction in annual cleanups completed in recent years; approximately 25,000 releases were closed per year in the late 1990s, whereas, on average, fewer than 14,000 releases were closed per year from FY 2006 to 2009 (Figure 22 to the left).
Figure 21. Distribution of Open LUST Releases per Year in 11 States, by Known Media Type (1990 – 2008)
20%
0%
40%
60%
80%
100%
1990 1992 1994 1996 1998 2000 2002 2004 2006 2008
Other
Soil Groundwater
Year
Perc
ent o
f Nati
onal
Bac
klog
Figure 22. LUST Cleanups Completed Nationally, FY 1990 – FY 2009
9,8
81
9,8
94
28,
778
31,
621
20,
383
23,
824
21,
411
25,
614
24,
950
25,
678
20,
834
19,
074
15,
769
18,
518
14,
285
15,
394
14,
493
13,
862
12,
768
12,
944
0
5,000
10,000
15,000
20,000
25,000
30,000
35,000
1990
1991
1992
1993
1994 1995
1996
1997
1998
1999
2000
2001
2002
2003
2004 2005
2006
2007
LUST
Cle
anup
sCo
mpl
eted
Nati
onal
ly
Fiscal Year
2008
2009
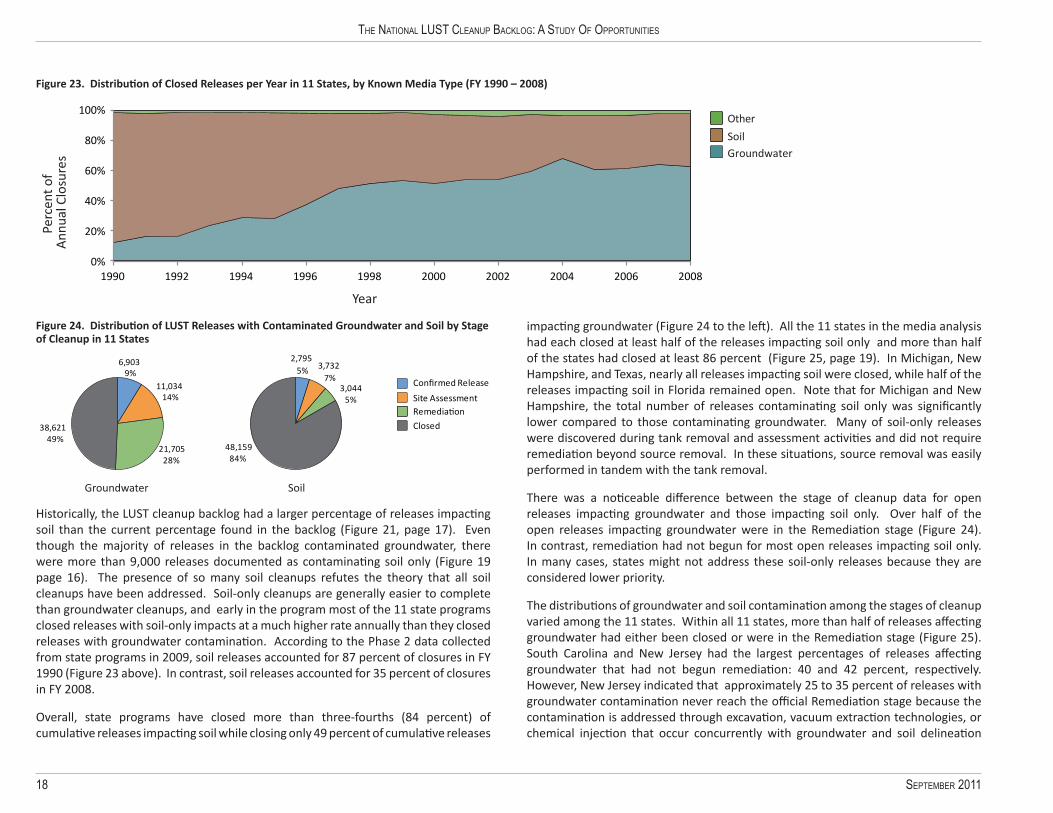
The NaTioNal lUST CleaNUp BaCklog: a STUdy of opporTUNiTieS
18 September 2011
Historically, the LUST cleanup backlog had a larger percentage of releases impacting soil than the current percentage found in the backlog (Figure 21, page 17). Even though the majority of releases in the backlog contaminated groundwater, there were more than 9,000 releases documented as contaminating soil only (Figure 19 page 16). The presence of so many soil cleanups refutes the theory that all soil cleanups have been addressed. Soil-only cleanups are generally easier to complete than groundwater cleanups, and early in the program most of the 11 state programs closed releases with soil-only impacts at a much higher rate annually than they closed releases with groundwater contamination. According to the Phase 2 data collected from state programs in 2009, soil releases accounted for 87 percent of closures in FY 1990 (Figure 23 above). In contrast, soil releases accounted for 35 percent of closures in FY 2008.
Overall, state programs have closed more than three-fourths (84 percent) of cumulative releases impacting soil while closing only 49 percent of cumulative releases
impacting groundwater (Figure 24 to the left). All the 11 states in the media analysis had each closed at least half of the releases impacting soil only and more than half of the states had closed at least 86 percent (Figure 25, page 19). In Michigan, New Hampshire, and Texas, nearly all releases impacting soil were closed, while half of the releases impacting soil in Florida remained open. Note that for Michigan and New Hampshire, the total number of releases contaminating soil only was significantly lower compared to those contaminating groundwater. Many of soil-only releases were discovered during tank removal and assessment activities and did not require remediation beyond source removal. In these situations, source removal was easily performed in tandem with the tank removal.
There was a noticeable difference between the stage of cleanup data for open releases impacting groundwater and those impacting soil only. Over half of the open releases impacting groundwater were in the Remediation stage (Figure 24). In contrast, remediation had not begun for most open releases impacting soil only. In many cases, states might not address these soil-only releases because they are considered lower priority.
The distributions of groundwater and soil contamination among the stages of cleanup varied among the 11 states. Within all 11 states, more than half of releases affecting groundwater had either been closed or were in the Remediation stage (Figure 25). South Carolina and New Jersey had the largest percentages of releases affecting groundwater that had not begun remediation: 40 and 42 percent, respectively. However, New Jersey indicated that approximately 25 to 35 percent of releases with groundwater contamination never reach the official Remediation stage because the contamination is addressed through excavation, vacuum extraction technologies, or chemical injection that occur concurrently with groundwater and soil delineation
Figure 23. Distribution of Closed Releases per Year in 11 States, by Known Media Type (FY 1990 – 2008)
21,705 28%
38,621 49%
Confirmed Release
Site AssessmentRemediation
Closed
3,044 5%
48,159 84%
lioSretawdnuorG
6,903 9%
11,034 14%
2,795 5% 3,732
7%
Figure 24. Distribution of LUST Releases with Contaminated Groundwater and Soil by Stage of Cleanup in 11 States
20%
0%
40%
60%
80%
100%
1990 1992 1994 1996 1998 2000 2002 2004 2006 2008
Other
Soil Groundwater
Year
Perc
ent o
f A
nnua
l Clo
sure
s

The NaTioNal lUST CleaNUp BaCklog: a STUdy of opporTUNiTieS
SepTemBer 2011 19
efforts during the Site Assessment stage. New Hampshire (56 percent), Michigan (56 percent), and Washington State (46 percent) had the largest percentages of releases affecting groundwater in the Remediation stage.
There was also a noticeable difference between the age of open releases impacting groundwater and those impacting soil only. Among the 11 states analyzed, the median age of open releases impacting groundwater was higher than the median age of releases impacting soil only (Figure 26 to the left). As easy-to-remediate releases are closed, state programs are left with higher numbers of complicated and time-consuming cleanups, thus, partially explaining the older median age of backlog releases impacting groundwater.
27 Michigan’s program has only one open soil release recorded.
Figure 25. Distribution of LUST Releases with Contaminated Groundwater and Soil, by Stage of Cleanup and State27
Confirmed Release
Site Assessment
RemediationClosed
*categories with less than 5% are not labeled
State:Total Number of Releases:
0
100
Perc
enta
ge
State:Total Number of Releases:
0
100
Perc
enta
ge
TX12,181
9%
84%
CA16,087
19%
23%
58%
MT1,795
5%8%
37%
50%
PA1,300
10%
37%
49%
SC5,365
8%
32%
12%
48%
NC8,328
13%
19%
23%
45%
FL13,555
14%
10%
31%
44%
WA2,340
13%
46%
42%
NJ5,249
42%
24%
34%
NH1,100
11%
56%
33%
MI10,963
25%
56%
20%
8%
90%
CA16,888
12%
87%
NJ5,492
11%
86%
SC909
5%10%
84%
WA4,056
12%6%8%
75%
NC6,364
7%5%
15%
74%
MT893
18%6%
15%
62%
PA1,254
20%
12%
18%
50%
FL7,808
Groundwater
Soil
100%
MI2,349
98%
TX11,582
96%
NH135
0
4
8
12
16
20
CA FL MI MT NC NH NJ PA SC TX WA Soil
Groundwater Med
ian
Age
(Yea
rs)
Media Type
Figure 26. Median Age of Open LUST Releases with Groundwater and Soil Impacts, by Participating State
The NaTioNal lUST CleaNUp BaCklog: a STUdy of opporTUNiTieS
20 September 2011
Media Contaminated: Potent ia l Opportunit ies
Much of the cleanup backlog involves groundwater contamination that can take a long time to clean up. EPA supports efforts to address more groundwater cleanups and complete cleanups in less time. Some states already use these types of efforts to ensure that releases move toward closure as efficiently as resources permit. Although factors such as a low priority ranking and resources might cause soil cleanups to be deferred, EPA identified the need to work with the states and find opportunities to reduce the backlog of soil-only releases because the Agency believes states should continue to make progress toward closure for all cleanups. EPA recognizes that states need to take release priority into account and continues to support a focus on higher priority releases. However, EPA encourages states to look for opportunities to make progress at lower priority releases when feasible. EPA encourages states to look for additional opportunities to increase efficiency in cleaning up groundwater and soil-only contamination such as those described below.
• Systematically evaluate cleanup progress at old releases with groundwater impacts and consider alternative cleanup technologies or other strategies to reduce time to closure.
• Use targeted backlog reduction efforts to close old releases with soil contamination needing minimal effort. • Use expedited site assessment to identify releases that can be targeted for closure or moved more quickly into
remediation as resources permit. • Explore opportunities to use other sources of public and private funding, such as petroleum brownfields grants, to
move relatively low risk releases toward closure.
ANALYSIS FACTOR: STATE PROGRAM RESOURCESCleanup financing and state program staffing to oversee LUST cleanups are fundamental resources affecting a state’s ability to address its backlog. In all states, whether public or private funds are used, state staff oversee the technical aspects of the cleanups to ensure both the cleanup process and cleanup outcomes protect human health and the environment. Where state dollars finance cleanups, state programs must also have sufficient financial resources to pay for cleanups as well as adequate staff to oversee those expenditures. In this section, EPA analyzed available financing data from the 14 participating states, including the type of FR mechanism in use for releases in the backlog, cleanup costs where available, and state resources for cleanup oversight. In addition, to supplement the limited data available from the participating states, data from the Association of State and Territorial Solid Waste Management Officials (ASTSWMO) state fund surveys were also analyzed.
S tate Program Resources: C leanup F inancing Discuss ion
The availability of ready financing for cleanups is a key factor in reducing the backlog. Federal law requires all UST owners and operators to have financial assurance mechanisms in place to pay for cleanup costs and third-party damages in case of a release. Owners and operators can comply with this requirement via coverage from a state cleanup fund or via a private financial mechanism, which is typically private insurance. The intent of this requirement is to ensure financing is readily available to clean up releases soon after they are discovered. State data on the type of financial assurance mechanism used were insufficient to compare state fund cleanup financing to private cleanup financing mechanisms. In practice, the persistence of backlogged sites regardless of whether the cleanup relies on a state fund or private financial assurance mechanisms indicates there are gaps in financial assurance leaving many releases without ready financing.
State Program Resources: Findings (14 states)
• Insufficient state fund financing leads to the indefinite postponement of many state-financed cleanups.
• Many releases in states with UST cleanup funds were considered ineligible for state fund financing.
• Many old privately-financed cleanups remained in the early stages of cleanup.
• On average, states were spending more money per ongoing cleanup than was spent to complete earlier, closed cleanups.
• State fund staff caseloads have doubled since 1998 and included a greater proportion of complex groundwater cleanups.

The NaTioNal lUST CleaNUp BaCklog: a STUdy of opporTUNiTieS
SepTemBer 2011 21
Thirty-six states have a state fund to fulfill the UST owner/operator federal FR requirement. Eight of the 14 states in this study have state cleanup funds that finance both past and newly-reported releases: California, Illinois, Montana, Nebraska, New Hampshire, North Carolina, Pennsylvania, and South Carolina (Table 2). None of these state funds have sufficient resources to address all confirmed releases simultaneously. The Florida and Texas state funds “sunsetted,” meaning they continue to finance older cleanups but stopped financing cleanups of new releases as of 10 years ago. New York and Washington State have unique cleanup financing structures that rely heavily on private mechanisms. LUST cleanups in Michigan and New Jersey rely solely on private FR mechanisms.29 Michigan has a causal liability law that results in many cleanups becoming the financial responsibility of the state as “orphan” releases (as described in more detail in the Michigan chapter of this report). All states in the study have some way to finance cleanups of at least some orphan releases where the RP is unknown or unable to undertake a cleanup. Orphan sites can be financed as part of a petroleum brownfields effort (sometimes including funding from other federal agencies), with LUST Trust Fund monies, or special state funds for orphan sites. Across many states, though, financing set aside to specifically address orphan releases is typically very limited.
Unique combinations of state and private cleanup financing were found in New York and Washington State. New York’s cleanup fund is an option invoked by the state when a site RP does not act. New York’s database did not track the type of mechanism used to finance cleanups outside its state fund, but given that New York’s state fund financed only 11 percent of its backlogged cleanups, it is reasonable to assume reductions in New York’s backlog depend mostly on private financing. In Washington State, the Pollution Liability Insurance Agency re-insures private UST insurers for cleanup costs above $75,000 in order to make private insurance more
28 Each state sets its own eligibility requirements for its state UST cleanup fund. Fund eligibility requirements vary significantly among states. EPA determines whether a state fund can fulfill the federal FR requirements on behalf of the state’s UST owner/operators.
29 Michigan’s state fund that formerly met the FR requirement became insolvent in 1995. Tank owners must now rely on private FR mechanisms to meet the FR requirement.
affordable. However, data provided by Washington State did not include the type of FR mechanism UST owner/operators use.
Data L imitat ionState database recordkeeping is typically minimal where UST facilities rely on private FR mechanisms. In three states, the specific type of private FR mechanism for a release is tracked, but analyses could not be performed due to incompleteness of data. The type of data available for this study includes a release’s eligibility for state funding and whether or not state funds have been spent on a cleanup.
State C leanup Funds F inancing
State funds are the most common FR compliance mechanism and method of financing cleanups. EPA analyzed state fund data from the 11 states in this study that used state funds for at least a portion of their program (California, Florida, Illinois, Montana, Nebraska, New Hampshire, New York, North Carolina, Pennsylvania, South Carolina, and Texas). Each state sets its own state fund eligibility requirements, and these requirements vary significantly among the states. There are several states where fund eligibility requirements appear to leave many cleanups with uncertain financing.30 State-funded or fund-eligible cleanups in each of the ten states with available state fund and stage of cleanup data tended to be old, and many of the releases had not entered the Remediation stage (Figures 27 and 28, page 22).31
Programs in five of these states tracked data based on which releases were state fund eligible. The other six state programs tracked data based on which cleanups had received state funds. Within the five states that tracked state fund eligibility, 61 percent of releases (17,736 releases) were eligible, an additional 9 percent (2,772
30 Florida, Montana, and Nebraska are the only states in the study that record the type of FR mechanism for releases not financed by the state fund.
31 New York’s database did not include stage of cleanup data.
Table 2. State Methods of Financing LUST Cleanups
State UST Cleanup Fund Finances Cleanup of All Eligible Releases28
Cleanups Financed by Sunsetted State Fund and Private Financing for
Post-Sunset CleanupsAll UST Cleanups Rely On Unique Private and
State Financing PoliciesAll Current UST Cleanups Rely
On Private Financing
California, Illinois, Montana, Nebraska, New Hampshire, North Carolina, Pennsylvania,
South Carolina
Florida, Texas New York, Washington State Michigan, New Jersey

The NaTioNal lUST CleaNUp BaCklog: a STUdy of opporTUNiTieS
22 September 2011
32 New Hampshire did not have data available to distinguish between releases in the Confirmed Release and Site Assessment stages. According to New Hampshire program staff, site assessments have been completed for all releases.
Figure 27. Age of State Fund Eligible Cleanups, by Stage of Cleanup, by State32
Circles are centered on the median age of each stage and are scaled to the number of releases.
Age
of R
elea
se (Y
ears
) 20
15
10
5
0
Confirmed ReleaseSite AssessmentRemedia on
194 707
715599
104
564 1,454 57048 145
893
3,868 1,904
5,971
FL NC NH SC TX
Figure 28. Age of State-Funded Cleanups, by Stage of Cleanup, by State
Age
of R
elea
se (Y
ears
) 20
15
10
5
0
Conrmed ReleaseSite AssessmentRemediation
CA
21
1,441
2,151117
968
1,205
49
89
538 367 586 233
177
98
1,151
IL MT NE PA
17,736 61%
2,772 9%
8,611 30%
Open Releases in FL, NC, NH, SC, and TX
(29,119 releases)
Eligible
Not Covered by the Fund
Unknown
State Fund Eligibility
17,736 61%
2,772 9%
8,611 30%
Open Releases in FL, NC, NH, SC, and TX
(29,119 releases)
Eligible
Not Covered by the Fund
Unknown
State Fund Eligibility
Figure 29. State Fund Eligibility in FL, NC, NH, SC, and TX

The NaTioNal lUST CleaNUp BaCklog: a STUdy of opporTUNiTieS
SepTemBer 2011 23
releases) were ineligible, and eligibility of an additional 30 percent (8,611 releases) were unknown (Figure 29, page 22).34
Some states in the study determine release eligibility only after a release is reported or a claim is made to the state fund (e.g., California). This approach leaves it too late for an owner/operator to finance remediation through a private FR mechanism such as insurance. Other states make UST eligibility determinations prior to a release but, in many cases, do not track the private mechanism used to finance cleanups not covered by the state fund. In the following states, EPA noted a lack of data on the type of financing for cleanup of releases: New York, 89 percent of releases; North Carolina, 75 percent of releases; Illinois, 73 percent of releases; California, 65 percent of releases; and Pennsylvania, 54 percent of releases (Figure 30 above).35
33 Releases classified as “unknown” might be eligible for state funding. “Other” indicates those releases that will not be financed by a state fund. These releases might or might not have a private FR mechanism. Detailed discussion of state financing is included in the state summary chapters.
34 Ineligible releases include those that are not covered by the scope of the state fund as well as any releases where the state made an ineligibility determination based on compliance or other state provision.
35 Illinois program staff stated they expect most remaining cleanups to be financed by the state fund.
Many state funds are currently facing significant financial difficulties. The ASTSWMO’s 2009 State Fund Survey and its Pulse of the Nation 2008 report portray the challenges states face in meeting state fund obligations by showing the decrease in state funds’ capacity.36 In addition, EPA’s Phase 1 data from 2006 indicate a funding gap in 24 states that rely on state funds to finance cleanups. These 24 states reported 38,780 incomplete cleanups as of November 2006, of which only one-third (13,254 cleanups) were receiving state financing. This left an estimated 25,526 releases not yet financed by state cleanup funds requiring an estimated additional $2.3 billion to close the releases, based on each state’s average cleanup cost at closure.37 Challenging state budget and economic trends since 2006 make it unlikely this gap has narrowed.
In response to the lack of resources, states studied in Phase 2 enacted policies restricting the number of claims filed so that reimbursement will align with available fund resources. Although these policies allow state programs to manage their backlogs in the face of limited resources, they also perpetuate the cleanup backlog. LUST programs in several states sought to increase fees and appropriations through their state legislatures, but proposed fee increases tend to face significant political
36 These publications are available online at: www.astswmo.org/Pages/Policies_and_Publications/Tanks.htm.
37 See Appendix B for additional discussion.
Figure 30. Percentage of LUST Releases to be Financed with State Funds, 11 States33
NC6,343
TX2,968
FL16,121
SC2,942
NH745
NY2,458
IL8,479
CA10,274
PA3,084
MT1,189
NE1,771
Eligible Not Covered Unknown State Funded Other Unknown
State:Total Number of Releases:
0
100
Perc
enta
ge
25%
75%
37%
63%
73%
23%
88% 94%89%
11%
73%
27%
65%
35%
54%
46%
57%
40%
67%
12%
21%
*categories with less than 10% are not labeled*categories with less than 10% are not labeled
States that Track Funding TypeStates that Track State Fund Eligibility

The NaTioNal lUST CleaNUp BaCklog: a STUdy of opporTUNiTieS
24 September 2011
opposition. Furthermore, budgeting challenges arising from a stressed economy have resulted in state budget officers and legislators having to reallocate monies that otherwise would flow to a state fund.
Pr ivate C leanup F inancing
Of the 14 states in this study, seven rely on private financing for some or all of their LUST cleanups: Florida, Michigan, Montana, New Jersey, New York, Texas, and Washington State. As discussed in the state fund eligibility section, most states that rely on private FR mechanisms to finance LUST cleanups do not track the type of private FR mechanism in place to finance these cleanups. Florida, Montana, and Nebraska were the only states in the study that used their databases to record the type of FR mechanism for releases not financed by the state funds, and all releases in New Jersey and Washington State were expected to be privately financed. The age and stage of privately-financed cleanups in five states are shown in Figure 31 above.38
For states and releases where private financing fulfills the FR requirement, EPA expected to find few relatively young releases in the first two stages of cleanup. Private financing is not limited by state budgets, and insurance companies likely have a vested interest in cleaning up releases quickly. This expected pattern was found in Florida and Texas where the state funds are designated for older releases, and newer releases must have private financing (Figure 31). In the other states, many old, privately-financed cleanups lingered on in the Confirmed Release or Site Assessment stages. In some cases, limited state oversight staff might be one cause of the older age of releases. If RPs were required to clean up releases without having dedicated financing in place, bankruptcy or abandonment might seem a better option to them than paying for a cleanup. Such unfinanced cleanups become an additional burden to the states either as orphan releases or as enforcement cases. Many states only
38 Michigan and New York could not be included in the graphic due to data limitations. See the state chapters for additional discussion.
use enforcement actions to compel cleanups on a limited basis. While enforcement can be resource intensive to pursue, it leverages the resources for cleanup from those responsible for the contamination. Greater emphasis on enforcement might foster additional cleanups. The experiences of some state programs (e.g., South Carolina) and the national program with the American Recovery and Reinvestment Act (ARRA) show that increased state activity can encourage RPs to move forward with cleanup. Washington State noted that a large number of its releases occurred prior to the federal or state requirements for financial responsibility and, therefore, an RP’s existing insurance policy will not cover a prior release.
Releases Without State Fund or Pr ivate F inancing
All USTs had to meet federal FR requirements by February 1994.39 Prior to 1994, many releases might not have had FR because the requirement was phased in starting in 1990. Of the releases confirmed prior to 1994, 13,140 releases (19 percent of the total backlog in the 14 states) do not have an FR mechanism specified in the state databases, nor were they all required to have FR under federal law because they were confirmed prior to 1994 (Figure 32, page 25). Of these releases, 4,666 (36 percent) had not been assessed and had the greatest likelihood to be orphan cleanups with no financially viable RP or dedicated state funding. Site assessment or remedial activities had begun at 8,474 (64 percent) of the 13,140 open, pre-1994 releases with unknown FR mechanisms (Figure 33, page 25).
More than half of the 13,140 pre-1994 releases with unknown FR mechanisms were in Illinois, California, and North Carolina (Figure 34, page 25). Programs in these three states use state funds to finance most cleanups, so these releases could be state funded. Nevertheless, a significant portion of the pre-1994 releases could end up becoming orphan releases, especially given their age. Orphan releases usually
39 The only exception to this date was for USTs located on tribal lands. They were not required to have FR until December 1998. They are not examined in this analysis.
Figure 31. Age of Privately-Financed Cleanups by Stage of Cleanup, by State
Ag
e o
f Rel
ease
(Ye
ars)
20
15
10
5
0
Conrmed ReleaseSite AssessmentRemediation
230 281230
10086
244
33
2,895
1,340
1,187388
307
518
1,485
FL MT NJ TX WA
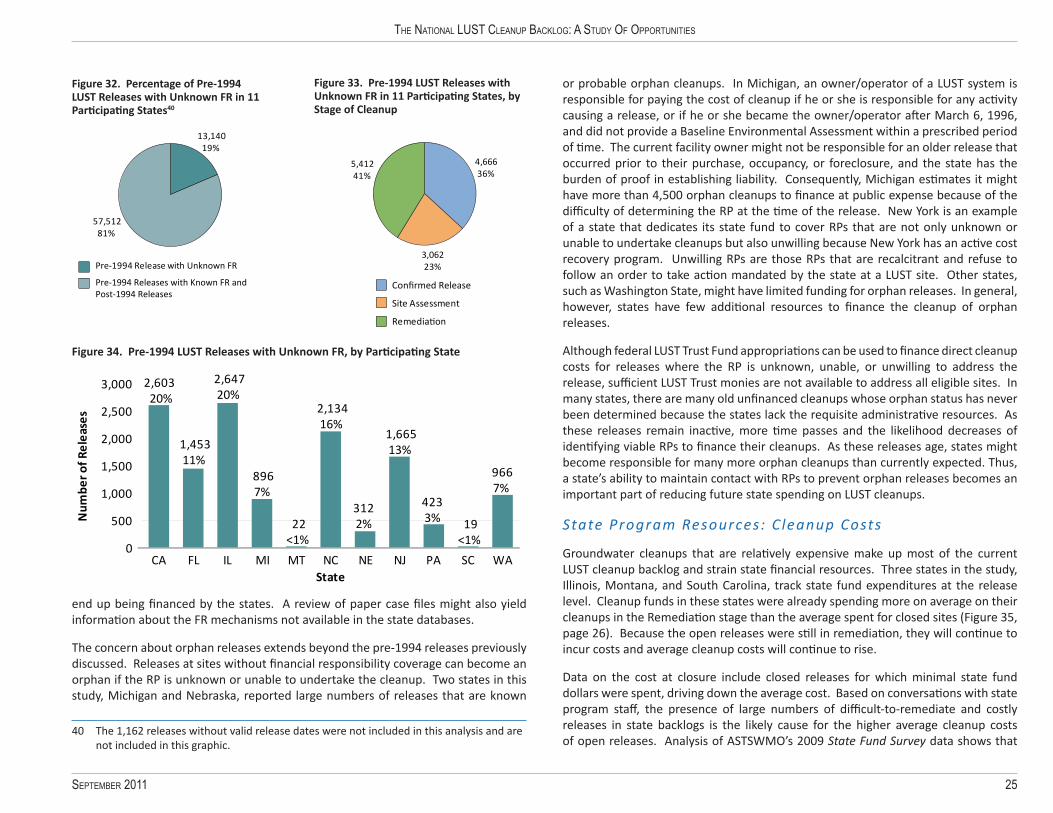
The NaTioNal lUST CleaNUp BaCklog: a STUdy of opporTUNiTieS
SepTemBer 2011 25
end up being financed by the states. A review of paper case files might also yield information about the FR mechanisms not available in the state databases.
The concern about orphan releases extends beyond the pre-1994 releases previously discussed. Releases at sites without financial responsibility coverage can become an orphan if the RP is unknown or unable to undertake the cleanup. Two states in this study, Michigan and Nebraska, reported large numbers of releases that are known
40 The 1,162 releases without valid release dates were not included in this analysis and are not included in this graphic.
or probable orphan cleanups. In Michigan, an owner/operator of a LUST system is responsible for paying the cost of cleanup if he or she is responsible for any activity causing a release, or if he or she became the owner/operator after March 6, 1996, and did not provide a Baseline Environmental Assessment within a prescribed period of time. The current facility owner might not be responsible for an older release that occurred prior to their purchase, occupancy, or foreclosure, and the state has the burden of proof in establishing liability. Consequently, Michigan estimates it might have more than 4,500 orphan cleanups to finance at public expense because of the difficulty of determining the RP at the time of the release. New York is an example of a state that dedicates its state fund to cover RPs that are not only unknown or unable to undertake cleanups but also unwilling because New York has an active cost recovery program. Unwilling RPs are those RPs that are recalcitrant and refuse to follow an order to take action mandated by the state at a LUST site. Other states, such as Washington State, might have limited funding for orphan releases. In general, however, states have few additional resources to finance the cleanup of orphan releases.
Although federal LUST Trust Fund appropriations can be used to finance direct cleanup costs for releases where the RP is unknown, unable, or unwilling to address the release, sufficient LUST Trust monies are not available to address all eligible sites. In many states, there are many old unfinanced cleanups whose orphan status has never been determined because the states lack the requisite administrative resources. As these releases remain inactive, more time passes and the likelihood decreases of identifying viable RPs to finance their cleanups. As these releases age, states might become responsible for many more orphan cleanups than currently expected. Thus, a state’s ability to maintain contact with RPs to prevent orphan releases becomes an important part of reducing future state spending on LUST cleanups.
State Program Resources: C leanup Costs
Groundwater cleanups that are relatively expensive make up most of the current LUST cleanup backlog and strain state financial resources. Three states in the study, Illinois, Montana, and South Carolina, track state fund expenditures at the release level. Cleanup funds in these states were already spending more on average on their cleanups in the Remediation stage than the average spent for closed sites (Figure 35, page 26). Because the open releases were still in remediation, they will continue to incur costs and average cleanup costs will continue to rise.
Data on the cost at closure include closed releases for which minimal state fund dollars were spent, driving down the average cost. Based on conversations with state program staff, the presence of large numbers of difficult-to-remediate and costly releases in state backlogs is the likely cause for the higher average cleanup costs of open releases. Analysis of ASTSWMO’s 2009 State Fund Survey data shows that
Figure 32. Percentage of Pre-1994 LUST Releases with Unknown FR in 11 Participating States40
13,140 19%
57,512 81%
Pre-1994 Release with Unknown FR
Pre-1994 Releases with Known FR and Post-1994 Releases
13,140 19%
57,512 81%
Pre-1994 Release with Unknown FR
Pre-1994 Releases with Known FR and Post-1994 Releases
Figure 33. Pre-1994 LUST Releases with Unknown FR in 11 Participating States, by Stage of Cleanup
4,666 36%
3,062 23%
5,412 41%
Conrmed Release
Site Assessment
Remediation
4,666 36%
3,062 23%
5,412 41%
Conrmed Release
Site Assessment
Remediation
Figure 34. Pre-1994 LUST Releases with Unknown FR, by Participating State
2,603 20%
1,45311%
2,64720%
8967%
22<1%
2,13416%
3122%
1,66513%
4233% 19
<1%
9667%
0
500
1,000
1,500
2,000
2,500
3,000
CA FL IL MI MT NC NE NJ PA SC WA
Num
ber o
f Rel
ease
s
State

The NaTioNal lUST CleaNUp BaCklog: a STUdy of opporTUNiTieS
26 September 2011
cleanup costs are increasing (Figure 36, right, fitted line in orange).41 For that survey, states reported the average cost per release at completed cleanups, calculated from the total spent by state funds on completed cleanups of federally-regulated USTs divided by the total number of funded cleanups completed. These amounts did not include any deductible amounts paid by tank owners. In 2011, both ASTSWMO and Illinois commented that the high costs of cleanup are driven by older long-term cleanups. Illinois stated it has data showing the cleanup of new releases that are quickly closed is less costly than the older, complex cleanups remaining in the backlog. Unfortunately, EPA did not get a chance to analyze the data on this issue within the context of this study, but a comparison of cleanup costs of new releases versus costs of older, complex cleanups could be an area of future interest.
41 The ASTWSMO state fund surveys are available online at: www.astswmo.org/Pages/Policies_and_Publications/Tanks.htm.
42 Analysis does not account for inflation.
State Program Resources: State Resources for C leanup Overs ight
Even if funding is available, cleanup of releases cannot move forward without state oversight of the cleanups. State limitations on the number of state program staff for cleanup oversight can slow state backlog reduction. High caseloads delay cleanup decision-making and allow cleanup progress to stall, often indefinitely, slowing reduction of the cleanup backlog. According to the ASTSWMO 2009 State Fund Survey, the number of sites that state staff are responsible for has increased, on average, from 100 sites in the late 1990s to over 200 sites per project manager in 2009 (Figure 37, page 27, fitted line in orange). A large state staff workload can delay the speed of cleanup work, and the trend data demonstrate that increased workloads could impact the reduction of the backlog. Appendix A includes the staff caseload data collected for Phase 2.
Administrative streamlining and focusing staff and contractor attention closely on contamination reduction at sites can reduce staff workload and improve cleanup progress. South Carolina and Texas have tried two different approaches to reduce staff workload. South Carolina has minimized administrative workloads and focused staff attention on cleanup results by using pay-for-performance (PFP) cleanup
43 Data obtained from the ASTSWMO state fund surveys: www.astswmo.org/Pages/Policies_and_Publications/Tanks.htm.
$247
,022
$143
,357
$156
,139
$140
,146
$23,
380
$35,
483
$0
$50,000
$100,000
$150,000
$200,000
$250,000
$300,000
IL MT SC
Closed
Aver
age
Publ
ic S
pend
ing
per
Clea
nup
Remediation
Figure 35. Average State Fund Spending at Active and Closed LUST Cleanups, by State41
Figure 36. Average Cost per Completed LUST Cleanup43
$103,817
$35,159
$48,706
$71,327$78,482
$74,129
$104,776
$77,665
$90,057
$90,375
$94,144$98,292
$89,087
$95,210
$0
$20,000
$40,000
$60,000
$80,000
$100,000
$120,000
1996
1997
1998
1999
2000
2001
2002
2003
2004
2005
2006
2007
2008
2009
Ave
rage
Cos
t Per
Rel
ease
at C
losu
re

The NaTioNal lUST CleaNUp BaCklog: a STUdy of opporTUNiTieS
SepTemBer 2011 27
contracting. PFP gives contractors discretion to select and manage the treatment technology, thereby minimizing this aspect of state staff workload. Payment of the contractor occurs as the contractor reaches a series of contamination-reduction milestones. Under PFP contracts, cleanup contractors and staff focus their efforts closely on cleanup progress. Texas has privatized technical oversight of some of its privately-financed LUST cleanups using Licensed Site Professionals (LSPs). The rationale behind the use of contracted support staff is it can allow state programs to increase output without incurring long-term staffing obligations, letting programs address more releases than might be possible otherwise.
44 Data obtained from the ASTSWMO state fund surveys: www.astswmo.org/Pages/Policies_and_Publications/Tanks.htm.
State Program Resources: Potent ia l Opportunit ies
There are potential opportunities for reducing cleanup costs and strengthening resources available to reduce state backlogs, such as streamlining cleanup oversight, providing supplemental financing for state funds, and positioning RPs to act more promptly. Specifically, such opportunities include:
• Detecting, reporting, and intercepting releases before groundwater is impacted can reduce overall cleanup costs.
• Linking contractor payment to cleanup progress and using competitive bidding to set cleanup prices can streamline cleanup oversight and accelerate cleanups at lower cost.
• Using and combining alternative funding sources, such as public-private partnerships or petroleum brownfields grants, can streamline cleanup oversight and accelerate cleanups at lower cost.
• Long-term financing, such as claims financing programs, loan funds, or bonds, as well as subrogation of privately insured state fund costs can supplement state fund revenue.
• Using low interest, revolving state loan funds, such as New Hampshire’s cleanup revolving loan fund, could finance cleanups not covered by any FR mechanism.
Figure 37. Average Caseloads of Oversight Staff in States with State Cleanup Funds44A
vera
ge N
umbe
r of R
elea
ses
per S
taff
Mem
ber
1996
1995
1994
1997
1998
1999
2000
2001
2002
2003
2004
2005
2006
2007
2008
2009
9374
96 95 101120
130
130
156172
152
172
171
182
177
207
0
50
100
150
200
250

The NaTioNal lUST CleaNUp BaCklog: a STUdy of opporTUNiTieS
28 September 2011
ANALYSIS FACTOR: RELEASE PRIORITIZATIONIdeally, state programs have sufficient staff and financial resources to advance all LUST releases through the cleanup process, including the resources needed for staff oversight, enforcement activities, and direct financing of release cleanups. Since most states do not have the resources to fully cover these activities, several states have implemented prioritization systems to direct their limited funding and staff oversight resources to the highest priority sites first. Eight of the states in this study use priority systems (Michigan, Montana, New Jersey, Texas, Florida, Nebraska, North Carolina, and South Carolina).45 Releases are usually prioritized once sufficient site-specific data are collected, although this is often before a full site assessment is initiated. Risk-based prioritization is a sound policy that can assist managers in the triage of large cleanup backlogs. However, the progress on cleanups completed is influenced by the prioritization of releases because states focus on higher risk releases. High priority releases are often more time consuming and costly, consuming most of a state’s LUST program resources. As a result, low priority releases can linger indefinitely in the backlog.
Release Pr ior i t izat ion: Discuss ion
State programs vary in their use of prioritization systems. Not all programs use them, and some state programs with these systems follow their priority rankings as a matter of policy but can choose to make exceptions at their discretion (Table 3). For example, if there is a pending property transaction, a state caseworker might shift his or her focus to that cleanup to ensure it is addressed and advances revitalization goals. For other states, however, the role of cleanup prioritization goes beyond department policy and is written into the state statutes. Some states use their prioritization systems to identify high risk releases and carry the cleanup through to completion. Other states use their prioritization systems to identify releases with the maximum risks to human health and the environment and then focus on risk reduction, addressing the main risks at as many releases as possible with less emphasis on completing cleanups. Some of these states reprioritize releases as work progresses, thereby increasing the number of open lower priority releases.
State programs generally base release priority on the extent of contamination and the risk posed to human health and the environment. Several state programs calculate an individual risk score for every open release and prioritize available resources based on site risk and other factors. Other programs group releases into discrete priority classes (e.g., high, medium, and low or scores of 1-5) and use resources for the higher priority cleanups. For the purposes of this study, all prioritized releases for the eight states were converted to a high/medium/low rank with assistance from the respective state program staffs (Figure 38, page 29).
45 Some states use a single ranking system for all contaminated sites (i.e., Superfund, RCRA Subtitle C, state voluntary cleanup programs, and LUSTs) or rank risk based on all contamination at a site, not solely contaminants from a LUST release. States that use this approach to prioritization are not discussed in this report because the approach does not easily identify differences between LUST-specific priorities.
Table 3. Types of LUST Release Prioritization by State
States with Policy Priority
States with Statutory Priority
States with No Formal LUST Prioritization
MichiganMontanaNebraska
New JerseyTexas
FloridaNorth CarolinaSouth Carolina
CaliforniaIllinois
New HampshireNew York
PennsylvaniaWashington State
Release Prioritization: Findings (8 States)
• Eight of the 14 states in this study prioritize cleanups.
• 74% of releases in states with priority systems were considered high or medium priority. o 3,266 high priority releases have not
begun remediation, 64 percent of which were 10 years old or older.
o 956 high priority releases had not started site assessment, 60 percent of which were 10 years old or older.
• 26% of releases in states with priority systems were considered low priority.

The NaTioNal lUST CleaNUp BaCklog: a STUdy of opporTUNiTieS
SepTemBer 2011 29
In general, higher priority releases involve extensive groundwater contamination or direct risks to public drinking water, whereas lower priority releases are more likely to consist of smaller groundwater plumes or soil contamination only, especially in areas where drinking water comes from sources other than local groundwater. Therefore, the higher priority cleanups tend be more difficult, longer term, and higher cost, and the lower priority cleanups tend to be less complex, relatively quick to close, and lower cost.
High and medium priority releases constituted more than half of the releases in the backlogs in the eight states and require nearly all of the state programs’ attention and resources. Sixty-two percent of the high priority releases (5,364 releases) were in the Remediation stage (Figure 39 above, right). Although the state programs focus their resources on high priority releases, approximately 38 percent of high priority releases (3,266 releases) had not begun remediation, 64 percent of which were 10 years old or older (Figures 39 and Figure 40 to the right). This finding suggests even with a “worst first” approach, not all high priority releases were addressed quickly. More
46 States are grouped by the type of priority system, either policy or statutory. Releases in states that use different ranking categories from high, medium, or low priority were assigned to these categories to enable cross-state comparisons. EPA categorized these releases based on action thresholds and discussions with state program staff. In Texas, the priority system was not used between 2003 and 2009. The state had just re-opened the priority system when the data were compiled for this study. Therefore, there is a significant percentage of releases in Texas that were not prioritized. See the Texas state chapter for more information.
critically, data indicate that 11 percent of high priority releases (956 releases) had not started assessment (Figure 39). However, snapshots of data do not always give an accurate picture of what is really happening in a state. For example, a year prior to the state’s data submission, Montana revised its priority system to include releases with unknown receptors as high priority releases. This change allows Montana to address these releases with unknown risk much sooner than they otherwise would have been addressed. However, it had the result of increasing the number of older
Figure 38. Priority Ranking of LUST Releases Among Eight Participating States with Priority Data, by State46
Policy Priority Statutory Priority
High Medium Low Unknown
*categories with less than 5% are not labeled
State:Total Number of Releases:
0
100
Perc
enta
ge
MT1,189
SC2,942
NC6,343
NE1,771
30%
26%
24%
20%
MI9,169
TX9,169
NJ4,268
16%
42%
10%33%
22%
13%
24%
41%
44%
27%
26%
30%
25%
38%
8%
FL16,121
43%
37%
15%
37%
30%
20%
12%
12%
48%
39%
95611%
2,31027%
5,36462%
Conrmed Release
Site Assessment
Remediation
Figure 39. Stage of Cleanup of High Priority LUST Releases in Eight Participating States
26127%
12213%
19921%
28730%
849%
30% 307
13%
49321%
66029%
74332%
1055%
20%
0 - 4.9
5 - 9.9
10 - 14.9
15 - 19.9
20 +
Unknown
Release Age in Years
Conrmed Release(956 releases)
Site Assessment(2,310 releases)
Figure 40. Age Distribution of High Priority LUST Releases in the Confirmed Release or Site Assessment Stages in Eight Participating States
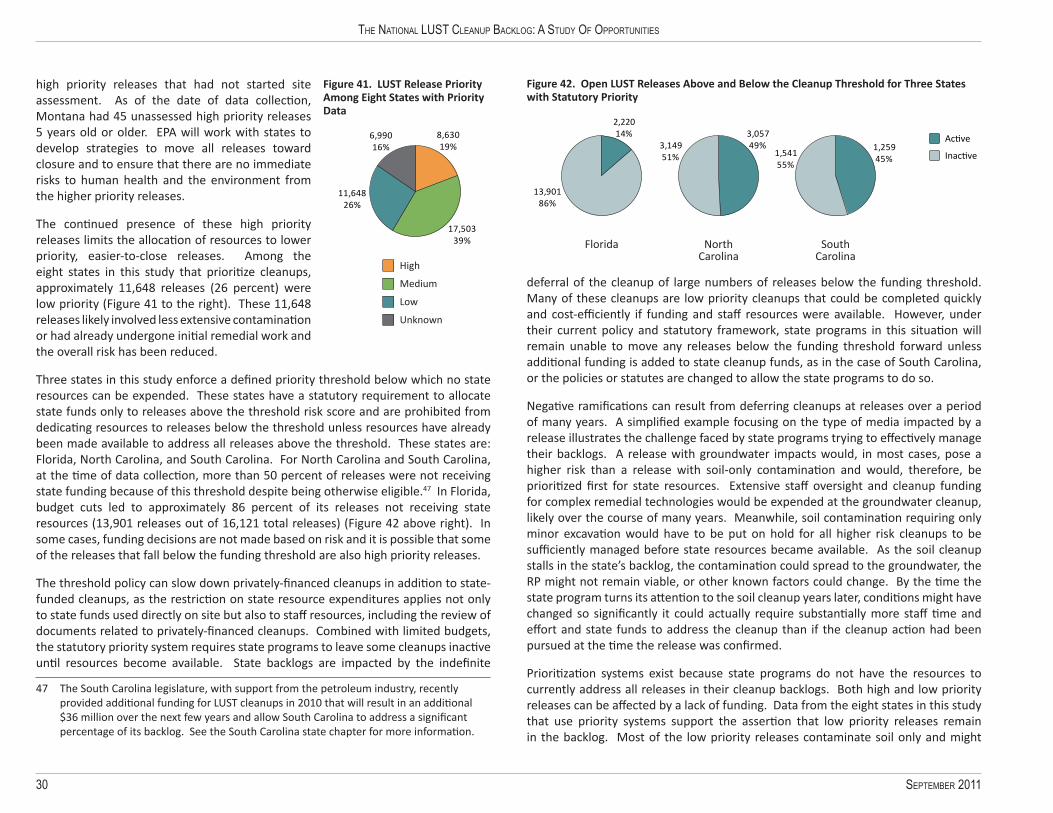
The NaTioNal lUST CleaNUp BaCklog: a STUdy of opporTUNiTieS
30 September 2011
high priority releases that had not started site assessment. As of the date of data collection, Montana had 45 unassessed high priority releases 5 years old or older. EPA will work with states to develop strategies to move all releases toward closure and to ensure that there are no immediate risks to human health and the environment from the higher priority releases.
The continued presence of these high priority releases limits the allocation of resources to lower priority, easier-to-close releases. Among the eight states in this study that prioritize cleanups, approximately 11,648 releases (26 percent) were low priority (Figure 41 to the right). These 11,648 releases likely involved less extensive contamination or had already undergone initial remedial work and the overall risk has been reduced.
Three states in this study enforce a defined priority threshold below which no state resources can be expended. These states have a statutory requirement to allocate state funds only to releases above the threshold risk score and are prohibited from dedicating resources to releases below the threshold unless resources have already been made available to address all releases above the threshold. These states are: Florida, North Carolina, and South Carolina. For North Carolina and South Carolina, at the time of data collection, more than 50 percent of releases were not receiving state funding because of this threshold despite being otherwise eligible.47 In Florida, budget cuts led to approximately 86 percent of its releases not receiving state resources (13,901 releases out of 16,121 total releases) (Figure 42 above right). In some cases, funding decisions are not made based on risk and it is possible that some of the releases that fall below the funding threshold are also high priority releases.
The threshold policy can slow down privately-financed cleanups in addition to state-funded cleanups, as the restriction on state resource expenditures applies not only to state funds used directly on site but also to staff resources, including the review of documents related to privately-financed cleanups. Combined with limited budgets, the statutory priority system requires state programs to leave some cleanups inactive until resources become available. State backlogs are impacted by the indefinite
47 The South Carolina legislature, with support from the petroleum industry, recently provided additional funding for LUST cleanups in 2010 that will result in an additional $36 million over the next few years and allow South Carolina to address a significant percentage of its backlog. See the South Carolina state chapter for more information.
deferral of the cleanup of large numbers of releases below the funding threshold. Many of these cleanups are low priority cleanups that could be completed quickly and cost-efficiently if funding and staff resources were available. However, under their current policy and statutory framework, state programs in this situation will remain unable to move any releases below the funding threshold forward unless additional funding is added to state cleanup funds, as in the case of South Carolina, or the policies or statutes are changed to allow the state programs to do so.
Negative ramifications can result from deferring cleanups at releases over a period of many years. A simplified example focusing on the type of media impacted by a release illustrates the challenge faced by state programs trying to effectively manage their backlogs. A release with groundwater impacts would, in most cases, pose a higher risk than a release with soil-only contamination and would, therefore, be prioritized first for state resources. Extensive staff oversight and cleanup funding for complex remedial technologies would be expended at the groundwater cleanup, likely over the course of many years. Meanwhile, soil contamination requiring only minor excavation would have to be put on hold for all higher risk cleanups to be sufficiently managed before state resources became available. As the soil cleanup stalls in the state’s backlog, the contamination could spread to the groundwater, the RP might not remain viable, or other known factors could change. By the time the state program turns its attention to the soil cleanup years later, conditions might have changed so significantly it could actually require substantially more staff time and effort and state funds to address the cleanup than if the cleanup action had been pursued at the time the release was confirmed.
Prioritization systems exist because state programs do not have the resources to currently address all releases in their cleanup backlogs. Both high and low priority releases can be affected by a lack of funding. Data from the eight states in this study that use priority systems support the assertion that low priority releases remain in the backlog. Most of the low priority releases contaminate soil only and might
Figure 41. LUST Release Priority Among Eight States with Priority Data
8,63019%
17,50339%
11,64826%
6,99016%
High
Medium
Low
Unknown
8,63019%
17,50339%
11,64826%
6,99016%
High
Medium
Low
Unknown
Figure 42. Open LUST Releases Above and Below the Cleanup Threshold for Three States with Statutory Priority
2,22014%
13,901 86%
Active
Inactive
Florida NorthCarolina
3,057 49%3,149
51%
SouthCarolina
1,259 45%
1,541 55%

The NaTioNal lUST CleaNUp BaCklog: a STUdy of opporTUNiTieS
SepTemBer 2011 31
require few resources to remediate, but states will remain unable to address them unless additional resources, and in some cases legislative permission, is obtained. In addition, high priority releases remain in the early stages of cleanup, and many are 10 years old or older. These findings indirectly support the claims that many old releases are not actively addressed and that some state programs are underfunded and/or understaffed and cannot move all cleanups forward.
Release Pr ior i t izat ion: Potent ia l Opportunit ies
EPA’s analysis of LUST priority data identified areas within the national cleanup backlog where EPA and the states can look for opportunities to address remaining releases. EPA needs to work with the states to ensure the risks to human health and the environment from high priority releases still in the beginning stages of cleanup are addressed as quickly as possible. EPA believes that progress toward closure should continue in these areas for all cleanups:
• Continue efforts to address high risk releases.
• Use enforcement actions to initiate the cleanup of stalled high priority releases, where appropriate.
• Identify funding sources to address low priority releases, for example public-private partnerships or petroleum brownfields grants.
• Conduct removal actions (including source removal) to the extent possible during assessment activities in order to prevent soil contamination from remaining in place due to a low priority score.
• Encourage or enforce (where appropriate) cleanup of low priority releases to ensure they do not remain in the backlog due to a low priority score.
• Ascertain priority status of releases listed as “unknown.”
ADDITIONAL ANALYSES
Remedia l Technologies
EPA was particularly interested in analyzing the types of remedial technologies employed at LUST cleanups and the average remedial time needed to achieve closure. Optimizing the remediation of LUST releases is a key to minimizing cleanup costs, reducing the time to closure, and ultimately reducing the backlog, regardless of the source of cleanup financing. Unfortunately, information was largely unavailable for this analysis.
Use of Natural Attenuat ion Remedies (4 States)
EPA analyzed the use of monitored natural attenuation (MNA) in the LUST program, anticipating that use of MNA or a variation of natural attenuation might impact the LUST cleanup backlog. MNA refers to the reliance on natural attenuation processes within the context of a carefully controlled and monitored cleanup approach to achieve site-specific remediation objectives. Long-term performance monitoring is a fundamental component of a MNA remedy. EPA guidance states that MNA is an appropriate remediation method only where its use will be protective of human health and the environment and it will be capable of achieving site-specific remediation objectives within a timeframe that is reasonable compared to other alternatives.48
As with other remedial technologies, there were limited data available for this analysis. New Hampshire, Michigan, South Carolina, and Texas tracked the use of MNA in their databases, although their use of the term MNA covers more than EPA’s defined MNA approach. Some states, particularly New Hampshire and Texas, use passive remediation instead of formal MNA in cases where there is no immediate risk to human health or the environment. For these types of releases, New Hampshire addresses the source and then monitors the release until it meets the state’s groundwater standard.49 Although the use of natural attenuation without meeting formal MNA requirements certainly reduces remedial costs, this method might not result in closure within a comparable timeframe to more active technologies. The advantage for the states is that limited resources are re-directed toward higher priority releases once a state program has conducted limited sampling to ensure the contamination is not moving off site. For the purposes of this discussion, the use of the term MNA refers to a formal, monitored natural attenuation remedy while
48 For more information regarding the appropriate use of MNA, see www.epa.gov/swerust1/pubs/tums.htm and EPA Directive Number 9200.4-17P, Use of Monitored Natural Attenuation at Superfund, RCRA Corrective Action, and Underground Storage Tank Sites, available online at: www.epa.gov/oust/directiv/d9200417.htm.
49 See the New Hampshire state chapter for more information.

The NaTioNal lUST CleaNUp BaCklog: a STUdy of opporTUNiTieS
32 September 2011
passive remediation refers to a less formal natural attenuation remedy where some monitoring might or might not be in use. The less formal natural attenuation remedy implies that a prescriptive process for monitoring the effectiveness of the remedy is not applied.
The databases from the four states showed that the percentage of releases in the Remediation stage using either MNA or passive remediation ranged from approximately 13 percent in Michigan to 75 percent in New Hampshire (Figure 43 below). Michigan’s percentage is potentially a high estimate because, with the available data, EPA could not distinguish releases with a final remedy selected from those that were still in the remedy selection process. New Hampshire personnel recently commented that the 75 percent of releases identified in the Remediation stage includes two different categories of remediation; in 44 percent the groundwater is being monitored long term (passive remediation) and the remaining 31 percent are lower priority releases that have had some initial source control activities and have infrequent groundwater monitoring while waiting for additional funding to begin the necessary remedial activities for closure. EPA acknowledges that states must balance resources and state priorities. New Hampshire once used a more formal MNA process until it made a strategic decision to use monitoring funds to address additional higher priority releases. In contrast, South Carolina uses MNA frequently. In fact, the South Carolina data included here only cover the releases addressed strictly using MNA. At the time of data collection, South Carolina had closed 10 percent of its releases using
MNA as the selected remediation remedy. South Carolina closes many more releases using MNA after initially remediating releases with other active technologies. South Carolina stages releases using MNA as a remediation remedy by evaluating them for an 18-month period after which a release either continues in MNA or might be placed into active remediation.50
Based on the state databases, nearly half of the releases (47 percent) in MNA/passive remediation were 15 years old or older (Figure 44 below). Available data from most states did not indicate when remediation began; therefore, the duration of MNA/passive remediation as a chosen remedy cannot be calculated. The age of the release does not necessarily correspond to the length of time in MNA/passive remediation. Given the age distribution of the backlog in these four states, it is likely the states chose MNA/passive remediation as the remedy for some of these releases recently even though almost half were 15 years old or older. Due to the length of time required for a release to naturally attenuate, closure of these releases will not likely be achieved in the near future.
50 See individual state chapters for more information on use of MNA.
Figure 43. Use of MNA/Passive Remediation vs. Active Remediation at LUST Releases in the Remediation Stage, by State
MI6,174
7825,392
13%
87%
SC619206413
33%
67%
TX1,200
712488
59%
41%
NH613459154
75%
25%
MNA/Passive Remediation Used
Ac ve Remediation Used
State:Total Number of Releases:
Number of Releases Using Passive Remediation:Number of Releases Using Active Remediation:
0
100
Perc
enta
ge
MI6,174
7825,392
13%
87%
SC619206413
33%
67%
TX1,200
712488
59%
41%
NH613459154
75%
25%
MNA/Passive Remediation Used
Ac ve Remediation Used
State:Total Number of Releases:
Number of Releases Using Passive Remediation:Number of Releases Using Active Remediation:
0
100
Perc
enta
ge
Figure 44. Age Distribution of LUST Releases Undergoing MNA/Passive Remediation, by State
Perc
enta
ge o
f Sta
tes’
Re
med
iaon
Sta
ge R
elea
ses
0 - 4.9
5 - 9.9
10 - 14.9
15 - 19.9
20 +
Release Age in Years50
40
30
20
10
0MI
(782 releases) NH
(459 releases) SC
(206 releases) TX
(712 releases)
Release Age by State
Perc
enta
ge o
f Sta
tes’
Re
med
iaon
Sta
ge R
elea
ses
0 - 4.9
5 - 9.9
10 - 14.9
15 - 19.9
20 +
Release Age in Years50
40
30
20
10
0MI
(782 releases) NH
(459 releases) SC
(206 releases) TX
(712 releases)
Release Age by State
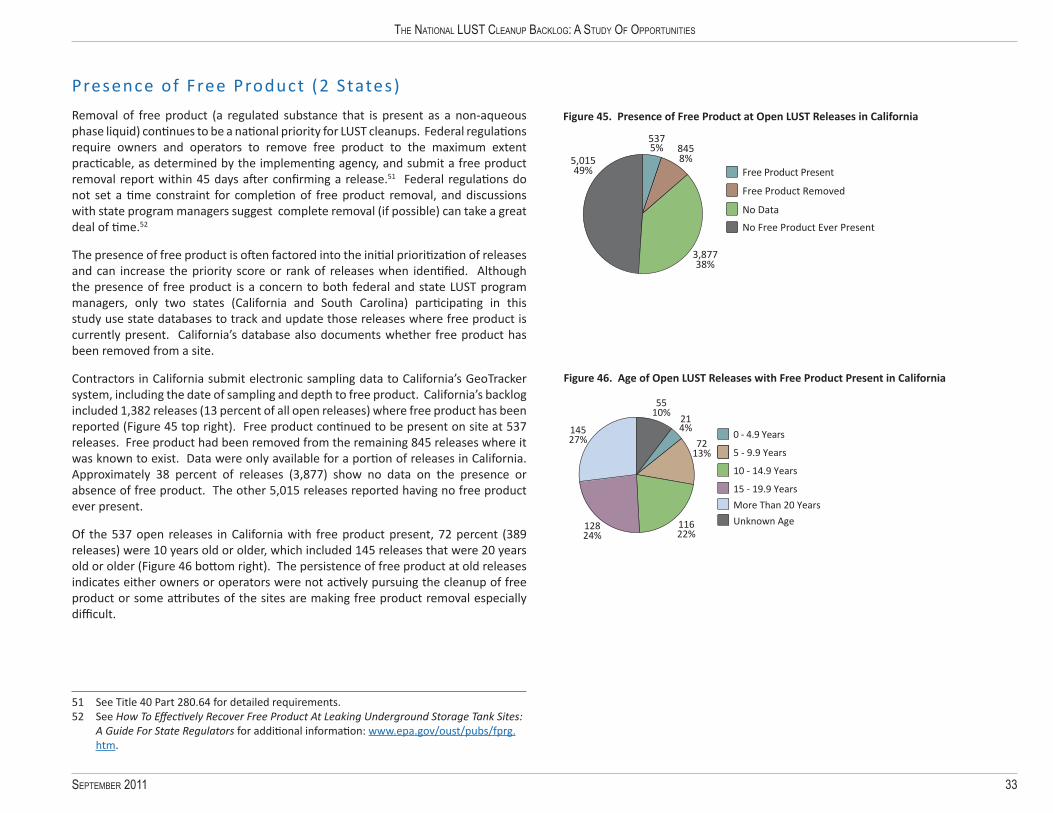
The NaTioNal lUST CleaNUp BaCklog: a STUdy of opporTUNiTieS
SepTemBer 2011 33
Presence of Free Product (2 States)
Removal of free product (a regulated substance that is present as a non-aqueous phase liquid) continues to be a national priority for LUST cleanups. Federal regulations require owners and operators to remove free product to the maximum extent practicable, as determined by the implementing agency, and submit a free product removal report within 45 days after confirming a release.51 Federal regulations do not set a time constraint for completion of free product removal, and discussions with state program managers suggest complete removal (if possible) can take a great deal of time.52
The presence of free product is often factored into the initial prioritization of releases and can increase the priority score or rank of releases when identified. Although the presence of free product is a concern to both federal and state LUST program managers, only two states (California and South Carolina) participating in this study use state databases to track and update those releases where free product is currently present. California’s database also documents whether free product has been removed from a site.
Contractors in California submit electronic sampling data to California’s GeoTracker system, including the date of sampling and depth to free product. California’s backlog included 1,382 releases (13 percent of all open releases) where free product has been reported (Figure 45 top right). Free product continued to be present on site at 537 releases. Free product had been removed from the remaining 845 releases where it was known to exist. Data were only available for a portion of releases in California. Approximately 38 percent of releases (3,877) show no data on the presence or absence of free product. The other 5,015 releases reported having no free product ever present.
Of the 537 open releases in California with free product present, 72 percent (389 releases) were 10 years old or older, which included 145 releases that were 20 years old or older (Figure 46 bottom right). The persistence of free product at old releases indicates either owners or operators were not actively pursuing the cleanup of free product or some attributes of the sites are making free product removal especially difficult.
51 See Title 40 Part 280.64 for detailed requirements. 52 See How To Effectively Recover Free Product At Leaking Underground Storage Tank Sites:
A Guide For State Regulators for additional information: www.epa.gov/oust/pubs/fprg.htm.
No Free Product Ever Present
Free Product Present
Free Product Removed
No Data
8458%
5375%
3,87738%
5,01549%
Figure 45. Presence of Free Product at Open LUST Releases in California
0 - 4.9 Years
5 - 9.9 Years
10 - 14.9 Years
15 - 19.9 Years
More Than 20 Years
Unknown Age
7213%
214%
5510%
14527%
11622%
12824%
Figure 46. Age of Open LUST Releases with Free Product Present in California

The NaTioNal lUST CleaNUp BaCklog: a STUdy of opporTUNiTieS
34 September 2011
South Carolina uses its database to track the current depth of free product at each release. The state incorporates this information into its risk ranking system.53 Of the 2,942 releases in the South Carolina backlog, the priority codes indicate that, at the time the data were provided to EPA, free product was present at 18 percent of releases (535 releases; Figure 47 to the right). According to the data, 45 percent of the releases with free product are in Class 1E and 2BA (248 releases), with the majority in Class 2BA (240 releases). The definition of a Class 2BA release is that free product is thicker than 1 foot. High priority releases are those determined to pose an emergency or significant near-term threat (RBCA Class 1 and 2). South Carolina addresses releases based on priority and had started site assessment or remediation at all Class 1 and almost every Class 2 release.54 Of the 535 open releases in South Carolina with free product present, 82 percent (438 releases) were 10 years old or older (Figure 48 below). Many of the older releases in South Carolina date back to the state’s amnesty program. These remaining releases should be addressed using South Carolina’s additional funding.55
States should continue to encourage the removal of free product to the extent practicable. States might also consider whether enforcement actions at old releases with persistent free product might
53 South Carolina prioritizes categories based on the current and projected degree of risk to human health and the environment. The presence and depth of free product are factors within the ranking system. South Carolina considers releases with free product on surface water (Class 1 risk rank) and releases with free product greater than 1 foot (Class 2 risk rank) to be high priority.
54 In some cases Class 2 releases were listed as inactive.55 For more information, see the South Carolina state chapter.
be appropriate to help ensure the recovery of free product contamination and move cleanups toward closure.
Use of Enforcement Act ions (2 States)
Federal regulation requires RPs to clean up releases regardless of whether state funding is available. Enforcement actions can be a useful tool to compel recalcitrant RPs to proceed with cleanups and ensure this federal regulation is met. For the purposes of this report, recalcitrance was based on the state’s definition and designation in its database. In cases where an RP is recalcitrant, a cleanup might remain unaddressed until the RP is located and compelled to perform the cleanup. However, a state might not enforce this requirement either due to a lack of resources to issue orders or because the state’s priority-based regulations require the focus to be on the highest risk sites. Several states informed EPA they do not enforce all cleanups because their state cleanup funds are insufficient to reimburse the associated claims. In fact, to manage the amount of claims filed, some states restrict RPs from conducting a cleanup until the state agency directs them to do so. This issue is specific to state-funded cleanups and, therefore, should not prohibit the enforcement of RP-financed cleanups, except in cases where resources for state oversight is also an issue. In addition to the backlog reduction effort, EPA is working with states to improve fund soundness so state funds can meet their financial obligations.
Only two states in this study, New Jersey and Texas, tracked whether an RP is recalcitrant in state databases.56 Recalcitrant RPs were responsible for 27 percent of the New Jersey backlog and 16 percent of the Texas backlog (Figure 49 below). However, according to the Texas data, the state used enforcement actions at only 42 open releases and 195 closed releases. Although other participating states do not track recalcitrance or use of enforcement, several states reported the
56 Texas program staff considers an RP recalcitrant if a release is at least 1.5 years old and no correspondence has been received from the RP for 15 months. New Jersey program staff considers an RP recalcitrant if a report is overdue.
Figure 47. Presence of Free Product at Open LUST Releases in South Carolina, by Stage of Cleanup
8
1%
240
45%277
52%
10
2%
1E - Free Product on Surface Water
2BA - Free Product > 1 Foot
3BA - Free Product > 0.01 Foot
4BA - Free Product Sheen in Well8
1%
240
45%277
52%
10
2%
1E - Free Product on Surface Water
2BA - Free Product > 1 Foot
3BA - Free Product > 0.01 Foot
4BA - Free Product Sheen in Well
26349%
255%
418%
5510%
15128%
0 - 4.9 Years
5 - 9.9 Years
10 - 14.9 Years
15 - 19.9 Years
More Than 20 Years
Figure 48. Age of Open LUST Releases with Free Product Present in South Carolina
Figure 49. Recalcitrance of RPs of Open LUST Releases in New Jersey and Texas
1,612 27%
Recalcitrant4,268
Not Recalcitrant
73%
Recalcitrant47616%
Not Recalcitrant2,49284%
NJ TX
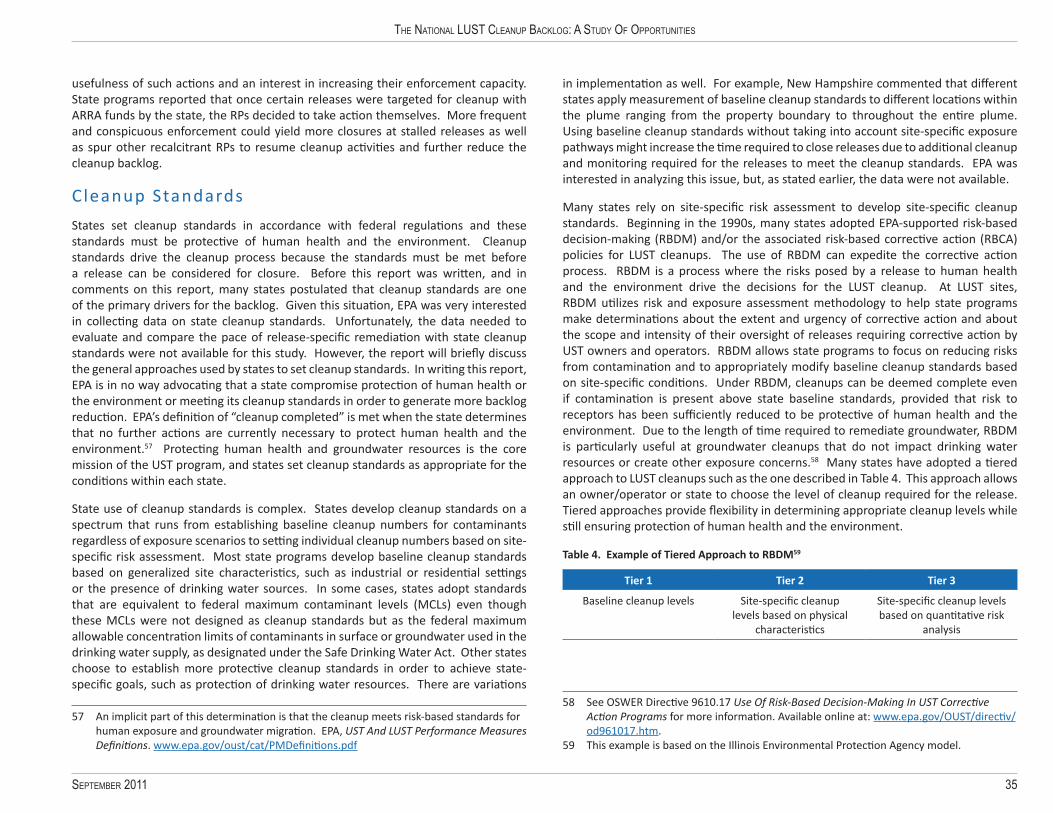
The NaTioNal lUST CleaNUp BaCklog: a STUdy of opporTUNiTieS
SepTemBer 2011 35
usefulness of such actions and an interest in increasing their enforcement capacity. State programs reported that once certain releases were targeted for cleanup with ARRA funds by the state, the RPs decided to take action themselves. More frequent and conspicuous enforcement could yield more closures at stalled releases as well as spur other recalcitrant RPs to resume cleanup activities and further reduce the cleanup backlog.
C leanup Standards
States set cleanup standards in accordance with federal regulations and these standards must be protective of human health and the environment. Cleanup standards drive the cleanup process because the standards must be met before a release can be considered for closure. Before this report was written, and in comments on this report, many states postulated that cleanup standards are one of the primary drivers for the backlog. Given this situation, EPA was very interested in collecting data on state cleanup standards. Unfortunately, the data needed to evaluate and compare the pace of release-specific remediation with state cleanup standards were not available for this study. However, the report will briefly discuss the general approaches used by states to set cleanup standards. In writing this report, EPA is in no way advocating that a state compromise protection of human health or the environment or meeting its cleanup standards in order to generate more backlog reduction. EPA’s definition of “cleanup completed” is met when the state determines that no further actions are currently necessary to protect human health and the environment.57 Protecting human health and groundwater resources is the core mission of the UST program, and states set cleanup standards as appropriate for the conditions within each state.
State use of cleanup standards is complex. States develop cleanup standards on a spectrum that runs from establishing baseline cleanup numbers for contaminants regardless of exposure scenarios to setting individual cleanup numbers based on site-specific risk assessment. Most state programs develop baseline cleanup standards based on generalized site characteristics, such as industrial or residential settings or the presence of drinking water sources. In some cases, states adopt standards that are equivalent to federal maximum contaminant levels (MCLs) even though these MCLs were not designed as cleanup standards but as the federal maximum allowable concentration limits of contaminants in surface or groundwater used in the drinking water supply, as designated under the Safe Drinking Water Act. Other states choose to establish more protective cleanup standards in order to achieve state-specific goals, such as protection of drinking water resources. There are variations
57 An implicit part of this determination is that the cleanup meets risk-based standards for human exposure and groundwater migration. EPA, UST And LUST Performance Measures Definitions. www.epa.gov/oust/cat/PMDefinitions.pdf
in implementation as well. For example, New Hampshire commented that different states apply measurement of baseline cleanup standards to different locations within the plume ranging from the property boundary to throughout the entire plume. Using baseline cleanup standards without taking into account site-specific exposure pathways might increase the time required to close releases due to additional cleanup and monitoring required for the releases to meet the cleanup standards. EPA was interested in analyzing this issue, but, as stated earlier, the data were not available.
Many states rely on site-specific risk assessment to develop site-specific cleanup standards. Beginning in the 1990s, many states adopted EPA-supported risk-based decision-making (RBDM) and/or the associated risk-based corrective action (RBCA) policies for LUST cleanups. The use of RBDM can expedite the corrective action process. RBDM is a process where the risks posed by a release to human health and the environment drive the decisions for the LUST cleanup. At LUST sites, RBDM utilizes risk and exposure assessment methodology to help state programs make determinations about the extent and urgency of corrective action and about the scope and intensity of their oversight of releases requiring corrective action by UST owners and operators. RBDM allows state programs to focus on reducing risks from contamination and to appropriately modify baseline cleanup standards based on site-specific conditions. Under RBDM, cleanups can be deemed complete even if contamination is present above state baseline standards, provided that risk to receptors has been sufficiently reduced to be protective of human health and the environment. Due to the length of time required to remediate groundwater, RBDM is particularly useful at groundwater cleanups that do not impact drinking water resources or create other exposure concerns.58 Many states have adopted a tiered approach to LUST cleanups such as the one described in Table 4. This approach allows an owner/operator or state to choose the level of cleanup required for the release. Tiered approaches provide flexibility in determining appropriate cleanup levels while still ensuring protection of human health and the environment.
Table 4. Example of Tiered Approach to RBDM59
Tier 1 Tier 2 Tier 3
Baseline cleanup levels Site-specific cleanup levels based on physical
characteristics
Site-specific cleanup levels based on quantitative risk
analysis
58 See OSWER Directive 9610.17 Use Of Risk-Based Decision-Making In UST Corrective Action Programs for more information. Available online at: www.epa.gov/OUST/directiv/od961017.htm.
59 This example is based on the Illinois Environmental Protection Agency model.
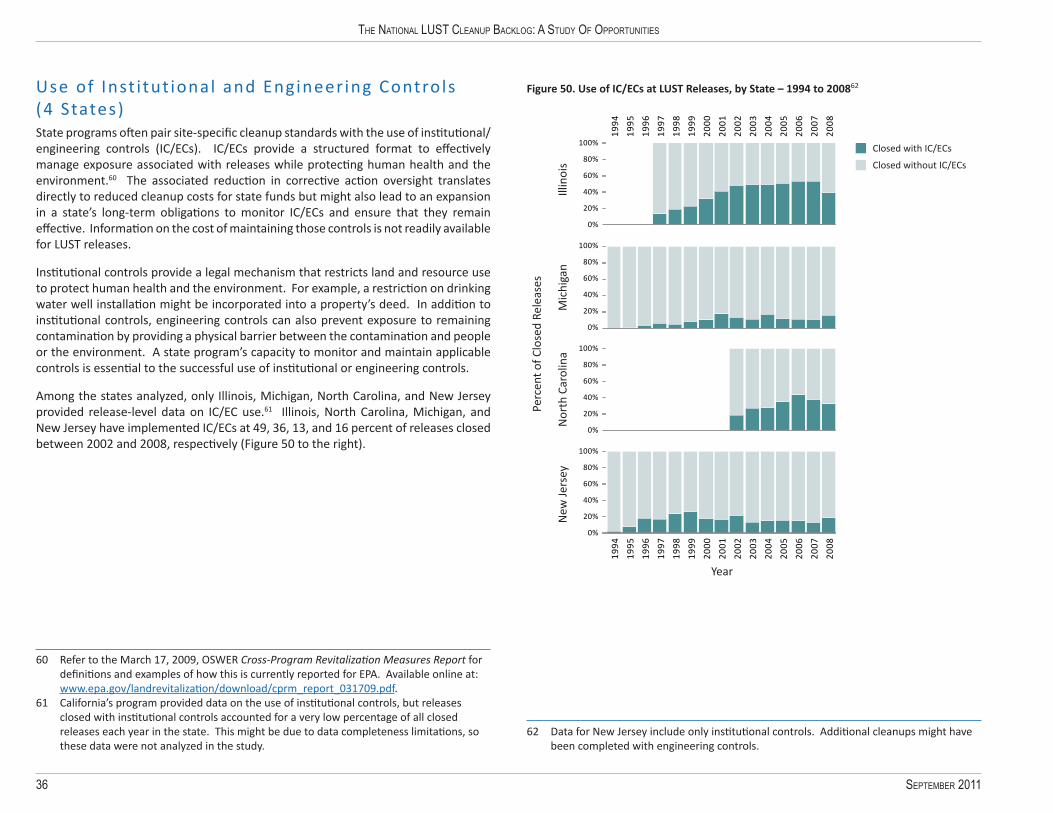
The NaTioNal lUST CleaNUp BaCklog: a STUdy of opporTUNiTieS
36 September 2011
Use of Inst i tut ional and Engineer ing Controls (4 States)State programs often pair site-specific cleanup standards with the use of institutional/engineering controls (IC/ECs). IC/ECs provide a structured format to effectively manage exposure associated with releases while protecting human health and the environment.60 The associated reduction in corrective action oversight translates directly to reduced cleanup costs for state funds but might also lead to an expansion in a state’s long-term obligations to monitor IC/ECs and ensure that they remain effective. Information on the cost of maintaining those controls is not readily available for LUST releases.
Institutional controls provide a legal mechanism that restricts land and resource use to protect human health and the environment. For example, a restriction on drinking water well installation might be incorporated into a property’s deed. In addition to institutional controls, engineering controls can also prevent exposure to remaining contamination by providing a physical barrier between the contamination and people or the environment. A state program’s capacity to monitor and maintain applicable controls is essential to the successful use of institutional or engineering controls.
Among the states analyzed, only Illinois, Michigan, North Carolina, and New Jersey provided release-level data on IC/EC use.61 Illinois, North Carolina, Michigan, and New Jersey have implemented IC/ECs at 49, 36, 13, and 16 percent of releases closed between 2002 and 2008, respectively (Figure 50 to the right).
60 Refer to the March 17, 2009, OSWER Cross-Program Revitalization Measures Report for definitions and examples of how this is currently reported for EPA. Available online at: www.epa.gov/landrevitalization/download/cprm_report_031709.pdf.
61 California’s program provided data on the use of institutional controls, but releases closed with institutional controls accounted for a very low percentage of all closed releases each year in the state. This might be due to data completeness limitations, so these data were not analyzed in the study.
Figure 50. Use of IC/ECs at LUST Releases, by State – 1994 to 200862
62 Data for New Jersey include only institutional controls. Additional cleanups might have been completed with engineering controls.
Year
0%
20%
40%
60%
80%
100%
1994
1995
1996
1997
1998
1999
2000
2001
2002
2003
2004
2005
2006
2007
2008
0%
20%
40%
60%
80%
100%
0%
20%
40%
60%
80%
100%
0%
20%
40%
60%
80%
100%
1994
1995
1996
1997
1998
1999
2000
2001
2002
2003
2004
2005
2006
2007
2008
Closed without IC/ECs
Closed with IC/ECs
Illin
ois
Mic
higa
nN
orth
Car
olin
aN
ew Je
rsey
Perc
ent o
f Clo
sed
Rele
ases

The NaTioNal lUST CleaNUp BaCklog: a STUdy of opporTUNiTieS
SepTemBer 2011 37
Mult i -S i te ApproachesOne goal of this study is to open and expand the dialogue on alternative ways to address the LUST cleanup backlog. Several states have implemented initiatives that might be well suited to other states. For example, some states have found success bundling sites into multi-site cleanup agreements under a single RP. Another initiative used by state programs identified multiple cleanup opportunities for releases in close geographic proximity. While a traditional multi-site agreement (MSA) might not work in this circumstance because different RPs are involved, state programs have successfully moved multiple cleanups forward by focusing their attention on area-wide planning and corridor work in a specific geographic area.
Releases per Responsib le/Aff i l iated Party (12 States)
Both the Phase 1 and Phase 2 analyses confirm that individual parties are potentially responsible for or affiliated with multiple releases within the backlog. The results indicate economies of scale might be achieved by developing multi-site cleanup approaches with parties responsible for or, potentially, those affiliated with large numbers of releases.
The Phase 1 study identified 10,000 releases in 15 states located at facilities associated with major oil companies or national and regional convenience stores. However, the data were drawn from the names of sites and facilities where releases occurred and did not necessarily indicate the party potentially responsible for the cleanup of each release. In the Phase 2 study, EPA looked at state data to identify PRPs of ten or more sites within each state to promote opportunities for strategic backlog reduction efforts with parties responsible for or affiliated with larger numbers of releases. It is important to note, however, that parties listed within the database might or might not be the liable RP; they might be affiliated parties (APs), such as the corporation associated with the franchise name. State-specific data identified individual parties associated with each release, and the state chapters document whether any specific individual party was associated with more than ten releases within each state (see individual state chapters for an analysis of the data from each of the 12 states).
Two states, Pennsylvania and Washington State, have entered into MSAs with major corporations to close significant numbers of releases. Pennsylvania’s Department of Environmental Protection (PA DEP) started using this approach in 2001. PA DEP entered into MSAs with BP Amoco and a joint MSA with Motiva Enterprises LLC, Jiffy Lube International, and the Pennzoil-Quaker State Company. Data were unavailable for the individual releases but were provided for the site-level cleanup status. The MSA with BP Amoco includes 234 sites, 130 of which (55 percent) have been closed. The MSA with Motiva includes 96 sites, 59 of which (61 percent) have been closed. The majority of the remaining sites in both MSAs are in the Remediation stage. PA DEP credits MSAs with accelerating cleanups.63 Washington State’s Department of Ecology began a MSA with Shell more recently in 2008 to address 86 releases in the next ten years. Shell benefits from the agreement by having dedicated state staff to ensure consistency in addressing the Shell releases covered under the MSA.
At the national level, EPA took a broader look at APs. EPA compiled state RP data for releases in 12 participating states and standardized entries to identify APs who were affiliated with releases in multiple states. EPA’s analysis identified 24 entities affiliated with 20 percent (9,608 releases) of the 46,895 open releases for which AP/RP data were available (Figure 51, page 38). Each of these parties was affiliated with 100 or more open releases, and all of the parties were private companies, with the exception of the U.S. Department of Defense (DOD). Again, it is important to note that these parties might or might not be
63 For more information on PA DEP’s MSAs, see: http://www.depweb.state.pa.us/portal/server.pt/community/waste_management/14069.
Multi-Site Approaches: Findings
• Individual potentially responsible parties (PRP) with multiple releases are found in every state.
• 56% of releases were located within one mile of five or more releases.
Data L imitat ionThe majority of records in the data provided by California’s program list a name of an individual contact person, so the state was excluded from the cross-state comparison of AP/RP data. For more information on RPs in California, see the California state chapter. RP data were not available for releases in Washington State. Of 59,537 open releases analyzed after the removal of California and Washington State releases, 21 percent (12,632 releases) of the AP/RP data fields were either blank or marked as “unknown.” The majority of the releases without AP/RP data are located in Florida and New Jersey. All releases with unknown AP/RPs were excluded from statistics presented in this study.

The NaTioNal lUST CleaNUp BaCklog: a STUdy of opporTUNiTieS
38 September 2011
the liable RP. However, they might have a vested interest in seeing releases cleaned up where the company or entity’s name is posted.
Figure 51. Number of LUST Releases with Single Party Affiliation, in 12 Participating States64
37,29780%
(26,816 parties)
9,60820%
(24 parties)
Fewer than 100
100 or more
Number of Open Releaseswith which a Single Party is Affiliated
Data analysis attributes the remaining 80 percent of releases to more than 26,000 parties. EPA might want to better understand the incentives or obstacles faced by tank owners who have very few releases or only one release. EPA can work with state programs to find out more about what these tank owners need to address their releases, and then EPA and the states can consider strategies to move these releases toward closure.
While private entities are affiliated with the majority of open releases, releases at local, state, and federal government facilities account for 10 percent (4,688 releases) of the 46,905 releases for which the type of RP could be determined (Figure 52 to the right). These releases include state departments of transportation, federal military facilities, and municipal facilities. Overall, local government entities are responsible for the majority of these releases. However, DOD alone is associated with 346 releases in the 12 states where RP data were available and is the largest federal government agency RP.66 North
64 The 12,632 releases without AP/RP data listed are not included in this graphic.65 The 12,632 releases without AP/RP data listed are not included in this graphic.66 As discussed in the data limitations section, this number does not include data from
California which has a substantial number of DOD facilities.
Carolina reported a successful collaboration with the North Carolina Department of Transportation (NC DOT) to address NC DOT releases along right-of-ways.67
While some states have effectively used MSAs, this approach might not be appropriate in every state, particularly in states with statutory mandates to address releases in order of priority ranking. Major corporations have also been divesting their service stations in many states in the past several years so there are fewer cases where large numbers of releases fall under the responsibility of one entity. Nevertheless, every state in the study with available AP/RP data showed multiple entities associated with ten or more releases (Table 5). States can consider whether MSAs would be a useful tool in starting work in cases where RPs have multiple releases in the early stages of cleanup or cleanups that have stalled.
Table 5. Affiliated or Potentially Responsible Parties with Ten or More Releases, by State68
State
Number of Affiliated/Potentially Responsible Parties with
Ten or More Releases
Percent of State’s Backlog
Number of Releases
California 88 19 1,967
Florida 101 22 3,546
Illinois 55 18 1,508
Michigan 69 18 1,676
Montana 12 20 243
Nebraska 7 6 99
New Jersey 17 34 1,430
New Hampshire 5 11 79
New York 12 11 264
North Carolina 31 11 707
Pennsylvania 21 35 1,069
South Carolina 32 23 689
Texas 27 20 584
67 For more information, see the North Carolina state chapter. 68 Data for Washington State were unavailable for this analysis.
Figure 52. Open LUST Releases in 12 States by Type of AP/RP65
42,217 90%
502 1%
860 2%
3,326 7%
Private
Federal government
State government
Local government
42,217 90%
502 1%
860 2%
3,326 7%
Private
Federal government
State government
Local government

The NaTioNal lUST CleaNUp BaCklog: a STUdy of opporTUNiTieS
SepTemBer 2011 39
Geographic C lusters (13 States)Another multi-site approach for states to consider is addressing releases based on geographic proximity. This approach does not rely on MSAs but instead approaches cleanup in specific, targeted areas. Geographic proximity can call attention to releases in areas of interest, such as those of redevelopment (e.g., enterprise zones), environmental justice, or ecological sensitivity. Highlighting geographic clusters of releases and working with state and local governments in an area-wide planning context and in corridor initiatives can facilitate remediation of multiple releases. Approaching the assessment and cleanup needs of an area impacted by LUSTs can be more effective than focusing on individual sites in isolation of the adjacent or surrounding areas. Analysis of the available data indicated clusters of releases, defined by releases located within one mile of five or more other releases, existed in all 14 states (Figure 53 above).
Several states in the backlog study already have area-wide planning efforts underway. These releases present opportunities to consolidate resources and address multiple releases. New Jersey, New York, and New Hampshire use area-wide planning approaches. New Jersey and New York created Brownfield Opportunity Areas to enhance revitalization of areas and communities affected by the presence of brownfields.69 The New Hampshire Department of Environmental Services (NH DES) provides an example for states in the context of funding area-wide planning efforts. The Department encouraged the state regional planning commissions to work with local governments to apply for petroleum brownfields assessment grants. Then NH DES secured a petroleum brownfields cleanup revolving loan fund grant to support cleanup and reuse of these low priority releases. NH DES estimated approximately
69 See New York Department of Environmental Conservation fact sheet: www.dec.ny.gov/chemical/8650.html.
10 percent of its LUST releases were addressed through this process.
States are also taking a corridor approach to cleanup. Releases in corridors are clustered primarily along interstates or main thoroughfares. Florida has a public-private revitalization effort along the 70-mile Tamiami Scenic Highway route that could involve as many as 100 releases (Figure 54 to the right).70 California has a multi-agency revitalization effort along I-710 that will result in the cleanup and reuse of LUST releases in this environmental justice area and will also focus on compliance and prevention measures at active facilities in the same corridor.
Considering geographically-clustered releases can pave the
70 See Florida Department of Environmental Protection fact sheet: www.eli.org/pdf/tamiamitrailfactsheet102709.pdf.
0%
100%
64%
36%
75%
25%
66%
34%
64%
36%
45%
55%
29%
71%
54%
46%
38%
62%
64%
36%
24%
76%
20%
80%
41%
59%
9%
91%
53%
47%
Perc
enta
ge o
f Ope
n Re
leas
es
NJ 4,268
NY2,458
CA 10,274
MT 1,189
NH 745
SC 2,942
WA 2,003
NE 1,771
NC 6,343
PA 3,084
MI 9,169
FL 16,121
TX 2,968
IL 8,479
State:Total Number of Releases:
5 +
< 5
Number of other open releases within a 1-mile radius of each open release
Figure 53. Percent of Open LUST Releases Located Within One Mile of Five or More Releases, by Participating State
!
!!
!!!!!!!
!!
!!!
!
!!!!!
!!!!
!!!
!
!!!
!
!
!!
!
!!!!!
!
!
!!
!!!
!!!!
!
!!!!
!!!!!!!!!!!
!!!
!!
!!!
!!!!!
!!
!!!
!!!!
!!!!
!
!!!!!
!
!
!!!!!!!!!!
!
!
!
!!
!!
!!!!!
!!!
!
!!
!
!
!
!!!
!!
!
!
!
!!!!!
!!
!
!!!!!
!!!
!!!!!!
!!!!!!
!
!!
!!!!
!!
!
!
!
!!!!!
!!
!
!
!
!!!!
!
!!!
!!!!!!
!
!!!
!!!
!
!
!
!
!!!
!
!
!
!!
!!
!
!!
!
!
!
!
!
!!!!!!
!!!!
!
!
!
!!!!!
!
!
!
!!
!
!!
!
!!
!
!
!!!!
!
!!
!!!!!!
!
!!!
!
!
!
!
!
!
!!
!!!
!
!!!!
!
!!!
!!!
!!!!
!!
!
!!!!!!
!
!!!!!!!
!
!!!!!!
!!!!!
!!!!
!!!
!
!
!!
!
!!
!
!
!
!
!
!
!!
!!
!!
!!!!
!
!!
!!!!
!!
!
!
!!
!
!
!
!
!!
!
!
!
!!!!
!!
!!!
!
!!!!
!!!
!
!!
!
!!
!
!!!!!
!!
!!!!!!!
!!!!!
!!
!!!
!
!!!!
!!
!!!
!
!
!!!!!!!!!
!!
!!!!!
!
!
!
!!!
!!!!!
!!
!
!!
!
!
!
!
!!!
!!
!!
!!!
!
!!!
!
!
!!
!
!
!
!!
!!!!!
!
!!
!!!
!!
!!!!
!
!
!
!
!
!!!!!!!!!!
!
!!!!
!
!!!!
!!!
!!!!
!!
!
!
!
!
!!!
!
!!!
!
!
!!!
!
!!
!
!
!
!!
!
!
!!
!
!!
!
!
!
!
!
!!!!
!!!!
!
!!
!
!
!!!!!
!!!!!
!!!
!
!
!!
!
!
!
!!
!!
!!!!
!
!!!!
!
!!
!!
!
!!
!
!
!
!
!!
!
!
!
!
!
!!
!
!
!!!
!!!!
!!!!
!!!!
!
!!
!!!
!
!!!
!!!!!
!
!!!!
!
!
!!!
!
!!!
!!
!!!
!
!!!!
!
!!
!
!
!!!
!
!!!!
!!
!!
!
!
!!!!!!!
!
!!
!
!
!!!!
!!
!!
!
!
!!!
!
!!!
!
!!!!!!
!
!!
!
!!
!
!!!!
!
!!!
!!
!!
!
!
!!!!
!!!
!
!
!!!
!
!
!
!!
!
!
!
!
!!!
!!
!
!
!
!
!
!
!!!!
!
!
!!!!!!
!
!!!
!!!!!
!
!!
!
!!!!!!!!!!
!
!!!
!
!
!
!
!!
!!
!!!!
!!!!
!
!!!
!!!!!!
!!!!
!!
!
!
!!
!
!!!
!
!!!
!!
!
!
!
!!!!!!
!!
!
!
!!!!
!
!
!
!
!!
!!!!!!
!!
!!
!
!
!!!
!!!!
!!!!
!
!
!!
!
!
!
!!!!!!!!!!!!
!!!!
!
!
!!
!!
!
!!!
!!
!
!
!
!
!!
!!!!!
!
!
!!
!
!!
!!!
!!!!!
!
!!
!!
!
!
!
!
!!
!!
!
!!
!
!
!!
!!!
!
!
!!
!
!!
!
!
!!!!!
!
!
!
!
!
!!!!
!
!
!
!
!
!
!
!
!
!!!
!
!
!
!
!
!
!!
!
!!
!!
!!!!
!
!!
!!!!!!
!!
!
!
!!!!!
!!
!!!!
!!!
!!
!!
!!!
!!
!!
!
!!!
!!
!
!
!
!!!!
!
!!!!!!!!
!
!!!
!!!!!
!
!
!!!
!
!!!
!!
!
!!
!!!
!
!
!
!!
!!
!
!
!
!
!!
!
!
!!!!!!!!!!!!!
!!!
!
!
!!
!!
!!!
!!
!
!!!
!!!
!!
!
!!
!!!!
!!!
!!!!!!!!
!
!!
!
!!!!!
!!
!
!!
!
!!
!!
!
!
!
!!!!!
!
!
!
!
!
!
!!
!
!
!
!
!
!!
!
!!!
!!!!
!
!
!!!
!!!
!
!!
!
!
!
!
!!
!
!
!
!!
!
!!
!
!!
!
!!!!!!!
!
!
!!
!
!!
!
!!!
!!!!
!!!
!
!!
!!!!
!!
!
!!!!!!!
!!
!
!!
!!!!!
!
!
!
!!
!
!!
!!
!!
!
!
!
!
!!
!
!
!
!!
!
!
!!!!
!!
!!
!!
!
!
!!!
!!
!!!!!
!!
!!!
!
!!!!!!!
!!!
!!
!
!
!
!
!!
!!!
!!!!!!
!
!!
!!
!
!!!!!!!!!
!
!!!!
!!
!!
!!!
!
!
!
!!!
!!!
!
!!!
!!!
!!!!!!
!!
!!
!
!!!
!
!!!!!
!
!!!
!
!
!
!
!
!!!
!!!!
!!
!
!!!!
!
!!!!
!!!!!!!!!
!
!
!!!
!
!
!
!!!!!!!!
!
!
!
!
!!!!!
!!
!
!
!
!
!
!!!
!!!
!
!
!
!!!!!!!!!
!
!!
!
!
!!!!
!
!!!!!!
!
!
!!!
!
!!!!!!!!!!
!
!!!!
!
!!!!!!!
!
!
!!
!!!!!!!
!!!!!!!
!
!!
!
!!
!
!
!!!
!
!!
!!!
!
!
!!
!!
!
!
!
!!
!
!
!
!!
!
!
!
!!
!!!
!!
!
!!!
!!
!
!!
!!!!
!!!
!
!
!
!
!
!
!
!!
!
!
!!
!!!
!
!!!!!!
!
!
!!!!!!
!
!
!!
!
!
!
!
!
!!!!!!!
!
!
!!!!!
!
!!
!
!
!
!!!!
!!!
!!
!
!
!!
!!
!
!
!!
!
!
!
!!!!
!
!!!
!!
!!!!
!!
!!!
!!!
!!!!!
!!
!
!!
!!
!!
!
!!
!!!!
!!!!!
!
!!
!
!!!
!
!!!!!
!!!
!
!!!
!!
!!
!
!!
!
!
!
!!
!
!!
!
!!!!!
!
!!!!!!!!
!
!
!
!!!!!!
!
!!!!!!!!
!!!!
!
!
!!!!
!
!
!
!!
!
!
!!
!
!
!
!
!
!!
!
!!
!!
!!!!
!
!!!
!
!
!!
!
!
!!!!
!
!!!!!!!!
!
!
!!
!!!!
!!
!!
!!
!
!!
!
!!!
!!
!
!!
!!!!
!!!
!
!!
!!
!
!!
!
!
!
!
!
!
!!!
!!
!!!
!
!
!!!!
!
!!
!
!!
!
!!!!!!
!
!!!!!
!
!!!!
!
!
!!!!!!
!!!!
!
!
!
!
!!!
!
!
!
!!!!!
!!!
!
!
!
!
!!
!
!!!!
!
!
!
!
!
!
!
!!
!!!
!
!!!!
!!
!
!!!
!
!!
!!
!
!!!
!!
!!!!
!
!!!!!
!!!
!!
!
!
!!!
!!!!!!
!
!
!
!
!
!
!
!
!!!!!!!!!!!
!
!!!
!
!
!
!
!
!
!
!!
!
!
!
!!
!!
!!
!
!!!
!
!!
!!
!
!!!
!!!!!!!
!
!
!
!
!
!!!
!
!!!!!!!!!!!!
!
!!!!
!!!!!!!!!!!!!!!!!!!!!!!!!!!!!!!!
!
!!!!!!!
!
!
!
!
!!!!!!!!!!!!!!!!!
!
!
!
!
!
!
!!!!!
!
!!
!
!!!
!!!!
!
!
!
!
!
!!!!!!
!
!
!!!
!
!!!
!!!
!!
!!
!!!!!!
!
!
!
!!
!
!
!
!!!
!
!
!!!!!!!!!!
!!!!!!
!
!!
!!!
!
!!
!!
!!!!!
!!
!
!
!
!!
!
!
!!
!
!
!!!
!
!
!
!!
!!!!
!
!
!!
!
!
!!!
!
!!!!
!
!!!!!
!
!!!!!!
!!
!!
!
!!!
!
!!!
!!!!!!!
!!!
!
!!
!
!!!!!
!
!
!
!
!
!!!!!
!!!
!!
!
!!
!
!!!!!!
!!
!!
!
!
!
!
!!!!
!
!!
!
!
!!!!
!
!!
!!!!!!
!!!
!!
!
!
!!
!
!!!!!!
!!!!!!!!!!
!
!!
!!
!!!!!
!!
!!
!
!
!
!
!
!
!
!
!
!!
!
!
!
!
!!
!!
!!
!
!!!!
!
!!!!
!
!!!
!
!
!!
!
!!
!!
!!!!!!!!
!
!!
!!!
!!!
!
!
!
!
!
!!!
!!
!!
!!!
!!!!!!!!!!!!!!!!
!
!!
!
!
!!!!
!
!
!!!!
!!
!
!!!!
!!!
!
!!
!!
!
!
!
!!!
!
!!
!
!!!
!
!
!
!
!
!
!!
!!!
!!
!
!!!
!
!
!!
!
!
!
!
!
!
!
!!
!!!
!!
!
!
!
!!!!!!!!!!!!!!!!!!
!
!!
!!!
!
!
!
!!!!!!!!!!
!
!!
!!!
!
!!
!
!
!!
!
!
!
!
!
!
!
!
!
!!!!
!!
!!
!!!
!!!
!
!!
!
!
!!!!!
!
!
!!!
!
!!!
!!
!!!!!!!!!!!!!!
!!!!!!!!
!
!!!!!
!!
!
!!
!!!!!
!
!!!!!!!!!!!
!
!
!
!
!!!!
!!
!
!!!!!
!
!
!!!
!!
!
!!!!
!
!
!
!
!
!!!!
!
!!
!!!
!!!!
!
!
!
!
!
!!!!
!
!!
!
!!!!!!
!!!!
!
!
!
!
!
!!!
!!
!
!!
!!!
!
!
!
!!!!!!!!!!!!
!
!
!!!
!
!
!
!!
!
!!!!
!
!
!
!!
!!!!!!!
!!!!
!
!
!
!
!
!!!!!!!!!!
!
!!!!
!
!!
!
!!!
!
!!
!!
!!
!!!
!!!!
!!!
!!
!!
!!!
!!!!!
!
!
!
!
!!!
!
!
!!!!
!
!
!!
!!
!
!
!!
!!!
!!
!
!!!!
!
!
!
!
!!!
!
!!
!
!
!!!
!
!
!
!
!
!
!
!
!!
!!
!!
!!
!
!!!
!
!!
!
!!!!
!
!
!
!
!
!!!
!
!
!!
!
!!!!!
!
!
!!!
!
!
!
!
!
!
!
!
!
!
!!
!!!!
!
!!
!
!!!!!
!
!!
!!
!
!
!!
!
!!
!
!
!
!
!
!
!
!
!
!
!
!!
!!
!
!!!!!!!!!
!
!!
!
!!!!
!!
!
!!!!!
!
!!
!
!!!
!!
!!!!
!!
!
!
!!!!!!
!
!
!!!
!
!
!
!
!!!
!
!
!
!
!
!!
!
!
!!!
!
!
!
!!
!!
!!
!!
!
!
!
!
!!
!
!!
!
!!
!!!!!!!
!
!
!
!!
!
!
!
!!!!!!!
!
!
!
!!!!!!!
!
!!!!
!
!!
!
!
!
!
!
!
!!!!!!
!
!
!!
!
!
!
!!!
!
!
!!!
!
!
!
!
!!
!
!
!
!!
!
!
!
!!
!!!
!!!!!!
!!
!
!
!
!
!!!!
!
!
!
!!
!
!!
!
!!!!!!!!!
!!!!
!!
!
!
!!
!
!
!!!
!!
!
!
!
!!!
!
!
!
!
!!
!
!
!
!!
!!
!!
!
!!
!
!!
!
!!!
!!
!
!
!
!!!
!!!!
!!
!
!
!!!
!
!!
!!!
!
!
!!
!
!
!!
!
!!
!!
!
!!
!
!!!!
!!
!
!
!
!
!
!!!!!!
!
!!
!
!!!!!
!!
!
!
!!
!!
!
!!!
!!
!!!!!!!
!
!
!!!
!!
!
!
!!
!!!!
!
!
!
!
!
!
!!
!
!!!!!!
!
!
!
!!
!
!
!
!!
!
!!
!
!
!
!
!!
!!!
!
!!
!!!
!!!!!!
!
!
!
!!!
!
!
!!!!!!!!!
!
!!!!!!!!!!!!!
!
!!!!!!!!!!!!!!!!!!
!!
!!
!
!
!
!!
!!
!!
!
!
!
!
!!!!!
!!
!!
!
!
!!
!!
!
!
!
!
!!!
!
!
!!!
!!!!!!!
!
!
!
!
!
!
!
!
!!
!
!!!!
!
!!
!
!
!
!
!!!!
!
!
!!!!!!!
!!
!
!
!
!
!
!!
!
!
!
!
!!
!!
!!
!
!
!
!
!
!!!!!
!
!!!!!!!!!!!!
!
!
!
!!
!!!!
!
!
!!!!
!
!
!!!!!
!
!
!
!
!!!!!!
!!!
!
!!!
!
!!!!
!
!!!!!
!
!!!!!!!!!
!
!!!
!
!!!!!!!!
!!
!!!!!
!
!!!
!
!
!
!!!!!!
!
!!
!
!!!!!!!!
!!!!!
!
!!!!!!
!!
!
!
!!!
!!
!!
!
!!!!
!
!
!
!
!!!!!
!!!!
!!!!!!
!!!
!
!!!!!!
!!
!!
!!!!!!!!!
!
!
!!!
!!
!!!
!
!
!
!
!!
!!
!
!!!!
!!
!
!!!
!
!
!!!
!!
!
!!!!!!!
!
!
!
!
!!!
!!
!
!!
!!
!
!!!
!!!!
!!
!
!!
!!!
!
!
!
!!
!
!!
!!!!
!
!!!!!!!!!!!
!
!!!
!!
!
!!!!!!!!!!!
!
!
!
!
!!!!!
!
!!!!!!
!
!!
!
!
!!!!!
!!
!
!!!!
!
!!!!!
!!!!!
!!!
!
!!
!
!!
!
!!
!!
!
!!!!!!!!!!
!
!!!
!
!
!
!
!
!
!!!!!!
!
!!!!!!!!!!!!!
!
!
!
!!!!!!!!!!!!!!!!!
!
!!!!!!!!!!!!!!!!!!!!!!!!!
!
!
!!
!!!!!!!
!
!
!!!
!!!!!!!!!
!!
!
!!!!!
!!!!
!!!
!!!!
!!
!
!
!!!
!
!!!!!!!!!
!
!!!!
!
!
!
!
!
!!
!
!
!!
!!!
!!!
!!!!!
!!!!
!!!
!
!!!!!!!!!!!!!!!
!
!!!!!!!!!!!!!!!!!
!
!!!!!
!!
!
!
!!
!!!!!
!
!!!!!!!!
!!
!!
!
!!
!
!!!
!
!
!
!!!!
!
!!
!!
!
!
!!
!!
!
!
!
!
!!!!
!
!!
!
!
!!!
!
!!!
!
!!!
!
!
!
!
!
!!
!
!!
!
!!!
!!!
!
!!!!!
!
!
!!
!
!
!!!
!
!!!
!
!!
!
!!
!!
!!
!!!
!
!
!!
!
!
!
!
!
!
!!
!
!!!!!
!!!
!!!
!
!
!
!
!!!!!!!!!!!
!
!
!!
!!!!!!!!!!!!!!!!!!!!!!!!
!
!!!!!!!!!!!!!!!!!!
!
!!!
!!
!!!!!
!!
!!!!!!!!!!!!!!!!
!!!!!!!!!!!!
!!
!
!!!!!!!
!
!
!!!!!!!!!
!
!!!
!!!
!
!!!
!
!
!!
!!!
!!!
!!
!!
!!!
!
!!!!!!!!!!!!
!
!!!!!!!!!!!!!!!!
!
!!!!!!
!!!
!
!!!!
!!!!!!!!!!!!!!!!!
!
!
!
!!!!!
!!
!
!
!!
!
!
!!!!!
!
!
!
!!
!!!!
!!
!
!!!
!
!
!!
!
!
!
!
!
!!
!!!
!!
!
!
!
!!!
!!!!!!
!
!
!!!!!!!
!
!
!
!
!!
!
!!
!
!!!!!!!
!!
!!
!!
!!!!!
!!
!!
!
!!!!!!
!
!!
!!
!
!
!
!!!
!!
!!!!!!!!!!!!
!
!!
!
!
!
!!
!!
!
!!
!
!!
!!!
!
!
!
!
!
!
!
!
!
!
!
!
!!
!
!
!
!
!
!
!
!
!
!!
!
!!!
!!
!
!
!!
!
!
!
!!!!!!!
!
!
!
!
!
!
!
!
!!!!
!
!
!
!
!
!!
!!!
!
!
!
!
!!
!
!
!!
!!!!!!!
!
!!!!!!
!
!
!!
!
!!!!!
!
!
!!
!!!!!!
!
!
!
!
!
!!!!
!!
!
!!
!
!!!!
!
!!
!
!!!
!
!!!!!!!!!!
!
!
!!!!
!!
!
!
!!!
!!!
!!!
!
!
!!!!
!
!!
!!!!
!
!!!!!!!!!
!
!!!
!!
!
!
!!!
!
!!
!
!
!!!!!
!!
!!!
!
!!!
!
!
!!
!
!
!
!!!!
!
!
!!
!!!!
!
!
!
!
!
!
!
!
!!
!
!
!
!!!!
!
!!!
!
!
!!!
!!!!
!
!!!!!
!
!!
!
!
!
!!
!!!
!
!
!
!
!!!!!!
!
!!!!!!!!
!
!!
!
!
!
!!!
!
!!!!!!!
!
!
!!
!!
!
!
!
!
!
!
!
!!
!
!!!!
!
!!
!!
!
!
!!!!
!
!!
!!!!!!!!!!!!!!!
!
!
!!
!
!!!
!
!!!
!
!!!
!
!
!!
!
!
!
!
!
!!
!!!
!!!
!
!
!
!!!!!
!!
!
!!
!!
!!
!!!!
!!
!
!!
!
!
!
!!
!
!!!
!
!
!!
!
!!!
!!
!
!
!
!!
!!
!
!!
!!!!!
!!
!!!!
!!!
!
!
!!!
!
!
!!
!
!
!!!!!!!
!!!
!
!
!!!!!!!!!!!!!!!!!!!!!!!
!
!!!
!
!
!
!!
!!
!
!
!
!
!
!!!
!
!
!!!!!!!
!
!!!
!
!!
!
!
!
!
!
!
!
!!
!!
!!!!!
!!!!
!
!
!!!!!
!
!
!
!
!!!!!!
!!
!
!
!!
!!
!
!!!!!
!
!!
!!
!
!
!
!!!
!!!!
!!
!!
!
!
!
!!
!
!
!!
!
!
!
!!
!
!!
!!!!
!
!
!
!
!!
!
!!
!
!
!
!!!
!
!
!
!
!
!
!!
!!
!!
!!!!!!!!!!
!!!
!!!!
!!
!
!
!!!!!!!!
!
!
!
!
!!!!!
!!!!!!!!!!!!!
!!
!!!!!!
!!
!!!
!!
!
!
!
!!!
!
!!!!!!
!!!!
!!!!!!!!!!!
!
!!!!!!!
!
!
!!!
!!!!
!
!!!!!!
!
!!!
!!!!!
!!!!!!!!!!!!!!!
!
!!
!
!
!
!!!!!!!!!
!
!
!!!!
!
!!!!
!
!!
!
!!
!
!
!!
!
!
!!!!!!!!
!
!!!!!
!
!!!!
!
!!!
!
!!!!!!
!
!!!!
!
!
!
!
!
!!!!!
!!
!!!
!
!!!
!
!!!
!
!!
!
!!!!!!
!
!
!
!
!
!
!
!!!
!
!
!
!
!!!!!
!
!
!!!
!!!!!!!
!
!!!!!
!
!!
!
!!
!!
!!!!!!!!!!!!
!
!!!!!!!!!!!!!!!!!!!!!
!
!!!!!!!!!!!!!!!!!!!
!
!!!!!
!
!
!
!!!!!!!!!
!
!!!!!
!
!
!!!!!!!
!
!
!
!!
!
!!!!!
!
!!
!
!!!
!
!
!
!
!!
!!!
!
!
!
!!!
!!!
!!!
!!!!!!!!!!!!!!
!
!!!!
!!!
!
!
!
!!
!!!!
!
!
!
!!!!!
!!
!!
!
!
!
!!!
!!!!!
!!
!
!!!!
!
!
!
!
!
!
!
!
!!
!!
!
!!
!
!
!
!
!
!!!
!
!!
!
!!
!!!!!!
!!
!
!
!!
!!
!!
!!!
!
!
!!
!!
!
!!!
!!
!!
!!!!!
!
!!!
!
!!
!!!!
!!
!!
!
!!
!!!!!!!
!
!
!!!
!
!
!
!
!
!!!!!
!
!!!
!
!
!!
!!!
!
!
!!!!
!
!!!!
!
!
!!
!!!
!
!
!!
!!
!
!!
!
!!
!!
!!!!!
!!
!
!!!
!!!
!
!!!!!
!!!!
!
!!
!
!
!
!!!!!!
!
!!!!!
!
!!!!
!
!!!
!!
!
!
!!
!
!
!!!
!
!
!!!!!!!
!!
!
!
!!
!
!
!
!
!
!
!!!!
!
!!
!!
!
!
!
!
!
!
!!!
!!
!
!
!
!!!
!
!!
!
!
!!!
!
!
!
!!
!!
!!!
!
!
!
!
!!!
!
!
!
!!
!
!
!
!!
!!
!!
!
!
!
!!!!!
!
!!
!!
!
!
!
!
!
!!!!
!
!
!!
!
!!
!
!
!!!
!
!
!
!
!!!
!
!
!
!
!
!
!
!
!
!
!!
!
!
!!!
!
!
!!!
!!!
!
!
!!
!!!!!!!!!
!
!
!!
!!!!
!!!
!!
!!
!!
!
!!
!
!!
!
!
!
!
!!!
!
!
!
!
!
!
!!
!
!!!!!
!!
!!!
!!!
!
!!
!!
!
!!
!!!
!
!!
!
!!!!
!!
!
!
!
!
!
!
!
!!!!
!
!
!!
!
!
!
!!
!!
!
!!!
!
!
!
!
!!!
!
!
!
!!!!!
!
!
!!
!
!
!
!
!
!
!
!
!
!!
!
!
!
!
!
!
!!!!!!!
!
!
!!!!!
!!!!
!
!!!
!
!
!!!!!!
!
!
!!
!
!
!
!!!
!
!!
!
!
!
!
!
!!!
!
!
!
!!
!
!
!!!
!
!
!
!!!!!!
!
!
!!
!!!!!!
!
!
!!
!
!!
!
!
!
!
!!
!
!
!
!!!!
!
!
!
!!!
!!
!
!
!
!
!!
!
!!
!
!
!
!
!
!
!!
!
!!
!!
!!
!!
!!
!
!!
!
!
!
!!
!
!!
!!
!!
!
!
!!!
!
!
!!!
!!!!!
!
!!
!!
!!!!!!
!!!!!!!
!
!
!
!!
!
!
!
!
!
!
!
!!
!!
!!!
!
!
!
!
!
!
!
!
!
!
!!
!!!
!!
!!
!
!
!
!
!!
!
!
!!
!!!!
!
!
!!!!!
!
!!
!
!
!
!
!
!
!!
!!
!!
!!
!!!
!!
!!!
!
!!!
!!
!
!
!!
!
!!
!
!
!
!!
!
!!
!
!!
!!!!!
!
!!!
!
!
!
!
!
!!
!
!
!
!
!
!
!
!!!!!!
!
!
!
!
!
!
!
!
!
!
!
!
!
!!!
!!!!!
!!!
!!!!!
!
!
!
!!!!!
!
!
!!
!
!!
!!!
!
!
!
!!
!!!!!
!!
!
!
!!!!
!
!!!
!
!!
!
!!
!
!!!!!!!
!
!!!!
!!
!!!!!!
!!!!!
!
!!!!
!
!!!
!
!
!
!!
!
!!
!!!!!
!!!!!!!!
!
!
!
!
!!
!
!
!
!
!!
!
!
!!
!!!!!!!!!
!!!!!
!
!!
!
!
!
!
!
!
!!!!!!
!!
!!!!!!!!!!!
!!
!!!
!
!
!
!
!
!
!
!!
!
!!!
!
!!!
!
!
!
!
!!!
!
!
!!!!!!!!
!
!!!
!
!!!
!!!!!!!!!
!
!
!
!
!!
!
!!!!!
!
!!
!
!!
!!!
!!!!!
!!!!
!
!
!
!!
!
!
!
!
!!
!
!
!!
!
!
!
!
!
!
!
!
!!
!!!!
!
!
!
!!!
!
!
!
!!!
!
!!
!!!!
!
!!!!
!!
!!!!
!
!!!!
!
!
!
!
!
!
!
!
!
!
!
!
!!!!
!
!
!
!!
!
!
!!
!
!!!!
!
!!
!
!!!!!!
!
!
!!
!
!!
!
!
!!
!
!
!!!!!
!!
!
!
!!
!
!!
!
!!!
!
!!!
!
!!
!
!!!!!!!!!
!
!!!!!!!
!
!!!!!
!!!
!!
!
!!
!
!!
!!
!!!
!!
!!
!
!!
!
!!
!
!
!
!!!
!
!
!!
!
!
!
!!!!!!!
!
!
!!!
!
!!
!!
!
!!!!!!
!
!
!
!
!!!
!!!
!
!
!
!!
!
!
!
!
!
!!!
!
!!!!
!
!
!
!!
!
!!
!!!
!
!
!!
!
!
!
!
!
!
!
!
!
!!
!
!!!!!!!!!!!!!!!
!
!!!
!
!!
!
!
!
!
!
!
!!!
!!
!!!
!
!
!!!!
!
!
!!!!!
!
!
!!!!!!!!!!!!!!
!!
!!
!
!
!!!
!
!!!!!
!
!
!
!!!
!
!
!
!!
!
!
!
!!
!
!!!!
!
!!!
!
!
!
!
!!
!!
!
!
!!
!
!
!!
!!
!
!
!!
!
!
!!
!!!!!
!
!
!!
!!!!!!!
!
!
!
!!
!
!
!
!!!!!!
!
!!
!
!
!!
!
!!!!
!
!
!!!!!!!!!!
!
!!
!
!!
!!!!!!!!!!!!!!!
!!!!
!
!!!
!!
!
!!
!
!
!
!
!!
!!!
!!
!!!!!!!
!
!!!!!!!
!
!!!!
!
!
!
!!!
!!!!!
!
!!!!!!
!!!!!
!
!
!!
!
!!!!!!
!!
!!!!!!!!!
!
!!!!!
!
!!
!
!!!!
!
!!!!!!!!
!
!
!
!
!
!!
!
!
!
!
!!!
!!!!!
!
!
!!!!!!
!
!!
!
!!
!
!
!!
!
!!
!
!
!
!!!
!
!
!
!
!
!!!!
!
!
!!
!
!!
!
!
!!
!
!!!!!
!
!!!!!!
!
!
!
!
!
!!
!
!
!
!
!
!
!
!
!!
!!!!!
!
!!!!
!!!
!!
!
!!!
!
!!!!!!
!
!!!
!
!!!!!!
!
!
!!!!!!
!!
!!!
!
!!!
!
!!
!
!!
!
!
!
!!
!
!!!!!!
!
!!!!
!
!
!!!!!!
!!
!
!
!
!!!!
!
!
!
!
!
!!
!
!!!
!
!
!!
!!
!
!
!!
!
!
!
!!!
!
!!
!
!!!!!
!!!!
!!!
!
!!
!!!
!!!!
!
!
!
!!
!
!!!
!!
!!
!!
!!
!
!
!
!!
!!!!
!
!!
!
!
!!!!!!!!!!!
!!!
!
!
!!
!
!
!
!
!!
!
!
!
!
!!!
!
!
!
!
!!!!!!
!
!
!!!
!
!
!!!!!!!
!!!!
!
!
!
!!!
!!
!
!!
!!!
!
!
!
!
!
!
!
!
!!
!
!!!
!
!
!!
!
!
!
!
!
!
!
!
!!
!
!
!
!
!
!
!
!
!
!
!
!
!!
!
!
!
!
!
!!
!
!
!
!
!
!
!
!!!!
!
!
!!
!!
!!
!
!
!!!
!
!!!
!
!!
!!
!
!
!!!
!
!!
!!
!
!
!
!!!!!!!
!
!
!
!
!!!
!
!
!!
!!
!
!
!
!
!
!
!
!
!
!
!!!!!!!!
!!
!!!
!
!!
!
!
!!
!
!!!!
!
!!
!
!!!
!
!!
!
!!!
!
!!!!
!!
!
!
!!!
!
!
!
!!
!!
!!
!!!
!
!!
!
!
!!!
!
!
!
!
!
!
!
!
!!
!
!
!!
!
!
!!
!!
!
!
!
!
!
!!
!!!
!
!!
!!
!
!
!!!!!!!
!
!!!!!
!
!!
!
!
!
!
!
!!!!
!!
!
!
!
!
!
!!
!
!
!!!!
!!!
!
!
!!
!
!
!
!
!
!!
!!
!
!
!
!!
!!!
!
!
!
!
!
!!
!
!!!!
!
!!
!
!
!
!
!
!
!
!!
!
!
!
!
!!
!
!!
!!
!!
!!
!
!
!
!
!!!
!
!
!!
!
!
!!!!
!
!
!
!
!
!
!!
!
!
!
!!!!
!
!
!!
!
!
!
!
!
!
!
!
!
!!
!
!
!!!
!
!
!
!
!!
!
!!
!
!
!
!
!
!
!
!!!
!
!
!!
!
!
!
!
!
!!!
!
!
!
!
!
!
!
!!
!
!
!!
!
!!
!
!!
!!!!
!
!!
!
!!
!
!
!
!
!
!
!!!!
!!
!!!
!
!
!
!
!
!!
!
!!
!!!
!!
!
!
!
!!
!
!
!
!!!
!
!
!
!
!
!
!
!!
!
!
!
!
!
!!
!
!
!
!!
!
!
!!
!
!
!
!!
!
!
!
!
!
!
!!!!!!!!
!
!
!!
!!!
!
!!!!!
!
!!!
!
!
!
!
!!
!
!
!
!!!!!!
!!
!!
!
!
!
!!!!
!!
!
!
!!
!!!!
!!
!!
!
!
!!!!!!
!
!!!!!!
!
!!!
!!
!!
!
!
!!
!
!
!
!
!
!!
!
!!
!!
!!
!
!
!!!
!
!!
!
!!!!!!!!!!!!!!!!!!
!!
!
!
!!
!!!!!!!!!!!!!!!!!!!!!
!
!
!!!
!
!!!!!
!
!
!!
!!!
!
!
!
!!!!!!!
!
!!!!!
!
!!
!
!!
!
!
!
!
!!!!!
!!!
!
!!!!!!!
!
!
!!!
!!!
!!
!
!
!
!!!!!!!!!!!!!!!
!
!
!!!!
!
!
!
!
!
!
!!!
!
!
!!
!
!
!
!
!
!!
!
!
!
!
!
!
!!
!!
!
!
!
!!!
!!
!
!
!
!
!
!!
!
!
!!
!!!
!
!
!!!
!!!
!!!
!!!!!
!
!!!!!!!!!
!!
!
!
!
!!
!
!
!
!
!!
!!!
!
!!
!
!!
!!
!!!
!
!
!
!
!
!
!
!
!!
!!
!
!
!
!
!
!!
!!
!
!
!
!
!
!!
!!
!
!
!!
!!
!
!
!!!
!
!
!
!
!
!
!
!
!
!!!!!
!!
!!
!
!!!
!
!
!
!
!
!!
!!
!
!!
!!!!!
!!!!!
!
!
!!!
!!
!!!
!
!
!!
!
!
!!!
!
!!
!
!
!
!
!!!
!!
!
!
!!
!
!!
!
!!
!!!!!
!!!!!!!
!!!!
!
!
!!
!
!!
!
!!
!
!
!
!!!!
!
!
!
!!
!
!!!
!
!!
!
!!!!
!!
!
!!!
!!!
!
!!!!!!!!!!!!!
!
!!!!!!
!
!!!!
!
!
!
!!!!!!!
!
!!!!!
!!
!
!!
!
!
!
!!!!!!!!!
!!!
!!!!
!!
!!
!!
!
!!
!!
!!!
!
!
!
!
!
!
!
!!
!!!
!
!!!
!!
!
!
!
!
!!!!!!!
!
!
!
!
!!
!
!
!
!
!
!
!
!!
!!
!
!!
!
!!!
!
!
!!!!!
!
!
!!!!!!!!!
!
!
!
!
!!!!
!
!
!
!!!!!
!
!!!!!!!!
!
!
!
!
!
!!
!
!!!
!
!
!
!
!
!
!!
!
!!!
!
!
!!
!!!!
!!
!!!
!!
!
!
!
!!
!
!
!!!!
!!!!
!
!
!
!
!
!
!
!!
!!!
!
!
!!
!
!
!
!
!
!
!!!
!
!
!
!
!
!!!!!!!!!
!
!!
!
!
!!!!!!!!!!!!
!
!!!!!!!!!
!!
!!
!
!
!
!
!
!
!!
!!!
!
!
!
!!
!!
!
!
!
!
!
!!
!
!!!!
!!!!
!
!
!
!
!
!
!!
!!
!
!!
!!!
!
!!!
!!
!!!!
!
!!
!!!!!!
!!!!!!!
!
!
!
!
!
!
!!
!
!
!
!
!
!
!!
!
!!!!
!
!
!!
!!!!!!!!
!
!!
!
!!!!
!!!!!
!
!
!
!
!!
!!
!
!!
!
!!
!
!
!
!
!
!
!
!
!!
!
!!!
!!!!
!
!!!
!!!!
!
!!
!
!
!
!!
!
!
!!
!
!!!
!
!
!
!
!
!
!!!
!
!!
!
!!
!
!!
!
!
!!
!!!
!
!!!
!
!
!
!!!!
!
!
!
!
!
!!!!
!
!!
!!!
!!
!!
!
!
!!
!
!
!!!!
!
!
!!
!
!
!!
!
!!
!
!!
!
!
!
!
!!
!
!
!
!
!
!
!
!
!!
!
!!!!!!
!
!
!!
!
!
!
!!!
!
!
!!!!!!!!!!!!!!!!!!
!!!
!
!
!
!
!!!!!!!
!
!!!
!
!!!!!!!!!
!!
!
!
!!!!!!!!
!!
!!!!!!!!!!!
!
!!
!
!
!
!!!
!
!
!!
!!
!
!!
!
!!!
!
!!
!
!!
!!!!!!!!!
!!
!
!!
!!
!
!
!!
!
!
!
!
!!
!!!
!
!
!
!
!
!!!
!
!!!!!
!
!!
!
!
!
!
!!
!
!!!
!
!
!
!
!
!
!
!!!!!!!
!
!
!!!!!
!!
!!
!
!!
!
!!
!
!
!
!
!
!!!
!
!
!
!
!
!
!
!
!!!!
!
!
!!!
!
!
!
!
!!!
!
!
!
!!
!
!!!
!!!
!
!
!!!
!
!
!
!
!
!
!
!
!!!!
!
!
!
!
!
!!
!!!
!
!
!
!!
!
!
!
!
!!
!
!
!
!
!
!
!
!
!
!
!
!
!
!
!!
!
!
!
!
!!!
!
!
!
!
!
!
!
!
!
!
!
!!!
!
!
!!!!
!!!
!!!
!!!!
!!!
!
!
!
!
!!
!
!
!!!!!!!
!
!!
!
!!!
!
!
!
!
!
!!!!!
!
!
!!
!!
!
!
!!
!!
!!
!!
!!!
!
!
!!!
!
!
!
!!
!
!
!!!
!
!
!
!!
!
!!
!
!!!
!
!
!!!!!!
!
!
!
!!
!!
!!
!
!!
!
!
!
!
!
!
!
!
!
!!
!
!
!
!
!!
!!
!!
!
!
!!
!
!
!!!!!!
!
!!
!
!
!!!!!!
!!
!!
!!!
!
!
!
!
!!
!
!
!
!
!!
!!
!!
!
!
!
!!!!!!!
!
!
!!
!
!
!
!!
!
!
!
!!!
!
!
!!!
!
!!!!!
!!
!
!!!
!!!
!!!
!
!
!
!
!
!
!!
!
!!!!!!!!!
!
!!!!!
!
!!!!!
!
!!!
!
!!!!!
!
!
!
!!
!
!!
!!
!!
!
!!
!
!
!
!
!
!
!!
!
!!!!
!!
!
!
!
!
!
!!
!!
!!
!
!!
!
!!!
!!!!
!
!!!!!!!
!!
!
!
!
!
!
!
!
!
!
!
!
!
!
!!!!!
!
!!!!!!!!
!
!
!
!
!
!
!
!!
!
!
!
!!!!
!
!
!
!!!!!!!
!
!!
!!!!!
!
!
!
!!
!
!
!!
!!!!!!
!
!!!!
!
!
!
!
!
!
!!
!
!
!
!!!!!
!
!
!
!
!
!
!!
!
!!!
!!
!!
!
!
!!
!!
!!
!!
!!
!!
!
!
!
!
!!!
!
!!!
!!
!
!!
!
!!
!!
!!
!
!
!!!!
!
!
!!
!
!
!
!
!!!!
!
!!!!!
!
!!!!
!
!!!
!!
!!
!
!!
!!
!!!
!
!!
!
!!!!!
!
!!!
!
!!
!
!
!!!!!!!!!!!!!!!!!!!!!!!!!!!!!!!!!!!
!!
!!
!
!
!!
!
!
!
!
!!
!!!
!
!!
!!
!!
!
!!!!!!!!!
!
!!!!!!
!
!!!!!!!!
!
!
!
!
!
!
!
!!!
!!!!
!
!
!
!
!
!
!!
!
!!!!
!!!
!
!
!
!!!
!!
!!
!
!
!!
!!!
!
!!!!!!!!
!
!
!
!
!!
!!!
!!!
!
!
!
!
!
!!!!!!!!!!!
!
!!
!!!!!!!!
!
!!!!
!!
!!!
!!
!!!!!
!!!!!!
!!!
!
!!
!
!!!
!!
!
!!
!
!
!!
!!
!
!
!!!
!
!!!
!
!!
!
!!!!!
!
!
!!!!!!
!
!
!
!!
!
!!!!!!!!!!!!
!
!
!!!!!!
!
!
!!
!!!!!!!!!!!!
!
!!!!!
!
!!
!
!
!
!!!!!!
!!
!!!!!
!
!!!!!!!!!!!
!
!!
!
!
!
!
!!
!!
!!
!
!
!!!
!
!!
!
!!
!
!!!!
!!!!
!!
!!!
!
!!
!
!
!
!!!
!
!!!!!!!!!!!!!!
!
!
!!!
!!
!!!!!!!!
!!!!
!!!
!
!!!!
!
!!
!
!
!!!!!!!
!
!
!!
!
!
!!!
!
!
!!!
!
!!!!!!
!!
!!
!
!!
!
!
!!
!!
!!
!!
!
!
!!!!!!!!!!!!!!
!
!!!!!!!!!!!
!
!!
!
!
!
!!
!
!
!!
!!
!
!
!
!
!
!
!!!!!!
!
!
!
!
!!!
!
!
!
!
!
!!
!!
!!!
!
!!!!!!!
!!!!
!
!!
!!
!
!!!!
!
!!!!!
!
!!!!!
!!
!
!
!
!!!!!!!!!!!
!
!!!!!!
!!
!
!
!
!!
!
!!!
!
!
!
!
!!!
!!!!!!!
!
!!
!
!!
!
!!!!!!
!
!!
!
!!!!!!!
!
!!!!!!!
!!
!
!!
!
!!!!!!
!!
!!!!!!!!!!!!!!!!!!!!!!!!
!
!!!!!
!!!
!
!!!!!!!!
!
!!
!!!!!!
!
!!
!
!
!
!!!!
!
!!
!
!
!
!
!
!!!
!
!
!
!
!!
!!!
!!!!
!!
!!!!!!!!!!!!!!!!!!
!
!
!!
!
!!!!
!!
!!
!!
!
!!!!!!!!!!
!!!!!!!!!!!!!
!
!
!
!
!!!!!!!!!!!!
!!!
!!
!!!!!
!
!!
!!!!!!!!!!!!!!!!!!!!
!
!!
!
!
!
!
!
!
!!!!!
!
!!!!!!!
!!
!!!!!!!!
!!
!
!!
!!
!!
!
!
!!!!!!!!!!
!
!!
!
!!!
!!!
!
!!
!
!!
!!!!
!
!!!!
!
!
!
!!
!!
!!
!!!!
!
!!!!
!
!
!!!!
!!!!
!!!
!!!!!!!!
!
!!
!
!
!
!
!
!
!
!!
!
!
!
!
!
!!!
!
!
!
!!!
!
!!
!
!
!!!!!!!!!
!!!
!!
!!!
!
!!
!!
!
!!!
!
!
!!!!!
!
!
!
!
!
!
!!
!
!!
!
!!
!
!
!!!!!
!
!!!!!!
!
!!
!!!!!!!!
!!
!
!
!!
!!!!
!
!
!
!
!
!
!!!!!!
!
!!!!!
!
!!
!
!!
!
!
!!!!!
!
!
!!
!
!
!!!!!
!
!!!!!!!!!!!
!!!!!
!!!!!
!
!!
!
!
!
!!
!
!
!!!!!!
!!
!!!
!!
!
!!
!!!
!!!!
!!!
!
!!
!!!
!
!!!!!
!!
!!
!!!!
!!!
!
!
!!
!!!!!
!!!!
!
!
!!!
!
!
!!
!
!
!!!!
!
!
!!
!!
!!!!
!
!!
!
!!
!
!
!
!
!
!!
!!
!
!
!
!
!
!!!
!
!!!!
!
!!!
!!!!!!
!
!!!
!
!!
!
!
!!
!
!!!!!
!
!!!
!
!
!!!!!!!!!
!
!
!
!
!
!!
!!!!!!!!!
!!
!
!!!!!
!
!
!
!
!
!!
!
!!!
!
!
!
!!!
!!!!!!
!
!
!!!
!!!
!
!!!!!!!
!!!!!!!
!!!!!!
!
!
!
!
!!!
!!
!
!!
!
!!
!!
!
!!
!
!
!!
!!!
!!!!!
!!!
!!!!!
!
!
!
!
!
!
!
!!
!
!
!
!
!!!!!!
!
!!
!
!
!
!
!!!
!
!!!
!!!!
!!
!!
!
!!
!!
!!!!!!!!!!!!!!!
!!
!
!
!!!!!!!!!!!!!!!!!!!!
!
!
!!!!!!!!!!!!!!!!!!!!!!!!!!!!
!
!!!!!!
!!
!!
!!
!!
!
!
!
!!
!
!
!
!
!!!
!!!
!
!
!
!!
!
!
!
!
!
!
!
!
!
!!
!
!
!!
!!
!!!!!
!
!
!!
!!!
!
!!
!
!!
!
!!!
!!!!
!
!!
!
!
!
!!!!
!!
!
!
!!
!
!!
!!!
!
!
!
!!
!
!!
!
!
!
!
!
!!!!!!!
!
!
!
!
!
!
!!
!
!
!
!
!!
!
!
!
!!!!!
!
!!
!
!
!
!
!
!
!
!
!
!
!!
!
!!!!
!
!!
!!
!
!
!
!
!
!
!
!
!!
!!!
!
!!
!!
!
!
!
!
!
!
!
!
!
!
!!
!!!!!!!
!
!
!!!!!
!
!!!!!!!
!!
!!!
!
!
!
!
!
!!!!
!
!!!!!
!
!!!!!
!
!!
!
!
!!!!!!!!!!!!!!!!!!!!!
!
!!!!!
!
!
!!!
!
!!!!!!
!
!!!!!!!
!!
!
!
!!!!
!
!
!!
!
!
!!
!!
!
!!
!
!
!!
!!!!!!!!!!!!!!!!!!!!!!!!!!!!!!!!!!!!!!!
!!!
!!
!!
!!
!!!
!!
!!
!
!!
!!
!
!
!!
!!!!!!!
!
!!!
!
!!!!!
!
!!
!!!
!!!
!
!
!!!!
!
!
!!
!!
!!
!!!!!!
!!!
!!
!
!
!!
!
!
!!!!!!!!!
!
!!!!!
!!
!!!!
!
!
!
!
!!
!!!!!
!
!!!!!!!!!!!!!!!
!
!!!
!
!!!
!!
!
!!
!!
!!
!!!!
!
!!!!
!
!
!
!!
!
!
!
!
!!!
!
!!
!
!
!
!
!
!!!!!!!!!!!!!!!!!!!!!!!!!!!!!!!!!!!!!!!!!!!!!!!!!!!!
!!!!
!
!!!!!!
!!
!
!!!!
!
!
!
!
!!
!!!
!
!!
!
!
!
!
!
!!
!!
!!!
!
!
!!!!!!!!
!
!
!
!!!!
!
!
!!
!
!!!
!
!
!!
!!!
!
!!!
!
!
!!!!
!
!!!!
!!!!
!!
!!
!
!!!!!!!!!!!!!
!
!!!
!
!
!!
!!
!
!!
!!
!
!!
!
!
!!
!
!
!
!
!
!
!!!
!!
!!
!
!
!
!!
!
!!!!
!
!!
!
!
!!!
!!!!!!!!!!!!!!!!!
!!
!!!
!!
!!
!
!
!!!
!
!!!!!!!
!!!
!!!!!!!!
!
!
!
!
!!!!!!!
!!
!!!!!
!
!
!!!!
!
!
!
!
!
!
!!
!
!
!
!!!!!!
!
!!!!
!
!
!
!
!!!
!!!
!
!
!
!
!
!!!!!
!!!!
!
!!!!!
!
!
!
!
!
!
!
!!!!
!
!!!!!!!!
!
!
!
!!
!!
!!
!!!
!!!
!!!!
!
!!!
!
!
!
!!
!!
!!
!
!
!
!!
!
!
!
!!
!!
!
!
!!
!
!
!
!!
!
!
!!
!
!
!
!!
!
!
!
!
!
!!!!
!!!!!
!!
!!
!!
!
!!!!
!!!!
!
!!
!!!!!
!
!!
!
!
!!
!!!!
!!!!
!!!
!!!!!!
!!!!!!!!!!!!!!!!!
!!!!
!
!!!!
!
!!!!
!!
!!!
!
!!
!!
!!!
!
!
!
!!
!!
!
!!!
!!!!!!
!!
!
!
!
!
!!
!!!
!!
!
!
!!!!
!!!!
!
!!!!!
!!
!
!
!
!!!
!
!!!!!
!
!
!
!
!!!!
!!!!!
!
!!!
!!!!!!!
!
!!!!
!!
!!!
!
!!!
!!
!
!
!
!
!!!!!
!
!!!!!!!!!!
!
!!!!!!!
!
!!!!!
!
!
!!!!!!!
!
!
!!!!!
!
!
!
!
!!
!!!!!!!!!!!
!
!
!
!
!!!!
!
!!
!
!!!!!
!!
!!!!!!!!!!
!
!
!
!!
!!
!
!!!
!
!
!
!
!!
!
!!
!
!!
!
!!
!!!!!!
!
!!!!!!
!!!!!!!
!!!!
!!
!
!
!!!!!!!!!
!
!!
!
!!
!
!!
!
!
!
!!!!!
!
!
!!
!!
!
!!
!
!
!!
!!!!!!
!!
!!!
!
!!
!
!!!
!
!
!!!!!!!!!!!!!!!!
!
!!!!
!!!!!!!!
!!!!!!!
!
!!!!
!!!!!!!!!!!!!!!!!
!!!
!
!!!!!!
!
!
!!!!!!!!!!!!!!!
!!!!!
!!
!
!
!!
!
!!!!
!
!!!
!!!!!!!!!!!!
!!!!!!!!
!
!!
!
!
!
!!!!
!!!!!!!!!!!!!!!
!
!!!!!!!!
!!!
!!!!
!!
!
!!!
!
!!!
!
!
!!
!
!
!!
!!
!
!
!
!!!!!
!
!!
!
!!!
!!!!!!!!!
!
!
!
!!!!!!!!!!!!!
!
!
!
!!!!!!!!!!!!!
!!!!!!!!!!!
!
!!!!!!!!!!!
!!!!
!
!
!!!
!
!
!!!!
!
!!!!!!!
!
!
!!
!!
!!!
!
!!!
!!
!!
!!!!!
!
!
!
!!!!!!!!!!!!!!!!!!!!!!
!!!!
!!!!!
!
!!!
!!!
!!
!!!!
!!!
!
!!!!!
!
!
!!!
!!
!
!
!!!!!
!
!!!
!!!!
!!!!!!!!!!!!!!!!!!
!!
!!!!!!!
!!
!
!!!
!!!!!!!!!!!!!!!!!!!!!!!!!!!!!!!!!!!!!!!!!!
!!!
!!!
!!!!!
!
!!
!
!
!
!!
!!!!
!!!!!!
!
!!
!!!!!!!!!!!!!!!!!!!!!!!!!!!!!!!!!!!!!!!!!!!!!
!
!
!
!!!!!!
!
!!!!!!!
!
!!!
!!!
!
!
!
!
!!!
!!!!!!!!!!!!!!!!!!
!!!!
!
!
!!!!!!!!
!!!
!!!!!
!
!!
!
!
!!
!!!!!!!!!!!!!!!!!!!!!!!!
!
!!!
!!!!!!!!!!!!!!!!!!!!!!!!!!!!!!!!!!!!!!!!!!!!!!!!!!!!!!!!!!!!!!!
!!
!!!!!!!!!!
!!!!!
!!!!!!!!!!!!!!!!!!!!!!!!!!!!!!!!!!!!!!!!!!!!!!!!!!!!!!!!!!!!!!!!!!
!
!!!!!
!
!!!!!!!!!!!!
!!
!!!!!!!!!!!!!!!
!
!!!!!!!!!!!!
!
!!!!!
!
!!!!
!!!
!
!
!
!
!
!!
!
!!
!
!
!!!!!!
!!!
!
!!!
!!!!!!!!!!
!!!
!!!!!
!
!!!!
!
!!!!!!!!
!
!!!!!!!!!!!!!!!!!!!!
!
!!!!!!!!!!
!!!!
!!!!!
!
!!!!!!!!!
!!!!!!!
!
!
!!!!
!!!!!!!!
!!!!!!!!
!!!!!!!!!
!
!
!
!
!
!
!
!
!!!!!
!
!!
!!
!
!!!!!!!!!!!!
!
!!!!
!!
!!
!
!!!
!!
!
!
!
!!
!
!
!
!!!!!!!!
!
!
!!
!
!!!
!!!!!!!!
!
!!
!
!
!!
!
!
!!
!
!
!!
!
!
!!!!
!
!
!
!!!
!
!
!!
!!!!!!!!!!!!!!!!!!!!!!!!!!!!!!!!!!!!!!
!!!!!!!
!
!!!!!
!
!
!
!
!!!
!
!
!!!!!!!!!!!!!!!!!
!
!!!!!!
!
!
!!
!
!!!!
!
!!
!
!
!
!
!!!!!!!!!!!!!!!!!
!
!
!
!!
!!
!!!!!!!!
!
!!!!!!!
!
!!!
!!
!!!!!!!!!!!!!
!!
!!!
!!!
!!
!
!!
!!!
!!
!
!!
!
!!!!!
!
!
!!
!
!!!!!!!!!!!!!!!!!!!
!!!!!!!!!!!!!!!!!!!!!!!!!!!!!!!!!!!!!!!!!!!
!
!!!!!!!!!!!!!!!!!!!!!!!!!!!!!!!!!!!!!!!!
!
!!
!!
!
!!!
!!
!!!
!
!
!!!
!
!!
!!!
!!!!!!!!!
!
!!!!!!!!!!!!!!!!!!!!!!!!!!!!!!!!!
!
!!!!!!!!!!!!!!!!!!!!!!!
!
!
!
!!
!
!!
!
!!!!!!!!!!
!!!
!
!!!!!!!!
!!!
!!!!
!!!
!!!
!!
!!!
!!
!
!
!!!
!
!!!
!
!!!
!!!!!!!!
!
!!!!!!!!!
!!!!
!!
!!!!!
!!!!!!
!!
!!!
!!!
!!
!
!!!!!!!!!!!!!!!!!!!!!!!!!!!!
!
!!
!
!!!!!!!!!!!
!
!!!
!!
!
!
!!!!!!
!!!
!
!!
!!!
!
!!
!!
!!
!
!
!!!
!!
!
!
!!!!!!!!!!
!!!
!
!!
!
!!
!!
!!
!
!!!
!
!!
!
!!!
!
!!
!!
!!!!!!!!!
!
!!!
!
!!!!
!
!!!!
!
!
!
!!!!!!!!!!!!!!
!!!!
!
!!
!!
!
!!!
!!
!!
!!!
!!
!
!!!!!!
!!
!!!
!
!
!!
!!!!!!
!
!
!
!
!
!
!!!!!!!!!!!
!!!
!
!
!
!
!!
!!!!
!!!!!!!!!!!!!!!!!!!!!!!
!!!
!!!!!!!
!!!!!!!!!!!!!!!!!!!!!!!!!!!!!!!!!!!!!!!!!!!!
!
!
!!!
!!
!
!
!!!!!!!!!!!!!!!!!!
!!!
!
!
!
!
!
!
!!!
!
!!!!!!
!
!!!!!
!
!!!!!!!!!!!
!
!!!!!!!
!
!!!!
!
!!!
!
!
!!!!
!
!!!!!!!!!!!!!
!!!!
!!!!
!!!
!!
!!!
!!!!
!
!!!!!!!
!!
!
!!
!!!
!!!!
!
!
!
!!!!
!
!!!
!
!!
!!!
!!
!
!
!!!!
!
!!!!!!!!!!
!!!
!!!!!
!
!!!!!!!!
!
!!!!!!!!!!!!
!!!!!!
!
!
!!!!!!!!!!!!!!!!!!!!!!!!!!!!!!!!
!!!
!!!!!!!!
!!!!!!!!!!!!!!!!!!!!!!!!!!!!!!!!!!!!!!
!!!!!!!!!!!!!!
!!
!
!!
!
!!!!
!!
!
!!!!!
!
!!!!
!!!
!!
!
!
!!!
!!!
!
!
!!!!!!!
!!
!!!!!
!
!!!!!
!
!
!
!
!!
!!!
!!!!!!!!!!!!!!
!
!!!!!!
!!!!
!
!!
!!
!!
!
!
!
!!
!!!!!!!!!
!
!
!
!!!!!!
!!!!!!!!!!!
!
!
!!
!!
!!!!!!!
!
!!
!!!!!
!!!!!!
!!!
!!!!!!
!!!!!!
!
!
!
!
!!
!!
!
!!!!
!
!
!
!!
!!!
!!
!
!
!
!!!!!!
!!!!!!!!!!!!!!!
!!
!
!!
!!
!!!!!!!!
!!!!!!!!!!!!!!!!
!!
!
!!!!!!
North Port
Sarasota
Venice
PalmettoBradenton 0 - 4
5 - 9
10 +
Number of open releases within a one-mile radius
Figure 54. LUST Cleanups in Florida and Along the Tamiami Scenic Highway Route in Florida

The NaTioNal lUST CleaNUp BaCklog: a STUdy of opporTUNiTieS
40 September 2011
way for new community-based revitalization efforts, utilize economies of scale such as reduced equipment costs, and present opportunities to develop multi-site cleanup strategies, especially at locations with commingled contamination. However, EPA recognizes that state and local regulations might present implementation challenges. The Montana Department of Environmental Quality (MT DEQ) completed a successful pilot at geographically-clustered releases. MT DEQ had to work through many administrative, legal, and fiscal challenges to complete the project but believes the pilot shows the approach is worth the effort in terms of future benefit and cost savings to the program. EPA encourages states to look for opportunities to use resource consolidation and area-wide planning/corridor approaches. EPA also realizes this approach is be best geared to address targeted groups of releases as opposed to a state-wide opportunity for every cluster of releases. EPA intends to work with state programs to continue further geospatial analyses on clusters of open releases in relation to RPs, highway corridors, local geologic and hydrogeologic settings, groundwater resources, and communities with environmental justice concerns. These analyses might reveal additional opportunities for backlog reduction.
Data Management A lack of accurate and complete data limited EPA’s ability to identify other opportunities to expedite reduction of the LUST cleanup backlog in this analysis. More importantly, EPA suspects it also affects the ability of state program managers to efficiently manage their cleanups. As a result of incomplete database tracking, state program managers must undertake large-scale paper file review efforts to get an accurate handle on their state backlogs and the data necessary to plan for future obligations. Data management challenges contribute to the backlog because state programs were not able to gather and analyze important information efficiently or to respond effectively to changing conditions. Table 6 presents examples of important LUST release data that could be useful to include in state databases. Tracking these data or comparable data elements in state databases would allow for a more thorough assessment of state backlogs and enhance state program management. EPA recognizes comprehensive data management in any organization is always a formidable challenge. However, accurate data can optimize remediation strategies and reduce costs.
Table 6. LUST Release Attributes and Their Value to Managers
Release Attribute Value to State Program Management
Affiliated PartyProvides potential opportunities to seek interest in multi-site work with affiliated parties.
Applicable Site Cleanup Standards
Allows evaluation and comparison of the pace of release-specific remediation with state cleanup standards.
Contaminant Levels Allows tracking of remedial progress, evaluation of cleanup technology in use, and informs risk-based approaches.
FR Mechanism Documents type and availability of financing for cleanup.
Institutional/Engineering Controls
Tracks contamination left in place at the completion of removal or remedial actions and facilitates tracking of long-term management obligations.
Life Cycle Costs of Remediation Technologies
For states with state funds, allows states to determine long-term costs of remediation.
Media Contaminated Informs risk and release priority.
Pending Closure Facilitates tracking releases close to closure.
Presence of Free ProductHelps to track compliance with federal and state cleanup regulations. Highlights releases with potential for concern.
Release DateEstablishes timeline for release.Provides context for identifying RP.Tracks age as a milestone to measure the speed of cleanups.
Remedial Technologies
Documents the technologies in use to allow program managers to easily assess whether the technologies are appropriate, including MNA. Facilitates optimization reviews.
Responsible Party (RP)Tracks the liable party and facilitates contacting RP to pursue cleanup of the release.Facilitates identification of RPs with multiple releases.
RP Recalcitrance/Last Date of Communication
Highlights inaction by RPs.Facilitates use of enforcement actions.
Source Removal DateProvides milestone to measure speed of cleanup and allows tracking of remedial progress.
Stage of Cleanup
Establishes timelines for moving releases through the cleanup pipeline (i.e., assessment, remediation, and closure).Provides information to forecast the type of work remaining to close releases.Identifies releases where cleanup activities are stalled or have not begun.

The NaTioNal lUST CleaNUp BaCklog: a STUdy of opporTUNiTieS
SepTemBer 2011 41
ADDITIONAL PROPOSED REASONS FOR THE BACKLOG NOT ANALYZED IN THIS STUDY In the Introduction, EPA identified additional proposed reasons for the persistence of the LUST cleanup backlog. However, these proposed reasons could not be fully evaluated with the data available for this study. These unexamined reasons include:
• States with more stringent cleanup standards have longer cleanup times.
• The use of separate organizations for LUST cleanup and enforcement dilutes attention to cleanup.
• The type and implementation of a private financial mechanism affects the pace of cleanups.
• Cleanups where property transactions occur receive staff priority before other cleanups.
• Older releases involve contaminants that require more time and resources to fully remediate.
• Small businesses take longer than large businesses to clean up releases.
• Releases remain in the backlog due to a lack of economic incentive for RPs to close the releases and redevelop the sites.
• Releases at active facilities take longer to clean up.
Throughout this study, EPA introduced potential opportunities to address select areas of the backlog. These opportunities are not intended as recommendations but are meant to open a dialogue with the states and other stakeholders on all opportunities to reduce the national cleanup backlog and serve as the basis for backlog reduction strategies. EPA intends to develop these strategies jointly with the states. The opportunities raised in this study are examined in more detail in the next section.

The NaTioNal lUST CleaNUp BaCklog: a STUdy of opporTUNiTieS
42 September 2011
P O T E N T I A L O P P O R T U N I T I E S T O R E D U C E T H E B A C K L O GOver the course of the program, EPA and the states developed tools and processes to advance the cleanup of releases and reduce the LUST cleanup backlog. In this report, EPA identified several potential opportunities states can and have explored in the development of their own backlog reduction strategies. Many of these potential opportunities come from state activities that successfully moved releases toward closure or are tools already being used within the program. Examples of successfully employed backlog reduction tactics include systematic reviews of old case files in Illinois; multi-site cleanup agreements in Pennsylvania and Washington State; efforts to identify easy-to-close cleanups in Montana and North Carolina; the use of integrated funding from different sources, such as the petroleum brownfields program in New Hampshire; and the use of privatized cleanup oversight in New Jersey and Texas. Additional discussion of states’ backlog reduction efforts can be found in each state chapter.
EPA is not recommending the implementation of every opportunity described in this report. In some cases, a state program might already pursue similar opportunities as a function of its ongoing activities. Other state programs might not be able to implement certain opportunities because of statutes, prioritization systems, or programmatic limitations. EPA believes, however, that presenting these potential opportunities will help states with the examination of their backlogs and identify promising options to reduce the LUST cleanup backlog. EPA intends to use these potential opportunities as starting points to develop more detailed strategies jointly with the states. The strategies could involve the creation of program metrics, targeted resources for specific cleanup actions, clarification and development of guidance, and/or revised policies. The development of these strategies might entail targeted data collection, review of particular case files, and further analysis of problem areas. The potential opportunities identified by EPA in this study fall into three general categories and are discussed below:
• Accelerating Corrective Action;• Pursuing Targeted Initiatives; and • Improving Program Implementation.
ACCELERATING CORRECTIVE ACTION
Expedite S i te AssessmentsOne of the major difficulties in reducing the backlog is that corrective action often takes a long time to complete. EPA is committed to helping state and local agencies make cleanups faster, more effective, and less expensive. An apparent bottleneck in this process is the Site Assessment stage. Site assessment is a crucial early stage leading to an understanding of the nature of a release (e.g., its source and extent) and a site’s characteristics. Conventional site assessments involve a significant amount of data analysis and interpretation, which is often completed off site, can require multiple phases, and can take a long time to complete. Using an expedited site assessment (ESA) process can improve the overall efficiency and effectiveness of site characterization. The ESA process is a framework to rapidly characterize LUST releases for corrective action decisions. An ESA is typically conducted in a single mobilization and completed in a matter of days through the use of field-generated data and on-site interpretation, flexible sampling and analysis, and the presence of senior staff empowered to redirect the investigation in response to new data. EPA created its March 1997 guidance manual Expedited Site Assessment Tools For Underground Storage Tank Sites: A Guide For Regulators to help state regulators understand and implement the ESA process, and it is available at: www.epa.gov/swerust1/pubs/sam.htm. Additional information is available at: www.epa.gov/OUST/cat/sitechar.htm.
Opt imize Remedia l Des ignThe selection of the remedial technology to clean up a release can have a significant effect on the time to complete closure for long-term cleanups. Thus, state program managers should revisit the remedy decision periodically and consider options to optimize the remedy. The key to the optimal design of a remediation system is a comprehensive site characterization, especially for complex, long-term cleanups. Consideration of remedial design should guide the site characterization process from the outset. In addition, EPA believes it is important to consider periodic reevaluation of cleanup progress to determine whether the cleanup technology remains the most appropriate.
An appropriate technology is one that will meet remedial objectives within a reasonable timeframe and makes the site protective of human health and the environment. Remedial technology optimization uses defined approaches to improve effectiveness and efficiency in reaching the objectives of an environmental remedy. Optimization approaches might include: third-party site-wide optimization evaluations conducted
The NaTioNal lUST CleaNUp BaCklog: a STUdy of opporTUNiTieS
SepTemBer 2011 43
by expert teams; the use of mathematical tools to determine optimal operating parameters or monitoring networks; or the consideration of innovative technologies.
During the remedy selection or optimization processes, managers should consider the use of alternative cleanup remedy options as well as traditional remedy approaches, such as pump-and-treat systems for groundwater contamination and excavation and disposal for soil contamination. Examples of alternative cleanup technologies include: soil vapor extraction, air sparging, biosparging, landfarming, biopiles, bioventing, low-temperature thermal desorption, in situ groundwater bioremediation, dual-phase extraction, enhanced aerobic bioremediation, and chemical oxidation. When possible, remedial designs should consider ways to lessen the environmental footprint of a cleanup, making it a “greener” cleanup.71 Managers can also consider employing innovative technologies. In many cases, EPA does not have data demonstrating cost-effectiveness of innovative technologies (e.g., co-solvents, surfactant-enhanced remediation, and soil washing) for typical LUST sites. However, these technologies might have positive results and be appropriate for select circumstances. Additional resources on remedy optimization, alternative technologies, and innovative technologies include:
• How To Evaluate Alternative Cleanup Technologies For Underground Storage Tank Sites: A Guide For Corrective Action Plan Reviewers. October 1994 - May 1995. www.epa.gov/OUST/pubs/tums.htm.
• OSWER Directive 9380.0-25: Promotion of Innovative Technologies in Waste Management Programs. April 1996. www.epa.gov/OUST/cat/itpolmem.pdf.
• Green Remediation Best Management Practices: Sites with Leaking Underground Storage Tank Systems. June 2011. www.clu-in.org/greenremediation/docs/ust_gr_fact_sheet.pdf.
• U.S. EPA Technology Innovation and Field Services Division, Contamination Site Cleanup Information on Remediation Optimization, Clu-in website. www.clu-in.org/techfocus/default.focus/sec/Remediation_Optimization/cat/Overview.
Apply R isk-Based Decis ion-Making (RBDM)EPA encourages the use of RBDM during the corrective action process for LUST releases. RBDM is a process during which decisions are made about sites according to the actual risk each release poses to human health and the environment. EPA believes RBDM is an effective tool that can facilitate efforts to move all cleanups forward expeditiously while still ensuring protection of human health and the environment.
71 For additional information about EPA’s Principles for Greener Cleanups, see: www.epa.gov/oswer/greencleanups/principles.html.
State staff may utilize RBDM throughout the corrective action process, including site classification and prioritization, establishment of cleanup goals, and determination of the level of cleanup oversight. In March 1995, OUST developed a comprehensive policy that explains the use of risk-based approaches at LUST sites: OSWER Directive 9610.17 Use Of Risk-Based Decision-Making In UST Corrective Action Programs, available at: www.epa.gov/OUST/directiv/od961017.htm.
Under RBDM, the use of IC/ECs can help reduce the time to closure by mitigating risk and adjusting cleanup goals. EPA recognizes state program managers might face difficulties in implementing and monitoring IC/ECs due to site-specific characteristics but believes these controls can be valuable components of efficient corrective action. EPA has produced several resources for state managers, including:
• Institutional Controls: A Site Manager’s Guide to Identifying, Evaluating and Selecting Institutional Controls at Superfund and RCRA Corrective Action Cleanups. February 2005. www.epa.gov/superfund/policy/ic/guide/citguide.pdf. This guidance provides decision makers with an overview of the types of institutional controls that are commonly available, including their relative strengths and weaknesses, and provides a discussion of the key factors to consider when evaluating and selecting institutional controls.
• Institutional Controls: A Guide to Planning, Implementing, Maintaining, and Enforcing Institutional Controls at Contaminated Sites, November 2010. www.epa.gov/superfund/policy/ic/pdfs/PIME-IC-Guidance-Interim.pdf. The purpose of this guidance is to provide site managers of contaminated sites, site attorneys, and other interested parties with information and recommendations that should be useful for planning, implementing, maintaining, and enforcing institutional controls for Comprehensive Environmental Response, Compensation, and Liability Act (CERCLA, or Superfund); brownfields; federal facility; UST; and RCRA site cleanups. It addresses some of the common issues that might be encountered and provides an overview of EPA’s policy regarding the roles and responsibilities of the parties involved in various aspects of planning, implementing, maintaining, and enforcing institutional controls. A thorough understanding of the concepts and sources in this and related documents referenced here should help ensure that institutional controls are properly implemented and operate effectively during their lifespan.
• Institutional Controls Bibliography. December 2005. www.epa.gov/superfund/policy/ic/guide/biblio.pdf.This document serves as a reference for policy guidelines concerning the use of institutional controls. The document covers 40 guidance and policy documents and provides citations and brief synopses of the institutional control use and policy information in each of the documents.

The NaTioNal lUST CleaNUp BaCklog: a STUdy of opporTUNiTieS
44 September 2011
Provide Incent ives for C leanup ContractorsIn addition to the technical items discussed above, states can provide incentives for contractors to complete work more quickly and to encourage efficiencies. Many of these approaches use economic incentives and market forces to encourage cleanup contractors to keep cleanup expenditures under control and meet cleanup goals as soon as possible. Incentive approaches include charging financial penalties for down time, requiring pre-approval of proposed cleanup plans and budgets, paying once per cost plan, and offering bonuses for early completion to help reduce remedial costs and expedite cleanups.
PFP contracts are another form of incentive used to reduce costs to states and that can help accelerate cleanups. Under PFP contracts, contractors are paid a set amount of money for reaching specific contamination reduction goals, which are predetermined by state cleanup experts. This process helps ensure cleanups are completed expeditiously for a pre-defined cost. Several states have successfully used PFP contracts to address LUST releases and could also integrate early closure incentives into PFP contracts. PFP seems to work well where site characteristics can be confidently documented and when a competitive bidding process is used to set the cleanup price. PFP might not be appropriate for extremely complex sites with many unknown variables. A number of states, including South Carolina and Nebraska, are continuing and improving their PFP practices that are yielding faster cleanups at lower prices. Existing time-and-materials contracts can often be converted to PFP contracts; these converted contracts could be a useful tool for cleanups that have continued for a long period of time without attaining cleanup goals. Although commonly used for state-lead cleanups, PFP can be used for private cleanups as well, including cleanups where a state fund reimburses private parties. A state fund that reimburses private parties for the costs incurred by the RPs’ privately-contracted cleanup firms can instead set PFP milestones as criteria for fund reimbursement, regardless of the payment terms that parties might have agreed to among themselves.
EPA has published several resources for managers, including its February 2002 Pay for Performance Toolbox (www.epa.gov/OUST/pfp/toolbox.htm), which provides the information needed to start up or expand a PFP program for LUST cleanups. Additional resources are available at: www.epa.gov/OUST/pfp/index.htm.
PURSUING TARGETED INITIATIVESThe Phase 2 study identified several areas where targeted initiatives could be developed to address groups of LUST releases. EPA believes state staff could further reduce the backlog by eliminating old, easier-to-close releases; capitalizing on economies of scale; and pursuing partnerships with private and government entities.
Remediate Soi l Contaminat ionAlthough states have historically addressed the majority of releases with soil-only contamination, the states in this study have approximately 9,500 releases remaining in the backlog that contaminated soil only. Soil contamination is generally easier and less costly to remediate than groundwater contamination, so targeted and continued efforts to address these easier-to-close releases could lead to a significant reduction in the backlog. In addition, remediating soil contamination can ensure contaminants do not migrate into groundwater resources and create a more complicated cleanup scenario.
Review Case F i les for Releases near C losure Several state programs in this study reported that their backlogs include releases that have nearly attained cleanup goals but require additional confirmation monitoring. For example, LUST programs might require releases to meet cleanup goals for four successive monitoring events but the goals are achieved at only three of the four events. These releases could be closed by encouraging project managers to track these releases and dedicating a small amount of funding to make final closure determinations. Montana has recently designated a pending closure category in its database to facilitate tracking releases close to closure.
Review Case F i les for Old Releases with No Act iv i tyThrough discussions with staff from the various state programs in this study, it became apparent that old releases are often not well-defined, remain unaddressed, and, in some cases, are not assigned to a project manager. Some states have reviewed old paper files to update databases, assign project managers, and identify releases for closure. These efforts were conducted using a variety of resources, including state staff, interns, and contractors. Not only are such reviews essential to ensure informed management, but numerous closures have been achieved through these initiatives. EPA recommends, as resources permit, that all states conduct reviews of releases in their cleanup backlogs to ensure all releases are classified and managed effectively.
Track and Address Orphan ReleasesState programs are burdened with cleaning up orphan releases and should expand efforts to strategically address these sites. As the contracting parties, state programs often take advantage of economies of scale, such as hiring a single contractor to remediate multiple sites or addressing commingled LUST contamination simultaneously, and these approaches should be considered when addressing orphan releases. By tracking and addressing orphan releases, a state program can also more fully understand its backlog and its obligations and manage resources accordingly.

The NaTioNal lUST CleaNUp BaCklog: a STUdy of opporTUNiTieS
SepTemBer 2011 45
Pursue Mult i -S i te Agreements (MSAs)Much of the cleanup backlog consists of releases located at facilities with common ownership, RPs, or other APs. Several states, including Pennsylvania and Washington State, have successfully pursued MSAs with such parties even though the states rely on different FR mechanisms. Pennsylvania has a state fund, and Washington State cleanups are funded through private financing, typically insurance. MSAs are designed to ensure releases progress toward meeting cleanup goals and to streamline project oversight while also providing current owners with a measure of control over year-to-year costs. RPs can be engaged through incentives or enforcement actions, and other non-responsible APs might be interested in contributing resources to ensure facilities bearing their name are cleaned up. In addition, states and EPA can work with government agencies to address multiple releases through MSAs or other appropriate tools. EPA recognizes that state statutes and regulations can present implementation challenges for both MSAs and the geographic clusters discussed in the next paragraph, but these approaches can still result in significant cleanups.
C lean up Releases in Geographic C lustersSignificant numbers of releases in the cleanup backlog are geographically-clustered, which offers opportunities to maximize economies of scale. EPA believes addressing geographic clusters of releases in an area-wide planning context can facilitate the remediation of additional releases. Geographic initiatives could include partnership efforts with the U.S. Department of Housing and Urban Development and the U.S. Department of Transportation to address cleanups within sustainable communities and along “corridors.” Such efforts could highlight targeted economic development areas, enterprise zones, environmental justice areas, ecologically sensitive areas, or other areas of special focus. In addition, addressing commingled contaminant plumes in one cleanup action or developing intra- or interstate regional cleanup initiatives could allow economies of scale to reduce overall cleanup costs.
IMPROVING PROGRAM IMPLEMENTATIONThrough the course of this study, a variety of issues have been identified across state programs that, if improved, could potentially increase the closure rate of LUST releases.
Increase Program ResourcesAccording to the ASTSWMO 2009 State Fund Survey and the states in this study, program resources are limited and cannot fully address the backlog. Pursuing budget increases and increases to tank or petroleum fees could provide additional state funding to better equip state programs to address the extensive contamination caused
by LUSTs. In addition, states and EPA could examine the possibility of dedicating funding to specific problem areas to help close out lingering releases in the backlog. For example, additional funding to address low priority releases or the presence of free product could allow some states to address these cleanups that might otherwise be deferred. EPA recognizes that overall budgets are currently limited. However, the data show state UST programs will be hard-pressed to address LUST releases in a timely manner and ensure protection of human health and the environment without additional funding.
Improve Data ManagementA lack of accurate and complete data among the states analyzed in the Phase 2 study affects the ability of state program managers to efficiently manage their cleanups and limits EPA’s ability to fully characterize the LUST cleanup backlog in these states and identify opportunities to reduce the backlog. An effective data management system minimizes data handling and improves data quality, allowing project managers more time to oversee cleanups. In other words, good data supports program management. In addition, effective data management systems require less labor and resources for data retrieval and analysis, thus facilitating backlog reduction efforts to target easier-to-close releases or to identify parties responsible for releases. Centralized and electronic data storage would ensure all state staff have access to the same information and would prevent the loss of institutional knowledge through employee attrition. The availability of centralized electronic data would also allow for efficient data retrieval for reporting purposes and for the analysis of remedial technology effectiveness.
Data management technologies are constantly improving, and many techniques are now available to state programs that were not possible in the past. The electronic submission of data, including sampling reports, remediation plans, and other cleanup information through Web-based interfaces minimizes data handling. For example, California’s GeoTracker database allows contractors to submit sampling reports and geospatial data electronically, allowing state program managers to quickly identify releases with free product present and evaluate details on contaminants. By properly maintaining such a function, a state can reduce its reliance on paper reports. Web-based submission of RP documents, including technical site data as well as administrative correspondence, would similarly allow state program managers to quickly identify cleanups that have stalled, RPs with overdue reports, and successful technical approaches. For example, the Texas Commission on Environmental Quality regularly queries its database to identify RPs from whom they have not received correspondence in 15 months or more. According to ASTSWMO’s Pulse of the Nation 2008, Arizona and Mississippi both developed new UST databases and found that the systems have greatly improved program management.

The NaTioNal lUST CleaNUp BaCklog: a STUdy of opporTUNiTieS
46 September 2011
Monitor FR MechanismsThis study and discussions with the states reveal the need for improved monitoring of private FR mechanisms. Several states reported some tank owners purchase insurance and provide certification to the states and then do not renew the policy the following year. Improved oversight and enforcement of the FR requirements by state UST regulators would help ensure owners have insurance coverage for LUST releases and could help reduce the number of orphan cleanups that must be funded by the states.
In addition to improved monitoring of FR mechanisms, better tracking of the financing of individual releases could improve states’ management of their backlogs. Currently, most states do not track the FR mechanism or financing associated with individual releases. Integrating these important data into LUST databases could help state programs track releases where private financing should be available for cleanups and to monitor the number and type of cleanups needing state funding. Such attention could also better discern the efficacy of different financing mechanisms.
Expand Enforcement Pract icesAlthough data for analysis of enforcement actions were generally not available for this study, several state program managers discussed the value of enforcement actions in preventing recalcitrant RPs from avoiding cleanup responsibilities and for addressing cleanups at stalled releases. EPA believes states should maximize the use of available enforcement tools and possibly expand their enforcement capacities where appropriate. In addition, warning RPs of impending enforcement actions could be useful in promoting cleanup action. Knowing that cleanup will be pursued by a state program in the near term can encourage action by an RP. For example, under the recent LUST cleanup work in support of the ARRA, several RPs moved forward with cleanup actions when state programs announced their intention to begin cleanup of those releases. In these instances, threat of heightened visibility alone might have moved otherwise stalled releases toward closure. In general, more frequent and conspicuous enforcement should yield more closures as well as deter other RPs from neglecting cleanup activities.
Promote Voluntary C leanup ProgramsThe use of voluntary cleanup programs can help achieve additional cleanups, particularly in states that defer low priority releases. Voluntary cleanup programs encourage RPs to clean up their releases, regardless of the priority. In states with active state funds, some voluntary programs allow RPs to move forward with cleanups provided they will accept reimbursement at a later date. Several states have had success with voluntary cleanup programs, including Nebraska and Washington State. Further efforts to make voluntary cleanup programs more widely used by RPs and
stakeholders in real estate transactions might result in more rapid closure of a greater number of lower priority sites.
Pr ivat ize C leanup Overs ightThe use of contracted oversight staff could allow state programs to increase output without incurring long-term staffing obligations, letting programs address more releases than might be possible otherwise. Some states report improved program management through the use of state certified LSPs or local agencies contracted to assist in administrative and technical oversight. Other states and private insurers who supply funding for cleanups have reported concerns that privatized oversight can result in increased costs and increased time to closure.
Implementing Addit ional Cost Control MeasuresAlthough this study focused on release-level data, discussions with states and the review of ASTSWMO state fund surveys found a variety of strategies used by states to help minimize program costs. Cost-control measures not discussed above include:
• Using standard reporting forms.• Requiring competitive bidding for contracts.• Limiting payments for site assessments.• Certifying cleanup contractors.• Requiring the use of a fee schedule.• Purchasing cleanup equipment for reuse at multiple sites.• Reducing laboratory costs. • Implementing paperless reporting.
Additional information is available at ASTSWMO’s website: www.astswmo.org/Pages/Policies_and_Publications/Tanks.htm.
The NaTioNal lUST CleaNUp BaCklog: a STUdy of opporTUNiTieS
SepTemBer 2011 47
N E X T S T E P SThis report sets the foundation for further dialogue among the states and EPA on the LUST cleanup backlog that will ultimately lead to the implementation of informed LUST cleanup backlog reduction strategies. Working with states, tribes, and other stakeholders, EPA will develop detailed backlog reduction strategies with timeframes and milestones for carrying out specific policy actions and cleanup initiatives. EPA identified the two primary areas for moving forward with LUST cleanup backlog reduction efforts: developing backlog reduction strategies and examining funding issues for LUST cleanups.
Developing Backlog Reduct ion StrategiesEPA intends to use both the state-specific and national opportunities identified in this study as the starting points for working with states to develop more detailed and practical strategies to accelerate LUST cleanups and reduce the backlog. EPA’s goal is to develop strategies that can address specific areas of the backlog: some will be state-specific and others will apply to multiple states. Not every strategy will work in every state, but the Agency hopes to cover a large part of the backlog with these different strategies. Examples of potential strategies include: multi-site cleanup agreements with individual RPs or types of RPs, such as government agencies, and initiatives targeted to different types of facilities, such as abandoned gas stations or older high priority sites. Potential EPA-supported efforts could include assisting a state program with review of its paper files or providing on-site support from the EPA Office of Research and Development to facilitate expedited site assessments and closures. Developing backlog reduction strategies will rely on collaborative efforts between and among state agencies, EPA regions, and EPA headquarters. There might be additional strategies based on other state activities not mentioned in this report, and EPA hopes that states will share their expertise in these areas as part of the national discussion.
Examining Funding Issues for LUST Cleanups Adequate funding to address the LUST cleanup backlog is one of the key issues for the states and EPA and must be considered during the development of national backlog reduction strategies. There are three primary strategies that can address this issue. First, find more resources to clean up more releases. The states and/or EPA might be able to obtain funding for specific initiatives to address particular types of releases.
Second, consider a broad range of resource options. There are other resources available to finance cleanups. For example, some states have started to finance state fund claims. Public-private partnerships, brownfields, and petroleum brownfields resources can be more widely applied to low priority and orphan site cleanups. New
Hampshire has been successfully integrating various funding sources to complete cleanups since 2000, including the use of petroleum brownfields grants. New Hampshire states that it is not uncommon for them to use two or three different funding sources to complete a cleanup. EPA will work with states to demonstrate the use of public and private funding sources to facilitate assessment, cleanup, and reuse of sites.
Third, the states and EPA need to make sure FR works as intended. FR requirements are designed to make sure someone can pay the costs of cleaning up leaks and compensate third parties for bodily injury and property damage caused by LUSTs. Improved oversight of all FR mechanisms by the states and EPA will help to ensure these mechanisms provide the necessary coverage. In general, state programs lack readily available data on the type of financial mechanism for releases that have not received state funding. The programs also lack data on the expenditures to date for cleanup, making it difficult to monitor cleanup costs and financing needs. If more states sunset their cleanup funds, the increased reliance on private financing mechanisms will require additional monitoring, tracking, and enforcement of RP-financed cleanups. EPA intends stronger oversight of financial responsibility compliance and mechanisms to assure LUST cleanup financing is readily available from state and private sources. Finally, the states and EPA need to discuss how to fund cleanup of orphan releases.
Other Backlog Reduct ion EffortsIn addition, EPA identified three ancillary areas that could assist with backlog reduction efforts.
Explor ing Further Quest ions about the Ex ist ing BacklogEPA could not thoroughly analyze several areas of interest using the data available for this study and throughout the course of the study identified ways to further extend the current analysis. Therefore, to assist with the development of specific backlog reduction strategies, EPA will work with states to identify and compile specific additional information needed to pursue strategies. Areas of further interest include high priority releases in the early stages of cleanup, state practices regarding low risk cleanups, the factors leading to rapid versus prolonged remediation of source removal and groundwater contamination, the efficacy of enforcement actions, and the costs of cleanups. New workgroups or task forces could be formed to support the development of particular backlog reduction strategies.

The NaTioNal lUST CleaNUp BaCklog: a STUdy of opporTUNiTieS
48 September 2011
EPA will explore the occurrence of geographically-clustered releases; these clusters could provide opportunities to capitalize on economies of scale through consolidated cleanup and/or enforcement efforts. Geographic clusters can be further evaluated to determine if certain communities bear a disproportionate share of unaddressed LUST sites and if the impacts associated with these clustered releases are dominated by a single or a small set of RPs. EPA intends to conduct further geospatial analyses on clusters of open releases in relation to RPs, highway corridors, local geologic and hydrogeologic settings, groundwater resources, and/or communities with environmental justice concerns. In addition, states could choose to expand on these findings and incorporate additional elements of interest, such as commingled contamination plumes. EPA believes the results will produce valuable tools for states and EPA regions to use in targeting groups of releases for efficient cleanup and ultimately lead to more strategic decisions for reducing the cleanup backlog.
Examining C leanup Goals and Mi lestonesUsing the results of this study, EPA and states will examine whether it is appropriate and useful to modify national cleanup goals and milestones to better track the LUST cleanup backlog. National LUST performance measures already exist for four cleanup elements: number of confirmed releases, number of cleanups initiated, number of cleanups completed, and number of emergency responses. EPA and the states could examine the use of additional or alternate performance measures that could provide a better understanding of the LUST cleanup backlog. For example, EPA has requested state report site assessments initiated and completed as part of the implementation of ARRA. In addition, the ASTSWMO LUST Technical Task Force has raised the option of developing interim performance measures, potentially focusing on MNA. This study has yielded new information that could be used to improve the tracking of the performance measures. For example, EPA might examine in greater detail the extent to which all state programs are using similar criteria to evaluate the milestones. EPA would work in partnership with states to consider changes or additions that would be mutually beneficial and more accurately reflect the status of the LUST program without creating an undue reporting burden on states.
Support ing the States in Improving LUST Program ManagementEPA will continue to provide technical information, forums for information exchange, and training opportunities to encourage state program development and implementation. Sharing best practices among states is an effective way to support backlog reduction. It could be productive to assist states in their analysis of needed staff, database tools, and funding levels to support robust and effective programs. A strong data management system is vital to effective program management, and implementing agencies should be as informed as possible about their LUST cleanup backlogs. EPA can work with states to improve the accuracy of future reporting and
is willing to engage states regarding potential support associated with designing and implementing improvements to LUST data collection and management systems. Such activities could include setting up electronic data submission for cleanup contractors or converting paper files to accessible electronic data fields. Lastly, EPA and the states should discuss if there are improvements that EPA should make in its program that would assist the states in reducing the LUST cleanup backlog. Potential areas could include communication, technical support and tools, distribution of resources, and training.
The NaTioNal lUST CleaNUp BaCklog: a STUdy of opporTUNiTieS
SepTemBer 2011 49
C O N C L U S I O NClearly, addressing the national backlog of LUST releases presents a complex challenge to state, tribal, and federal regulators and the communities affected by these releases. This report has documented multiple factors affecting the pace of cleanups and analyzed many of the variables faced in addressing the backlog of LUST releases. Some factors are extremely difficult to overcome; for example, in the current economic climate, funding will remain tight and staff workloads will remain high. However, the report also documents successes. While the focus of this study is on the remaining open releases in the backlog, EPA does not want to diminish the states’ significant achievement in closing 80 percent of the national backlog. Many states have demonstrated very successful backlog reduction efforts that might prove promising in other states. The report identifies potential opportunities and points toward possible future efforts to continue the reduction of the backlog.
Given the many factors affecting the LUST cleanup backlog and the variations in the programs addressing these releases, clearly the same strategies will not work for every situation or every program. Unfortunately, there is no silver bullet. On the positive side, the detailed data within this report provide a clearer picture of the release and program attributes for the remaining work than was previously available. Just as a good site assessment enables a tank owner to design the right remedy to move the release to a protective cleanup, so too does this analysis enable EPA and its partners to design informed strategies to tackle the national LUST cleanup backlog.
The UST program benefits greatly from a strong and supportive partnership among regulators at different levels of government and indeed with partners and stakeholders across the spectrum from regulated entities to equipment manufacturers to service providers and others. Analysis is only the beginning. The next step is to learn from these findings and move forward together to explore and pursue these and other opportunities. Ultimately, the goal of all parties affected by the LUST cleanup backlog is to move sites to closure and thus, protect neighborhoods, business opportunities, redevelopment potential, and, most importantly, our human and natural resources. EPA encourages all interested parties to engage the UST program on these issues and to contact EPA for updated information as it becomes available at www.epa.gov/oust or to call the EPA Office of Underground Storage Tanks at 703-603-9900.
The NaTioNal lUST CleaNUp BaCklog: a STUdy of opporTUNiTieS
50 September 2011
[This page has intentionally been left blank.]