the national nrc research center g/t on the gifted
TRANSCRIPT

NRCG/T
THE NATIONAL
RESEARCH CENTER
ON THE GIFTED
AND TALENTED
The University of Connecticut
The University of Georgia
The University of Virginia
Yale University
The University of Georgia
The University of VirginiaCharlottesville, Virginia
September 1995Research Monograph 95128
A Study of Achievement and Underachievement Among Gifted,
Potentially Gifted, and Average African-American Students
Donna Y. Ford


A Study of Achievement and Underachievement Among Gifted,
Potentially Gifted, and AverageAfrican-American Students
Donna Y. Ford
The University of VirginiaCharlottesville, Virginia
September 1995Research Monograph 95128

THE NATIONALRESEARCH CENTERON THE GIFTEDAND TALENTED
The National Research Center on the Gifted and Talented (NRC/GT) is funded under the Jacob K. Javits Gifted and Talented Students Education Act, Office of Educational Research and Improvement, United States Department of Education.
The Directorate of the NRC/GT serves as the administrative and a research unit and is located at The University of Connecticut.
The participating universities include The University of Georgia, The University of Virginia, and Yale University, as well as a research unit at The University of Connecticut.
The University of ConnecticutDr. Joseph S. Renzulli, Director
Dr. E. Jean Gubbins, Assistant Director
The University of ConnecticutDr. Francis X. Archambault, Associate Director
The University of GeorgiaDr. Mary M. Frasier, Associate Director
The University of VirginiaDr. Carolyn M. Callahan, Associate Director
Yale UniversityDr. Robert J. Sternberg, Associate Director
Copies of this report are available from: NRC/GT
The University of Connecticut362 Fairfield Road, U-7Storrs, CT 06269-2007
Research for this report was supported under the Javits Act Program (Grant No. R206R00001) as administered by the Office of Educational Research and Improvement, U.S. Department of Education. Grantees undertaking such projects are encouraged to express freely their professional judgement. This report, therefore, does not necessarily represent positions or policies of the Government, and no official endorsement should be inferred.
ii

iii
Note to Readers...
All papers by The National Research Center on the Gifted and Talented may be reproduced in their entirety or in sections. All reproductions, whether in part or whole, should include the following statement:
Research for this report was supported under the Javits Act Program (Grant No. R206R00001) as administered by the Office of Educational Research and Improvement, U.S. Department of Education. Grantees undertaking such projects are encouraged to express freely their professional judgement. This report, therefore, does not necessarily represent positions or policies of the Government, and no official endorsement should be inferred.
This document has been reproduced with the permission of The National Research Center on the Gifted and Talented.
If sections of the papers are printed in other publications, please forward a copy to:
The National Research Center on the Gifted and TalentedThe University of Connecticut 362 Fairfield Road, U-7Storrs, CT 06269-2007
Please Note: Papers may not be reproduced by means of electronic media.


v
A Study of Achievement and Underachievement Among Gifted, Potentially Gifted, and Average1 African-American Students
Donna Y. Ford
The University of Virginia Charlottesville, Virginia
ABSTRACT This report presents results of a cross-sectional study consisting of interviews with 152 middle and high school (grades 6 to 9) African-American students in five mid-Atlantic school districts in 1995. In every school district that participated in the study, African-American students were under-represented in the gifted education programs. Forty-four students (29%) in the study were identified as gifted by their respective school districts. Academically diverse (gifted, potentially gifted, and average) African-American students were surveyed regarding their perceptions of factors that negatively or positively affect their achievement. Nine variables were investigated, namely, racial/ethnic identity, test anxiety, attitudes toward school subjects, support for the achievement ideology, perceptions of the learning environment, as well as the influence of psychological, social (peer issues and societal injustices), and cultural/familial factors. A multiple regression was used to identify underachieving students. Students whose current semester grade point average (GPA) was one or more standard deviations below the level predicted by their overall Iowa Tests of Basic Skills (ITBS, grade 4) score were defined as underachievers (n = 62, 42%); those whose GPA was at or higher than the level predicted were defined as achievers (n = 87, 58%). Thus, two in five students sampled were underachieving based on regression analysis. Half of the males in the sample (n = 27) and 37% of females (n = 35) were underachieving. Relative to grade level, there was one sixth grader who was underachieving (13%), 24 seventh graders (45%), 18 eighth graders (38%), and 19 ninth graders (48%) who were underachieving. Three students were not categorized relative to achievement status due to missing test scores. Comparative results are based on a 3x2 model, with three academic groups (gifted, potentially gifted, and average students) and two achievement levels (achievers and underachievers). There were 17 gifted underachievers (11% of the sample), 27 gifted achievers (18%), 27 potentially gifted underachievers (18%), 40 potentially gifted achievers (27%), 18 average achievers (12%), and 20 average underachievers (13%). Almost 40% of gifted and potentially gifted students were underachievers, and about 50% of average students were underachieving. 1 Defined as regular education students.

vi
Results indicate that the variables most effective as discriminating among the gifted, potentially gifted, and average achievers and underachievers were: (1) students' attitudes toward reading, math, and science; (2) students' perceptions of parental achievement orientation; and (3) students' own achievement ideology.

vii
A Study of Achievement and Underachievement Among Gifted, Potentially Gifted, and Average African-American Students
Donna Y. Ford
The University of Virginia Charlottesville, Virginia
EXECUTIVE SUMMARY The phenomenon of underachievement is both complex and perplexing,
particularly among gifted youth who, by definition, are expected to excel academically and in life. Yet, educators of the gifted often witness numerous students underachieving and otherwise not working to their potential in school. National Excellence: A Case for Developing America's Talent (U.S. Department of Education, 1993) provides ample evidence of both the failure of America's schools to maximize the potential of gifted students and their failure to identify talent in minority students. Underachievement is a complex phenomenon whose causes and correlates are difficult to explain.
Research on poor achievement among gifted students seldom focuses on risk
factors or cultural differences; instead, the influence of socio-emotional and psychological variables are examined. Self-concept, self-esteem, perfectionism, procrastination, poor peer relations, and heightened sensitivity, for example, are considered important barriers to academic achievement among students identified as gifted (e.g., Hollingworth, 1940; Whitmore, 1980). In addition to socio-emotional and psychological factors, educational factors play an important role in the academic underachievement of gifted students. For example, gifted students may complain of boredom due to an unchallenging and inappropriate curriculum (USDE, 1993).
Numerous studies and reports have examined poor achievement among African-
American students. Yet, few have focused on gifted African-American students. That is, research on underachieving African-American youth has been conducted in isolation from research on gifted youth. Many articles on underachievers fail to use comparative analyses, such as examining racial differences in underachievement. Further, the studies conducted with gifted students and African-American students often focus on very different issues and barriers to achievement. In general, the research on African-American students focuses primarily on social and environmental variables that place them at risk for underachievement and poor educational outcomes. The most commonly referenced factors associated with high dropout rates, and low test scores and grades include low parental education level, living in a single-parent family, low socioeconomic status (SES), English as a second language, and racial minority status. Cultural explanations for poor educational outcomes are also advanced. For instance, cultural deprivation, cultural difference, and cultural conflict theories have been used to explain school-related problems among African-American and other minority students.

viii
Goals and Objectives A paucity of research exists regarding correlates of underachievement among
gifted African-American students, and few studies have examined students' perceptions. There is, however, much research indicating that African-American and other minority youth are consistently under-represented in gifted programs and they are less likely to achieve their potential in school. Specifically, while African-American students comprise 16% of the school population, they comprise only 8% of gifted programs nationally. Previous research (Ford, 1992, 1993) has examined social, cultural, and psychological barriers to achievement as perceived by gifted and non-gifted African-American students; however, no studies have been found that examine underachievement among gifted African-American youth relative to racial/ethnic identity, test anxiety, attitudes toward school subjects, support for the achievement ideology, and perceptions of the learning environment. There is a need to examine the extent to which these factors inhibit the identification of African-American students as gifted or gifted underachievers, to explain why African-American youth tend to underachieve academically, and to explore the reasons for their under-representation in gifted programs.
The study has several objectives: (1) to generate profiles of underachievement
relative to gifted, potentially gifted, and average African-American students in grades 6 through 9; (2) to identify correlates of underachievement (social, cultural, and psychological, racial identity, test anxiety, self and family achievement orientations, perceptions of the learning environment, and attitudes toward school subjects) among African-American youth in different academic groups; (3) to offer recommendations for improving the achievement of African-American students; and (4) to offer recommendations for increasing the representation of African-American students in gifted programs.
Review of the Literature This section presents a review of the literature on factors that influence the
presence of African-American students in gifted education, and the underachievement of African-American students in general. Discussed are such variables as test anxiety, racial identity, the school and learning environment, attitudes toward school subjects, and social, cultural, and psychological factors.
Nationally, African-American students are under-represented in programs that
serve gifted students. The primary factors attributed to African-American students' under-representation are identification practices, namely concerns regarding standardized achievement and intelligence tests, and lack of teacher referral (Ford, 1994, 1996; Frasier, Garcia, & Passow, 1995; Frasier & Passow, 1994). More specifically, test bias, an over-reliance on unidimensional and unimodal tests, ethnocentric definitions and models of giftedness, and a heavy reliance on teacher referral are considered important barriers to the effective and equitable identification of African-American students in gifted education programs and services.

ix
Underachievement among African-American students, including those identified as gifted, is another issue that cannot be ignored when attempting to understand the poor representation of African-American students in gifted education. While several authors (e.g., Whitmore, 1980) have examined underachievement among gifted students, the majority have not included African-American students in their sample. Further, if African-American students are represented in the sample, comparative analyses relative to race have not been addressed.
This study was designed to fill a void in the literature by exploring the many
factors that contribute to both the under-representation of African-American students in gifted education and their underachievement. One hundred and fifty-two African-American students in grades 6 through 9 were surveyed regarding their perceptions of factors that negatively or positively affect their achievement. Variables under investigation included: test anxiety; attitudes toward school and perceptions of the learning environment; attitudes toward school subjects; racial/ethnic identity; and students' perceptions of social, psychological, and cultural factors affecting their achievement or underachievement.
Procedures
Sampling This sample of African-American students was drawn from mid-Atlantic school
districts. School districts ranged in size from approximately 2,000 students to more than 75,000 students. Three school districts were urban districts and two were rural.
Gifted African-American students are under-represented in the five school
districts. The discrepancies across the five districts ranged from a "low" of 53% (district 3) to 83% (district 1). Forty-four students (29%) in the sample were formally identified as gifted by their respective school district. The school districts varied in the types of giftedness identified and served, and in their identification criteria. Some districts used assessment measurements not traditionally used in gifted education (e.g., Raven's Matrices Analogies Test), while others relied on traditional measures (e.g., Wechsler Intelligence Scale for Children, Otis-Lennon Scale of Ability Test). All districts reported gathering multiple sources and types of information during the identification process.
Because so few gifted African-American students were identified in the districts,
the researcher examined school records (GPA and achievement test scores) for high potential students. Sixty-seven students (45%) were categorized as "potentially gifted" by the researcher based on the following criteria:
1. One Iowa Test of Basic Skills (ITBS) subscale at or above the 90th
percentile, or 2. Two ITBS subscales at or above the 80th percentile, or

x
3. Three ITBS subscales at or above the 70th percentile and GPA equal to or greater than 3.0, or
4. Four ITBS subscales at or above the 60th percentile and GPA equal to or greater than 3.3.
Test scores were not available for three students, resulting in a sample size of 149
when comparisons are made across the six groups. When comparisons across the six groups are not made, the responses of all 152 students are examined.
Research Questions
This descriptive and exploratory study addresses the general research questions:
What factors contribute to the under-representation of African-American students in gifted programs? What factors contribute to underachievement among African-American students in different academic groups (i.e., gifted, potentially gifted, and average)?
I. To what extent have African-American students been overlooked for
placement in gifted education programs and services? II. What variables distinguish achievers from underachievers in the African-
American students sampled? In essence, what factors contribute to academic achievement among these African-American students?
1. What behavioral and attitudinal indices help to explain
achievement and underachievement among gifted, potentially gifted, and average African-American students? How do these behaviors and attitudes differ among gifted achievers, gifted underachievers, potentially gifted achievers, potentially gifted underachievers, average achievers, and average underachievers?
2. What are the African-American students' perceptions of achievement and gifted education? How do these perceptions differ among gifted achievers, gifted underachievers, potentially gifted achievers, potentially gifted underachievers, average achievers, and average underachievers?
3. How do the African-American students perceive their peer relationships, specifically peer pressures and achievement orientation? How do these perceptions differ relative to the six groups of achievers and underachievers?
4. What are the African-American students' perceptions of social injustices relative to African-Americans? Do the perceptions differ by the six groups of achievers and underachievers?
5. How do the African-American students perceive their parents' achievement orientation, and to what extent are there differences between the six groups of achievers and underachievers?
6. What are students' perceptions of psychological variables and how do these perceptions differ among the six groups of achievers and underachievers?

xi
III. Can profiles of achievement and underachievement be developed based on the variables under investigation? Which variables are most effective at discriminating achievers from underachievers who are gifted, potentially gifted, or average?
Instrumentation
The survey instrument contained a socio-demographic section and four scales.
Most of the scales had subscales. The survey also contained additional items that examined students' achievement behaviors and attitudes. These items did not belong to any scale or subscale; rather they provided additional data and insight into students' responses. Sample items: "How important is school to you?" "How much time do you spend watching TV?" "I would prefer to be in a regular school program than be in a gifted program"; "Gifted programs are for nerds and teachers' pets"; "What do your teachers say about your effort in school?"
The first scale (Self-Perceptions of Factors Affecting Black Student Achievement
Scale) was adapted from an earlier study by Ford (1991). The revised survey contains 16 additional items which addresses family factors, peer factors, and school factors. No other modifications were made to the original instrument.
The Racial Identity Scale for Black Students assessed students' racial identity
development. The scale was adapted from instruments developed by Phinney (1989) and Parham and Helms (1985). The revised scale contained 24 items and had a reliability coefficient of .72.
The Estes Attitudes Scales was administered to assess students' attitudes toward
school subjects. There are a total of 52 items. This instrument contains subscales for math, reading, English, science, and social studies. Subscale reliability coefficients ranged from .88 to .92.
The Learning Environment Scale for Black Students, which assessed students'
perceptions of the classroom environment, consisted of 36 4-point Likert-types items. Five subscales assess students' perceptions of student-teacher relationships, opportunity to understand the material, teacher attitude about teaching, the extent to which they find school engaging (i.e., interesting or stimulating), and the socio-emotional or affective climate of classrooms. The reliability coefficient for the total subscale was .93.
The final scale was adapted from the Test Anxiety Scale (TAS) (Sarason &
Mandler, 1952) which contains 30 items that measure general debilitative test anxiety. The original TAS asks students to respond in a true-false format. The modified version used in this study asks students to respond to a 4-point Likert-type format, ranging from strongly disagree to strongly agree. The instrument has four subscales—self-evaluation, worry, physiological reactions, and concerns about time limits or constraints. The reliability coefficient for the total TAS was .91.

xii
Data Collection Six research assistants (all African-American, 3 males, 3 females) were trained to
interview students. Interviews were conducted on a one-to-one basis. Interviewers read items to students and recorded students' responses onto the questionnaire. Interviews were held during school hours. Total administration time ranged from 60 to 90 minutes per student. This time varied by students' desire to go into detail in explaining their responses to part 2 of the Self-Perceptions of Factors Affecting Black Student Achievement Scale. All efforts were made to keep the administration time brief, and to return students as quickly as possible to their regular schedules. School achievement data were collected from school personnel and records.
Data Analyses
Descriptive analyses, comparative analyses (e.g., MANOVAs, ANOVAs, Chi-
squares), correlations, regression analysis, and discriminant analysis were used to examine the research questions. The model under investigation is 3x2 (three academic groups by two achievement levels), which results in six groups of students: gifted achievers, gifted underachievers, potentially gifted achievers, potentially gifted underachievers, average achievers, and average underachievers. As stated earlier, test scores were not available for three students, resulting in comparisons for 149 students for some analyses.
Summary of Results 1. In every school district involved in this study, African-American students
were under-represented in the gifted education program. 2. The mean GPA for the sample is relatively high (3.1). Significant
differences were found in the GPAs of the achievers and underachievers. 3. ITBS subscale scores ranged from a low of the 62nd percentile for
vocabulary to a high of the 73rd percentile for science for the six groups. 4. Overall test anxiety, while relatively low for the sample, is problematic
when one examines the self-evaluation and physiological subscales. 5. Of the African-American students sampled, 42% were underachieving
based on the discrepancy between test scores and GPA. 6. In general, the African-American students hold positive attitudes toward
school and the learning environment. 7. In general, the African-American students are positive about school
subjects. 8. The students sampled tend to have positive perceptions of gifted students
and gifted education. 9. The African-American students hold strong, positive support for tenets of
the achievement ideology. 10. Despite the strong belief in principles of the achievement ideology, there
was a discrepancy between achievement attitudes and achievement

xiii
behaviors. Specifically, achievement behaviors do not match achievement attitudes.
11. Students expressed few psychological concerns. They reported few worries, anxieties, stressors, and concerns that can negatively influence their achievement.
12. The African-American students sampled, regardless of achievement level and academic group, held strong, positive racial identities.
13. The African-American students tended to express few concerns about social injustices.
14. Students, regardless of academic group and achievement level, expressed few concerns regarding peer pressures and relationships.
15. Students expressed strong, positive family achievement orientations, regardless of achievement level and academic group.
Conclusions and Recommendations Few studies have been conducted with African-American students in different
academic groups and achievement levels. The present study examined the attitudes and perceptions of African-American middle and high school students. The study of students' perceptions represents an important field of research, particularly as perceptions inform decisions and behaviors. Perceptions are reality to those holding the beliefs; thus, school personnel can ill-afford to ignore the thoughts and views of its minority students. Much can be done to increase the participation of African-American students in gifted education, as well as increase their achievement. The following section summarizes the recommendations based on the results:
1. In this study, 45% of the students were identified as potentially gifted. 2. Identifying African-American students as gifted may be difficult due to
low achievement test scores and underachievement. 3. There was a discrepancy between students' achievement ideology (which
is high) and achievement behaviors (which are low). 4. Students report high and positive family values regarding achievement and
success. 5. School personnel must explore those aspects of the learning environment
that inhibit students' achievement. 6. Self-perceptions (self-concept, self-esteem, and racial identity) play a
significant role in student achievement.
xiv
References Ford, D. Y. (1991). Self-perceptions of social, psychological, and cultural
determinants of achievement among gifted Black students: A paradox of underachievement. Unpublished doctoral dissertation, Cleveland State University, Cleveland, OH.
Ford, D. Y. (1992). Determinants of underachievement as perceived by gifted,
above-average, and average Black students. Roeper Review, 14, 130-136. Ford, D. Y. (1993). An investigation into the paradox of underachievement
among gifted Black students. Roeper Review, 16, 78-84. Ford, D. Y. (1994). Promoting achievement among gifted Black students: The
efficacy of new definitions and identification practices. Urban Education, 29, 202-229. Ford, D. Y. (1996). Reversing underachievement among gifted Black students:
Promising practices and programs. New York: Teachers College Press. Frasier, M. M., Garcia, J. H., & Passow, A. H. (1995). A review of assessment
issues in gifted education and their implications for identifying gifted minority students (RM95204). Storrs, CT: University of Connecticut, The National Research Center on the Gifted and Talented.
Frasier, M. M., & Passow, A. H. (1994). Toward a new paradigm for identifying
talent potential (Research Monograph 94112). Storrs, CT: University of Connecticut, The National Research Center on the Gifted and Talented.
Hollingworth, L. S. (1940). Old heads on young shoulders. Public Addresses
(pp. 104-110). Lancaster, PA. Parham, T. A., & Helms, J. E. (1985). Relation of racial identity attitudes to self-
actualization and affective states of black students. Journal of Counseling Psychology, 32(3), 431-440.
Sarason, S. B., & Mandler, G. (1952). Some correlates of test anxiety. Journal
of Abnormal and Social Psychology, 47, 561-565. U. S. Department of Education. (1993). National excellence: A case for
developing America's talent. Washington, DC: Author. Whitmore, J. R. (1980). Giftedness, conflict, and underachievement. Boston:
Allyn & Bacon.

xv
Table of Contents ABSTRACT v EXECUTIVE SUMMARY vii CHAPTER 1: Introduction and Overview of the Study 1 Factors Affecting African-American Student Achievement 2 Goals and Objectives 3 Significance of the Research 3 Research Design and Methodology 4 Research Questions 5 Review of the Literature 6 Test Anxiety: An Overview 6 Test Anxiety, Test Performance, and Academic Achievement 9 Test Anxiety Among African-American Students 9 Learning Environment and Achievement 10 Social, Psychological, and Cultural Factors Affecting Achievement 11 Social Factors—Injustices/Peer Relationships and Pressures 11 Psychological Factors 12 Racial Identity and African-American Student Achievement 13 Cultural Factors—Family Achievement Orientation 15 CHAPTER 2: Procedures 17 Sampling 17 Research Questions 20 Data Collection 21 Instrumentation 22 Psychological Subscale 22 Social Subscale—Social Injustices 23 Social Subscale—Peer Relationships and Pressures 23 Cultural Subscale—Family Achievement Orientation 24 Achievement Ideology Subscale 24 Data Analyses 25 CHAPTER 3: Results 27 Demographic Information 27 Comparative Results by Academic Group and Achievement Level 27 Underachievement 27 Grade Point Average 28 Achievement Test Scores 29 Test Anxiety 30 Indices of Achievement Attitudes and Behaviors 30 What Do Your Teachers Say About Your Effort in School? 31 Time Spent on Homework Each Day 31 Do You Spend More Time Watching TV Than Studying? 32

xvi
Table of Contents (continued) Do You Spend More Time Doing Homework Than Playing and Hanging Out With Your Friends? 32 Perceptions of Gifted Education and Students 32 Support for the Achievement Ideology 32 Perceptions of the Learning Environment 33 Attitudes Toward School Subjects 33 Racial Identity 38 Psychological, Social, and Cultural Variables 38 Perceptions of Psychological Variables 38 Perceptions of Social Variables—Injustices 38 Perceptions of Social Variables—Peer Relationships and Pressures 39 Perceptions of Cultural Variables—Family Achievement Orientation 39 Profiles of Achievement and Underachievement 40 Summary of Results 42 CHAPTER 4: Conclusions and Recommendations 45 Limitations of the Study 49 Directions for Further Research 50 A Final Word 50 References 53 Appendix Instrumentation 61

xvii
List of Tables Table 1 Representation of African-American Students in the Five School Districts
and Their Gifted Education Programs (1995-1996) 19 Table 2 Reliability Coefficients for Scales and Subscales 23 Table 3 Demographic Characteristics of Students by Gender and Academic
Program 28 Table 4 ANOVA Results for the Achievers and Underachievers by Grade Point
Average 28 Table 5 Kruskal-Wallis One-Way ANOVA Results for ITBS Subscale Percentile
Scores Among Gifted, Potentially Gifted, and Average Achievers and Underachievers 29
Table 6 Univariate F-test Results for the Test Anxiety Subscales by Achievers and
Underachievers 31 Table 7 ANOVA Results for the Achievers and Underachievers by Average Hours
Spent on Homework Daily 32 Table 8 Univariate F-test Results for the Learning Environment Subscales by
Achievers and Underachievers 34 Table 9 MANOVA Results for the Estes Subscales by Six Groups 35 Table 10 Pooled Within-Groups Correlations Between Discriminating Variables
and Canonical Discriminant Functions 41


xix
List of Figures Figure 1 Identification Measures Used by the Five School Districts 18 Figure 2 Sample Responses Regarding African-American Students' Perceptions of
Diversity in the Curriculum 36


A Study of Achievement and Underachievement Among Gifted, Potentially Gifted, and Average African-American Students
Donna Y. Ford
The University of Virginia Charlottesville, Virginia
CHAPTER 1: Introduction and Overview of the Study The phenomenon of underachievement is both complex and perplexing,
particularly among gifted youth who, by definition, are expected to excel academically and in life. Yet, educators of the gifted often witness numerous students underachieving and otherwise not working to their potential in school. National Excellence: A Case for Developing America's Talent (U.S. Department of Education, 1993) provides ample evidence of both the failure of America's schools to maximize the potential of gifted students and their failure to identify talent in minority students.
While the term "gifted underachiever" may appear oxymoronic, gifted students
represent from 10 to 20% of high school dropouts (Davis & Rimm, 1989; Lajoie & Shore, 1981; Rumberger, 1987; Whitmore, 1980, 1986). In addition, at least half of all gifted students may be achieving below their potential, and depending upon one's definition of gifted and underachievement, the percentages may be even higher (Ford, 1996). For example, if one adopts a behavioral definition of underachievement, meaning that one points to a discrepancy between ability and effort, many more underachievers may be found. We all know of students whose effort is low, regardless of test scores. Conversely, if one adopts the more conservative view, a psychometric definition, less underachievers may be found.
Education is beset by a multitude of definitions of underachievement, with most
reflecting a discrepancy between some standardized measure of aptitude or achievement and academic performance. At least three issues pose problems for understanding underachievement and African-American students, especially when the definitions are based heavily on psychometric data. First, the psychometric or quantitative nature of these definitions ignores the importance of behavioral aspects of underachievement; underachievement is seldom defined as a function of effort and motivation, even though psychologists often focus on motivation, effort, and perceptions when examining achievement (or lack thereof) (e.g., Ames & Archer, 1988; Maehr, 1984).
Second, the psychometric definitions assume that only students who score high on
a standardized intelligence, ability, or achievement tests, and perform lower than expected in school (e.g., low grades) are underachievers. By implication, these definitions ignore the reality that many capable learners do not perform optimally on standardized instruments, making it difficult to recognize that these students are highly

2
able and underachieving. Just as tests may be invalid and unreliable indices of achievement for some students, they may be invalid and unreliable indices of underachievement.
Third, the various definitions make it difficult to determine whether educators
should assess underachievement by comparing: (1) IQ test scores with grades; (2) IQ test scores with other aptitude or ability test scores; (3) achievement test scores with grades; (4) achievement test scores with ability test scores; (5) ability test scores with grades; or (6) any combination of the preceding five.
A further impediment to educators in understanding underachievement among
African-American students results from overgeneralization across student populations. Characteristics of underachievement found in the educational literature are usually based on studies of White middle-class students, the primary subjects in studies of underachievement. African-American students who do not necessarily manifest achievement in the same way as White students may not be identified as gifted, as underachievers, or as gifted underachievers.
Factors Affecting African-American Student Achievement
Numerous studies and reports have examined poor achievement among African-
American students. However, few studies have explored factors that hinder the motivation and subsequent achievement of gifted or highly able African-American students. In previous research, Ford (1991, 1992, 1993) found that gifted African-American youth perceive social, psychological, and cultural barriers to achievement. Frequently, research on underachieving African-American youth has been conducted in isolation from research on gifted youth, including those identified as underachievers. That is, many studies on underachievers fail to use comparative analyses, such as examining racial differences in underachievement. Further, the studies conducted with gifted students and African-American students often focus on very different issues and barriers to achievement.
Generally speaking, the research on African-American students focuses primarily
on social and environmental variables that place them at risk for underachievement and poor educational outcomes. The most commonly referenced factors associated with high dropout rates, low test scores, and poor grades include low parental education level, living in a single-parent family, low socioeconomic status (SES), English as a second language, and racial minority status. Cultural explanations for poor educational outcomes are also advanced. For instance, cultural deprivation, cultural difference, and cultural conflict theories have been used to explain school-related problems among African-American and other minority students. Differences in achievement orientations, communication styles, behavioral styles, and learning styles, for example, are used to describe low test scores, low grades, and high dropout rates for African-American students.

3
Research on poor achievement among gifted students seldom focuses on the aforementioned risk factors or cultural differences; instead, the influence of socio-emotional and psychological variables are examined. Self-concept, self-esteem, perfectionism, procrastination, poor peer relations, and heightened sensitivity, for example, are considered important barriers to academic achievement among students identified as gifted (e.g., Ford, 1995; Ford, Harris, & Schuerger, 1993; Hollingworth, 1940; USDE, 1993; Whitmore, 1980). In addition to socio-emotional and psychological factors, educational factors play an important role in the academic underachievement of gifted students. For example, gifted students may complain of boredom due to an unchallenging and inappropriate curriculum, and they complain of alienation and isolation from peers and teachers.
Goals and Objectives This study has several objectives: (1) to generate profiles of underachievement
relative to gifted, potentially gifted, and average African-American students in grades 6 through 9; (2) to identify correlates of underachievement (social, cultural, and psychological, racial identity, test anxiety, self and family achievement orientations, perceptions of the learning environment, and attitudes toward school subjects) among African-American youth in different academic groups; (3) to offer recommendations for improving the achievement of African-American students; and (4) to offer recommendations for increasing the representation and participation of African-American students in gifted programs.
Significance of the Research
A paucity of research exists regarding correlates of underachievement among
gifted African-American students, and few studies have examined students' perceptions. There is, however, much research indicating that African-American and other minority youth are severely under-represented in gifted programs, and they are less likely to achieve their potential in school. Specifically, while African-American students comprise 16% of the school population, they comprise only 8% of gifted programs nationally. Callahan (1996) observed that, in many cases, schools have created gifted programs that fail to participate in the full development of talent:
Because we tend to rely on identification procedures that are static and to leave the development of talent to parents and regular classroom teachers, we serve only those who can meet our criteria of giftedness from the onset. (Alamprse & Erlanger, 1988, p. 156) Previous research (Ford, 1992, 1993) has examined social, cultural, and
psychological barriers to achievement as perceived by gifted, potentially gifted, and average African-American students. However, no studies have been found that examine underachievement among gifted African-American youth relative to racial identity, test anxiety, perceptions of the learning environment, and attitudes toward school subjects.

4
Self-perceptions certainly play an important role in inhibiting or enhancing student achievement. There is a need to examine the extent to which these factors inhibit the identification of African-American students as gifted or gifted underachievers, to explain why African-American youth tend to underachieve academically, and to explore reasons for under-representation of African-Americans in gifted programs.
Using both quantitative and qualitative methodologies, Ford (1991, 1992, 1993)
concluded that psychological factors (e.g., fears and anxieties) contributed significantly to underachievement among fifth and sixth graders in a predominantly African-American community. Qualitative (behavioral and attitudinal) indices revealed that, compared to achievers, underachievers:
1. were more concerned with peer pressure and conformity; 2. held an external locus of control whereby they attributed success more
often to teachers and parents than to themselves; 3. believed that social injustices persist and negatively influence
opportunities for achievement; 4. exert less effort in school; 5. were more likely to state that school was a waste of time because they
were bored or unchallenged by the repetition, and that they did not learn much about African-American people;
6. said that they often get nervous during tests, and believed that tests carried too much weight in the assignments of grades; and
7. had lower self-perceptions (e.g., being accused of "acting White" was more bothersome to the underachievers).
Research Design and Methodology
The current study is cross-sectional, descriptive, and exploratory. It was designed
to understand more fully the dynamics of underachievement among gifted, potentially gifted, and average African-American students. These students are in grades 6 through 9 in five mid-Atlantic public school districts. Gifted students are those formally identified by their school district and participating in gifted programs. Two definitions of underachievement were adopted:
1. Traditional model: According to Mandel and Marcus (1988) and others,
underachievers are best identified using a regression model. Therefore, students' standardized achievement test scores (ITBS, grade 42) and grade point averages were used as indices of underachievement. Students whose GPAs deviated one or more standard deviations from the regression line (i.e., predicted GPAs) were defined as underachievers; and
2 The state administers the ITBS to all fourth and eighth grade students. All but three students had fourth grade ITBS scores. Few of the eight and ninth graders had ITBS grade 8 test scores in their files; thus, their fourth grade test scores were used.

5
2. Non-traditional model: Because African-American youth tend not to perform well on standardized tests (e.g., test bias, poor test-taking skills), non-standardized assessment measures were also used to describe underachieving African-American students. Students' achievement behaviors (e.g., studying, homework) and self-reported level of effort in school (a measure of motivation) were assessed. Students reporting low effort and/or poor achievement behaviors were considered underachievers. Eighty percent of the gifted, above-average, and average African-American students surveyed by Ford (1991, 1992) reported low effort, boredom, and disinterest in school.
Test scores should not be the sole or primary criteria for identifying gifted or
underachieving students. Unfortunately, as Callahan (1996) observed regarding identification, "we seem so strongly bound by tradition that often the practice of serving gifted students has lagged far behind the best research, knowledge, and theory of the field of psychology, sociology, and education" (p. 150). Test scores were used in the present study because this was the only data available to the researcher. Parental and school permission to conduct the study included access to test scores and GPAs, but did not include observations of students in their classrooms, homes, or other environments. Understandably, school personnel and parents also expressed concerns regarding interrupting students' school schedule for lengthy periods. The non-traditional model was used to provide additional information on the nature and extent of underachievement among the students. That is, the non-traditional (behavioral and attitudinal) model provided behavioral information regarding students' underachievement.
Research Questions
This descriptive and exploratory study addresses the general research questions:
What factors contribute to the under-representation of African-American students in gifted programs? What factors contribute to underachievement and achievement among African-American students in different academic groups (i.e., gifted, potentially gifted, and average)?
I. To what extent have African-American students been overlooked for
placement in gifted education programs and services? II. What variables distinguish achievers from underachievers in the African-
American students sampled? In essence, what factors contribute to academic underachievement among these African-American students?
1. What behavioral and attitudinal indices help to explain
achievement and underachievement among gifted, potentially gifted, and average students? How do these behaviors and attitudes differ among gifted achievers, gifted underachievers, potentially gifted achievers, potentially gifted underachievers, average achievers, and average underachievers?

6
2. What are the African-American students' attitudes toward achievement and gifted education? How do these perceptions differ among gifted achievers, gifted underachievers, potentially gifted achievers, potentially gifted underachievers, average achievers, and average underachievers?
3. How do the African-American students perceive their peer relationships, specifically peer pressures and achievement orientation? How do these perceptions differ relative to the six groups of achievers and underachievers?
4. What are the African-American students' perceptions of social injustices relative to African-Americans? Do their perceptions differ by the six groups of achievers and underachievers?
5. How do the African-American students perceive their parents' achievement orientation, and to what extent are there differences between the six groups of achievers and underachievers?
6. What are students' perceptions of psychological variables and how do these perceptions differ among the six groups of achievers and underachievers?
III. Can profiles of achievement and underachievement be developed based on
the variables under investigation? Which variables are most effective in discriminating achievers from underachievers who are gifted, potentially gifted, or average?
Review of the Literature This section presents a review of the literature on factors that influence the
presence of African-American students in gifted education programs and the underachievement of African-American students in school nationally. Discussed are such variables as test anxiety, racial identity, the school or learning environment, attitudes toward school subjects, and social, cultural, and psychological factors.
Test Anxiety: An Overview
Factors that hinder the achievement motivation and performance of students have
been given extensive attention in research. One viable area of research is test or evaluative anxiety. Many students suffer from evaluative anxiety. As many as one in five students suffer from test anxiety, which results in some 10 million students who do not perform well in evaluative situations (Hill & Wigfield, 1984; Sarason, Davidson, Lighthall, Waite, & Ruebush, 1960). Numerous studies have assessed the effects of test or evaluation anxiety on test performance. A consistent finding is that test anxiety, defined as a general feeling of uneasiness, nervousness, or physical discomfort experienced in evaluative or testing situations, has a debilitating effect on performance. More specifically, test anxiety is negatively correlated with achievement and test performance—as test anxiety increases, test performance tends to decrease.

7
Test anxiety is a special form of general anxiety that consists of phenomenological, physiological, cognitive, and behavioral responses related to fear of failure (Sarason, 1980). When test anxiety occurs, many cognitive and attentional processes interfere with task performance. Students with high levels of test anxiety experience both worry and emotionality. Worry concerns the cognitive aspect of consequences. Those who worry about tests fear the consequences of evaluation. Emotionality is characterized by stress-evoked autonomic arousal prior to or during evaluative situations. Further, test anxiety is often accompanied by negative self-evaluations, attention to irrelevant information, distraction, poor self-esteem, and low estimates of cognitive ability (Beidel & Turner, 1988). Thus, repeated failure on tests lowers one's sense of self-efficacy.
Hill and Wigfield (1984) report that, in addition to being long-lasting, test anxiety
is often a chronic or debilitating condition. Sarason (1980) considered test anxiety a trait rather than a state factor. Test anxiety is a relatively stable disposition in evaluative situations (Hill, 1972). Thus, anxiety resides within the individual and may or may not be a function of the situation.
Test anxiety develops early in life and exists without regard to ability (Turner,
Beidel, Hughes, & Turner, 1993). Such anxiety is a common source of emotional distress in school-age children, especially among students in upper elementary school (Sarason et al., 1960) and persists throughout schooling and in other settings that are social and evaluative (Achenbach, 1985). The student's social learning history and sociocultural background determine the cues that elicit anxiety in evaluative situations (Willig, Harnisch, Hill, & Maehr, 1983; Wine, 1980). For instance, a child may be tuned, through parental child-rearing practices, to interpret a wide range of environmental cues as evaluatively stressing; equally important, a single but very traumatic experience with a specific teacher and a specific stressful examination may predispose an individual to react with self-devaluing cognitiones, which transfer to high emotionality in similar situations.
Sarason (1980) considered test anxiety a personality characteristic that results
when parents place unrealistic expectations upon children. That is, parental criticism when children fail or do not perform to parental expectations is internalized by children who become more sensitive to failure. These feelings take the form of guilt, anxiety, grief, pain, shame, and other emotions. The failure of parents to provide emotional support to children when in evaluative situations and the failure to reinforce children's self-evaluations result in lower performance.
When children enter school, these concerns are reinforced by teachers and school
practices. Such practices as minimal competency testing, for example, have important consequences for test-anxious students. With minimal competency testing, test performance assumes a more important role in school and children's lives. For instance, the results may determine whether a child is promoted to the next grade or receives a high school diploma (Hill & Wigfield, 1984). Children experience strong apprehension about this type of evaluation and, consequently, may do even less well.

8
Similarly, the increased use of test scores to evaluate school and program effectiveness and greater public demands for high levels of skill learning and achievement in schools create more pressure-laden atmospheres. Test scores are considered the major indicator of school effectiveness, and both students and schools are under pressure to increase standardized test scores. Neill and Medina (1989) reported that 105 million standardized tests were given to 39.8 million students during the 1986-87 school years, an average of 2.5 standardized tests of ability and achievement. They emphasize that this figure does not include the following tests: the National Assessment of Educational Progress, tests for admission to colleges and universities, additional tests used to identify gifted students, and tests given to students with limited English proficiency. In essence, the figure of 105 million is a conservative one.
Issues of testing have important implications for children with evaluative anxiety.
In school settings, children experience increasingly formal, complex, and frequent evaluations, which many cannot cope with effectively (Hill, 1972). During the second grade, for example, children begin to compare their performance to others, which can lead to competition. While some children excel in competitive, comparative situations, others do not. As children progress through school, evaluations, particularly comparative evaluations, increase. This increase is accompanied by higher levels of anxiety and may hinder students' motivation.
Given the heavy reliance placed on test scores and comparative evaluations by
schools, reformers, and policymakers, it is little wonder that test anxiety is one of the most researched of anxieties. Crocker, Schmitt, and Tang (1988) describe a never-ending loop in which test performance is increasingly hindered by one's rising levels of test anxiety. This anxiety can be attributed to intense pressures placed on students by teachers; similarly, teachers are pressured by administrators to improve test scores. Factors in the educational system are significant in test anxiety, including the heavy emphasis placed on testing, test preparation, and teachers' handling of testing sessions.
In sum, test anxiety research indicates that: (1) test-anxious persons are generally
more self-focused and self-preoccupied than less anxious persons (e.g., test-anxious students view the testing process as a personal evaluation of themselves and perceive their self-worth is being assessed by the test results); (2) test-anxious persons are more sensitive to external evaluation than other students, even when the same feedback is given; (3) task-irrelevant cognitiones interfere with the performance of test-anxious persons; and (4) test anxiety consists of cognitive and physiological components; the cognitive (self-worry) component interferes most directly with cognitive performance and triggers physiological reactivity (e.g., Sarason et al., 1960).
Despite the large volume of research on test anxiety, comparatively few studies
have focused on school-age children. Instead, most studies focus on adults (Tryon, 1980). Equally important, few studies have focused on African-American students (Rhone, 1986). No studies were found that focused on gifted students and test anxiety.

9
Test Anxiety, Test Performance, and Academic Achievement Most studies of test anxiety have focused on intelligence and aptitude tests rather
than achievement tests and school performance (Crocker et al., 1988). The most generally accepted explanation for the influence of test anxiety on test and school performance is ineffective cognitive strategies and attentional deficits. Highly test-anxious students experience emotional blocks, deficient information processing, extreme concern over somatic cues, and misinterpretation of information (Dusek, 1980; Dusek, Kermis, & Mergler, 1975; Leon, 1989).
A few studies have examined test anxiety and achievement test scores. While
results are mixed, some consistencies are evident. Low negative correlations between achievement tests and test anxiety have been found for elementary and secondary school students (Bauermeister & Berlingeri, 1974). That is, low test-anxious students tend to perform better on standardized achievement tests than high test-anxious students, particularly for grades three through 12. Rarely do high test-anxious students achieve at higher levels than low test-anxious ones.
Hill and Sarason (1966) reported a negative relationship between test anxiety and
achievement test scores among 700 students. Further, test anxiety increased with grade level. The relationship between test anxiety and achievement test scores was negligible for students in the first grade; for third graders, a statistically significant modest correlation of -.25 was found; by fifth and sixth grades, the correlations were moderate and highly significant (-.45). Hill (1972) reported correlations of -.60 for eleventh graders. Test scores also related negatively to IQ scores, GPAs, and non-promotion to the next grade level (Hill & Wigfield, 1984).
Other findings indicate that the test and academic performance of test-anxious
students are negatively affected by time constraints, the presence of an adult observer, and evaluative pressures (e.g., the introduction of a task as evaluative rather than non-evaluative) (Hill & Wigfield, 1984).
Test Anxiety Among African-American Students
A limited number of studies have focused specifically on test anxiety among
African-American students, and research has been sporadic, most of it written during the 1970s. Only one study was located that focused on test anxiety among African-American students during the 1990s (see Turner et al., 1993). The study of test anxiety among African-American students is particularly important given that these students have among the lowest standardized test scores nationally. Low test scores have contributed to the over-representation of African-American students in special education programs, and their under-representation in gifted education (Ford, 1994a; Ford & Webb, 1995; Harris & Ford, 1991). Specifically, the vast majority of states and school districts rely solely or exclusively on standardized intelligence and achievement tests to place students in gifted education (Frasier, Garcia, & Passow, 1995). Students who do not perform well on such

10
tests are unlikely to be placed in gifted education programs and unlikely to be identified as underachievers.
Several researchers have attributed the lower performance of minority students on
standardized tests to test anxiety. It has also been argued that test performance operates differently for African-American and White students (Payne, Smith, & Payne, 1983). Hembree (1988) and Clawson, Firment, and Trower (1989) found that African-American children had significantly higher test anxiety than White children. Crocker et al. (1988) examined the relationship between test anxiety and performance on the Metropolitan Achievement Test. Results indicate that African-American students had significantly higher levels of test anxiety than White students. Willig et al. (1983) found a strong negative relationship between test anxiety and performance among White, Hispanic, and African-American students in upper elementary and junior high school. Turner et al. (1993) studied test anxiety, self-concept, achievement, and social functioning among African-American students. Results indicated that 41% of the students studied suffered from test anxiety. These students tended to have lower levels of achievement, lower self-concepts, and a lower sense of self-worth than students not reporting test anxiety.
Learning Environment and Achievement
This section addresses factors affecting African-American students in classrooms,
with particular attention given to feelings of alienation. Educators, psychologists, and sociologists have searched diligently for school factors associated with academic achievement and motivation. Bronfenbrenner (1979) contended that poor achievement among African-American students results, in part, from the sense of alienation they feel in school. Bronfenbrenner defined alienation as the feeling of disconnectedness from social settings such that the individual views his or her relationship to the social context as no longer tenable. Rumberger (1983, 1987, 1995) has repeatedly found that alienation from school plays a major role in the decision of students to drop out of school. The issue of alienation is important for all students, but may be particularly relevant for students of color.
Calabrese and Poe (1990), Felice (1981), Richardson and Gerlach (1980), and
Rumberger (1983, 1987) identified numerous school factors that contribute to high dropout rates and alienation among African-American students. Collectively, their definitions of alienation include a sense of impotence, isolation, normlessness, a refusal to accept prevailing norms, and a lack of meaning found in school. This sense of fragmentation and estrangement manifests itself in poor attitudes toward school, cutting class, hostile behavior, dropping out, and other forms of passive and active resistance. African-American students who feel understood, accepted, and respected by their teachers are likely to have positive relationships with teachers; in turn, positive relations increase teachers' expectations and students' motivation and achievement (Irvine, 1991; Phelan, Yu, & Davidson, 1994).
The quality of teacher-student relationships is especially important for African-
American students for several reasons. African-American students are likely to be taught

11
by White teachers, even in urban school districts, and an ever-increasing cultural gap between African-American students and teachers, the vast majority of whom are White females (76%), is evolving (Darling-Hammond, 1994). African-American teachers comprise only 6% of teachers, and the percentage is projected to decrease. These data are important to consider given that few teachers have received substantive preparation in multicultural education, few teachers are trained to examine their own biases and stereotypes regarding African-American students, and few teachers live in the neighborhoods in which they teach (e.g., Darling-Hammond, 1994; Ladson-Billings, 1994). These factors can contribute to a lack of understanding of, appreciation of, and respect for cultural differences on the part of teachers. They may also contribute to low teacher expectations and the low referral rates of African-American students for gifted education programs (Ford, 1994a, 1994b, 1996; Ford & Webb, 1995).
In short, many factors affect the learning environment—curriculum, student-
teacher relationships, teacher attitudes, teacher expectations, and the affective climate. These variables, in turn, may affect student achievement.
Social, Psychological, and Cultural Factors Affecting Achievement
Social Factors—Injustices/Peer Relationships and Pressures
Such social forces as discrimination, prejudice, and economic deprivation hinder
the motivation and academic achievement of African-American students (Felice, 1981; Howard & Hammond, 1985; Ponterotto & Pedersen, 1993; Taylor, Casten, Flickinger, Roberts, & Fulmore, 1994), and hence, may contribute to their under-representation in gifted education programs (Ford, 1996). Social inequities are important sources of vulnerability for African-American youth who, when confronted with racism and discrimination, may develop an oppositional social identity (Ogbu, 1987). They may deliberately perform poorly in school, rebel against authority figures (e.g., teachers and school administrators) who are perceived as agents of oppression, and resist any behavior associated with mainstream society. African-American students perceive the social and economic opportunity structure more negatively than White students. They are less confident that hard work, effort, and academic success will result in receiving occupational and fiscal rewards commensurate with their educational credentials. Many are disillusioned about the value of schooling, and see schooling as a "subtractive process" in which they must sacrifice something of their sense of identity to achieve. Consequently, some African-American students make a conscious decision to not expend energy or effort unnecessarily. If certain school variables (e.g., student-teacher relations, teacher expectations and attitudes, evaluation practices) convince African-American students that they are not benefiting from school, they will come to see futility in staying in school or exerting high effort.
Unlike White students, minority groups also face certain social injustices. Social
injustices (discrimination and prejudice) against people of color are manifested in many ways and in many contexts. Minority groups continue to face job discrimination (e.g., hiring practices, glass ceilings, salaries), housing discrimination, and discrimination in

12
educational settings. Nationally, schools and college campuses are witnessing increasing racial tensions, not only among students but between students and faculty. Whatever form social injustices take, they have a detrimental impact on minority groups, including their achievement, motivation, and self-perception.
Peers, another social factor, also have a powerful influence on African-American
students' achievement behaviors and attitudes. Fordham's (1988, 1991, 1996) and Ford's (1992, 1993, 1996) research indicate that successful or gifted African-American students may be accused by other African-American students of "acting White." This anti-achievement ethic takes a psychological toll on the achievement motivation of African-American students, resulting in a conflict between their need for achievement and need for affiliation. In many instances, as Phelan and colleagues (1994) also found, peer allegiance often takes precedence in the lives of minority students. Thus, peer pressures can influence significantly their academic, as well as socio-emotional and psychological well-being.
Psychological Factors
Although all youth are at risk for psychological vulnerability, educators have
associated such vulnerability with certain characteristics of giftedness, which may lead to problem behaviors and academic underachievement, particularly in highly gifted students (Whitmore, 1980, 1986). For example, students who feel different from, alienated from, and unaccepted by others may become withdrawn, extroverted, aggressive, or disruptive. This confusion and sense of not belonging contributes significantly to psychological and socio-emotional difficulties among gifted African-American students (Ford, Harris, & Schuerger, 1993).
Gifted students may also suffer self-esteem and self-image problems. Dirkes
(1985) reported that some gifted students have a low sense of self-adequacy, feelings of isolation and self-contempt, and an external locus of control whereby they attribute success to luck, fate, or chance. Gross (1985) contended that gifted students often face the dilemma of choosing to satisfy their drive for excellence at the risk of sacrificing relationships with their peers. If friendship is more important to them, gifted students may choose to underachieve to avoid feelings of isolation; thus, gifted students who are forced to choose between their need for achievement and need for affiliation may sacrifice their "gift" to gain social acceptance.
Ford, Harris, and Schuerger (1993), Smith (1985, 1989), Spencer (1985) and
others also proposed that, for African-American youth, racial identity has a significant impact on achievement and attitudes toward school. For example, in the earlier stages of racial identity development (Cross, 1995; Phinney, 1989), African-American youth may deliberately underachieve and choose not to participate in gifted programs to avoid peer pressures and accusations that they are "acting White," or they may camouflage their abilities be accepted socially (Fordham, 1988, 1991, 1996; Fordham & Ogbu, 1986).

13
Racial Identity and African-American Student Achievement Self-perceptions play a powerful role in student achievement. Most often,
researchers have studied self-concept and self-esteem relative to student achievement. For minority students, an important variable worthy of investigation is racial identity.
Race affects one's socio-emotional and psychological health in significant ways
because the complexity of identity development increases as a function of color and physical features. Smith (1989) maintained that racial identity development is a process of coming to terms with one's racial group membership as a salient reference group. Rotheram and Phinney (1987) defined self-identification as the accurate and consistent use of an ethnic label, based on the perception and conception of belonging to an ethnic group. The issue of race may be more salient for African-Americans than any other group. For instance, White Americans are much less likely to experience the chronic stress and problems associated with racial identity because the color of their skin is not a barrier to success.
In his revised model of racial identity, Cross (1995) described more completely
how African-Americans progress and regress in the process of becoming afrocentric. According to the model, African-Americans in stage 1 (Pre-Encounter) hold one of at least three attitudes toward race: (a) low-salience attitudes, (b) social stigma attitudes, and (c) anti-Black attitudes. Those holding a low-salience attitude do not deny being physically Black but they consider their blackness as having an insignificant role in their daily lives, their well-being, or how they define themselves. Cross contends that these individuals are unlikely to give much thought to race issues, and appear unaware of such problems. Overall, they view themselves as "human beings who just happen to be Black" (p. 98). African-Americans who hold social stigma attitudes not only have low-salience attitudes, they see their racial orientation as something to be ashamed of and negotiated. By default, race is attributed some significance, but not in the positive sense. Anti-Black attitudes constitute the third and most extreme type of pre-encounter individual. Such persons see their racial status as negative, they loathe other African-Americans, feel alienated from other African-Americans, and do not perceive the African-American community as a potential resource or support base.
All three pre-encounter types favor European cultural perspectives, such as
beauty, art, communication modes, and academic preferences. In essence, many have been socialized to be bicultural, but they do not necessarily hold pluralistic and multicultural notions. Some, for instance, may consider multicultural education to be unnecessary, wasteful, or inferior (Cross, 1995).
In stage 2 (Encounter), the individual experiences an "identity metamorphosis" (p.
104) in which a major event or series of events induces cognitive dissonance. These events, either positive or negative, tear away at the person's pre-encounter attitudes and pushes them toward an increased awareness of their status as a racial being. The encounter, therefore, results in great guilt, anger, uncertainty, or anxiety for having

14
previously minimized or denied the significance of race. Similarly, they feel anxious upon realizing that there is another level of blackness to which they should aspire.
Stage 3 (Immersion-Emersion) represents what Cross (1995) refers to as the
"vortex of psychological Nigrescence" (p. 106). African-Americans in this stage begin to rid themselves of their raceless identities and begin constructing their new frame of reference. Yet, this stage is also characterized by anxiety, primarily about becoming the "right kind of Black person" (p. 106). Equally problematic, all that is White is perceived as evil, oppressive, and inhuman, while all that is Black is proclaimed superior.
In the immersion phase, African-Americans immerse themselves in the world of
blackness. For example, they attend political or cultural meetings that focus on Black issues, along with issues of justice and equity. Cross described this stage as being energized by rage, guilt, and a developing sense of pride. The individual accepts him- or herself as a racial being. A common theme is selflessness, dedication, and commitment to Blacks. They may experience creative, inspirational bursts of energy that communicate the richness of their racial heritage. Taken to the extreme, African-Americans in the immersion stage have difficulty controlling the impulse to confront White authority figures, even on a life-or-death basis. That is, the threat of death is not feared.
In the emersion phase, there is a marked decline in racist and emotional attitudes.
This leveling off occurs when African-Americans encounter a role model, for instance, who displays a more sophisticated and calmer personae. Through role models, African-Americans learn to substitute romantic and romanticized notions of blackness with a deeper and more serious understanding of Black issues.
The fourth stage (Internalization) is marked by the integration of a new identity,
an identity that is more authentic and naturalistic. This identity includes high salience to blackness, which can take on several manifestations, including biculturalism. An internalized identity serves several functions: (a) to defend and protect the persons from psychological problems associated with living in a society where race matters; (b) to provide a sense of belonging and social affiliation; and (c) to provide a basis for interacting and communicating with people, cultures, and situations beyond the world of blackness (Cross, 1995).
The fifth and final stage (Internalization-Commitment) is characterized as action
oriented. Here, African-Americans devote much time and energy, perhaps a lifetime, finding ways to translate their personal sense of blackness into a plan of action, a commitment to Black affairs and improving the circumstances of African-Americans.
Although a stage model, Cross (1995) acknowledges that individuals can regress
or get stuck at one stage. Whether they regress, become stuck, or progress through the stages of racial identity depends, in large part, on the individual's personality, support base, resources, and experiences. For example, Black children and adults in predominantly White settings may experience more negative racial encounters than those

15
in predominantly Black settings. They may also experience such encounters at an earlier age than Blacks in predominantly Black settings.
It is hypothesized that one's stage of racial identity may be related to achievement
(Ford, Harris, & Schuerger, 1993). Specifically, there may be a curvilinear relationship between racial identity and achievement, with those in the earliest stage (pre-encounter) and those in the last stages (internalization and internalization-commitment) having the highest achievement orientation. Achievement orientations and academic performance may be similar between those in the different stages (earliest vs. latest), but the extent to which the individual will be perceived as "acting White" or "selling out" is different. Pre-encounter individuals, because of their low-salience or anti-Black attitudes, are likely to rejected by the Black community; immersion-emersion and commitment individuals, because of their strong and positive racial identification, bicultural stance, and pluralistic perspectives, are more likely to be accepted by members of the Black community. Individuals in the middle stages of racial identity appear so subsumed with finding their identity that academic achievement may have low significance in their lives.
Cultural Factors—Family Achievement Orientation
Several studies have examined underachievement relative to parental educational
level, marital status, and SES. However, these studies present a limited picture of poor achievement among African-American students because they often fail to look beyond such demographic variables to the values that parents place on academic achievement. Clark (1983) conducted one of very few studies that went beyond exploring the impact of family structure, SES, and educational levels on African-American students' achievement. He examined process variables (the impact of family achievement orientation on student achievement) and found that high parental expectations can mitigate the negative effects of living in poverty and other situations that place students at risk for poor educational outcomes.
The changing demographics and family structures, particularly among minority
parents, have resulted in increasing national interest in the role of minority parents in the education of their children. The effect of single-family configuration on children's academic well-being has received much attention, with researchers attributing the educational and socio-emotional outcomes of children primarily to parents' marital status, educational level, and socio-economic status.
Similarly, while it cannot be denied that economic distress is associated with
children's academic achievement, research also indicates that many African-American families are resilient (Clark, 1983; Ford, 1993, 1996; Lee, 1984; MacLeod, 1987; Prom-Jackson, Johnson, & Wallace, 1987). These families are characterized by strong achievement orientations—strong beliefs in the achievement ideology, involvement in schooling, and high expectations and aspirations for their children. These family orientations mitigate the effects of single-parent status and associated difficulties. The combined results highlight the importance of looking beyond family structure solely or exclusively in understanding African-American student achievement and

16
underachievement. Instead, the studies suggest the need to examine African-American student achievement in the context of family values and beliefs. Stated differently, attributing children's outcomes primarily to family structure ignores the multiple contexts within which children are socialized. Such attributions ignore or minimize accumulating research on resilience in African-American families; and they ignore or disregard the critical role that family values can play in students' achievement. In light of these shortcomings and the different findings found in dated versus contemporary research, more studies are needed that explore family values and their impact on minority students' achievement.

17
CHAPTER 2: Procedures
Sampling This study, which is exploratory and descriptive, took place in 1995. School
personnel in six mid-Atlantic school districts were contacted for the names of African-American students identified as gifted, and copies of the school district's identification criteria and procedures. One district declined to participate. The school districts were chosen because of their relatively large percentage of African-American students, and because they identify and serve gifted students.
African-American students represent 27% of students in the state. African-
American students represent 12% of school district 1; African-American students represent 49% of school district 2; they comprise 23% of school district 3. School district 4 has a 64% African-American student population. School district 5 is comprised of 23% African-American students. School districts ranged in size from approximately 2,000 students total to more than 75,000 students total. Three school districts were urban districts and two were rural.
In school district 1, gifted students are identified only in the general intellectual
area. An identification/placement committee recommends placement based on one of two criteria: (1) test scores in the 95th percentile or above on the Otis-Lennon School Ability Test (OLSAT) or other designated ability measure, and documented strengths in two other areas (e.g., creativity, problem-solving, critical thinking, performance) or (2) test scores below the 95th percentile, with documented strengths in all four areas. African-American students comprise 12% of the school population, but 2% of the gifted program in this district.
The remaining school districts are less specific in describing how placement
decisions are made. In school district 2, students are identified in the general intellectual, special academic, and visual and performing arts areas. An identification/placement committee bases placement decisions on information listed in Figure 1. African-American students represent 49% of the school population, but 15% of the gifted program in district 2.
School district 3 identifies three areas of giftedness—general intellectual, specific
academic, and visual and performing arts. The identification/placement committee bases its decisions on information presented in Figure 1. As Table 1 illustrates, African-American students comprise 23% of the school district, but 10% of the gifted program. At the time of this study, no gifted African-American students had been identified in grades 6 through 9.
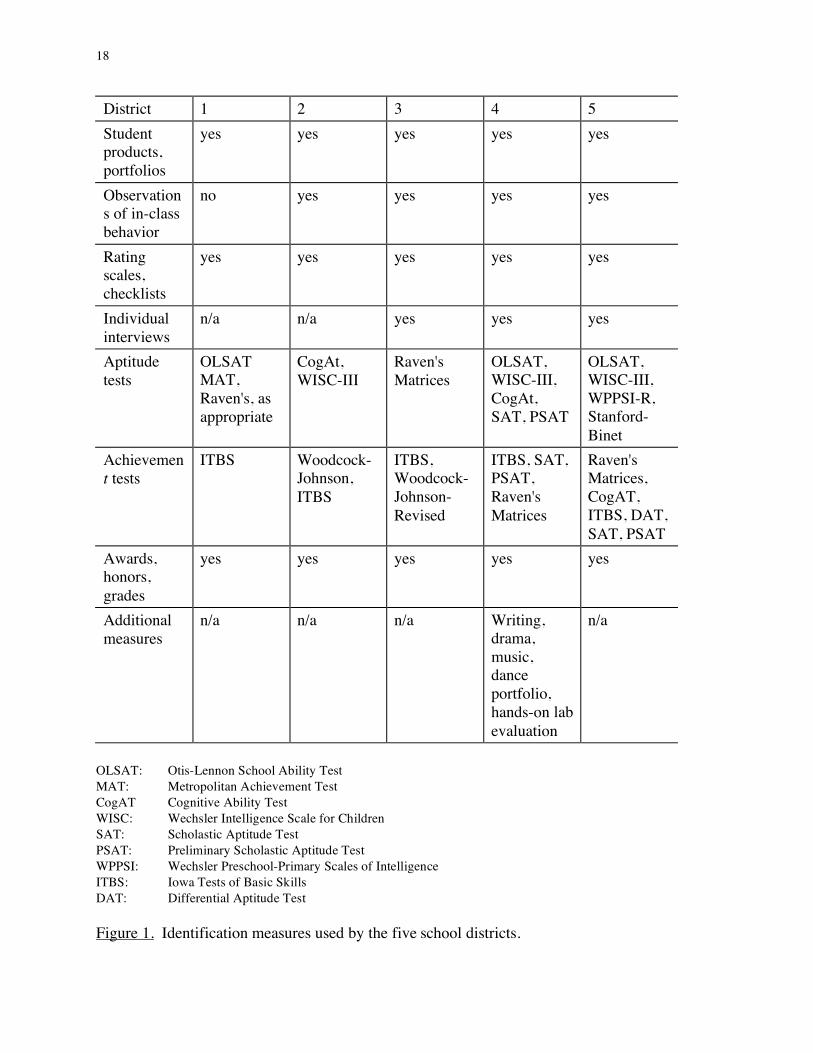
18
District 1 2 3 4 5 Student products, portfolios
yes yes yes yes yes
Observations of in-class behavior
no yes yes yes yes
Rating scales, checklists
yes yes yes yes yes
Individual interviews
n/a n/a yes yes yes
Aptitude tests
OLSAT MAT, Raven's, as appropriate
CogAt, WISC-III
Raven's Matrices
OLSAT, WISC-III, CogAt, SAT, PSAT
OLSAT, WISC-III, WPPSI-R, Stanford-Binet
Achievement tests
ITBS Woodcock-Johnson, ITBS
ITBS, Woodcock-Johnson-Revised
ITBS, SAT, PSAT, Raven's Matrices
Raven's Matrices, CogAT, ITBS, DAT, SAT, PSAT
Awards, honors, grades
yes yes yes yes yes
Additional measures
n/a n/a n/a Writing, drama, music, dance portfolio, hands-on lab evaluation
n/a
OLSAT: Otis-Lennon School Ability Test MAT: Metropolitan Achievement Test CogAT Cognitive Ability Test WISC: Wechsler Intelligence Scale for Children SAT: Scholastic Aptitude Test PSAT: Preliminary Scholastic Aptitude Test WPPSI: Wechsler Preschool-Primary Scales of Intelligence ITBS: Iowa Tests of Basic Skills DAT: Differential Aptitude Test Figure 1. Identification measures used by the five school districts.

19
Table 1 Representation of African-American Students in the Five School Districts and Their Gifted Education Programs (1995-1996) School District Percentage of
African-American Students
Percentage of Identified Gifted African-American Students
Percentage of Discrepancy
1 12 2 83
2 49 15 69
3 23 10a 57
4 64 30 53
5 23 8b 65 Note. aNo African-American students were identified as gifted in grades 6 to 9 in this district. bMost of the students interviewed in this district were identified in visual and performing arts.
School district 4 identifies students in general intellectual, specific academic,
technical/practical arts, and visual and/or performing arts. Like the other districts, a committee determines placement. In this district, African-American students represent 64% of the school population, but 30% of the gifted program.
In school district 5, three areas of giftedness are served—general intellectual,
specific academic, and visual and performing arts (see Table 1). A committee determines placement of gifted students. Similar to the other four districts, African-American students are under-represented in the gifted program; they represent 23% of the school district, but 8% of the gifted program. Most of the gifted African-American students interviewed from this district were identified in visual and performing arts.
Gifted African-American students are poorly represented in the school districts.
Specifically, the discrepancies between African-American students in the school district and in the gifted program in the five districts appear in Table 1. The discrepancies across the five districts ranged from a "low" of 53% (district 3) to 83% (district 1). As stated earlier, the under-representation of African-American students in gifted programs is a national issue, and one that has received much attention in the literature. Forty-four students in grades 6-9 were formally identified as gifted by their respective school district.
As Figure 1 illustrates, the school districts varied in their identification criteria.
Some districts used assessment measurements not traditionally used in gifted education (e.g., Raven's Matrices Analogies Test), while others relied on traditional measures.
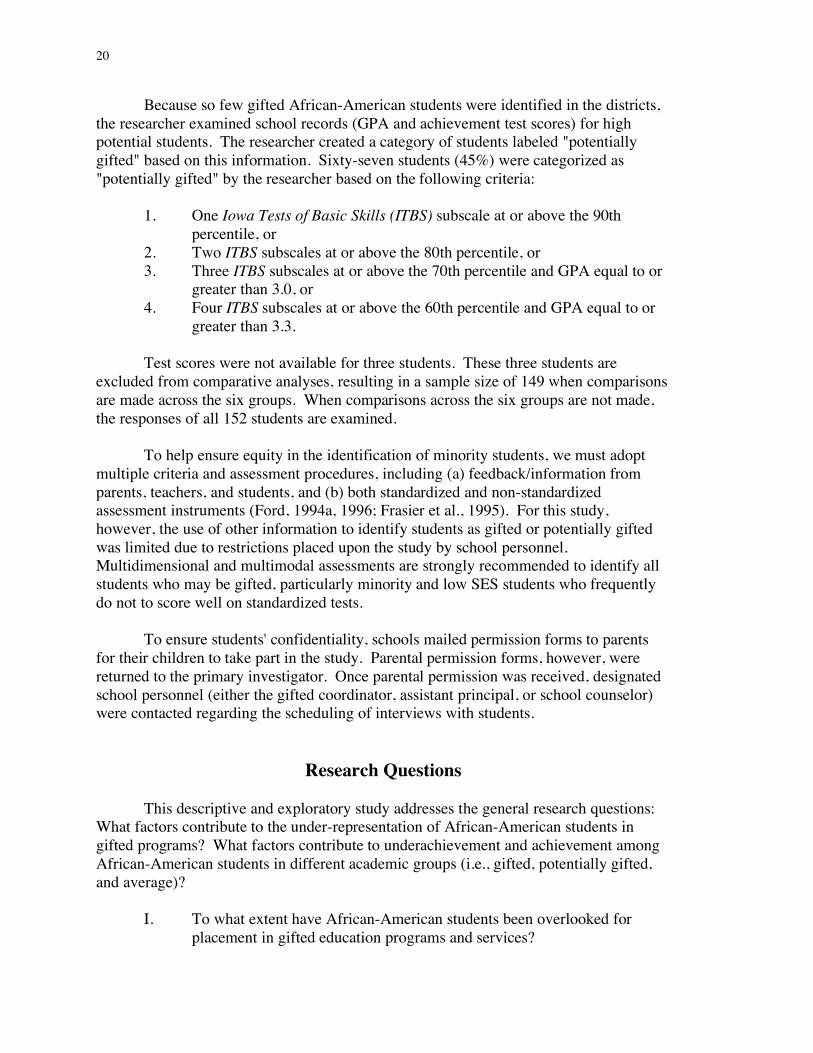
20
Because so few gifted African-American students were identified in the districts, the researcher examined school records (GPA and achievement test scores) for high potential students. The researcher created a category of students labeled "potentially gifted" based on this information. Sixty-seven students (45%) were categorized as "potentially gifted" by the researcher based on the following criteria:
1. One Iowa Tests of Basic Skills (ITBS) subscale at or above the 90th
percentile, or 2. Two ITBS subscales at or above the 80th percentile, or 3. Three ITBS subscales at or above the 70th percentile and GPA equal to or
greater than 3.0, or 4. Four ITBS subscales at or above the 60th percentile and GPA equal to or
greater than 3.3. Test scores were not available for three students. These three students are
excluded from comparative analyses, resulting in a sample size of 149 when comparisons are made across the six groups. When comparisons across the six groups are not made, the responses of all 152 students are examined.
To help ensure equity in the identification of minority students, we must adopt
multiple criteria and assessment procedures, including (a) feedback/information from parents, teachers, and students, and (b) both standardized and non-standardized assessment instruments (Ford, 1994a, 1996; Frasier et al., 1995). For this study, however, the use of other information to identify students as gifted or potentially gifted was limited due to restrictions placed upon the study by school personnel. Multidimensional and multimodal assessments are strongly recommended to identify all students who may be gifted, particularly minority and low SES students who frequently do not to score well on standardized tests.
To ensure students' confidentiality, schools mailed permission forms to parents
for their children to take part in the study. Parental permission forms, however, were returned to the primary investigator. Once parental permission was received, designated school personnel (either the gifted coordinator, assistant principal, or school counselor) were contacted regarding the scheduling of interviews with students.
Research Questions This descriptive and exploratory study addresses the general research questions:
What factors contribute to the under-representation of African-American students in gifted programs? What factors contribute to underachievement and achievement among African-American students in different academic groups (i.e., gifted, potentially gifted, and average)?
I. To what extent have African-American students been overlooked for
placement in gifted education programs and services?

21
II. What variables distinguish achievers from underachievers in the African-American students sampled? In essence, what factors contribute to academic underachievement among these African-American students?
1. What behavioral and attitudinal indices help to explain
achievement and underachievement among gifted, potentially gifted, and average students? How do these behaviors and attitudes differ among gifted achievers, gifted underachievers, potentially gifted achievers, potentially gifted underachievers, average achievers, and average underachievers?
2. What are the African-American students' perceptions of achievement and gifted education? How do these perceptions differ among gifted achievers, gifted underachievers, potentially gifted achievers, potentially gifted underachievers, average achievers, and average underachievers?
3. How do the African-American students perceive their peer relationships, specifically peer pressures and achievement orientation? How do these perceptions differ relative to the six groups of achievers and underachievers?
4. What are the African-American students' perceptions of social injustices relative to African-Americans? Do the perceptions differ by the six groups of achievers and underachievers?
5. How do the African-American students perceive their parents' achievement orientation, and to what extent are there differences between the six groups of achievers and underachievers?
6. What are students' perceptions of psychological variables and how do these perceptions differ among the six groups of achievers and underachievers?
III. Can profiles of achievement and underachievement be developed based on
the variables under investigation? Which variables effectively discriminate achievers from underachievers who are gifted, potentially gifted, or average?
Data Collection Six research assistants (all African-American, 3 males and 3 females) were
trained to interview students. Interviews were conducted on a one-to-one basis. All interviewers read items to students and recorded their responses on the survey questionnaire.
Total interview time ranged from 60 to 90 minutes per student. This time varied
by students' desire to go into detail in explaining their responses to the Self-Perceptions of Factors Affecting Black Student Achievement Scale (hereafter referred to as Self-Perceptions Scale), which prompted students to explain some of their responses. All

22
efforts were made to keep the interview time brief and to return students as quickly as possible to their regular schedules. School achievement data (test scores and grades) were collected from school personnel and records.
Instrumentation The survey instrument (see Appendix) contained a socio-demographic section and
four scales. Most of the scales had subscales. The survey also contained additional items that examined students' achievement behaviors and attitudes. These items did not belong to any scale or subscale; rather they provided additional data and insight into students' responses. Sample items: "How important is school to you?" "How much time do you spend watching TV?" "I would prefer to be in a regular school program than be in a gifted program"; "Gifted programs are for nerds and teachers' pets"; "What do your teachers say about your effort in school?"
The first scale (Self-Perceptions of Factors Affecting Black Student Achievement
Scale) was adapted from an earlier study by Ford (1991). The revised survey contains 16 additional items which addressed family factors, peer factors, and school factors. No other modifications were made to the original instrument. The modified survey is divided into two parts. Part 1 contains 88 4-point Likert-type items with a response scale that ranges from strongly disagree (1) to strongly agree (4). As described below, the subscales in part 1 ask questions about social (peer influences and social injustices), psychological, cultural (specifically, family achievement orientation), and school influences on their achievement. Students' support for tenets of the achievement ideology were also explored. All items are scored in the same direction. Therefore, the higher the mean, the higher the level of agreement with the items or statements. In part 2 of this scale, students provided additional information to explain their responses to selected Likert-type items.
Reliability coefficients (Cronbach alpha) and descriptive information for the
subscales (achievement ideology, social injustices, social/peer relationships, psychological, and cultural/family achievement orientation) are presented in Table 2 and described below.
Psychological Subscale
Nine items examined students' locus of control, sense of responsibility, fears, and
anxieties. A Cronbach alpha of .66 was generated for this subscale. Sample items: "I am responsible for my own success"; "I worry a lot about students teasing me for getting good grades"; "If I feel different from other students, I will not do my best"; "I make good grades when I work hard"; "If I am lucky, I will get a good job when I grow up"; and "When I make good grades, it is because I am lucky."

23
Table 2 Reliability Coefficients for Scales and Subscales Variable Number
of Items m Reliability
Coefficient
Learning Environment Scale (overall) 36 2.9 .93
Estes Attitude Scales English
12
3.0
.89
Math 13 3.1 .89 Reading 13 3.0 .92 Science 11 3.1 .88 History/Social Studies 13 3.0 .92
Test Anxiety Scale 30 2.5 .91
Racial Identity Scale 24 3.1 .72
Self-Perceptions Scales Cultural Subscale—Family Achievement Orientation
10
3.5
.82
Psychological Subscale 9 2.5 .66 Social Subscale—Peer Relationships and Pressures 22 2.1 .76 Social Subscale—Injustices 7 2.5 .75 Achievement Ideology Subscale 12 3.4 .86
Social Subscale—Social Injustices There were seven items in this subscale. The Cronbach alpha was .75. Students
were surveyed regarding their perceptions of social injustices, including discrimination and unfair practices against African Americans. Sample items include: "People in my family have been treated mean or unfairly by White people"; "Most Black people have been treated mean or unfairly by White people; "Black people have to work harder in school than White people to become successful"; "I think some people will try to stop me from getting a good job when I grow up"; and "White people have more power and money than Black people."
Social Subscale—Peer Relationships and Pressures
This subscale contained 22 items and had an alpha of .76. Sample items include:
"Black students say that I am acting White when I make good grades or speak standard

24
English"; "I know some students who will not do well in school because other students might tease them"; "I prefer to be in classes with my friends"; and "I worry about whether other students really like me."
Cultural Subscale—Family Achievement Orientation
This subscale contained 10 items that explored students' perceptions of their
parents' achievement orientation. A Cronbach alpha of .82 was generated. Sample items include: "When I need help with school work, my parents/guardians try to help me"; "My parents/guardians believe that going to school is important"; "My parents/guardians told me that if I want to be successful, I must work hard in school"; "My parents encourage me to do well in school"; and "My parents/guardians value education and achievement."
Achievement Ideology Subscale
Twelve items examined the extent to which students support tenets of the
achievement ethic, also referred to as Protestant work ethic or American dream. An alpha of .86 was generated for this subscale. Sample items include: "One of the best ways to become successful in life is to do well in school"; "Speaking standard English is important"; "Going to school is important"; "Anyone can be successful in life if he or she tries"; "I can grow up to be anything I want to be"; and "Some day, a Black person will become President of the United States."
The Racial Identity Scale for Black Students assessed students' racial identity.
The scale was adapted from instruments developed by Phinney (1989) and Parham and Helms (1985). The revised scale contained 24 Likert-type items which explored students' sense of pride in their racial status, the salience of being African American in their lives, and their attachment to their Black heritage and community. The higher the mean response, the stronger and more positive the racial identity. A reliability coefficient of .72 was generated for this scale. Sample items: "Being Black is an important part of the way I see myself"; "Black people should see themselves as Black first and foremost"; "Black is beautiful"; "I have a lot of pride in my racial group and our accomplishments"; and "Because I am Black, I have many strengths."
The Estes Attitudes Scales was administered to assess students' attitudes toward
school subjects. The scales do not ask students questions specifically about their own classes. Thus, students respond to how they feel about the subjects in general, without a particular context. The Estes scales contain questions related to math, reading, English, science, and social studies. In this study, reliabilities ranged from .88 to .92 for the five subscales (see Table 2).
An additional scale, the Learning Environment Scale for Black Students (LES),
contained 36 4-point Likert-types items. An alpha coefficient of .93 was generated for this instrument for the current sample. Five subscales assess students' perceptions of: student-teacher relationships; opportunity to understand the material; teacher attitude

25
about teaching; the extent to which they find school engaging (i.e., interesting or stimulating); and the socio-emotional or affective climate of schools and classrooms. Subscale reliabilities are presented in Table 2.
The final scale was adapted from the Test Anxiety Scale (TAS) (Sarason &
Mandler, 1952) which contains 30 items that measure general debilitative test anxiety. The original TAS asks students to respond in a true-false format; however, several studies have used Likert-type responses instead of the true-false format. The modified version used in this study asks students to respond to a 4-point Likert-type format, ranging from strongly disagree (1-point) to strongly agree (4-points). The instrument has four subscales—self-evaluation, worry, physiological reactions, and concerns about time limits or constraints. The overall TAS reliability was .91 in the current study.
Data Analyses Descriptive analyses, comparative analyses (e.g., MANOVAs, ANOVAs, Chi-
squares), correlations, regression analysis, and discriminant function analysis were used to examine the research questions. The model used in this study is 3x2 (three academic groups by two achievement levels), which results in six groups: gifted achievers, gifted underachievers, potentially gifted achievers, potentially gifted underachievers, average achievers, and average underachievers. As stated earlier, test scores were not available for three students, resulting in comparisons for 149 students.


27
CHAPTER 3: Results
Demographic Information Of the 152 African-American middle and high school students interviewed, the
majority were females (n = 97, 64%) (see Table 3). There were 8 students in grade 6 (5%), 53 students in grade 7 (35%), 50 students in grade 8 (33%), and 41 students in grade 9 (27%). Students ranged in age from 11 to 15, with a mean age of 13.
Two thirds of the students reported paying full price for lunch (n = 96, 64%). A
majority of students reported living with both parents (n = 85, 56%), and many (n = 55, 36%) reported living with their mothers only. One hundred and forty-two students knew the employment status of their fathers, with 117 (82%) reporting their fathers to be employed. One hundred and twelve were aware of their father's educational level, with 40 students (36%) indicating that their father had a high school diploma and 45 (40%) reporting fathers as having a college degree.
More students were aware of their mother's employment status (n = 151) and
educational level (n = 145). One hundred and twenty-three students stated that their mothers were employed, and 34 students (23%) reported that their mother had a high school diploma, 33 students (23%) reported their mothers having some college experience, and 57 students (39%) reported their mothers as having a college degree.
Comparative Results by Academic Group and Achievement Level
Underachievement A regression analysis was used to identify underachieving students. Students
whose GPA was one or more standard deviations below the level predicted by their ITBS (grade 4) score were defined as underachievers (n = 62, 42%); those whose GPA was at or higher than the level predicted were defined as achievers (n = 87, 58%). Thus, two in five students sampled were underachieving based on regression analysis. Test scores were not available for three students.
In terms of academic program, 17 gifted students (which represents 39% of the
gifted students), 27 potentially gifted students (representing 40% of the potentially gifted students), and 20 average students (representing 47% of average students) were underachieving. Half of the males in the sample (n = 27) and 37% of females (n = 35) were underachieving. Relative to grade level, there was one sixth grader (13% of sixth graders), 24 seventh graders (45% of seventh graders), 18 eighth graders (38% of eighth graders), and 19 ninth graders (48% of ninth graders) who were underachieving. In essence, underachievers tended to be average students, male, and in grades 7 or 9.
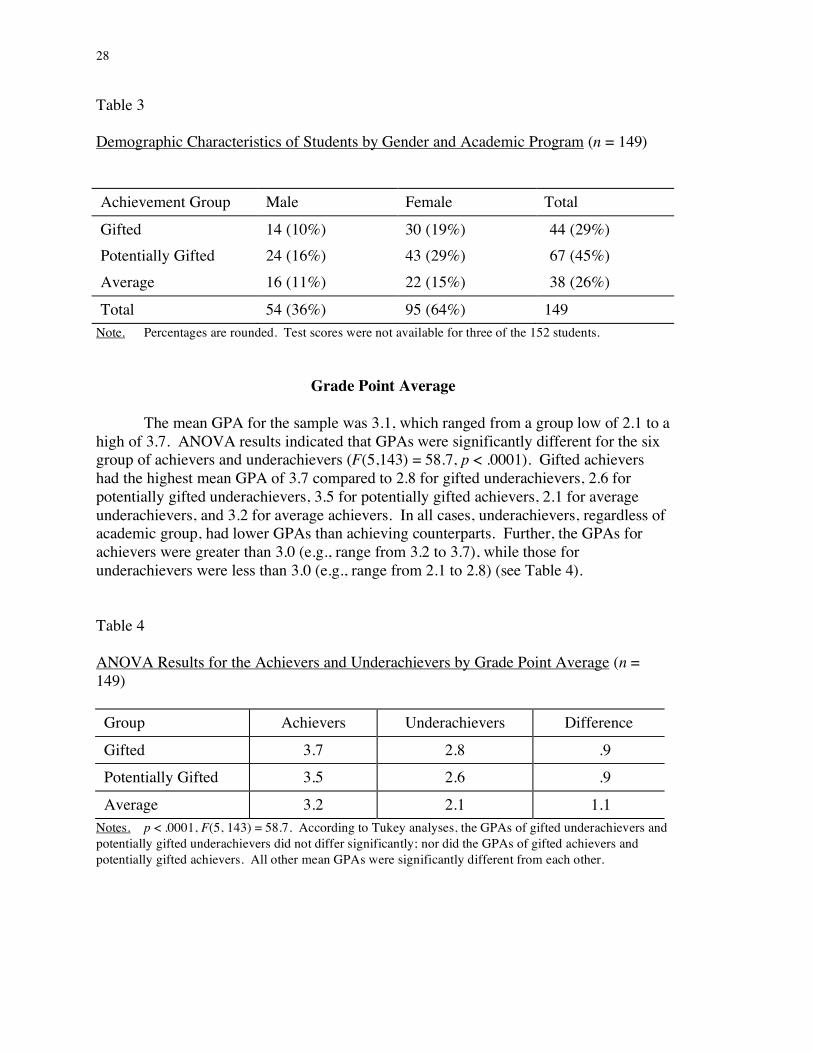
28
Table 3 Demographic Characteristics of Students by Gender and Academic Program (n = 149) Achievement Group Male Female Total
Gifted 14 (10%) 30 (19%) 44 (29%) Potentially Gifted 24 (16%) 43 (29%) 67 (45%) Average 16 (11%) 22 (15%) 38 (26%)
Total 54 (36%) 95 (64%) 149 Note. Percentages are rounded. Test scores were not available for three of the 152 students.
Grade Point Average The mean GPA for the sample was 3.1, which ranged from a group low of 2.1 to a
high of 3.7. ANOVA results indicated that GPAs were significantly different for the six group of achievers and underachievers (F(5,143) = 58.7, p < .0001). Gifted achievers had the highest mean GPA of 3.7 compared to 2.8 for gifted underachievers, 2.6 for potentially gifted underachievers, 3.5 for potentially gifted achievers, 2.1 for average underachievers, and 3.2 for average achievers. In all cases, underachievers, regardless of academic group, had lower GPAs than achieving counterparts. Further, the GPAs for achievers were greater than 3.0 (e.g., range from 3.2 to 3.7), while those for underachievers were less than 3.0 (e.g., range from 2.1 to 2.8) (see Table 4).
Table 4 ANOVA Results for the Achievers and Underachievers by Grade Point Average (n = 149) Group Achievers Underachievers Difference
Gifted 3.7 2.8 .9
Potentially Gifted 3.5 2.6 .9
Average 3.2 2.1 1.1 Notes. p < .0001, F(5, 143) = 58.7. According to Tukey analyses, the GPAs of gifted underachievers and potentially gifted underachievers did not differ significantly; nor did the GPAs of gifted achievers and potentially gifted achievers. All other mean GPAs were significantly different from each other.

29
Achievement Test Scores The mean ITBS (grade 4) subscale scores for the sample corresponded to the
following percentile ranks: Science (73rd percentile); Reading Comprehension (66th percentile); Language total (69th percentile); Mathematics (68th percentile); Vocabulary (62nd percentile); and Social Studies (66th percentile)3.
The Kruskal-Wallis One-Way ANOVA by Ranks was used to examine
differences in mean percentile achievement scores for the six groups. The mean ranks on the total ITBS were significantly different for the six groups (X2 = 91, p < .0001). The achievement test results for the six groups were as follows: gifted underachievers (m = 82); gifted achievers (m = 83); potentially gifted underachievers (m = 71), potentially gifted achievers (m = 70), average underachievers (m = 44), and average achievers (m = 44). Table 5 presents mean percentile ITBS subscale scores for the six groups of achievers and underachievers.
Table 5 Kruskal-Wallis One-Way ANOVA Results for ITBS Subscale Percentile Scores Among Gifted, Potentially Gifted, and Average Achievers and Underachievers (n = 149)
Subscale GU GA PGU PGA AU AA X2
Reading Comprehension
80
82
72
69
40
39
65.4
Vocabulary 80 81 64 65 42 34 64.6
Language Total 84 84 72 70 50 46 55.2
Math Total 85 86 70 69 46 46 61.3
Social Studies 80 83 72 69 40 40 56.7
Science 85 82 78 79 51 56 42.7 Note. GU denotes gifted underachievers, GA = gifted achievers, PGU = potentially gifted underachievers, PGA = potentially gifted achievers, AU = average underachievers, and AA = average achievers. Numbers represent mean standard score percentiles. All results are significant at the .0001 level.
3 On all subscales, these students are performing above the state mean on the ITBS for grade 4: Vocabulary (54th percentile); Reading Comprehension (56th percentile); Language (64th percentile); Mathematics (66th percentile); Social Studies (65th percentile); and Science (71st percentile).

30
Test Anxiety The students' mean test anxiety score was 2.5 on a 4.0 scale, indicating a
moderate level of test anxiety. Subscale means ranged from 2.6 for concerns about time constraints to 2.3 for students reporting physiological reactions to evaluative situations (e.g., sweating, tension). A mean response of 2.4 was found for the self-evaluation subscale (e.g., students are concerned about how their performance will reflect negatively upon them; they worry about being perceived as stupid, etc.). A mean of 2.4 was also found for the worry subscale (e.g., students are concerned about how the test results will be used).
ANOVA results reveal statistically significant differences in the overall test
anxiety of the six groups (F(5, 143) = 2.6, p < .05). Relative to the total TAS, Tukey results showed that gifted achievers had a significantly lower level of test anxiety (m = 2.2) than potentially gifted underachievers (m = 2.6). These scores represent the lowest and highest group scores in the sample.
Results of the four test anxiety subscales for the six groups were analyzed using
MANOVA. The overall model was statistically significant (F = 1.53, p < .05). Students' responses to two subscales were significantly different. Specifically, univariate analyses indicate significant differences among the groups on the self-evaluation subscale (F(5, 143) = 2.9, p < .05). Tukey analysis indicated that gifted achievers have the lowest mean of 2.1 on the self-evaluation subscale compared to gifted underachievers and potentially gifted underachievers (m = 2.6 for both). These scores represent the lowest and highest self-evaluation anxiety scores for the six groups.
Univariate F-test results also revealed significant differences on the physiological
subscale (F(5, 143) = 3.1, p < .05). Tukey analysis indicated that gifted achievers had a significantly lower mean of 2.0 on this subscale than potentially gifted underachievers (m = 2.4), average underachievers (m = 2.5), and average achievers (m = 2.5) (see Table 6).
Indices of Achievement Attitudes and Behaviors The following sections summarize students' responses to items that assessed their
achievement attitudes and behaviors. Both descriptive and comparative results are presented.
What behavioral and attitudinal indices help to explain achievement and underachievement among gifted, potentially gifted, and average students? How do these behaviors and attitudes differ among gifted achievers, gifted underachievers, potentially gifted achievers, potentially gifted underachievers, average achievers, and average underachievers?

31
Table 6 Univariate F-test Results for the Test Anxiety Subscales by Achievers and Underachievers (n = 149) Variable F p value
Self-evaluation subscale 2.9 .05a
Worry subscale 1.5 n.s.
Time subscale 1.8 n.s.
Physiological subscale 3.1 .05b Note. aGifted achievers had a significantly higher mean response than gifted underachievers and potentially gifted underachievers. bGifted achievers had a significantly lower mean than average underachievers, average achievers, and potentially gifted underachievers.
What Do Your Teachers Say About Your Effort in School? Students indicated their level of agreement to this item. The majority of students
(n = 92, 64%) report being told by teachers that they are doing their best in school. A little more than one third (n = 52, 36%) are told by teachers that they need to work harder in school. Contingency table analysis reveals noticeable differences in students' responses: 63% of gifted underachievers, 19% of gifted achievers, 30% of potentially gifted underachievers, 44% of potentially gifted achievers, 41% of average underachievers, and 37% of average achievers report that teachers tell them that their effort is low.
When asked, "Could you do better in school if you tried?" 149 students
responded "yes." Further, all 152 students agreed that they wanted to "do better in school." Thus, while only 35% of students are told by teachers that their effort is low, almost all students disagreed that they are exerting high levels of effort. Other indices of low effort are described in the following sections.
Time Spent on Homework Each Day
Students were asked "Do you spend a lot of time doing homework?" Thirty-nine
percent (n = 57) responded "no." The remaining students responded "yes." Students were also asked "About how many hours per day do you spend on
homework?" They report spending an average of two hours per day on homework; responses ranged from zero to five hours, with a modal response of one hour. The time spent doing homework was significantly different for the six groups (F(5, 143) = 2.5, p < .05). However, according to Tukey analyses, no two group means were significantly different at the .05 level (see Table 7).

32
Table 7 ANOVA Results for the Achievers and Underachievers by Average Hours Spent on Homework Daily (n = 149) Group Achievers Underachievers Difference
Gifted 2.4 1.7 .7
Potentially Gifted 2.2 1.8 .4
Average 2.1 1.5 .6 Note. p < .05, F(5, 143) = 2.5.
Do You Spend More Time Watching TV Than Studying? Two thirds of the students (n = 100, 68%) report spending more time watching
TV than studying. Chi-square results were not significantly different across the six groups.
Do You Spend More Time Doing Homework Than Playing and Hanging Out With
Your Friends? Half of the students (n = 76, 51%) report spending more time with friends than
doing homework. Chi-square results were not significantly different across the six groups.
Perceptions of Gifted Education and Students
Five separate items on the survey addressed African-American students'
perceptions of gifted education and gifted students. Specifically, 95% disagreed or strongly disagreed that "Gifted programs are for White students only"; 93% expressed disagreement that "Black students don't need to be in gifted programs"; 45% expressed agreement that "Some students think gifted programs are for the 'teacher's pet' or 'nerds'." However, 97% disagreed or strongly disagreed that "I think gifted programs are for nerds and teachers' pets." Finally, 81% did not support the statement "I would prefer to be in a regular school program than be in a gifted program."
Support for the Achievement Ideology
The African-American students hold strong, positive regard for tenets of the
achievement ideology, as indicated by their mean response of 3.4 on this subscale. Gifted achievers had the highest mean response of 3.6; average underachievers had the lowest mean response of 3.2. ANOVA results revealed no significant differences in the responses of the six groups relative to perceptions of the achievement ideology.

33
Perceptions of the Learning Environment What are the African-American students' attitudes toward achievement and gifted education? How do these perceptions differ among gifted achievers, gifted underachievers, potentially gifted achievers, potentially gifted underachievers, average achievers, and average underachievers? As indicated earlier, students were administered the Learning Environment Scale
for Black Students (LES). In general, the African-American students report favorable attitudes about the learning environment, as reflected by an overall mean response of 2.9 on a 4.0 scale for the 36 items. In terms of student engagement, a mean of 2.9 was reported. Thus, the African-American students sampled tend to find school interesting; they enjoy learning. They also believe that there is ample opportunity for them to understand what is being taught (m = 3.0) as measured by their responses to items on this subscale. Further, students report that teachers appear to enjoy teaching (m = 2.9), that the socio-emotional climate is positive (m = 2.9), and student-teacher relationships are positive (m = 3.1). Many of these statements also hold important implications for student learning and achievement. For instance, 89% reported "Teachers play an important role in my doing well in school."
MANOVA results showed significant differences among the six groups in their
overall attitudes toward school (F(5, 143) = 2.8, p < .05), their perceptions of student-teacher relationships (F(5, 143) = 3.4, p < .01,), and their perceptions about opportunities to understand the material F(5, 143) = 3.2, p < .01).
Univariate F-test and Tukey analyses indicate that gifted underachievers (m = 2.8)
felt significantly less positive about their relationships with teachers than gifted achievers (m = 3.3). Further, Tukey results indicate that gifted achievers (m = 3.3) felt that they had more opportunities to understand the curriculum than did average underachievers (m = 2.8). Subscale results are presented in Table 8.
Attitudes Toward School Subjects When asked, "How important is school to you?", three in four students (n = 110)
responded "very important"; 26% (n = 40) responded "important." Almost all students (n = 143, 94%) want to go to college. Thus, the majority of African-American students, regardless of academic group and achievement level, consider school to be important and they aspire to higher education.

34
Table 8 Univariate F-test Results for the Learning Environment Subscales by Achievers and Underachievers (n = 149) Subscale F p value
Engagement 2.1 n.s.
Student-teacher relationship 3.4 .01a
Opportunity to understand 3.2 .01b
Social-emotional climate 2.0 n.s.
Teachers' attitude 1.8 n.s. Note. aGifted underachievers felt significantly less positive about their relationships with teachers than
gifted achievers. bGifted achievers felt that they had more opportunities to understand the curriculum than did
average underachievers. The Estes Attitudes Scales examined students' attitudes toward five school
subjects. Overall, the African-American students report positive attitudes about school subjects: math (m = 3.1); science (m = 3.1); reading (m = 3.0); English (m = 3.0); and social studies/history (m = 3.0). MANOVA, univariate F-tests and Tukey analysis results with the five Estes subscales indicate the following: The responses of the six groups on the Estes math subscale were significantly different (F(5, 143) = 2.4, p < .05). Tukey analysis indicates that gifted achievers (m = 3.4) responded differently than average underachievers (m = 3.0) (see Table 9).
Significant differences were also found regarding students' attitudes toward
reading (F(5, 143) = 4.2, p < .01). Tukey results show that average underachievers had the lowest mean response of 2.6 compared to gifted achievers (m = 3.3) and potentially gifted achievers (m = 3.1).
The six groups also held significantly different attitudes toward science (F(5, 143)
= 3.9, p < .01), with Tukey analysis indicating that gifted achievers reported much more positive attitudes (m = 3.4) than gifted underachievers, average achievers, and average underachievers, all of whom had a mean of 3.0. In short, on three of the five Estes subscales, significant differences across the six groups were found (see Table 9).

35
Table 9 MANOVA Results for the Estes Subscales by Six Groups (n = 149) Variable F p value
Math subscale 2.4 .05a
Reading subscale 4.2 .01b
Science subscale 3.8 .01c
Social Studies subscale .97 n.s.
English subscale 2.2 n.s. Note. aGifted achievers had a significantly higher mean response than average underachievers. bAverage underachievers have a significantly lower mean response compared to gifted achievers
and potentially gifted achievers. cGifted achievers reported significantly more positive attitudes than gifted underachievers, average
achievers, and average underachievers. In addition to the Estes subscales, students were asked to express their opinions
about certain aspects of the curriculum. For example, students responded to such statements as: "I get tired of learning about White people in class"; "I get more interested in school when we learn about Black people"; and "I want to learn more about Black people in school." Sample student responses appear in Figure 2. In general, the statements indicate that while Black students seem content or even satisfied initially with the curriculum, open-ended responses reveal many concerns, particularly relative to the lack of multicultural focus.
The students seek affirmation in the curriculum, and wish to learn more about
African-Americans and other people of culture. Many of the statements point to the desire for affective, affirming curriculum—students speak of getting more "interested," "motivated," and "excited" when their learn about positive aspects of their African-American culture, and famous heroes and heroines. The students express a pluralistic philosophy—not only do the students want to learn about their own ethnic and cultural heritage, they wish to learn about other ethnic and cultural groups. They speak of the need for White students to learn more about Blacks and people of culture.
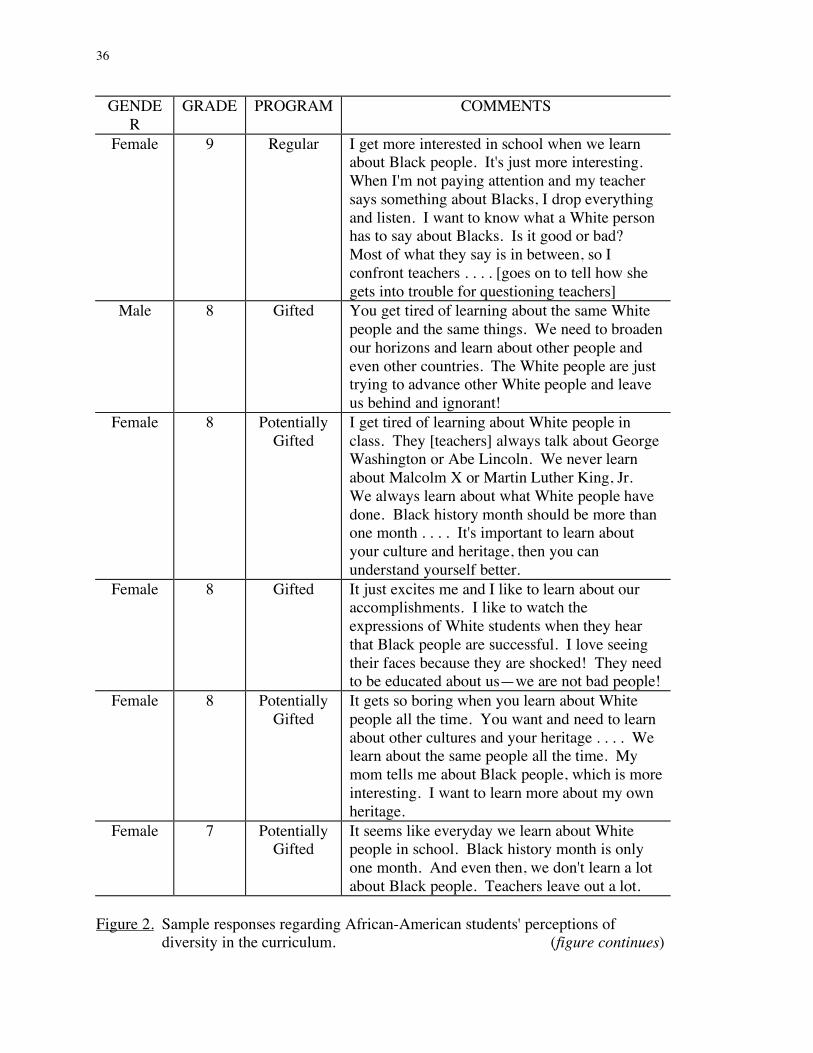
36
GENDER
GRADE PROGRAM COMMENTS
Female 9 Regular I get more interested in school when we learn about Black people. It's just more interesting. When I'm not paying attention and my teacher says something about Blacks, I drop everything and listen. I want to know what a White person has to say about Blacks. Is it good or bad? Most of what they say is in between, so I confront teachers . . . . [goes on to tell how she gets into trouble for questioning teachers]
Male 8 Gifted You get tired of learning about the same White people and the same things. We need to broaden our horizons and learn about other people and even other countries. The White people are just trying to advance other White people and leave us behind and ignorant!
Female 8 Potentially Gifted
I get tired of learning about White people in class. They [teachers] always talk about George Washington or Abe Lincoln. We never learn about Malcolm X or Martin Luther King, Jr. We always learn about what White people have done. Black history month should be more than one month . . . . It's important to learn about your culture and heritage, then you can understand yourself better.
Female 8 Gifted It just excites me and I like to learn about our accomplishments. I like to watch the expressions of White students when they hear that Black people are successful. I love seeing their faces because they are shocked! They need to be educated about us—we are not bad people!
Female 8 Potentially Gifted
It gets so boring when you learn about White people all the time. You want and need to learn about other cultures and your heritage . . . . We learn about the same people all the time. My mom tells me about Black people, which is more interesting. I want to learn more about my own heritage.
Female 7 Potentially Gifted
It seems like everyday we learn about White people in school. Black history month is only one month. And even then, we don't learn a lot about Black people. Teachers leave out a lot.
Figure 2. Sample responses regarding African-American students' perceptions of
diversity in the curriculum. (figure continues)

37
GENDER GRADE PROGRAM COMMENTS Male 8 Potentially
Gifted Seriously, there are 12 months in a year. They choose February—the shortest month to teach Blacks about themselves. Black people get one month! White people get 11 months! . . . . One month is ridiculous. You cannot fit our history into 28 days! It's not possible. White kids get 200 days!
Female 7 Regular It's more interesting to learn about Black people than to learn about Presidents who are all White. We always learn about White people; when we learn about Blacks, they are slaves.
Female 8 Regular I think we should learn more about Black people. We learn about Black people for a month. Today [Feb. 28] is the last day to learn about Blacks this year.
Male 7 Gifted There should be an equal amount of attention given to all groups—Black, White, Hispanic, and others should be in the curriculum . . . . Blacks have contributed as much to society as White people. Blacks have come up with new theories and inventions just like White people. Blacks need to know what other Blacks have done.
Female 9 Gifted Although we had Black history month this year, Blacks were discussed very little that month.
Female 7 Gifted I get more interested when I learn about Black people because it shows me that Black people can do things . . . . In one of my classes, the teacher doesn't focus on Blacks or women. He's a racist. He said that Black people caused slavery. He treats people real unfairly.
Male 8 Gifted I get tired of hearing about how bad Black people are doing. It would be nice to hear some good things about Black people.
Male 9 Gifted Since kindergarten, all you learn is about Whites and George Washington. I haven't learned much about Black people and our history . . . . There is only one month that schools do anything for Black folks. . . . Throughout history, we have been treated like dirt . . . like during slavery; fights against integration; putting us in lower level classes . . . .
(continued) Figure 2. Sample responses regarding African-American students' perceptions of
diversity in the curriculum.
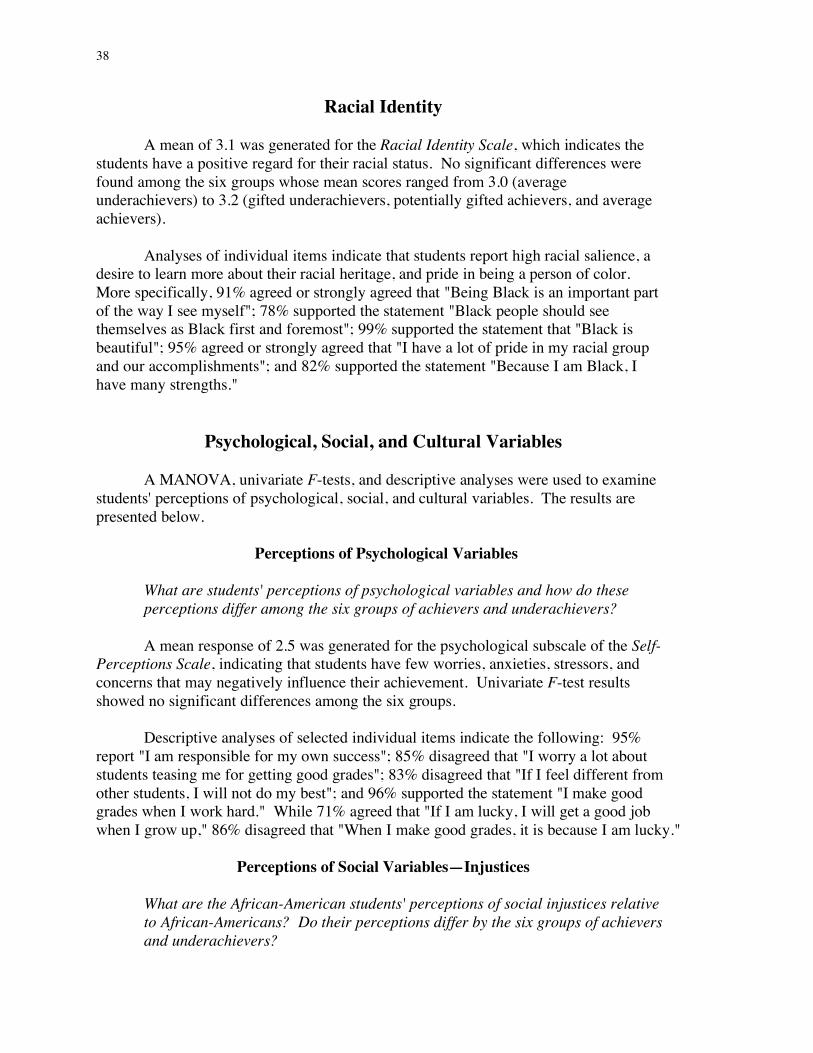
38
Racial Identity A mean of 3.1 was generated for the Racial Identity Scale, which indicates the
students have a positive regard for their racial status. No significant differences were found among the six groups whose mean scores ranged from 3.0 (average underachievers) to 3.2 (gifted underachievers, potentially gifted achievers, and average achievers).
Analyses of individual items indicate that students report high racial salience, a
desire to learn more about their racial heritage, and pride in being a person of color. More specifically, 91% agreed or strongly agreed that "Being Black is an important part of the way I see myself"; 78% supported the statement "Black people should see themselves as Black first and foremost"; 99% supported the statement that "Black is beautiful"; 95% agreed or strongly agreed that "I have a lot of pride in my racial group and our accomplishments"; and 82% supported the statement "Because I am Black, I have many strengths."
Psychological, Social, and Cultural Variables A MANOVA, univariate F-tests, and descriptive analyses were used to examine
students' perceptions of psychological, social, and cultural variables. The results are presented below.
Perceptions of Psychological Variables
What are students' perceptions of psychological variables and how do these perceptions differ among the six groups of achievers and underachievers? A mean response of 2.5 was generated for the psychological subscale of the Self-
Perceptions Scale, indicating that students have few worries, anxieties, stressors, and concerns that may negatively influence their achievement. Univariate F-test results showed no significant differences among the six groups.
Descriptive analyses of selected individual items indicate the following: 95%
report "I am responsible for my own success"; 85% disagreed that "I worry a lot about students teasing me for getting good grades"; 83% disagreed that "If I feel different from other students, I will not do my best"; and 96% supported the statement "I make good grades when I work hard." While 71% agreed that "If I am lucky, I will get a good job when I grow up," 86% disagreed that "When I make good grades, it is because I am lucky."
Perceptions of Social Variables—Injustices
What are the African-American students' perceptions of social injustices relative to African-Americans? Do their perceptions differ by the six groups of achievers and underachievers?

39
A mean of 2.5 was generated for students' perceptions of social injustices (Self-Perceptions Scale). Univariate F-test results were not significantly different for the six groups. Descriptive analyses of sample individual items in this subscale reveal the following: 48% supported the statement "People in my family have been treated mean or unfairly by White people"; 70% agreed that "Most Black people have been treated mean or unfairly by White people"; 46% expressed agreement that "Black people have to work harder in school than White people to become successful"; half of the students (51%) agreed that "I think some people will try to stop me from getting a good job when I grow up"; and 44% supported the statement that "White people have more power and money than Black people."
Perceptions of Social Variables—Peer Relationships and Pressures
How do the African-American students perceive their peer relationships, specifically peer pressures and achievement orientation? How do these perceptions differ relative to the six groups of achievers and underachievers? On the peer relationships and pressures subscale (Self-Perceptions Scale),
students had a mean of 2.1. No significant differences were found in the mean responses of the six groups. Thus, students, regardless of achievement group and achievement level, expressed few concerns regarding peer pressures and relationships.
Many (38%) of the students supported the statement "Black students say that I am
acting White when I make good grades or speak standard English"; 58% agreed or strongly agreed that "I know some students who will not do well in school because other students might tease them"; 84% report "I prefer to be in classes with my friends"; 31% acknowledged that "I worry about whether other students really like me"; and 86% expressed agreement that "Some of the 'class clowns' are really smart."
Perceptions of Cultural Variables—Family Achievement Orientation
How do the African-American students perceive their parents' achievement orientation, and to what extent are there differences between the six groups of achievers and underachievers? Students reported strong, positive family achievement orientations, as indicated
by the mean response of 3.5 on the cultural-family achievement subscale (Self-Perceptions Scale). According to ANOVA results, there were no significant differences among the six groups, whose mean responses ranged from 3.4 (average underachievers) to 3.6 (gifted achievers and potentially gifted achievers).
In response to individual items, most African-American students reported that
parents encourage them to do well in school, their parents place high values on achievement and effort. Most students (93%) reported "When I need help with school work, my parents/guardians try to help me"; all students reported "My parents/guardians believe that going to school is important"; 95% agreed or strongly agreed "My

40
parents/guardians told me that if I want to be successful, I must work hard in school"; 99% reported "My parents encourage me to do well in school"; and all students agreed or strongly agreed that "My parents/guardians value education and achievement."
Profiles of Achievement and Underachievement Can profiles of achievement and underachievement be developed based on the variables under investigation? Which variables are most effective in discriminating achievers from underachievers who are gifted, potentially gifted, and average? A discriminant function analysis was generated to examine those variables that
best differentiate the attitudes and perceptions of gifted, potentially gifted, and average achievers and underachievers. The results are based on the responses of 148 students; one student was excluded from the analysis due to at least one missing discriminating variable, and three were excluded due to missing test data.
Five functions were generated, with function 1 explaining 48% of the variance
(X2 = 103.6, p < .05). The remaining functions were not statistically significant. Function 1 contained the following six variables: Estes English, reading, and math; students' own achievement ideology; and perceived family achievement orientation (see Table 10).

41
Table 10 Pooled Within-Groups Correlations Between Discriminating Variables and Canonical Discriminant Functions (n = 149)
Variable (Scales and Subscales)
Function 1 Function 2 Function 3 Function 4 Function 5
Estes Reading
Estes English
Estes Math
Achievement Ideology Subscale (Self-Perceptions Scale)
Cultural Subscale—Family Achievement Orientation (Self-Perceptions Scale)
.59
.39
.39
.36
.36
Estes Science
Psychological Subscale (Self-Perceptions Scale)
-.51
.28
Teachers' Attitudes (LES)
Student-Teacher Relations (LES)
Affective Climate (LES)
Opportunity to Understand Material (LES)
Social Subscale—Injustices (Self-Perceptions Scale)
Social Subscale—Peer Relationships and Pressures (Self-Perceptions Scale)
.70
.61 .58
.47
-.45
-.29
Engagement (LES)
Estes Social Studies
.44
-.35 Note. No variables loaded significantly on Function 2.

42
Summary of Results
1. In every school district, African-American students were under-represented in gifted programs.
a The extent of discrepancies varied across the five districts. b Of the African-American students sampled, 67 (45%) were identified as
potentially gifted by the researcher. 2. The mean GPA for the sample is relatively high (3.1). GPAs ranged from a
low of 2.1 to a high of 3.7.
a None of the underachievers have GPAs higher than 2.8; all achievers have GPAs greater than 3.0.
b The GPAs for achievers were all very similar (e.g., 3.7, 3.5, and 3.2), but differed from those from underachievers (e.g., 2.8, 2.6, and 2.1).
3. Iowa Test of basic Skills (ITBS) subscale scores ranged from a low of the 62nd
percentile for vocabulary to a high of 73rd percentile for science for the six groups.
a Gifted achievers and underachievers had significantly higher test scores
than other students. b Achievers had significantly higher test scores than underachievers.
4. Test anxiety, while relatively low for the sample in general, is problematic
when one examines the self-evaluation and physiological subscales.
a Self-Evaluation Subscale—gifted achievers have the lowest mean anxiety on this subscale compared to gifted underachievers and potentially gifted underachievers.
b Physiological Subscale—gifted achievers report the lowest mean compared to average underachievers.
5. Of the African-American students sampled, 42% were underachieving based
on the discrepancy between test scores and GPA.
a About 40% of the gifted students in this study were underachieving. b Many of the potentially gifted students were underachieving (40%). c Almost half of the average students were underachieving (47%). d Half of males and 37% of females were underachieving. e Most students were told by their teachers that their effort is low, with most
gifted underachievers being told this. f Most students reported not putting forth the best effort in school; they
report that they can do better in school.

43
6. In general, the African-American students hold positive attitudes toward school and the learning environment.
a The majority of students report that school is "very important." b The majority of students want to attend college. c In general, the African-American students report favorable attitudes about
the learning environment. d Educational engagement—The African-American students sampled tend
to find school interesting; they enjoy learning. e Opportunities to understand the curriculum—Students believe that there is
ample opportunity for them to understand what is being taught; however, gifted achievers felt that they had significantly more opportunities to understand the curriculum than did average achievers and average underachievers. Further, potentially gifted achievers were more positive than average underachievers.
f Teacher attitudes—Students report that teachers appear to enjoy teaching. g Affective climate—Students find the socio-emotional climate to be
positive. h Student-teacher relationships—The African-American students report
positive student-teacher relationship, however gifted underachievers felt significantly less positive about their relationships with teachers than gifted achievers.
7. In general, the African-American students are positive about school subjects. Three Estes attitudes subscales were significantly different among the six
groups—math, reading, and science.
a Math—Gifted achievers had a significantly higher mean response than average underachievers.
b Reading—Average underachievers have a significantly lower mean response compared to gifted achievers and potentially gifted achievers.
c Science—Gifted achievers reported significantly more positive attitudes than gifted underachievers, average achievers, and average underachievers.
8. The African-American students tend to have positive perceptions of gifted
students and gifted education.
a Of the six groups, gifted underachievers were the least positive about gifted students and programs, while gifted achievers were the most positive.
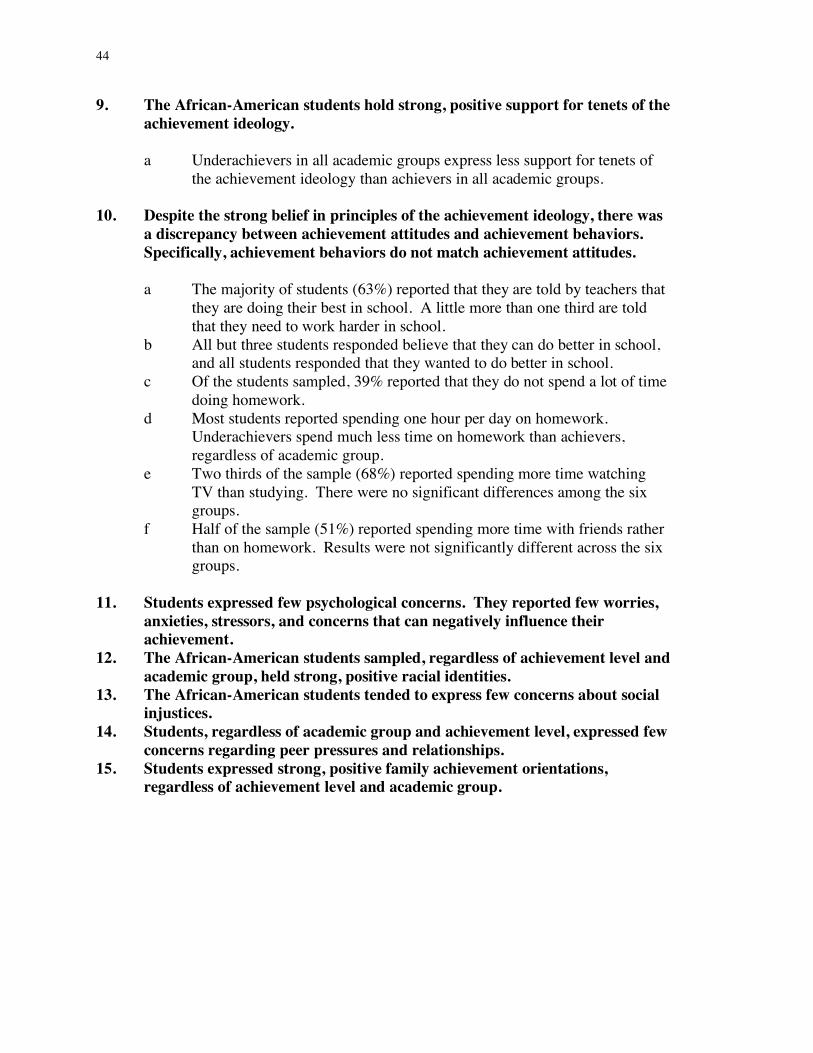
44
9. The African-American students hold strong, positive support for tenets of the achievement ideology.
a Underachievers in all academic groups express less support for tenets of
the achievement ideology than achievers in all academic groups. 10. Despite the strong belief in principles of the achievement ideology, there was
a discrepancy between achievement attitudes and achievement behaviors. Specifically, achievement behaviors do not match achievement attitudes.
a The majority of students (63%) reported that they are told by teachers that
they are doing their best in school. A little more than one third are told that they need to work harder in school.
b All but three students responded believe that they can do better in school, and all students responded that they wanted to do better in school.
c Of the students sampled, 39% reported that they do not spend a lot of time doing homework.
d Most students reported spending one hour per day on homework. Underachievers spend much less time on homework than achievers, regardless of academic group.
e Two thirds of the sample (68%) reported spending more time watching TV than studying. There were no significant differences among the six groups.
f Half of the sample (51%) reported spending more time with friends rather than on homework. Results were not significantly different across the six groups.
11. Students expressed few psychological concerns. They reported few worries,
anxieties, stressors, and concerns that can negatively influence their achievement.
12. The African-American students sampled, regardless of achievement level and academic group, held strong, positive racial identities.
13. The African-American students tended to express few concerns about social injustices.
14. Students, regardless of academic group and achievement level, expressed few concerns regarding peer pressures and relationships.
15. Students expressed strong, positive family achievement orientations, regardless of achievement level and academic group.

45
CHAPTER 4: Conclusions and Recommendations Few studies have been conducted with gifted African-American students. Thus,
we have limited information from which to understand and help these students. The current study was designed to fill this void, and was conducted with four objectives: (1) to generate profiles of underachievement relative to gifted, potentially gifted, and average African-American students in grades 6 through 9; (2) to identify correlates of underachievement (social, cultural, and psychological, racial identity, test anxiety, self and family achievement orientations, perception of the learning environment, and attitudes toward school subjects) among African-American youth in different academic groups; (3) to offer recommendations for improving the achievement of African-American students; and (4) to offer recommendations for increasing the representation and participation of African-American students in gifted programs.
The attitudes and perceptions of African-American middle and high school
students were examined relative to school subjects, the learning environment, test anxiety, achievement, peer relationships, family achievement orientations, and social injustices. The study of students' perceptions represents an important field of research, particularly as perceptions inform decisions and behaviors. Perceptions are reality to those holding the beliefs; thus, school personnel can ill-afford to ignore the thoughts and views of their minority students.
The African-American students were drawn from five mid-Atlantic school
districts during the 1995 school year. African-American students were under-represented in all of the school districts' gifted education programs. To ensure high representation of African-American students in the gifted programs, as well as higher levels of achievement, more comprehensive methods of identification are needed. Identification and assessment must focus on gifted students who are successful at demonstrating their ability, and those who have yet to do so. It cannot be emphasized enough that many African-American students have been overlooked for identification; they were categorized as "potentially gifted" in the present study. Albeit based on limited data (test scores and academic performance), the researcher believes that at least 45% of the sample should be given further consideration for identification and placement. Because many of these students were underachieving, their potential may be difficult to recognize. To recognize the potential of underachieving students, we must rely on both quantitative and qualitative indices. At the same time, we must understand not just how students are underachieving, but also why they are underachieving. We must also give serious consideration to the reality that students' whose abilities are not recognized are likely to underachieve.
It is often espoused that underachievers have poor attitudes toward school and
school subjects, and poor self-perceptions. However, the African-American students in this sample tended to hold positive attitudes toward school, school subjects, achievement, and their racial identity. These positive attitudes and self-perceptions do not explain students' underachievement. Better explanations were provided by students' behaviors.

46
This finding has also been reported by Mickelson (1984, 1990) and Ford (1992, 1993) who found that many African-American students' personify an attitude-achievement paradox, defined as a discrepancy between achievement beliefs and behaviors.
Students in this study often reported low levels of effort and spending little time
doing homework and studying. Academic counseling that focuses on improving study skills, time management, and work habits are often helpful for reversing academic underachievement. Yet, school personnel cannot customize or personalize interventions without an understanding of the etiology and correlates of underachievement. For instance, even though students have respectable GPAs, they do not report working to their potential, and many are told by their teachers to exert more effort. Some students may not understand the relationship between effort and achievement, many may experience "effortless success" (USDE, 1993). Other students may value outcomes more than effort, still others may attribute successes to task easiness, luck, fate, and ability, but not to effort. Many of the African-American students personify an attitude-behavior paradox, with high achievement ideologies and low effort as one indicator. Other indicators are low time commitment given to homework and studying, and much time given to TV viewing and social relationships.
These students need the assistance of counselors and teachers to help them make
the connection—effort, commitment, and quality time are important to achievement and success, regardless of academic group. Given the discrepancy between students' achievement ideology and achievement behaviors (e.g., time spent on homework vs. watching TV vs. being with friends), educational interventions are warranted. The African-American students must be made aware of these discrepancies, and find more effective ways to allocate their time and efforts, to balance work and play. Ultimately, the work ethic must be not only an ideal, but a reality.
Many estimates indicate that at least 20% of gifted students are underachieving.
In this study, approximately 40% of gifted African-American students underachieving. Overall, the sample's GPAs ranged from 2.1 to 3.7, which may lead some educators, counselors, and parents to perceive that students (gifted or not) are achieving at high or respectable levels. However, based on test scores, students in the current study can perform better academically, as measured by GPAs. Thus, traditional notions of underachievement based on level of GPA may fail to identify some students as underachieving. Hence, school personnel must not be content or complacent with the GPAs of students. It seems reasonable to conclude that some of the African-American students were not identified as gifted due to underachievement. For example, about half of the potentially gifted students were underachieving.
School personnel, particularly teachers and counselors, are encouraged to explore
those aspects of schools and classrooms that inhibit student learning and achievement. What do underachievers dislike about the learning environment? Similarly, as described elsewhere (Ford, 1996), it is essential that school personnel consider seriously the extent to which the curriculum is effective and multicultural in nature. Interventions must include providing supportive, nurturing environments for African-American students,
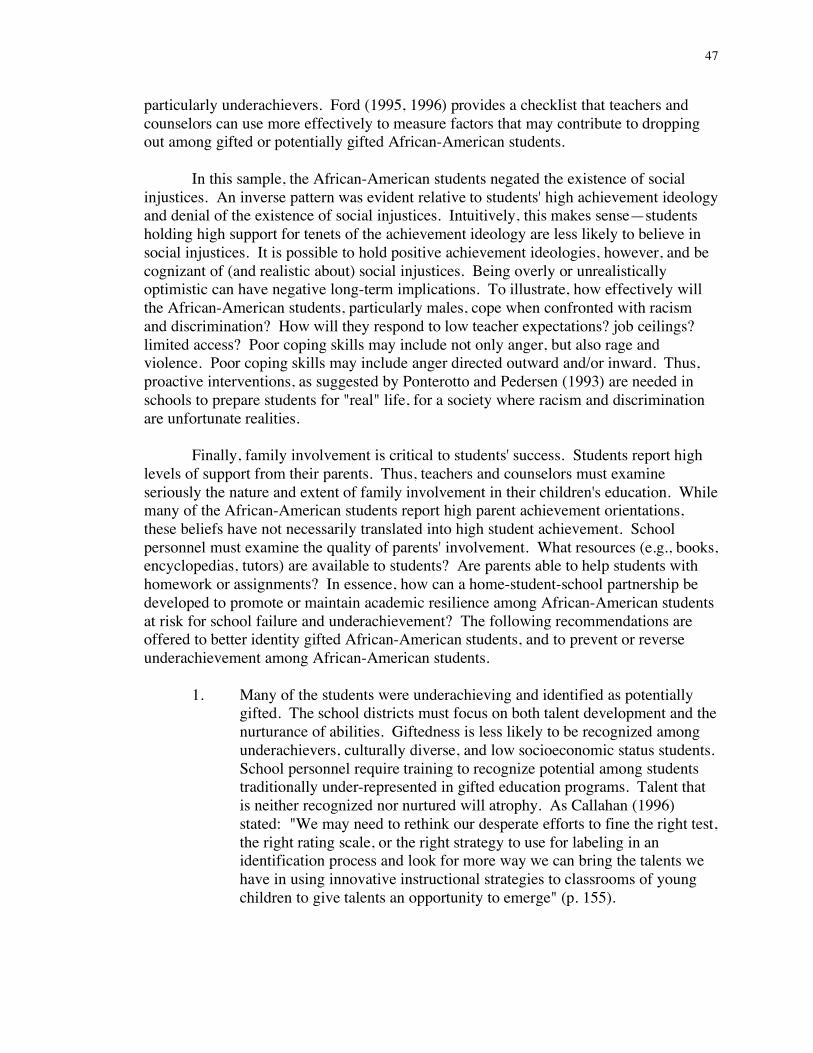
47
particularly underachievers. Ford (1995, 1996) provides a checklist that teachers and counselors can use more effectively to measure factors that may contribute to dropping out among gifted or potentially gifted African-American students.
In this sample, the African-American students negated the existence of social
injustices. An inverse pattern was evident relative to students' high achievement ideology and denial of the existence of social injustices. Intuitively, this makes sense—students holding high support for tenets of the achievement ideology are less likely to believe in social injustices. It is possible to hold positive achievement ideologies, however, and be cognizant of (and realistic about) social injustices. Being overly or unrealistically optimistic can have negative long-term implications. To illustrate, how effectively will the African-American students, particularly males, cope when confronted with racism and discrimination? How will they respond to low teacher expectations? job ceilings? limited access? Poor coping skills may include not only anger, but also rage and violence. Poor coping skills may include anger directed outward and/or inward. Thus, proactive interventions, as suggested by Ponterotto and Pedersen (1993) are needed in schools to prepare students for "real" life, for a society where racism and discrimination are unfortunate realities.
Finally, family involvement is critical to students' success. Students report high
levels of support from their parents. Thus, teachers and counselors must examine seriously the nature and extent of family involvement in their children's education. While many of the African-American students report high parent achievement orientations, these beliefs have not necessarily translated into high student achievement. School personnel must examine the quality of parents' involvement. What resources (e.g., books, encyclopedias, tutors) are available to students? Are parents able to help students with homework or assignments? In essence, how can a home-student-school partnership be developed to promote or maintain academic resilience among African-American students at risk for school failure and underachievement? The following recommendations are offered to better identity gifted African-American students, and to prevent or reverse underachievement among African-American students.
1. Many of the students were underachieving and identified as potentially
gifted. The school districts must focus on both talent development and the nurturance of abilities. Giftedness is less likely to be recognized among underachievers, culturally diverse, and low socioeconomic status students. School personnel require training to recognize potential among students traditionally under-represented in gifted education programs. Talent that is neither recognized nor nurtured will atrophy. As Callahan (1996) stated: "We may need to rethink our desperate efforts to fine the right test, the right rating scale, or the right strategy to use for labeling in an identification process and look for more way we can bring the talents we have in using innovative instructional strategies to classrooms of young children to give talents an opportunity to emerge" (p. 155).

48
2. School personnel must recognize the heterogeneous, multifaceted nature of underachievement. Neither test scores nor teachers are able to capture the strengths and weaknesses of minority students without using multiple instruments and procedures. Quantitative and qualitative measures are needed; information is required from teachers, the student, and parents or family members. One of our goals in gifted education must be to develop the means for better assessing students' needs, not just for the purpose of labeling, but also for matching services.
3. Psychological variables must be considered when examining
underachievement. These variables include exploring African-American students' racial identity and test anxiety as they impact academic performance and motivation. Without examining these variables, profiles of underachievement cannot be generated, rendering appropriate interventions almost impossible.
4. Many of the African-American students expressed the need and desire for
multicultural education in their schools and gifted education programs. As their comments suggest, curricular modifications can increase the motivation and engagement of African-American students. These changes must be multicultural in nature and integrated throughout the curriculum. All students benefit from education that is pluralistic and multicultural (Banks, 1995; Banks & Banks, 1995). The majority of students in the study are adamant that they desire curriculum that is multicultural because it increases self-understanding and self-appreciation, as well as racial pride. Relatedly, minority teachers are under-represented in education nationally; all school districts are encouraged to increase their efforts to recruit and retain minority teachers who can serve as mentors, role models, and advocates for minority students (Ford, Grantham, & Harris, in press).
5. There was a discrepancy between students' achievement ideology (which
is high) and achievement behaviors (which are low). Many students in the study were underachieving, including approximately 40% of gifted students, 40% of potentially gifted students, and 50% of average students. Yet, the students, notwithstanding academic group, hold strong and positive beliefs regarding the importance of school and the work ethic. The African-American students may require counseling to close the gap between their beliefs and behaviors (e.g., amount of time spent on homework, watching TV, and being with friends).
This discrepancy begs the question: To what extent are the African-
American students being realistic or overly optimistic regarding social injustices? African-American youth in contemporary America are likely to compare their current situations with the historical conditions of African
49
Americans. Comparing the past to the present, African-American students today see progress and hope:
[They] believe the achievement ideology to be an accurate depiction of the opportunity structure as it exists in the United States today because they perceive the racial situation to be substantively different for them than it was for their parents. (MacLeod, 1987, p. 130)
Counseling (individual and group) should focus on academic needs and
issues relative to underachievement, as well as psychological and socio-emotional needs. For example, many students expressed concerns about peer pressures and relationships. They may need help in coping with these negative pressures, as well as feelings of rejection, alienation, and isolation (Ford, 1995).
6. Students reported high family values and expectations regarding
achievement and success. Certainly, family involvement is a critical factor in students' success. Home-student-school partnerships are essential for promoting academic achievement among African-American students.
7. Underachievers felt less positive about their relationships with teachers,
and felt that they did not have sufficient opportunities to understand what is taught. Underachievers were also less positive about science, reading, and math than were achieving students. Consequently, school personnel may need formal training in working with underachieving students, including building positive relationships with these students and teaching students at the appropriate level so they are neither under-challenged to the point of boredom nor over-challenged to the point of frustration.
Limitations of the Study Every study comes with some limitations. The findings of this study are limited
in their generalizability to African-American students in grades 6 through 9. While these students came from five different school districts that were demographically and geographically diverse, small sample sizes in most districts prohibited comparative analyses.
The sample size also affects the extent to which findings can be applied to other
settings. Larger samples are needed to provide a more comprehensive picture of achievement and underachievement among African-American students.
Finally, all of the demographic data were self-reported, including parents'
educational level, occupational status, and employment status. Most of the students reported high parental levels of education and employment status, and most reported

50
paying full price for lunch. These demographics differ from the traditional profile of minority students, many of whom live in poverty. In this respect, the findings may have limited generalizability to students in other contexts.
Directions for Further Research Many methodologies are available for conducting studies. Further research is
needed that is longitudinal as well as cross-sectional in nature. These methodologies promise to shed additional light on underachievement from a developmental perspective. For example, how does underachievement vary by age?
Future studies should also include larger sample sizes and comparisons across
school demographics. For example, although the students came from five racially and geographically diverse school settings, comparisons could not be made because of the small number of African-American students in each district, particularly those identified as gifted. How do the variables differ in racially homogeneous versus heterogeneous school districts? How do they differ in rural versus urban schools? How do the variables differ with students of different SES levels?
Research must also include interviews with parents and teachers regarding their
perceptions of factors that affect students' achievement. These data can provide valuable insights into similar and different perceptions, as well as guide interventions. Comparisons of parent and teacher perceptions can be made with those of students. For instance, the students in the current study reported high levels of family achievement orientations. What are the perceptions of their parents? Students also believe that teachers think they are exerting high levels of effort (even though students' self-reports are low). What do teachers think about students' effort? How consistent are their perceptions and what are the educational implications?
A Final Word This study has sought to fill gaps in the literature by focusing on African-
American students of different ability levels who are achieving or underachieving. The study was designed to identify underachieving students and to explore differences in the attitudes and behaviors of these students. The quantitative and qualitative nature of this study provides a more comprehensive examination of underachievement than might result from only one methodological approach. Relying on psychometric data alone increases the chances of missing high ability students and underachieving students who do not test well. Underachievement is a complex phenomenon whose etiology is difficult to identify and equally difficult to reverse. Efforts to identify, serve, and reverse underachievement among students must be on-going and comprehensive. Information must be gathered from students, parents, and school personnel, and data must be qualitative and quantitative.

51
Many students, regardless of ability level and race, do not perform to their potential in school. School personnel must look for talent and ability among all students and seek to develop and nurture the strengths of these students. As Treffinger and Feldhusen (1996) recently noted:
Contemporary approaches to talent development propose that we assume a dual role: that of responding appropriately (and flexibly) to the needs of students who already demonstrate very high levels of accomplishment in specific talent areas and initiating deliberate educational activities to seek and nurture the talents of all students. (p. 188)


53
References Achenbach, T. M. (1985). Assessment of anxiety in children. In A. H. Tuma &
J. D. Master (Eds.), Anxiety and the anxiety disorders (pp. 707-734). Hillsdale, NJ: Erlbaum.
Alamprse, J. A., & Erlanger, W. J. (1988). No gift wasted: Effective strategies
for educating highly able, disadvantaged students in mathematics and science (Vol. 1: Findings). Washington, DC: Cosmos Corporation.
Ames, C., & Archer, J. (1988). Achievement goals in the classroom: Students'
learning strategies and motivation processes. Journal of Educational Psychology, 80, 260-267.
Banks, J. A. (1995). Multicultural education: Historical development,
dimensions, and practice. In J. A. Banks & C. A. M. Banks (Eds.), Handbook of research on multicultural education (pp. 3-24). New York: Macmillan.
Banks J. A., & Banks C. A. M. (Eds.). (1995). Handbook of research on
multicultural education. New York: Macmillan. Bauermeister, J. J., & Berlingeri, N. C. (1974). Rendimeniento academico en
funcion del nivel de ansiedadresgo, sexo y habilidad general. Revista Interamericana de Psycholigia, 8, 1-2.
Beidel, D. C., & Turner, S. M. (1988). Comorbidity of test anxiety and other
anxiety disorders in children. Journal of Abnormal Child Psychology, 16, 275-287. Bronfenbrenner, V. (1986). Alienation and the four worlds of childhood. Phi
Delta Kappan, 67, 430-436. Calabrese, R. L., & Poe, J. (1990). Alienation: An explanation of high dropout
rates among African American and Latino students. Educational Research Quarterly, 14, 22-26.
Callahan, C. M. (1996). Critical self-study of gifted education: Healthy practice,
necessary evil, or sedition? Journal for the Education of the Gifted, 19, 148-163. Clark, R. (1983). Family life and school achievement: Why poor Black children
succeed or fail. Chicago: University of Chicago Press. Clawson, T. W., Firment, C. K., & Trower, L. L. (1989). Test anxiety: Another
origin for racial bias in standardized testing. Measurement and Evaluation in Guidance, 13, 210-215.

54
Crocker, L., Schmitt, A., & Tang, L. (1988). Test anxiety and standardized achievement test performance in the middle school years. Measurement and Evaluation in Counseling and Development, 20, 149-157.
Cross, W. E., Jr. (1995). The psychology of Nigrescence: Revising the Cross
model. In J. G. Ponterotto, J. M. Casas, L. A. Suzuki, & C. M. Alexander (Eds.), Handbook of multicultural counseling (pp. 93-122). Thousand Oaks, CA: Sage.
Darling-Hammond, L. D. (Ed.). (1994). Review of research in education.
Washington, DC: American Educational Research Association. Davis, G. A., & Rimm, S. B. (1989). Education of the gifted and talented (2nd
ed.). Englewood Cliffs, NJ: Prentice Hall. Dirkes, M. A. (1985). Anxiety in the gifted: Pluses and minuses. Roeper
Review, 8, 13-15. Dusek, J. B. (1980). The development of test anxiety in children. In I. G.
Sarason (Ed.), Test anxiety: Theory, research, and applications (pp. 87-110). Hillsdale, NJ: Erlbaum.
Dusek, J. B., Kermis, M. D., & Mergler, N. L. (1975). Information processing in
low and high test-anxious children as a function of grade level and verbal labeling. Developmental Psychology, 11, 651-652.
Felice, L. G. (1981). Black student dropout behavior: Disengagement from
school rejection and racial discrimination. Journal of Negro Education, 50, 415-424. Ford, D. Y. (1991). Self-perceptions of social, psychological, and cultural
determinants of achievement among gifted Black students: A paradox of underachievement. Unpublished doctoral dissertation, Cleveland State University, Cleveland, OH.
Ford, D. Y. (1992). Determinants of underachievement as perceived by gifted,
above-average, and average Black students. Roeper Review, 14, 130-136. Ford, D. Y. (1993). An investigation into the paradox of underachievement
among gifted Black students. Roeper Review, 16, 78-84. Ford, D. Y. (1994a). The recruitment and retention of African American students
in gifted programs (RBDM 9406). Storrs, CT: University of Connecticut, The National Research Center on the Gifted and Talented.
Ford, D. Y. (1994b). Promoting achievement among gifted Black students: The
efficacy of new definitions and identification practices. Urban Education, 29, 202-229.

55
Ford, D. Y. (1995). Counseling gifted African American students: Underachievement, identity, and social and emotional well-being (RBDM 9506). Storrs, CT: University of Connecticut, The National Research Center on the Gifted and Talented.
Ford, D. Y. (1996). Reversing underachievement among gifted Black students:
Promising practices and programs. New York: Teachers College Press. Ford, D. Y., Grantham, T., & Harris III, J. J. (in press). The recruitment and
retention of minority teachers: Implications for gifted education. Roeper Review. Ford, D. Y., Harris III, J. J., & Schuerger, J. M. (1993). Racial identity
development among gifted Black students: Counseling issues and concerns. Journal of Counseling and Development, 71, 409-417.
Ford, D. Y., & Webb, K. S. (1995). Desegregation of educational programs:
The impact of Brown on underachieving children of color. Journal of Negro Education, 63, 358-375.
Fordham, S. (1988). Racelessness as a strategy in Black students' school success:
Pragmatic strategy or pyrrhic victory? Harvard Educational Review, 58, 54-84. Fordham, S. (1991). Peer-proofing academic competition among Black
adolescents: "Acting White" Black American style. In C. E. Sleeter (Ed.), Empowerment through multicultural education (pp. 69-93). Albany, NY: State University of New York Press.
Fordham, S. (1996). Blacked out: Dilemmas of race, identity, and success at
Capital High. Chicago: The University of Chicago Press. Fordham, S., & Ogbu, J. (1986). Black students' school success: Coping with
the "burden of 'acting White'." The Urban Review, 18, 176-203. Frasier, M. M., Garcia, J. H., & Passow, A. H. (1995). A review of assessment
issues in gifted education and their implications for identifying gifted minority students (RM95204). Storrs, CT: University of Connecticut, The National Research on the Gifted and Talented.
Gross, M. U. M. (1985). The pursuit of excellence of the search for intimacy:
The forced-choice dilemma of gifted youth. Roeper Review, 11, 189-193. Harris J. J., III, & Ford, D. Y. (1991). Identifying and nurturing the promise of
gifted Black American children. Journal of Negro Education, 60, 3-18. Hembree, R. (1988). Correlates, causes, effects, and treatment of test anxiety.
Review of Educational Research, 58, 47-77.

56
Hill, K. T. (1972). Anxiety in the evaluative context. In W. Hartup (Ed.), The young child (Vol. 2, pp. 225-263). Washington, DC: National Association for the Education of Young Children.
Hill, K. T., & Sarason, S. B. (1966). The relation of test anxiety and
defensiveness to test and school performance over the elementary school years: A further longitudinal study. Monographs of the Society for Research in Child Development, 31 (2, serial no. 104).
Hill, K. T., & Wigfield, A. (1984). Test anxiety: A major educational problem
and what can be done about it. Elementary School Journal, 85, 105-126. Hollingworth, L. S. (1940). Old heads on young shoulders. Public Addresses,
104-110. Howard, J., & Hammond, R. (1985). Rumors of inferiority: The hidden
obstacles to Black success. The New Republic, 3686, 17-21. Irvine, J. J. (1991). Black students and school failure: Policies, practices, and
prescriptions. New York: Praeger. Ladson-Billings, G. (1994). The dreamkeepers: Successful teachers for African
American children. San Francisco: Jossey-Bass. Lajoie, S. P., & Shore, B. M. (1981). Three myths? The over-representation of
the gifted among drop-outs, delinquents, and suicides. Gifted Child Quarterly, 25, 138-141.
Lee, C. (1984). An investigation of psychosocial variables related to academic
success for rural Black adolescents. Journal of Negro Education, 53, 424-433. Leon, M. R. (1989). Anxiety and the inclusiveness of information processing.
Journal of Research in Personality, 23, 85-98. MacLeod, J. (1987). Ain't no makin' it: Leveled aspirations in a low-income
neighborhood. Boulder, CO: Westview Press. Maehr, M. (1984). Meaning and motivation: Toward a theory of personal
investment. In R. Ames & C. Ames (Eds.), Research on motivation in education (Vol. 1, pp. 115-144). New York: Academic Press.
Mandel, H. P., & Marcus, S. I. (1988). The psychology of underachievement:
Differential diagnosis and differential treatment. New York: Wiley.

57
Mickelson, R. A. (1984). Race, class, and gender differences in adolescents' academic achievement attitudes and behaviors. Unpublished doctoral dissertation. University of California, Los Angeles.
Mickelson, R. A. (1990). The attitude-achievement paradox among Black
adolescents. Sociology of Education, 63, 44-61. Neill, D. M., & Medina, N. J. (1989). Standardized testing: Harmful to
educational health. Phi Delta Kappan, 70, 688-697. Ogbu, J. U. (1987). Variability in minority school performance: A problem in
search of an explanation. Anthropology and Education Quarterly, 18, 312-334. Parham, T. A., & Helms, J. E. (1985). Relation of racial identity attitudes to self-
actualization and affective states of Black students. Journal of Counseling Psychology, 32, 431-440.
Payne, B. D., Smith, J. E., & Payne, D. A. (1983). Grade, sex, and race
differences in test anxiety. Psychological Reports, 53, 291-294. Phelan, P., Yu, H. C., & Davidson, A. L. (1994). Navigating the psychosocial
pressures of adolescence: The voices and experiences of high school youth. American Educational Research Journal, 31, 415-447.
Phinney, J. S. (1989). Stages of ethnic identity development in minority group
adolescents. Journal of Early Adolescence, 9(1-2), 34-49. Ponterotto, J. G., & Pedersen, P. B. (1993). Preventing prejudice: A guide for
counselors and educators. Newbury Park, NJ: Sage. Prom-Jackson, S., Johnson, S. T., & Wallace, M. B. (1987). Home environment,
talented minority youth, and school achievement. Journal of Negro Education, 56, 111-121.
Rhone, L. M. (1986). Measurement of test anxiety among selected Black
adolescents: Appropriateness of four anxiety scales. Journal of School Psychology, 24, 313-319.
Richardson, R. L., & Gerlach, S. C. (1980). Black dropouts: A study of
significant factors contributing to a Black student's decision. Urban Education, 14, 489-494.
Rotheram, M. J., & Phinney, J. S. (1987). Introduction: Definitions and
perspectives in the study of children's ethnic socialization. In J. S. Phinney & M. J. Rotheram (Eds.), Children's ethnic socialization (pp. 10-28). Newbury Park, CA: Sage.

58
Rumberger, R. W. (1983). Dropping out of high school: The influence of race, sex, and family background. American Educational Research Journal, 20, 199-220.
Rumberger, R. W. (1987). High school dropouts: A review of issues and
evidence. Review of Educational Research, 57, 101-121. Rumberger, R. W. (1995). Dropping out of school: A multilevel analysis of
students and schools. American Educational Research Journal, 32, 555-625. Sarason, S. B. (Ed.). (1980). Test anxiety: Theory, research, and applications.
Hillsdale, NJ: Erlbaum. Sarason, S. B., Davidson, K. S., Lighthall, F. F., Waite, R. R., & Ruebush, B. K.
(1960). Anxiety in elementary school children. New York: Wiley. Sarason, S. B., & Mandler, G. (1952). Some correlates of test anxiety. Journal
of Abnormal and Social Psychology, 47, 561-565. Smith, E. M. J. (1985). Ethnic minorities: Life stress, social support, and mental
health issues. The Counseling Psychologist, 13, 537-579. Smith, E. M. J. (1989). Black racial identity development: Issues and concerns.
The Counseling Psychologist, 17, 277-288. Spencer, M. (1985). Black children's race awareness, racial attitudes, and self-
concept: A reinterpretation. Annual Progress in Child Psychiatry and Child Development, 25, 433-441.
Taylor, R. D., Casten, R., Flickinger, S. M., Roberts, D., & Fulmore, C. D.
(1994). Explaining the school performance of African-American adolescents. Journal of Research on Adolescence, 4, 21-44.
Treffinger, D. J., & Feldhusen, J. F. (1996). Talent recognition and development:
Successor to gifted education. Journal for the Education of the Gifted, 19, 188-193. Tryon, G. S. (1980). The measurement and treatment of test anxiety. Review of
Educational Research, 50, 343-372. Turner, B. B., Beidel, D. C., Hughes, S., & Turner, M. W. (1993). Test anxiety
in African American school children. School Psychology Quarterly, 8, 140-152. U. S. Department of Education. (1993). National excellence: A case for
developing America's talent. Washington, DC: Author. Whitmore, J. R. (1980). Giftedness, conflict, and underachievement. Boston:
Allyn & Bacon.

59
Whitmore, J. R. (1986). Understanding a lack of motivation to excel. Gifted Child Quarterly, 30, 66-69.
Willig, A. C., Harnisch, D. L, Hill, K. T., & Maehr, M. (1983). Sociocultural
and educational correlates of success-failure attributions and evaluation anxiety in the school setting for Black, Hispanic, and Anglo children. American Educational Research Journal, 20, 385-410.
Wine, J. (1980). Cognitive-attentional theory of test anxiety. In I. G. Sarason
(Ed.), Test anxiety: Theory, research, and applications (pp. 349-385). Hillsdale, NJ: Erlbaum.


61
Appendix
Instrumentation


63
Interviewer's Name_________________________
Date__________________________
Survey Number _______________________ Student's Name _______________________________ ID Number ______________ School _______________________________________ Gifted Program? (Yes / No) GPA ___________________ Course Enrollment and Grades
(1) ____________________________________ (2) ____________________________________ (3) ____________________________________ (4) ____________________________________ (5) ____________________________________ (6) ____________________________________ (7) ____________________________________ (8) ____________________________________
Achievement Test Scores: (Name of achievement test _________________________ )
GRADE reading vocabulary language math social studies
science
Other
4
8

64
Attitudes Toward School and Achievement Survey
Donna Y. Ford-Harris, Ph.D.
Purpose:
This questionnaire will help school personnel understand how you and other students feel about school and the things that happen in school. It contains several sections that ask how you feel about:
(a) school, (b) school subjects, (c) taking tests, and (d) friends and classmates. You will also be asked questions about yourself, your teachers, and your family.
Directions:
Read each question carefully. Then mark one answer that is closest to what you think and how you feel. Remember—this is not a test. There are no right or wrong answers. It is important to tell what you really think and how you feel. For most of the sections, you will indicate whether you strongly agree, agree, disagree, or strongly disagree:
◆◆◆◆◆◆◆◆◆◆◆◆
SD means "strongly disagree" D means "disagree"
A means "agree" SA means "strongly agree"
◆◆◆◆◆◆◆◆◆◆◆◆
Confidentiality:
Your answers to these questions will be kept confidential. You will not be identified and your individual answers will not be shared with anyone.
Your participation in this study is appreciated.
Note. Some of the statements use the term "Black," others use "African-American."

65
I am going to ask you some questions about yourself, your friends, school and family. I will put a check by the answer that you believe describes you the best. Answer as honestly as possible. If you don't understand a question, please tell me and I will explain it to you. Okay? 1. Gender: Male ( ) Female ( ) 2. How old are you? ________ 3. What grade are you in? 7th ( ) 8th ( ) 9th ( ) 4. Are you participating in a gifted program (e.g., honors courses, enrichment
courses)? No ( ) Yes ( ) 5. How do you describe your race? Black or African American ( ) White or European American ( ) Hispanic or Latin American ( ) Other __________________ ( ) 6. Whom do you live with? Mother ( ) Father ( ) Mother and Father ( ) Other relative or guardian ( ) 7. Do you any of your grandparents, cousins, aunts or uncles live with you? No ( ) Yes ( ) 8. What is the highest level of schooling for your mother or guardian? Did not graduate from high school ( ) General education degree (GED) ( ) High school degree/diploma ( ) Went to college but did not graduate ( ) College degree ( )

66
9. What is the highest level of schooling for your father or guardian? Did not graduate from high school ( ) General education degree (GED) ( ) High school degree/diploma ( ) Went to college but did not graduate ( ) College degree ( ) 10. Does your mother/guardian work? No ( ) Yes ( ) Don't know ( ) IF YES, WHAT DOES SHE DO? ____________________ 11. Does your father/guardian work? No ( ) Yes ( ) Don't know ( ) IF YES, WHAT DOES HE DO? _____________________ 12. Which do you receive? free lunch ( ) reduced lunch ( ) pay full price ( ) The next set of questions is different from those you just answered. These questions will ask about your ideas or beliefs about school work. Please answer as honestly as possible. Do you have any questions? EDUCATION 1a. What type of grades do you usually get in school? (check all that apply.) As ( ) Bs ( ) Cs ( ) Ds ( ) Fs ( ) Other ( ) 1b. What was your grade point average for the last grading period? ___________

67
2a. What do your teachers say about your effort on school work? You don't try at all ( ) You should try harder ( ) You try hard ( ) 3a. What is your favorite class in school? ______________________________________________________ 4a. Why is this your favorite class? ______________________________________________________ ______________________________________________________ 5a. What class do you dislike most? ______________________________________________________ 6a. Why do you dislike this class? ______________________________________________________ ______________________________________________________ 7a. How important is school to you? Not Important ( ) Important ( ) Very Important ( ) 8a. Do you want to go to college? I don't know ( ) No, I don't want to go ( ) Yes, I want to go ( ) 9a. What do you want to be when you grow up? ______________________________________________________ 10a. Do you spend a lot of time doing homework? No ( ) Yes ( )

68
11a. About how many hours per day do you spend on homework?_________ hours 12a. Do you spend more time watching TV than studying? No ( ) Yes ( ) 13a. Do you spend more time doing homework than playing and hanging out with
your friends? No ( ) Yes ( ) 14a. Could you do better in school if you tried? No ( ) Yes ( ) 15a. Do you want to do better in school? No ( ) Yes ( )

69
Learning Environment Scale
The following questions explore how you feel about school. Choose only one answer for each statement. There are no right or wrong answers.
SA A D SD
1. Most of my classes are interesting.
2. I feel understood by my teachers in most of my classes.
3. My teachers like me.
4. I always understand the lessons.
5. My teachers are easy to talk to.
6. I feel important in my classes.
7. I am often called on to answer questions.
8. When class starts, I am ready to learn.
9. My teachers treat me with respect.
10. I ask questions when I don't understand.
11. My teachers help me understand if I am confused.
12. We have lots of activities in class.
13. My teachers give me time to practice what is being taught.
14. I feel free to say "I don't understand."
15. I look forward to going to school.
16. I get along well with my teachers.
17. Teachers at my school like working with Black students.
18. I would rather go to this school than to another school.
19. My teachers grade fairly.
20. Most of the time I do not want to go to school.

70
SA A D SD
21. Teachers at my school seem to enjoy their work.
22. The feelings and ideas of students are important at my school.
23. I would like to see many changes at my school.
24. Teachers usually want things done their own way and not my way.
25. Most of my teachers do not like students who ask a lot of questions.
26. Black students feel important at my school.
27. Most of my teachers act as if they are always right and I am always wrong.
28. Teachers enjoy working with all students.
29. The work I do in most classes is important to me.
30. I really like most of my teachers.
31. I like school.
32. Students have power and help make decisions in school.
33. Teachers listen to the ideas of Black students.
34. In some classes, I watch the time/clock; I often count the minutes until the class ends.
35. Most of my teachers really listen to what I have to say.
36. My teachers explain things well, so that I can understand them.

71
Racial Identity Scale for Black Students
Below are statements that tell how some people feel about themselves. Check the answer that best describes how you feel. Remember, there are no right or wrong answers.
SA A D SD
1. Being Black is an important part of the way I see myself.
2. Everybody should learn about the cultures of other groups.
3. I try to learn more about African-Americans by talking to other people about my heritage.
4. Black people have made a lot of progress in society.
5. My future is tied to the future of other Blacks.
6. I try to get along with other racial and cultural groups.
7. Black people should see themselves as Black first and foremost.
8. I am ashamed to be African-American.
9. I sometimes feel that other students do not like me because I am African-American.
10. All racial and cultural groups should try to get along.
11. Black is beautiful.
12. Being Black is not important to my sense of who I am.
13. I am determined to find my Black identity.
14. Black people are more similar than different from White people.
15. I don't get along well with White people.
16. I feel like I belong to other Black people.

72
SA A D SD
17. I have a lot of pride in my racial group and our accomplishments.
18. Because I am Black, I have many strengths.
19. It is better for Black students to go to all Black schools.
20. I feel close to other Black people.
21. I spend a lot of time trying to find out more about my own racial and cultural group (e.g., history, traditions, and customs).
22. I sometimes feel that other students do not like me because I am not White.
23. Being Black has little to do with how I feel about myself.
24. Some people think that Black people do not contribute to society.

73
Self-Perceptions of Factors Affecting Black Student Achievement Scale Now I am going to ask you some questions about things that might stop you or other students from doing your best in school. You have four answers to choose from. Later, I might ask you to explain some of your answers. When you see the word "STOP" at the end of the page, please let me know. Do you have any questions before we begin? any questions before we continue?
◆◆◆◆◆◆◆◆◆◆◆◆
SA means "strongly agree" A means "agree"
D means "disagree" SD means "strongly disagree"
◆◆◆◆◆◆◆◆◆◆◆◆
SA A D SD 1. Teachers play an important role in my doing well in school. SA A D SD 2. Some people are poor because they dropped out of school. SA A D SD 3. If Black people do not have a good job, they blame White people. SA A D SD 4. Speaking standard or proper English will help me get a good job. SA A D SD 5. Some people who drop out of school are really smart. SA A D SD 6. I have a hard time learning when my teacher is mean to me. SA A D SD 7. Anyone can do well in school if he or she tries. SA A D SD 8. School is hard. SA A D SD 9. If I do well in school, I can get the kind of job I want. SA A D SD 10. My parents/guardians expect me to do well in school. SA A D SD 11. People who don't do well in school can still get a good job. SA A D SD 12. I can grow up to be the President of the United States if I want to. SA A D SD

74
13. My parents/guardians play an important role in my success. SA A D SD 14. People in my family have been treated mean or unfairly by White people. SA A D SD 15. Because of my parents/guardians, I try to do well in school. SA A D SD 16. I do better in classes where teachers try to understand me. SA A D SD 17. I get tired of learning about White people in class. SA A D SD 18. When I make the honor or merit roll, other students feel bad (e.g., angry, upset, jealous) if they do not make it. SA A D SD 19. Most Black people have been treated mean or unfairly by White people. SA A D SD 20. I am responsible for my own success. SA A D SD 21. Some day, a Black person will become President of the United States. SA A D SD 22. I can grow up to be anything I want to be. SA A D SD 23. I worry a lot about students teasing me for getting good grades. SA A D SD 24. If I feel different from other students, I won't do my best in school. SA A D SD 25. I make good grades when I work hard in school. SA A D SD 26. I don't care what other students say about me, I try to do my best in school. SA A D SD 27. I am afraid not to do things with my friends because they might not like me. SA A D SD 28. If I am lucky, I will get a good job when I grow up. SA A D SD 29. I don't like teachers to brag or tell others when I make good grades. SA A D SD 30. My friends are more important to me than school. SA A D SD 31. When I make good grades, it is because I am lucky. SA A D SD 32. I neglect my studies to do things with my friends. SA A D SD

75
33. For most people, going to school is a waste of time. SA A D SD 34. I am tired of being teased at school because I am smart or make good grades. SA A D SD 35. I think some people will try to stop me from getting a good job when I grow up. SA A D SD 36. If students tease me about doing well in school, I let my grades drop—even if I know the work. SA A D SD 37. If people don't do well, they won't be successful. SA A D SD 38. Smart students don't make or have lots of friends. SA A D SD 39. Sometimes, other students tease me about making good grades. SA A D SD 40. My parents/guardians think being in a gifted program is important. SA A D SD 41. Other students think I am "showing off" or being the "teacher's pet" when I answer a lot of questions. SA A D SD 42. My parents/guardian told me that if I want to be successful, I must work hard in school. SA A D SD 43. My parents/guardians and teachers get along well. SA A D SD 44. In my school, students get into fights or arguments if they make good grades. SA A D SD 45. I don't raise my hand in class because students will say that I am "showing off." SA A D SD 46. Getting good grades is important to me. SA A D SD 47. If I don't do well in school, I can still get a good job. SA A D SD 48. Having friends is really important to me. SA A D SD 49. School is more exciting when I learn about Black people. SA A D SD 50. Some of the "class clowns" are really smart. SA A D SD 51. When I need help with school work, my parents/guardians try to help me. SA A D SD 52. If you are Black, going to school is a waste of time. SA A D SD

76
53. The better I do in school, the less friends I have. SA A D SD 54. If I compete with a White person for a job, the White person is more likely to get it. SA A D SD 55. If Black people do well in school, they can get the kind of job they want. SA A D SD 56. My parents/guardians believe that going to school is important. SA A D SD 57. Gifted programs are for White students only. SA A D SD 58. One of the best ways to become successful in life is to do well in school. SA A D SD 59. Black students say that I am "acting White" when I make good grades or speak standard English. SA A D SD 60. My family is proud of me when I do well in school. SA A D SD 61. Black people who don't do well in school can still get a good job. SA A D SD 62. Smart students do not have many friends. SA A D SD 63. Black students have told me that I act as if I am White. SA A D SD 64. Some students think that gifted programs are for the "teacher's pet" or "nerds." SA A D SD 65. I get more interested in school when we learn about Black people. SA A D SD 66. I don't want to be in school if my friends are not there. SA A D SD 67. Some students won't be friends with me because I am smart or because I make good grades. SA A D SD 68. Black people have to work harder in school than White people to become successful. SA A D SD 69. I take foolish dares/risks to impress other students. SA A D SD 70. I think gifted programs are for nerds and teachers' pets. SA A D SD 71. I worry about whether other students really like me. SA A D SD 72. I can get along with most of my classmates. SA A D SD

77
73. If Black people don't do well in school, they won't be successful. SA A D SD 74. I prefer to be in classes with my friends. SA A D SD 75. Black students don't need to be in gifted programs. SA A D SD 76. White students have told me that I act as if I am White. SA A D SD 77. My parents/guardians encourage me to do well in school. SA A D SD 78. I want to learn more about Black people in school. SA A D SD 79. My parents/guardians value education and achievement. SA A D SD 80. One of the best ways for Blacks to become successful is to do well in school. SA A D SD 81. If I do well in school, I can earn a lot of money when I grow up. SA A D SD 82. White people have more power and money than Black people. SA A D SD 83. The smart students get beat up a lot. SA A D SD 84. I want to learn less about White people in school. SA A D SD 85. If I don't do well in school, I won't be successful. SA A D SD 86. I know some students who will not do well in school because other students might tease them. SA A D SD 87. I would prefer to be in a regular school program than be in a gifted program. SA A D SD 88. One of the best ways for me to become successful is to do well in school. SA A D SD
* * * * STOP * * * *

78
◆◆◆◆◆◆◆◆◆◆◆◆ Earlier, I stated that you might have to explain some of your answers. I want to go back to those questions and talk about them briefly. Okay? 1. Teachers play an important role in my doing well in school. What do you mean? ________________________________________________________________ ________________________________________________________________ 14. People in my family have been treated mean or unfairly by White people. Tell
me why you answered this way. ________________________________________________________________ ________________________________________________________________ 15. Because of my parents/guardians, I try to do well in school. Please explain why
you feel this way. ________________________________________________________________ ________________________________________________________________ 17. I get tired of learning about White people in class. Tell me why you responded
this way. ________________________________________________________________ ________________________________________________________________ 19. Most Black people have been treated mean or unfairly by White people. Tell
me more. ________________________________________________________________ ________________________________________________________________ 20. I am responsible for my own success. Please tell me what you meant by your
answer. ________________________________________________________________ ________________________________________________________________

79
23. I worry a lot about students teasing me for getting good grades. Why did you respond this way?
________________________________________________________________ ________________________________________________________________ 36. If students tease me about doing well in school, I let my grades drop—even if I
know the work. Why do you think this happens? ________________________________________________________________ ________________________________________________________________ 52. If you are Black, going to school is a waste of time. Tell me more about your
answer. ________________________________________________________________ ________________________________________________________________ 54. If I compete with a White person for a job, the White person is more likely to
get it. Why do you think this? ________________________________________________________________ ________________________________________________________________ 57. Gifted programs are for White students only. Please explain your answer in
more detail. ________________________________________________________________ ________________________________________________________________ 59. Black students say that I am "acting White" when I make good grades or
speak standard English. Please explain what you mean. ________________________________________________________________ ________________________________________________________________

80
65. I get more interested in school when we learn about Black people. Please explain your answer in more detail.
________________________________________________________________ ________________________________________________________________ 66. I don't want to be in school if my friends are not there. Why did you respond in
this way? ________________________________________________________________ ________________________________________________________________ 67. Some students won't be friends with me because I am smart or because I make
good grades. Tell me more. ________________________________________________________________ ________________________________________________________________ 68. Black people have to work harder in school than White people to become
successful. Tell me why you responded this way. ________________________________________________________________ ________________________________________________________________ 70. I think that gifted programs are for nerds and teachers' pets. Why do you think
this? ________________________________________________________________ ________________________________________________________________ 75. Black students don't need to be in gifted programs. Why do you feel this way? ________________________________________________________________ ________________________________________________________________

81
78. I want to learn more about Black people in school. Please tell me why you feel this way.
________________________________________________________________ ________________________________________________________________ 87. I would prefer to stay in a regular school program rather than be in a gifted
program. Please explain your response. ________________________________________________________________ ________________________________________________________________
Thank you for participating in this study.


83
Research Monograph SeriesThe National Research Center on the Gifted and Talented
The University of Connecticut362 Fairfield Road, U-7Storrs, CT 06269-2007
www.ucc.uconn.edu/~wwwgt
Production AssistantsDawn R. Guenther
Siamak Vahidi
ReviewersBeverly Coleman
Bessie DuncanE. Jean GubbinsHilda RosselliRose Rudnitski
Also of Interest
Regular Classroom Practices With Gifted Students: Results of a National Survey of Classroom Teachers
Francis X. Archambault, Jr., et al.
An Observational Study of Instructional and Curricular Practices Used With Gifted and Talented Students in Regular Classrooms
Karen L. Westberg, et al.
Why Not Let High Ability Students Start School in January?The Curriculum Compacting Study
Sally M. Reis, et al.
Evaluation of the Effects of Programming Arrangements on Student Learning OutcomesMarcia A. B. Delcourt, et al.
Qualitative Extension of the Learning Outcomes StudyMarcia A. B. Delcourt and Karen Evans

84
Toward a New Paradigm for Identifying Talent PotentialMary M. Frasier and A. Harry Passow
Talents in Two Places: Case Studies of High Ability Students With Learning Disabilities Who Have Achieved
Sally M. Reis, Terry W. Neu, and Joan M. McGuire
The Effects of Group Composition on Gifted and Non-gifted Elementary Students in Cooperative Learning Groups
David A. Kenny, Francis X. Archambault, Jr., and Bryan W. Hallmark
Extending the Pedagogy of Gifted Education to All StudentsSally M. Reis, Marcia Gentry, and Sunghee Park
Case Studies of Talented Students Who Achieve and Underachieve in an UrbanHigh School
Sally M. Reis, et al.
Profiles of Successful Practices for High Ability Students in Elementary ClassroomsKaren L. Westberg and Francis X. Archambault, Jr.
Academic Diversity in the Middle School: Results of a National Survey of Middle School Administrators and Teachers
Tonya Moon, Carol A. Tomlinson, and Carolyn M. Callahan
A Triarchic Approach to GiftednessRobert J. Sternberg
Also of interest from the
Research Monograph Series

85
The National Research
Centeronthe
Giftedand
TalentedResearch
Teams
NRCG/T
The University of ConnecticutDr. Francis X. Archambault, Associate DirectorThe University of ConnecticutSchool of Education, U-4Storrs, CT 06269-2004860-486-4531
Dr. Alexinia Y. BaldwinDr. Scott W. BrownDr. Deborah E. BurnsDr. David A. KennyDr. Jonna KulikowichDr. Sally M. ReisDr. Karen L. WestbergDr. Michael F. Young
The University of GeorgiaDr. Mary M. Frasier, Associate Director The University of GeorgiaDepartment of Educational Psychology 323 Aderhold HallAthens, GA 30602-7146404-542-5106
Dr. Scott L. Hunsaker
The University of Virginia
Dr. Carolyn M. Callahan, Associate DirectorCurry School of EducationThe University of Virginia405 Emmet StreetCharlottesville, VA 22903804-982-2849
Dr. Michael S. CaldwellDr. Marcia A. B. Delcourt Dr. Kathleen MayDr. Claudia SowaDr. Ellen TomchinDr. Carol A. Tomlinson
Yale UniversityDr. Robert J. Sternberg, Associate DirectorDepartment of PsychologyYale University P.O. Box 208205New Haven, CT 06520-8205203-432-4632
Dr. Pamela Clinkenbeard