the national tidal datum convention of 1980 national tidal datum convention of 1980 may 1980 --........
TRANSCRIPT
The National Tidal
Datum Convention of 1980
May 1980
--......
U.S. DEPARTMENT OF COMMERCE
National Oceanic and Atmospheric Administration
National Ocean Survey

I
by Steacy D. Hicks
Physical Oceanographer
Office of Oceanography
Tides and Water Levels Division
May 1980
--
I I
n1
U.S. DEPARTMENT OF COMMERCE
Philip M. Klutznick, Secretary
I
n
National Oceanic and Atmospheric Administration Richard A. Frank, Administrator
National Ocean Survey
H.R. Lippold, Jr., Director
1 0

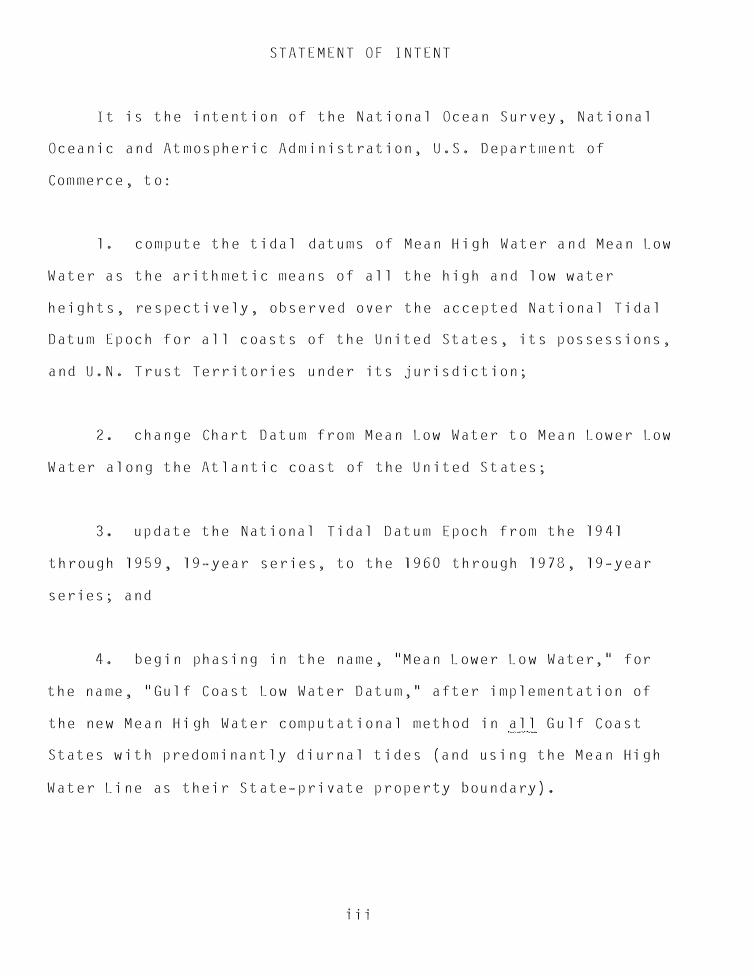
STATEMENT OF INTENT
It is the intention of the National Ocean Survey, National
Oceanic and Atmospheric Administration, U.S. Departrnent of
Commerce, to:
l. compute the tidal datums of Mean High Water and Mean Low
Water as the arithmetic means of all the high and low water
heights, respectively, observed over the accepted National Tidal
Datum Epoch for all coasts of the United States, its possessions,
and U.N. Trust Territories under its jurisdiction;
2. change Chart Datum from Mean Low Water to Mean Lower Low
Water along the Atlantic coast of the United States;
3. update the National Tidal Datum Epoch from the 1941
through 1959, 19-year series, to the 1960 through 1978, 19-year
series; and
4. begin phasing in the name, 1 'Mean Lower Low Water, 11 for
the name, 1 'Gulf Coast Low Water Datum, 11 after implementation of
the new Mean High Water computational method in all Gulf Coast
States with predominantly diurnal tides (and using the Mean High
Water Line as their State-private property boundary).
·j i i

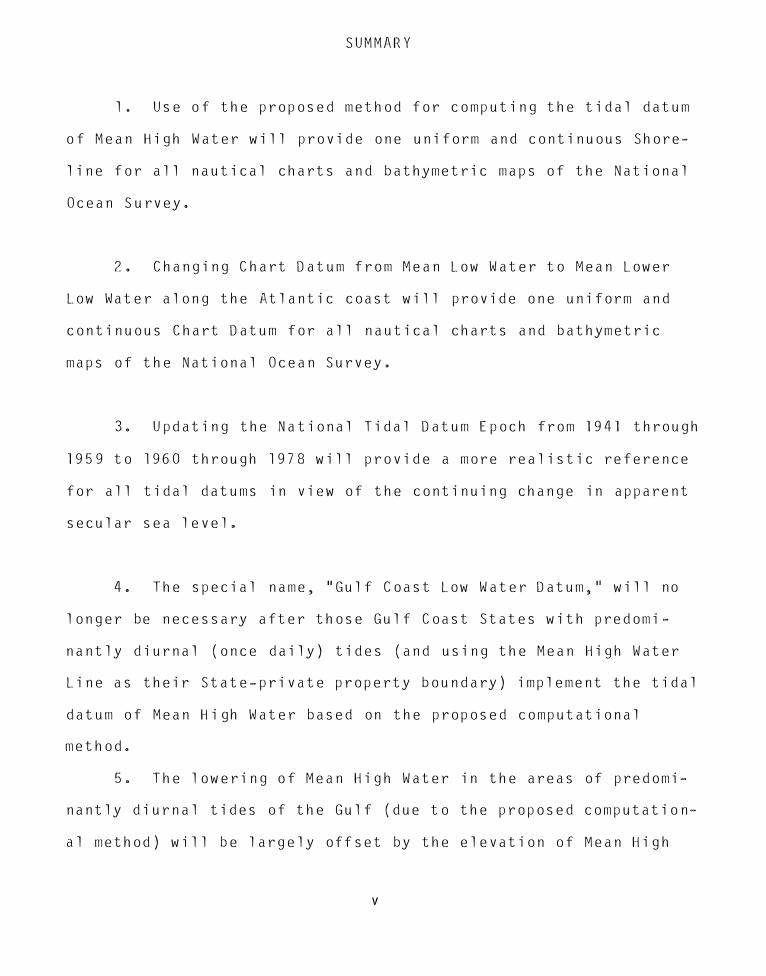
SUMMARY
l. Use of the proposed method for computing the tidal datum
of Mean High Water will provide one uniform and continuous Shore
line for all nautical charts and bathymetric maps of the National
Ocean Survey.
2. Changing Chart Datum from Mean Low Water to Mean Lower
Low Water along the Atlantic coast will provide one uniform and
continuous Chart Datum for all nautical charts and bathymetric
maps of the National Ocean Survey.
3. Updating the National Tidal Datum Epoch from 1941 through
1959 to 1960 through 1978 will provide a more realistic reference
for all tidal datums in view of the continuing change in apparent
secular sea level.
4. The special name, 11 Gulf Coast Low Water Datum, 11 will no
longer be necessary after those Gulf Coast States with predomi
nantly diurnal (once daily) tides (and using the Mean High Water
Line as their State-private property boundary) implement the tidal
datum of Mean High Water based on the proposed computational
method.
5. The lowering of Mean High Water in the areas of predomi
nantly diurnal tides of the Gulf (due to the proposed computation
al method) will be largely offset by the elevation of Mean High
V
Water (due to the rise in apparent secular sea level) with up
dating the National Tidal Datum Epoch.
6. The lowering of Chart Datum from Mean Low Water to Mean
Lower Low Water along the Atlantic coast will be more than offset
by the elevation of Mean Lower Low Water (due to the rise in ap
parent secular sea level) with updating the National Tidal Datum
Epoch.
7. The Shoreline, Chart Datum, offshore boundaries (and
their baselines), sounding figures, and isobaths as depicted on
National Ocean Survey nautical charts and bathymetr·ic maps Xilll
�at be changed with the acceptance of any provision of this
Convention. This lack of change is due to:
a. the offsetting effects of rising apparent secular sea
level with updating the National Tidal Datum Epoch vs., the Mean
High Water computational drop or the new Chart Datum lowering;
b. the thickness of lines on nautical charts and bathy
metric maps; and
c. roundoff procedures and accuracies in datum determi
nations, hydrographic surveying, and nautical charting.
8. However, changes in the location of tidal datum lines
(such as the Mean High Water Line, etc.) can be detected "on the
ground" using accepted surveying techniques, tidal bench marks,
and the numerical relationships provided by the National Ocean
Survey. Gulf Coast States implementing the Mean High Water Line
vi
as their State-private property boundary (using the proposed Mean
High Water computational method) can expect a small seaward dis
placement of the boundary in areas of highly diurnal tides.
9. The purpose of this Convention is to provide one uniform
and continuous Shoreline (at Mean High Water by the proposed com
putational method) and one uniform and continuous Chart Datum (at
Mean Lower Low Water) for all appropriate National Ocean Survey
marine products (nautical charts, bathymetric maps, tide tables,
etc.) covering the coasts of the United States, its possessions,
and U.N. Trust Territories under its jurisdiction. Also, States
with predominantly diurnal or diurnal and mixed tides will be
provided one uniform and continuous Mean High Water Line.

PREFACE
This document presents and explains the provisions of The
National Tidal Datum Convention of 1980. The conclusions and
recommend at i on s , exp res s e d a s 11 i n tent i on s , 11 are i s s u e d u n de r th e
authority of Cdr. Ralph J. Land, NOAA, Chief, Tides and Water
Levels Division (T&WL), Office of Oceanography. The Convention is
sponsored by Capt. Wesley V. Hull, NOAA, Associate Director,
Office of Oceanography, National Ocean Survey (NOS), National
Oceanic and Atmospheric Administration (NOAA).
The author acknowledges with appreciation the assistance
provided by Dolores G. Selby, Office of Oceanography, Pauline H.
Plunkett, T&WL, and Robert J. McClain, Quality Control Section,
Requirements Branch, T&WL.
The idea for the new Atlantic Chart Datum has been the long
standing and persistent verbal and written proposal (Swanson, et
al., 1976; and Swanson and Thurlow, 1979) of: Capt. R. Lawrence
Swanson, NOAA, Director, Office of Marine Pollution Assessment,
NOAA; Carroll I. Thurlow, Office of the Chief Scientist, NOS; and
Cdr. Carl W. Fisher, NOAA, Chief, Operations Division, Atlantic
Marine Center, NOS. The origination and development of the new
i X

Mean High Water computational method was provided by: Carroll I.
Thurlow; Bernard D. Zetler, Institute of Geophysics and Planetary
Physics, Scripps Institution of Oceanography, University of
California, San Diego; James R. Hubbard, Chief, Tidal Datums and
Information Branch; and Jack E. Fancher, Chief, Tidal Analysis
Branch; both of T&WL.
X
Statement of Intent
Summary
Preface
Figures
Chapters
I. Introduction
II. Types of tide
III. Tidal datums
CONTENTS
IV. The tidal datum of Mean High Wateralong the Gulf coast
V. Mean lower low Water as Chart Datumalong the Atlantic and Gulf coasts
VI. The National Tidal Datum Epoch
VII. Recommendations
VI I I. I mp a c·t s
References
xi
i i i
V
i X
X i i i
3
9
13
17
19
21
25
29

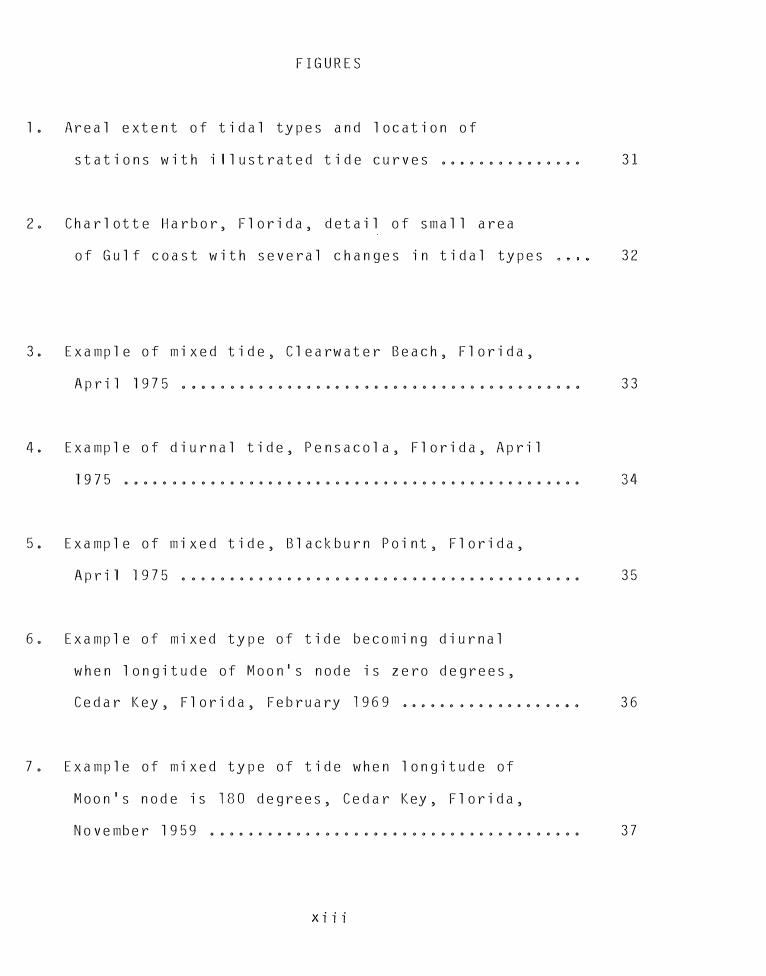
FIGURES
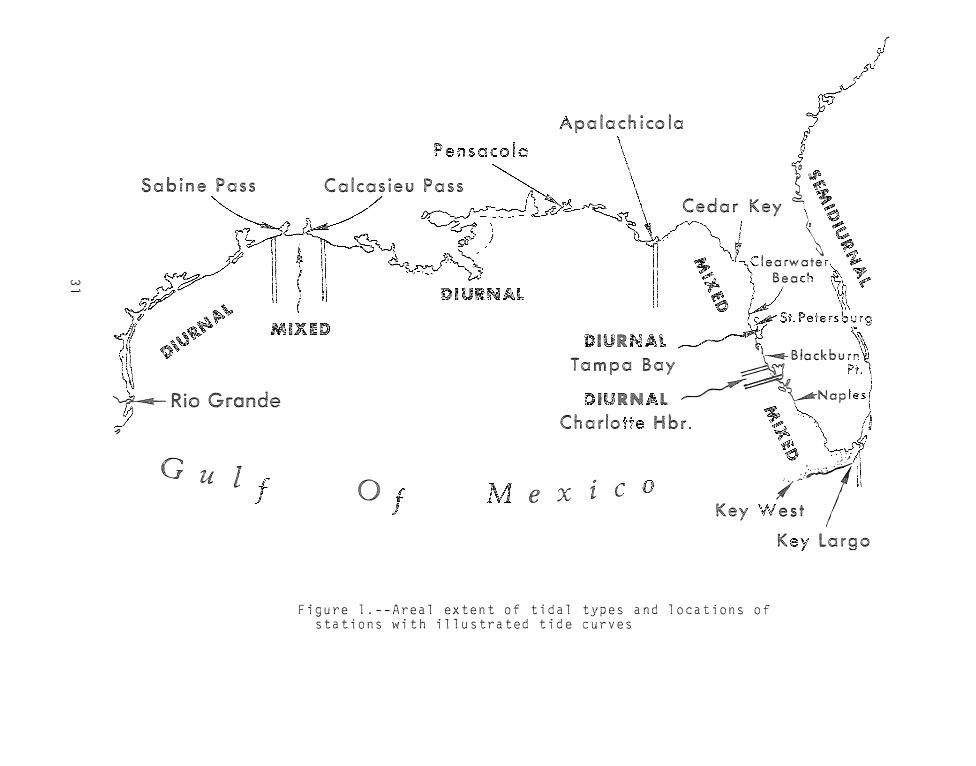
l. Areal extent of tidal types and location of
stations with illustrated tide curves ••.••••••.••••• 31
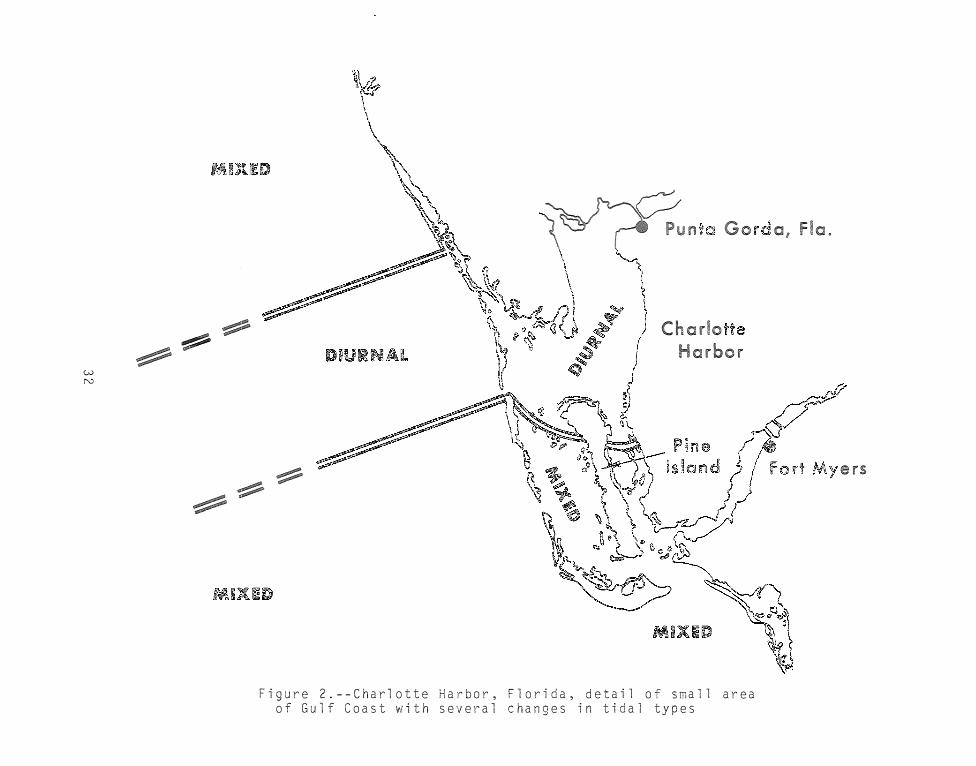
2. Charlotte Harbor, Florida, detail of small area
of Gulf coast with several changes in tidal types 32
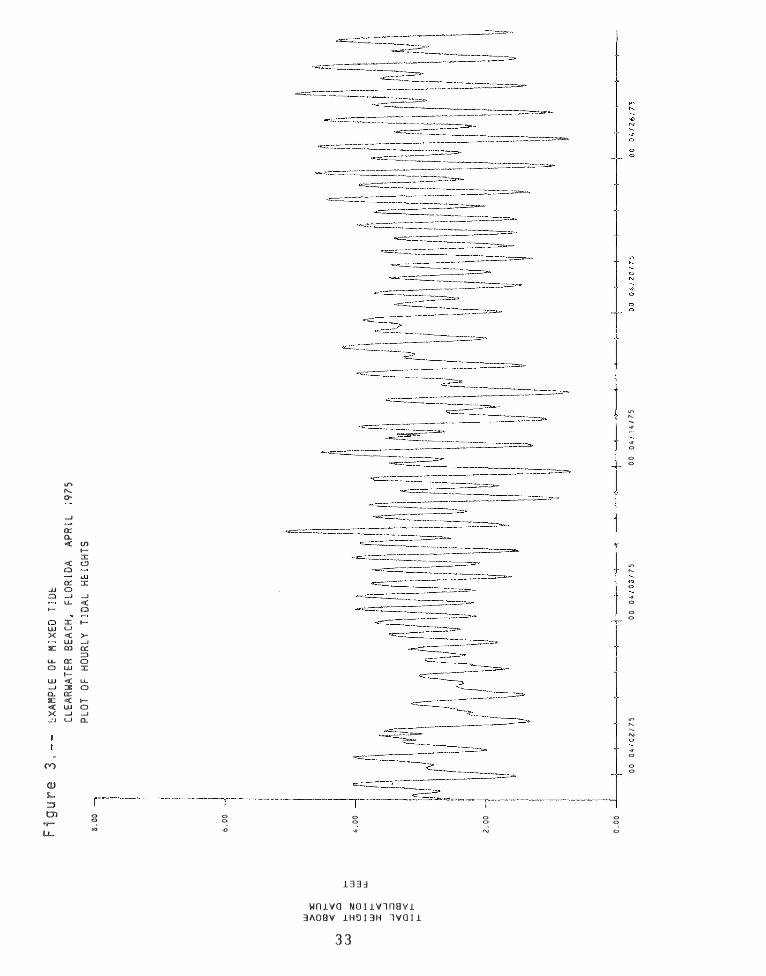
3. Example of mixed tide, Clearwater Beach, Florida,
April 197 5 0 0 0 GOG e e O e GOG G e O Ge O O e GOO O O G O O O e O O O O O O GOO O G 33
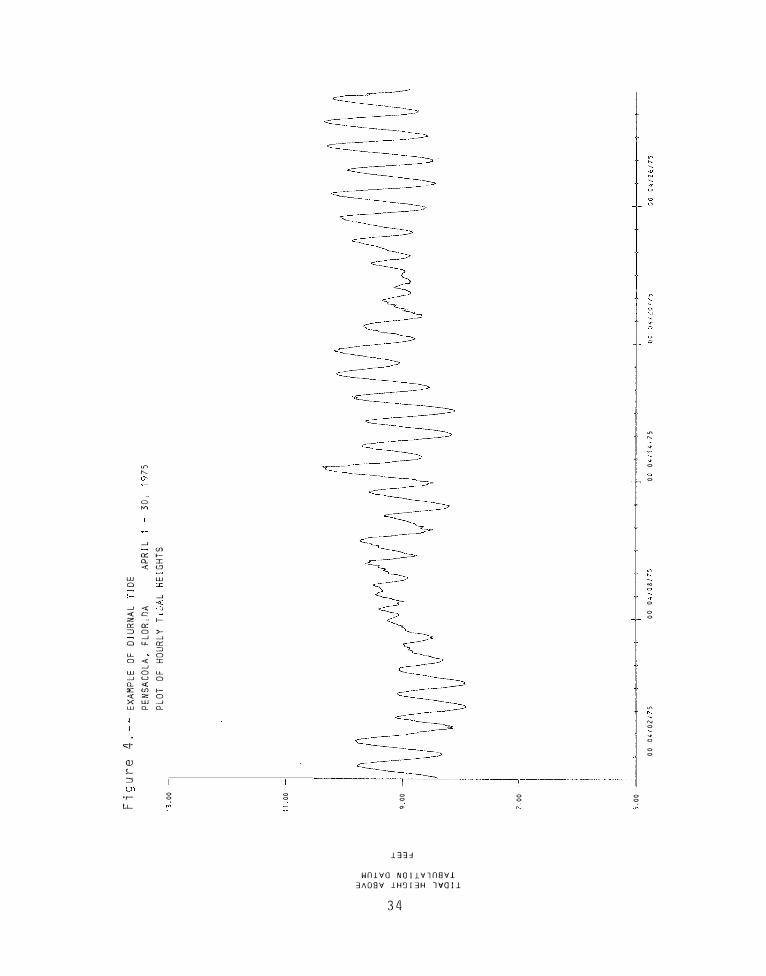
4. Example of diurnal tide, Pensacola, Florida, April
1975 0 e GO e O Ge G Ge Ge GOO@ G G G & 0 0 0 0 G Ge O O O Gee e e G GO e e O O O O GOO 34
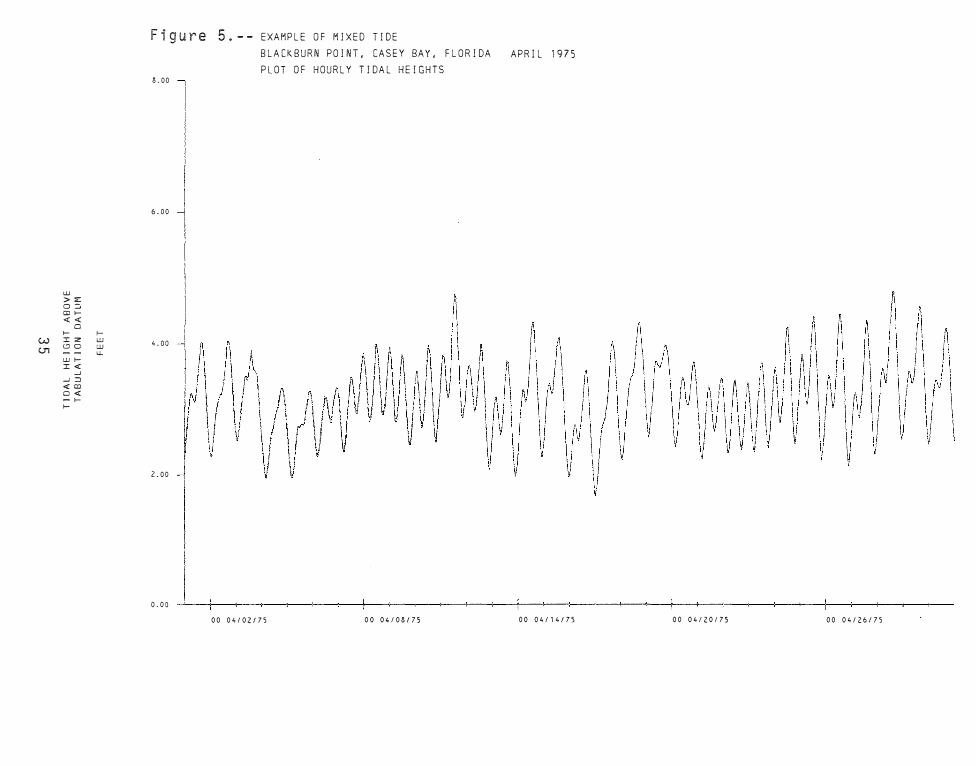
5. Example of mixed tide, Blackburn Point, Florida,
Apr i 1 l 9 7 5 G Ge O e GOO O O O G GO GO O O GOO O GO O O G & e e 0 GOG GOO O OGG G 35
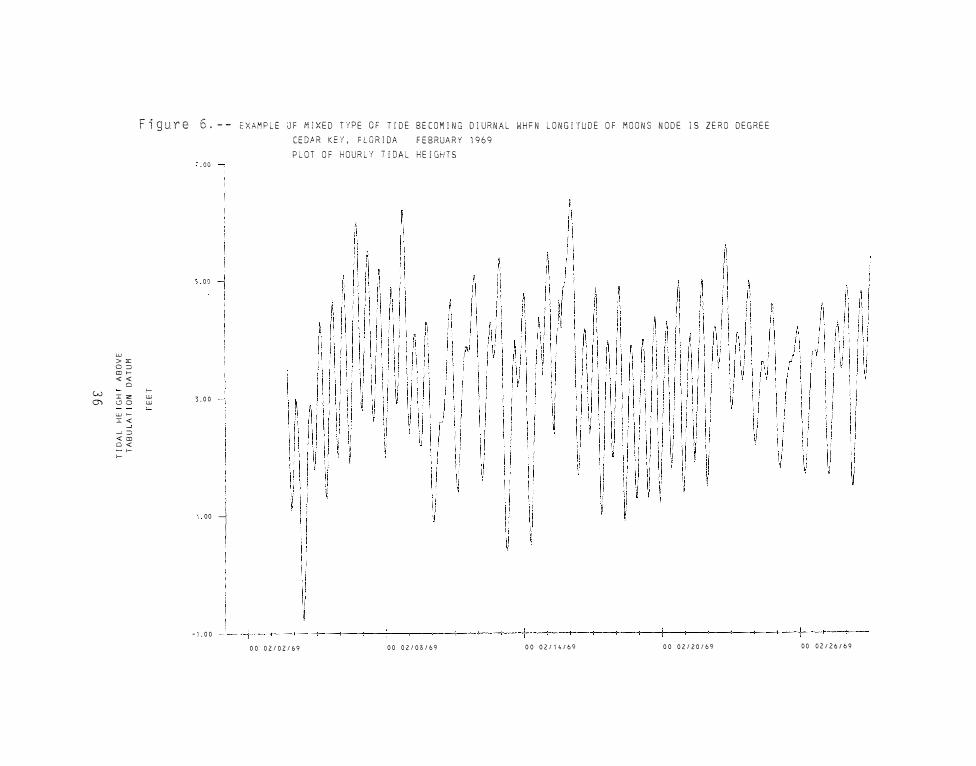
6. Example of mixed type of tide becoming diurnal
when longitude of Moon 1 s node is zero degrees,
Cedar Key, Florida, February 1969 •••••• •••. ••••• •••• 36
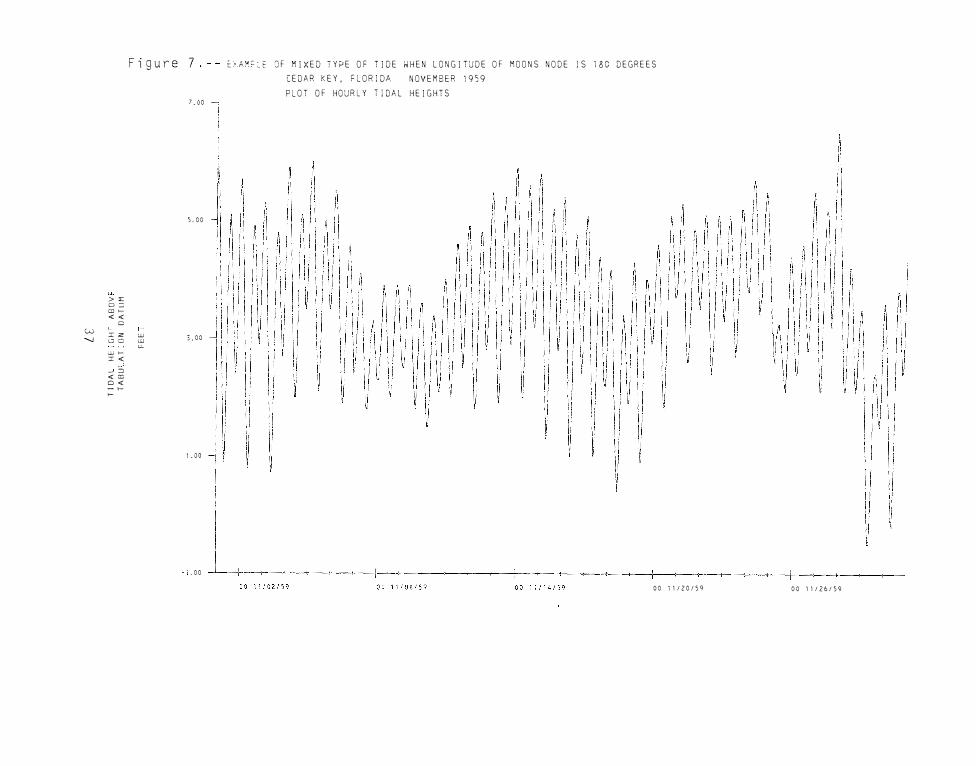
7. Example of mixed type of tide when longitude of
Moon's node is 180 degrees, Cedar Key, Florida,
November l 9 59 • • • • • • • . • • • • • • • • • • • • • • • • • • • • • • • • • • • • • • • 3 7
Xi i i

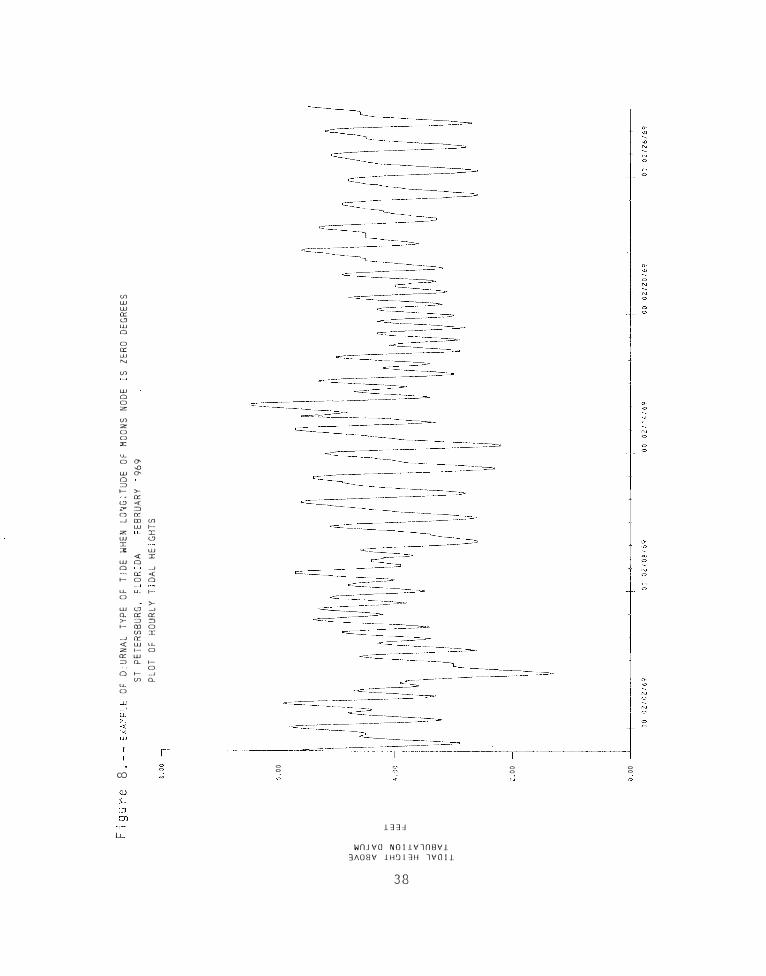
8. Example of diurnal type of tide when longitude of
Moon's node is zero degrees, St. Petersburg,
Florida, February 1969 •••••••••••.••••••.•••••••.••• 38
9. Example of diurnal type of tide when longitude of
Moon's node is 180 degrees, St. Petersburg,
Flor·ida, November 1959 ••••••••••••..•••••••••••••••• 39
10. Example of mixed type of tide becoming diurnal
when longitude of Moon 1 s node is zero degrees,
Fort Myers, Florida, February 1969 •••••••••••••••••• 40
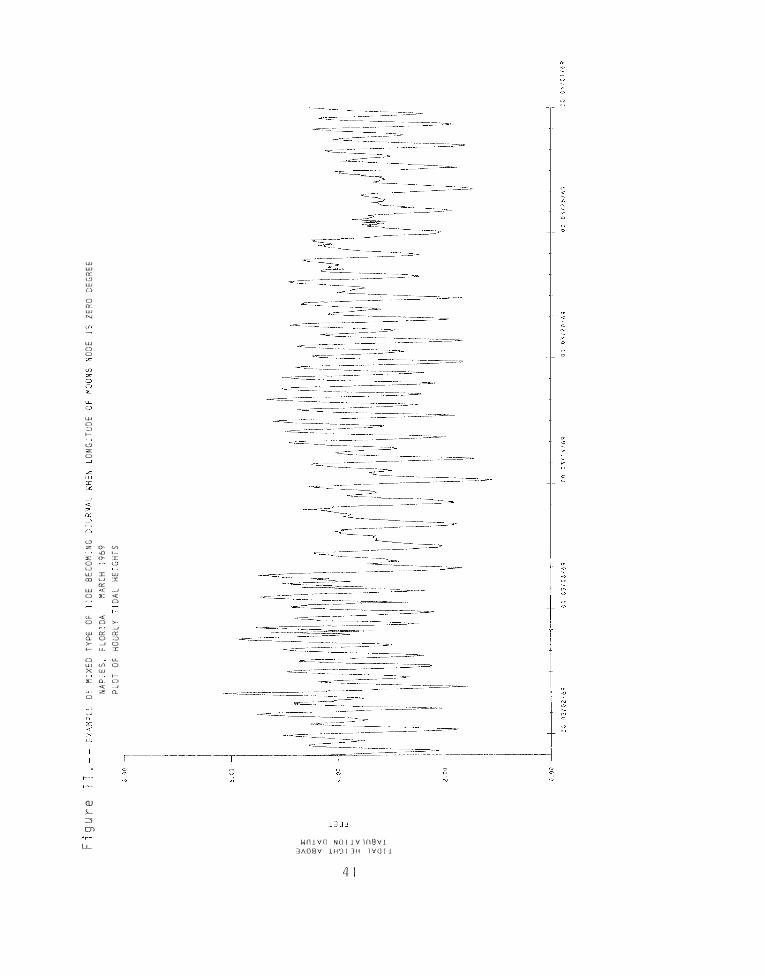
l l. Example of mixed type of tide becoming diurnal
when longitude of Moon's node is zero degrees,
Naples, Florida, March 1969 ......................... 41
12. Averaged sea-level series and curve for the
United States (except Alaska and Hawaii) •••••.•••••• 42
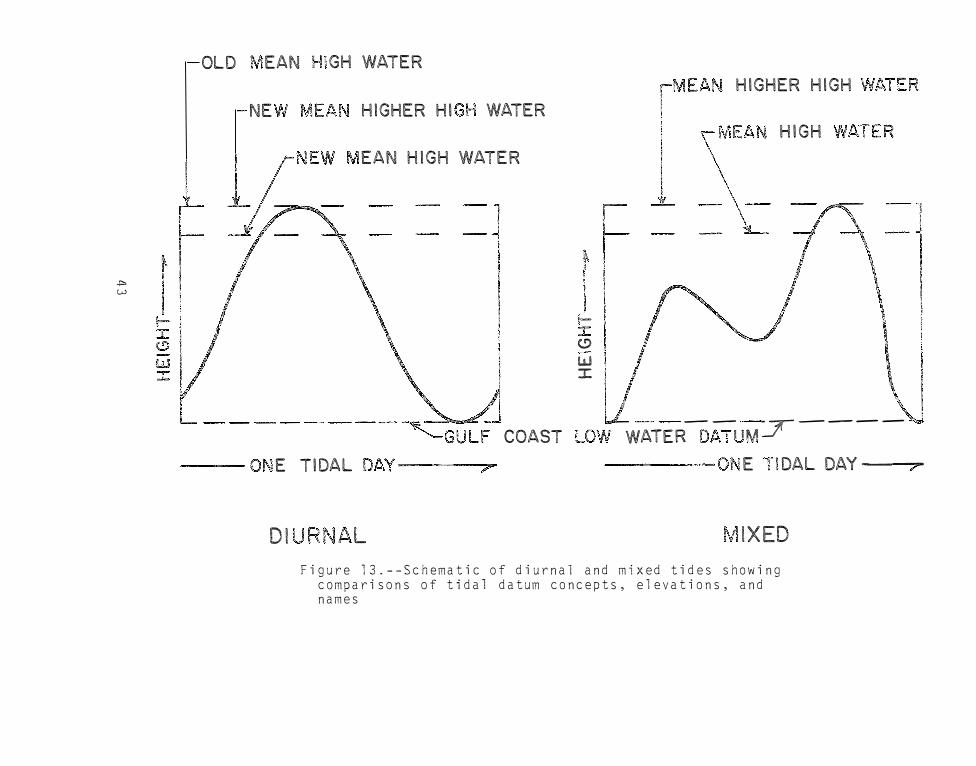
1 3 • S c h e ma t i c o f d i u r n a 1 a n d 111 i x e d t i d e s s h ow i n g
comparisons of tidal datum concepts, elevations,
and names • • • • • • • • • • • • • • • • • • • • • • • • • • • • • • • • • • • • • • • • • • • 43
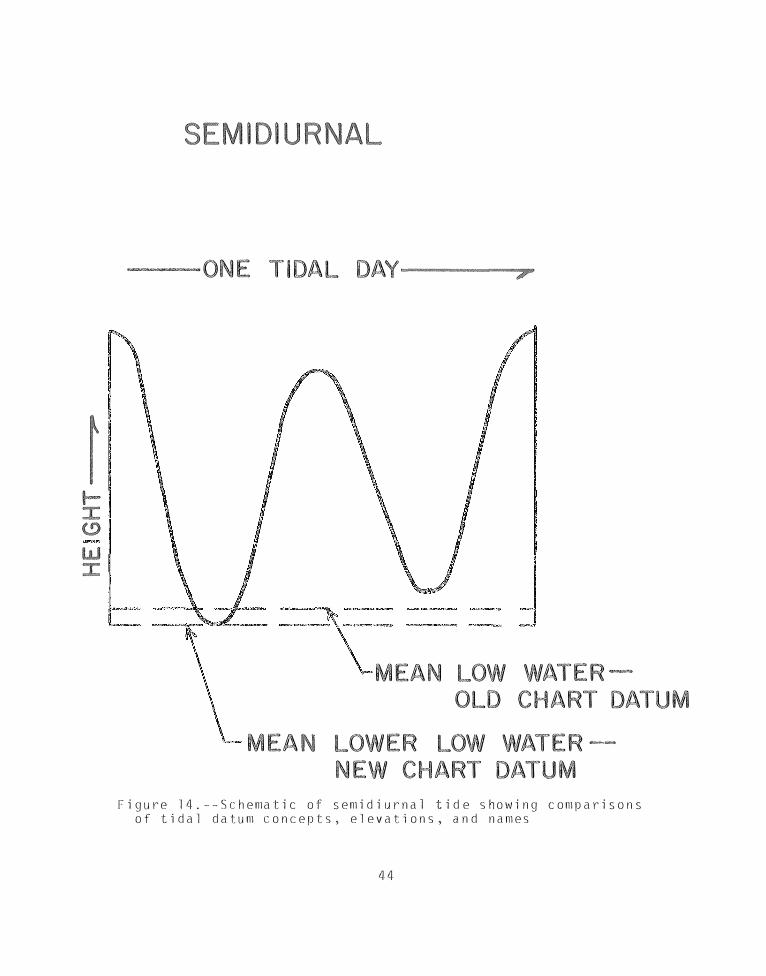
14. Schematic of semidiurnal tide showing comparisons
of tidal datum concepts, elevations, and names ••.••• 44
Xi V
I. INTRODUCTION
Boundaries are as old as civilization itself. The first, and
still the most common, are those defined by geological conforma
tions; including such features as mountain ridges, cliffs, rivers,
and ocean shores. The usual requirement is to be easily recogniz
able by all parties concerned and to be relatively permanent.
Their origin, at least, was intrinsically involved with defense,
In recent centuries, series of artificial markers, parallels of
latitude, meridians of longitude, and other lines recoverable by
surveying techniques were added. However, by far the oldest, and
seemingly the most logical, are boundaries associated with the
line where land and water meet.
The word 11 seemingly 11 is very important. While land-water
boundaries are so very logical on first assessment, their logic
rapidly becomes more vexing when in situ and map (and chart) posi
tioning accuracy, precision, recoverability, and etymology are
concerned.
Since the water (and land) moves up and down in both periodic
and nonperiodic motions, the location of the land-water intersec
tion line moves up-the-beach-landward and down-the-beach-seaward
as a function of time. If this intersection is to be used as a
boundary (or the source of a boundary), it must be stopped from
1
C. The third type, diurnal (figure 13), has one high water
and one low water each tidal day. (See figures l and 4.)
The type of tide can vary both with time at a single location
and in distance along the coast. (See figures l, 2, and 5.) The
transition from one type to another is gradual.
Each year the Earth and Sun revolve around their common
center of mass in a plane called the ecliptic. Each month the
Moon and Earth revolve around their common center of mass in a
plane inclined about 5 degrees to the ecliptic. Since the Earth
is tipped about 23-l /2 degrees to the ecliptic, the Moon 1 s orbit
will always be inclined to the equatorial plane (obliquity of the
Moon's orbit) of the Earth. Thus, the Moon will have an apparent
motion both north and south of the equator every month. The north
and south excursion is known as lunar declination and is largely
responsible for the "t·ime 11 transition in type of t·ide from sem·i
diurnal to mixed to diurnal. This is because the tide generating
forces deviate from a symmetrical orientation about the equator
during these two periods every month. Since a point rotates each
day parallel to the plane of the equator, it experiences these
asymmetrical tide generating forces which cause more and more
diurnal inequality with greater and greater declination until, in
extreme, diurnal tides may finally result.
4
The declinational effect for Blackburn Point, Florida, is
shown in figure 5 (see figure l for location). The Moon 1 s maximum
north declination occurred on April 16 and its maximum south, on
April l and 28. On the 2nd through the 5th, and the 17th and
18th, the 1nixed tide became diurnal. The opposite extreme is
shown in figure 4 for Pensacola, Florida (see figure l for loca
tion). The Moon was over the equator on April 9 and 22, 1975. On
and just before these dates of 1ninimum declination, the diurnal
tide became semidiurnal.
Because the plane of the Moon's orbit pivots on the ecliptic,
the Moon's maximum declination will occur alternately in and out
of phase with the direction of the Earth's inclination to the
ecliptic. This pivoting, known as the regression of the Moon's
nodes, is westward and takes 18.61 years to complete. As a conse
quence, the semimonthly declination of the Moon will vary from
28-1/2 degrees (23-1/2 degrees + 5 degrees) to 18-1/2 degrees
(23-1/2 degrees - 5 degrees) and back again over the 18.61-year
period. Reckoning convention is such that when the longitude of
the Moon's ascending node is zero (at the vernal equinox), maximum
declinations are experienced, while at 180 degrees minimum decli
nations occur.
The nodal effect is illustrated by comparing figure 6 with
figure 7. Figure 6 shows a predominatly mixed tide at Cedar Key,
5
Florida, when the longitude of the Moon's node i s zero degrees.
As seen, the tide i s diurnal. For the same station at 180
degrees, the tide remains mixed (figure 7 ) • Additional predomi-
nantly mixed tide examples from other areas of the Gulf when the
Moon ° s node i s zero degrees are given ·j n figures 10 and 11.
Figures 8 and 9 show a tide at St. Petersburg, Florida. At
zero degrees, the diurnal aspect is dominant while at 180 degrees
the tide has become almost exclusively mixed.
The Sun is an additional, although smaller, tide producing
body. This is because the Sun is at a much greater distance from
the Earth than the Moon, and because the tide generating force
varies inversely as the cube of the distance between the Earth and
these bodies. Since the Earth is inclined about 23-1/2 degrees to
the ecl·iptic, a maximum solar declinational effect will be experi
enced at the beginning of winter and summer.
In summary, the maximum dec·linational effect (i.e., the tend
ency of a tide to have greater diurnal inequality and finally
become diurnal) would occur:
A. at the maximum semimonthly declination of the Moon north
and south of the equator,
B. when the longitude of the Moon ° s ascending node is zero
degrees, and
6
C. at the beginning of winter or summer when the Sun is at
its maximum declination.
Conversely, the tendency of a diurnal tide to become semi
diurnal and to have less diurnal inequality would occur:
A. se1nimonthly as the Moon passes over the equator,
B. when the longitude of the Moon's ascending node is 180
degrees, and
C. at the beginning of spring and fall when the Sun is over
the celestial equator.
Because of bottom friction, viscosity, presence of conti
nents, irregular oceanic basins, nonuniform depth, reflections,
and interferences, certain oceanic regions tend to respond dif
ferently to the same tide generating forces. Some areas of the
Gulf of Mexico are particularly sensitive to diurnal tendencies,
giving rise to areas with predominantly mixed and diurnal tides.
7

III. TIDAL DATUMS
A datum is a reference base from which measurements are made.
A vertical datum is, as the name implies, a reference base from
which elevations and depths are measured. A tidal datum is a
vertical datum defined in terms of an observed tidal phenomenon.
Although there are many tidal datums, this report is concerned
with: Mean Higher High Water, Mean High Water, Mean Lower Low
Water, and Gulf Coast Low Water Datum along the Gulf coast, and
Mean Low Water and Mean Lower Low Water along the Atlantic coast
(Schureman, 1975).
Mean Higher High Water is presently defined as:
The arithmetic mean of the higher high water heights of a
mixed tide (figure 13) observed over a specific 19-year Metonic
cycle (the National Tidal Datum Epoch). Only the higher high
water of each pair of high waters of a tidal day is included in
the mean. For stations with shorter series, simultaneous observa
tional comparisons are made with a primary control tide station in
order to derive the equivalent of a 19-year value.
Mean High Water is presently defined as:
The arithmetic mean of the high water heights observed over a
specific 19-year Metonic cycle (the National Tidal Datum Epoch).
For stations with shorter series, simultaneous observational
9
comparisons are made with a primary control tide station in order
to derive the equivalent of a 19-year value. Use of the synony
mous term, mean high tide, is discouraged.
For a semidiurnal or mixed tide (figure 13), the two high
waters of each tidal day are included in the mean. When any lower
high water is indistinct, it is determined by record examination.
For a diurnal tide (figure 13), the one high water of each tidal
day is used in the mean. In the event a second high water occurs,
only the diurnal high water is included. So determined, this Mean
High Water, based on the diurnal tide, is the equivalent of Mean
Higher High Water of a mixed tide.
Mean Low Water is presently defined as:
The arithmetic mean of the low water heights observed over a
specific 19-year Metonic cycle (the National Tidal Datum Epoch).
For stations with shorter series, simultaneous observational
comparisons are made with a primary control tide station in order
to derive the equivalent of a 19-year value. Use of the synony
mous term, mean low tide, is discouraged.
For a semidiurnal (figure 14) or mixed tide, the two low
waters of each tidal day are included in the mean. When any
higher low water is indistinct, it is determined by record exami
nation (figure 5). For a diurnal tide, the one low water of each
tidal day is used in the mean. In the event a second low water
10
occurs, only the diurnal low water is included (figure 4). So
determined, this Mean Low Water, based on the diurnal tide, is the
equivalent of Mean Lower Low Water of a mixed tide.
Mean Lower Low Water is presently defined as:
The arithmetic mean of the lower low water heights of a mixed
tide observed over a specific 19-year Metonic cycle (the National
Tidal Datum Epoch). Only the lower low water of each pair of low
waters of a tidal day is included in the mean. For stations with
shorter series, simultaneous observational comparisons are made
with a primary control tide station in order to derive the
equivalent of a 19-year value.
Gulf Coast Low Water Datum is defined as:
Mean Lower Low Water when the type of tide is mixed and Mean
Low Water when the type of tide is diurnal (figure 13).
A 19-year Metonic cycle is used in order to include all pos
sibly significant tidal cycles through the 18.6-year period for
the regression of the Moon's nodes (node cycle) wh·ile still termi-·
nating on a complete yearly (much larger) cycle. As there are ir
regular (in time and space) apparent secular trends in sea level
(figure 12), a specific 19-year cycle (the National Tidal Datum
Epoch) is necessary so that all tidal datum determinations
throughout the United States will have a common reference. The
National Tidal Datum Epoch officially adopted by the National
11
Ocean Survey is presently 1941 through 1959. In summary, tidal
datums are defined in terms of a method designed to mathematically
"fix" the vertical oscillations of the sea re·lative to the land.
12
IV. THE TIDAL DATUM OF MEAN HIGH WATER
ALONG THE GULF COAST
Along the east coast of the United States, the type of tide
is semidiurnal with two high waters (on the average) each tidal
day (24 84 hours). Along the west coast, the tide is almost
always mixed, again with two high waters (albeit frequently very
unequal in height) each tidal day.
However, along the Gulf coast of the United States, the tide
is mixed in some areas and diurnal in others. Essentially, it is
considered mixed from Key Largo to Apalachicola with some diurnal
tides in the Tampa Bay and Charlotte Harbor areas. It is chiefly
diurnal fro1n Apalachicola to the Rio Grande, except for the Sabine
and Calcasieu Passes areas where it is mixed (figure l ), In addi
tion to these generalizations, there are many others associated
with islands, distances up bays and estuaries, and within lagoons
(figure 2).
The presence of diurnal tides in the Gulf, and especially the
fact that they do not stay purely diurnal at any one place (as ex
plained in detail in Chapter I I), causes a tidal datum of Mean
High Water (as presently defined) to be nonuniform and discontinu
ous (figure 13). This is because Mean High Water of the mixed
tide includes both high waters of each tidal day in the mean,
while Mean High Water of the diurnal includes only the one high
water of each tidal day in the mean, regardless of the fact that
13
there are always portions of the month when a diurnal tide has two
high waters per tidal day! Likewise, the Mean High Water Line
along the Gulf (as presently defined) is nonunifor111 and discon
tinuous since it, in turn, is the intersection of the land with
the ocean surface at the tidal datum elevation of Mean High
Water.
Thus, in order to provide a unifor111 and continuous Mean High
Water Line, it is intended that all (except in y___�ry special cases)
high waters appearing with adjacent ranges equal to or greater
than O.l foot be used in the mean for the datum of Mean High Water
regardless of type of tide. For the Mean Higher High Water Line,
the one high water of a diurnal tidal day and the diurnal (or
highest) high water of a multiple high water tidal day
(semi diurnal, mixed, third-, fourth-, and/or sixth-diurnal) will
be used in the mean for the datum (figure 13).
Conversely, the Mean Low Water Line and Mean Lower Low Water
Line would be determined by similar computations of their respec
tive datums.
Since the Shoreline, as depicted on National Ocean Survey
nautical charts and bathymetric maps, is the Mean High Water Line,
the new computational method provides one uniform and continuous
Shoreline along all coasts of the United States, its possessions,
and U.N. Trust Territories under its jurisdiction. Although of
great importance along the Gulf coast, it is also applicable to
14
areas where the tide goes diurnal in California, the Northwest,
Alaska, Hawaii, Puerto Rico, Virgin Islands, and the Trust
Territory of the Pacific Islands.
Finally, and probably of greatest importance, is its use by
States that have designated the Mean High Water Line as the bound
ary between private and State land and have one, three, four,
and/or six tides per tidal day along part (or all) of their coast,
and two tides along the rest. When these States implement the
tidal datum of Mean High Water based on the proposed computational
method, they will possess one uniform and continuous boundary
between their private and States lands.
The Shoreline, as depicted on National Ocean Survey nautical
charts and bathymetric maps, would be adjusted, theoretically, on
the States of Florida (west coast), Alabama, Mississippi,
Louisiana, Texas, and parts of Alaska, Puerto Rico, and the Virgin
Islands. However, only Florida, Alabama, Mississippi, and Alaska
could take advantage of the new Mean 11igh Water computation method
(without changing their law significantly), since they already use
the Mean 11igh Water Line for their State private property boundary
(Maloney and Ausness, 1974). The status of Puerto Rico and the
Virgin Islands, in this respect, is unknown at this time.
15

V. MEAN LOWER LOW WATER AS CHART DATUM
ALONG THE ATLANTIC AND GULF COASTS
Chart Datum along the Pacific coast is Mean Lower Low Water.
Chart Datum along the Gulf coast is Gulf Coast Low Water Datum
(Hicks, 1977). Gulf Coast Low Water Datum is Mean Lower Low Water
when the type of tide is mixed and Mean Low Water (present defini
tion) when the type of tide is diurnal (figure 13). As such, Gulf
Coast Low Water Datum is a uniform and continuous Mean Lower Low
Water (by the proposed definition), as the latter is on the west
coast. To continue this uniformity of Chart Datum, it would be
desirable to lower Chart Datum from Mean Low Water to Mean Lower
Low Water along the Atlantic coast (figure 14).
Gulf Coast Low Water Datum was created in order to:
l. provide a uniform and continuous Chart Datum,
2. be independent of any tidal type classification system,
3. not affect any high water datum directly or by
inference,
4. not affect any State-private property lines,
5. not create or eliminate any present datums, and
6. not change any datum name or definition.
With the use of the proposed computational method for the
tidal datum of Mean High Water (by States using the Mean High
Water Line as the boundary between private and State lands), Gulf
1 7
Coast Low Water Datum could be phased out. This would be accom
plished by merely changing the name, "Gulf Coast Low Water Datum,"
to, "Mean Lower Low Water."
However, this name change could not begin until after the
proposed Mean High Water computational method has been imple
rnented. To illustrate the reason, a hypothetical scenario fol
lows. A piece of private land fronts the Gulf of Mexico in a
State where the Mean High Water Line is the boundary between
private and State property. Also, the type of tide in front of
this property is predominantly diurnal. If the name, "Gulf Coast
Low Water Datum, 11 were to be changed to, "Mean Lower Low Water, 11
without acceptance by the State of the proposed computational
method for Mean High Water, then the private property owner might
easily speculate that the present Mean High Water is completely
analogous (computationally) to the proposed Mean Lower Low Water
in front of the property and; therefore, Mean High Water is really
Mean Higher High Water. Since the deed reads to the Mean High
Water Line, the property line is a small but measurable distance
seaward. With the proposed computational method for Mean High
Water, this hypothetical situation would not exist.
18

VI. THE NATIONAL TIDAL DATUM EPOCH
As stated in Chapter III, the National Tidal Datum Epoch
needs to be revised from time to time in order to take into
account trends in apparent secular sea level (figure 12). The
word "apparent" is used to ·indicate that the change in sea level
could be truly secular (nonperiodic) or only a segment of a much
longer unknown oscillation.
Long-period trends in apparent secular sea level are, in
addition to variabilities, composed of eustatic (worldwide)
changes and the vertical component of tectonic movement. The
variability is due to meteorological, oceanographic, and hydro
logical effects (both periodic and random). The value of the
eustatic rate (the average of several authors) ·is +l .Oto +l. l mm
per year (Lisitzin, 1974). Using selected data from the cont·inen
tal United States (except Alaska), Hicks (1978) obtained a mean
value of +l.5 mm per year. The vertical component of the tectonic
motion at any location is the difference (with regard to sign)
between the eustatic rate and the observed long-period apparent
secular sea level trend at that same location.
The maximum positive rate of the apparent secular trend, as
determined by a straight line of regression through annual means
of hourly heights, is +6.3 rnm per year (±0.3 mm per year, standard
error of slope determination) from 1909 through 1975 at Galveston
19
(Pier 21 ), Texas. The maximum negative rate is -13.4 mm per year
(±0.5 mm per year) from 1936 through 1975 at Juneau, Alaska. The
value for San Francisco, California, of +l .5 mm per year from 1940
through 1975, coincides with the eustatic rate derived from the
mean of United States gages.
Since sea level series are not strictly linear, it is more
realistic to take a common series length when comparing station
rates. However, the maximum positive rate and maximum negative
rate still happen to be at Galveston and Juneau with the same
values respectively. The stations with n1aximum nonlinearity are
Boston, Massachusetts, and Honolulu, Hawaii. From 1922 through
1975, sea level rose 2.8 mm per year at Boston; but from 1940
through 1975, the rate was only l .5 mm per year. From 1905 to
1975, the rate was 1.6 mm per year at Honolulu, while it decreased
to only 0.3 mm per year from 1940 through 1975.
Even though the specific 19-year average of the National
Tidal Datum Epoch reduces the magnitude of the rates stated in the
previous paragraphs, the 19-year average differences finally do
become significant. The Epoch must then be revised by updating to
the most recent values in order to provide a legally defensible
datum system.
20
VII. RECOMMENDATIONS
The following definitions are recommended:
Mean High Water (MHW)--The arithmetic mean of all the high
water heights observed over the National Tidal Datum Epoch. To be
counted, each high water must be 0.1 foot or more above the high
est adjacent low water, apparently periodic, and continuous or
regularly reoccurring. For stations with shorter series, simul
taneous observational comparisons are made with a primary control
station in order to derive the equivalent of the National Tidal
Datum Epoch value.
Mean Higher High Water (MHHW)--The arithmetic mean of the
highest high water height of each tidal day observed over the
National Tidal Datum Epoch. To be counted, each high water must
be 0.1 foot or more above the highest adjacent low water, appar
ently periodic, and continuous or regularly re�ccurring. For
stations with shorter series, simultaneous observational compari
sons are made with a primary control station in order to derive
the equivalent of the National Tidal Datum Epoch value.
Mean low Water (MLW)--The arithmetic mean of all the low
water heights observed over the National Tidal Datum Epoch. To be
counted, each low water must be O.l foot or more below the lowest
adjacent high water, apparently periodic, and continuous or regu
larly reoccurring. For stations with shorter series, simultaneous
observational comparisons are made with a primary control station
in order to derive the equivalent of the National Tidal Datum
Epoch value.
21
Mean Lower Low Water (MLLW)--The arithmetic mean of the low
est low water height of each tidal day observed over the National
Tidal Datum Epoch. To be counted, each low water must be 0.1 foot
or more below the lowest adjacent high water, apparently periodic,
and continuous or regularly reoccurring. For stations with
shorter series, simultaneous observational comparisons are made
with a primary control station in order to derive the equivalent
of the National Tidal Datum Epoch value.
Simultaneous observational comparisons will continue to be
made by the standard National Ocean Survey method. However, when
the tide at the control station is predominantly diurnal and when
there is a significant difference in the total number of highs (or
lows) between the control and subordinate station, the following
procedural departure would be adopted.
The mean of the diurnal high water inequalities would be com
puted without adjustment at the subordinate (1-year minimum) sta
tion. This value would then be subtracted from the adjusted (to
the control station) Mean Higher High Water to give the datum of
Mean High Water at the subordinate station. Likewise, the un
adjusted diurnal low water inequality would be added to the
19-year adjusted value of Mean Lower Low Water to give Mean Low
Water at the subordinate station. This method is considered the
most accurate and consistent procedure possible with the given
22
restraints. Theoretically, the accuracy and consistency would
increse as the length of series at the subordinate station
approached 19 years.
For clarifying information on this subject, the following
definitions will be retained:
High Water (HW) -- The maximum height reached by a rising
tide. The height may be due solely to the periodic tidal forces
or it may have superimposed upon it the effects of prevailing
meteorological conditions.
Low Water (LW) -- The minimum height reached by a falling
tide, etc.
23

VIII. IMPACTS
The greatest decrease in the tidal datum of Mean High Water
due to employment of the proposed computational method would be
0.37 foot at St. Petersburg, Florida. A drop of about 0.35 foot
is to be expected in the Tampa Bay and Charlotte Harbor areas. In
Mississippi, a decrease of 0.26 foot would occur at Rotten Bayou
and 0.28 foot at the Jourdan River. In contrast, Mean High Water
at Galveston, Texas, would lower only 0. 12 foot.
However, these values would be mitigated by the increase due
to the revised National Tidal Datum Epoch. The datum at St.
Petersburg would actually drop only 0.27 foot (-0.37 + 0. 10), Fort
Myers, Florida, and the Charlotte Harbor area, about 0.25 foot
(-0.35 + 0.10). while Galveston will experience a net rise of 0.21
foot (-0.12 + 0.33).
Actually, when combined with the results of Gulf Coast Low
Water Datum (Hicks, 1977; Gleiter, 1977), the States in question
would neither gain nor lose State lands, although they would be
shifted slightly seaward. Private property owners in the subject
areas would gain a very small amount of land. The Federal Govern
ment has already lost a very small amount of land to the States
with implementation of Gulf Coast Low Water Datum. The amount of
land lost by the Federal Government is equal to the amount that
would be gained by the private property owner with this
convention.
25
Representative decrease estimates from Mean Low Water to Mean
Lower Low Water for Chart Datum along the Atlantic coast are:
Eastport -0.4 foot,
Boston -0 • 3 foot,
Atlant·ic City -0.2 foot,
Norfolk - 0 • l f oat, and
Charleston -0.2 foot.
With revision of the National Tidal Datum Epoch, the net
estimate values become:
Eastport
Boston
Atlantic City
Norfolk
Charleston
-0. 17
-0.24
+0.05
+ 0. 1 4
-0.07
foot
foot
foot
foot
foot
(-0.4 + 0.23),
( - 0. 3 + ().06),
( -0. 2 + 0.25),
( - 0 • l + 0.24), and
(-0.2 + 0.13).
No impact would be realized on the west coast of the United
States. Representative values due to Epoch revision are: San
Diego, California, +0.07 foot; San Francisco, California, +0.10
foot; Crescent City, California, -0.07 foot; and Neah Bay,
Washington, -0.11 foot.
Summary
With acceptance of the Conventions for revising the National
Tidal Datum Epoch and the proposed method of computing Mean High
(and Low) Water, the datum values will vary from a maximum drop of
26
about 0.27 foot at St. Petersburg to a maximum rise in the
localized Galveston area of about 0.21 foot.
Since the net amount of datum change is within the accepted
accuracy of hydrographic surveying, no revision of printed numeri
cal sounding values or isobaths would be necessary on nautical
charts or bathymetric maps with the Conventions of revising the
National Tidal Datum Epoch and changing Chart Datum from Mean Low
Water to Mean Lower Low Water along the Atlantic coast.
27

REFERENCES
Gleiter, T. P., Tidal datums, Federal Register, vol. 42, no.
179, September 15, 1977�
Hicks, S. D., Gulf Coast Low Water Datum, National Ocean
Survey, NOAA, January 1977, 70 pp.
Hicks, S. D., An average geopotential sea level series for
the United States. Journal of Geophysical Research, American
Geophysical Union, vol. 83, no. C3, March 20, 1978, pp. 1377-
1379.
Lisitzin, E., Sea-level changes. Elsevier Scientific
Publishing Co., New York, 1974, 286 pp.
Maloney, E. and C. Ausness, The use and legal significance of
the mean high water line in coastal boundary mapping. The North
Carolina Law Review, vol. 53, no. 2, December 1974, pp. 185-273.
Schureman, P. (extensively revised by S. D. Hicks), Tide and
current glossary. National Ocean Survey, NOAA, U.S. Government
0 rinting Office, 1975, 25 pp.
29
Swanson, R. L., C. I. Thurlow, and S. D. Hicks, A proposed
uniform tidal datum system for the United States. Proceedings of
the American Congress on Surveying and Mappin�, Fall Convention,
Seattle, Washington, September 28 through October 1, 1976, pp.
4·11-428.
Swanson, R. L., and C. I. Thurlow, A uniform tidal datum
system for the United States of America. The International
.!:!Ydrographic Review, International Hydrograph·ic Bureau, Monaco,
vol. LVI, no. l, January 1979, pp. 143--151.
30
Sabine Poss
w
� Rio Grande
-?
Gu l
Calcasieu Poss
0
polochicolo
I R
! Cedar Key �
\ iearwate Bea
-'l !
Tampa Boy �B,ackbu
I RN l ��Nap
Chorlo
,
e X l C
Hbr.
Key _;�7·'' /� est
K largo
Figure 1.--Areal extent of tidal types and locations of stations with illustrated tide curves
r
w
N
�� ��
�n Go Cu Fla.
Charlo
Harbor
� � �
figure 2.--Charlotte Harbor, Florida, detail of small of Gulf Coast with several changes in tidal types
area
ers
,r,
l's.
"'
-'
c,:: Q.
< (/) I-
::i:: < (.9
0
c,:: ::i:: .LJ 0
::::, -' --' u.. <
I- 0
:c I-
UJ u X < ,..
UJ ....J
:II: C!'.) c,:: :::::,
u.. c,:: 0
0 UJ ::i:: I-
UJ < u.. _, :11: 0
Q. c,:: :II: < I-
< UJ 0
X _J ..J
.cJ u Q.
M
(tJ
s...
:::J
t::n
•r-
LL
0 0 0 0
.; "'
0
0
"'
LB:J
wn1vo No11v1nsv1
3A08V !H8!3H lVOI!
33
� "' ::;
" 0
0
0
� "'
0
" 0
0
0
� "'
;;:;
., 0
0
0
0 0
0 0
,-.; 0
,n
"-
0 "°'
_J
U) 0::: ,-
a., ::r: «,: t:J
w UJ
0
_J
_J <( <( C z I-0::: 0:::
:::, 0 >-_, _,
0 LL 0::
::, LL 0
0 s,: ::r: _J
w 0 LL _J w 0 a., «,: :,: U) t-<( "" 0
X UJ ·-' w a., 0..
tj-
Q)
s... :5
.,.... l.L
0 0 0 0
0
0
"'
133:J
wn1va No11v1nev1
3A08V 1H�l3H lVOll
34
;::
�
0
0
�
0
0
0
<A
N
0
;;
0
0
0 0
0 0
u.J
> :,:: 0::,
OJ f-
<( <( 0
f- f-
w IZ w
CcJO LlJ U1 -- LC
UJ f-
I <( ...J
...J:::, <( co
0 <( - f-
f-
Figure 5.-- EXAMPLE OF MIXED TIDE
3 .00
6. 00
4. 00
2. 00
0. 00
BLACKBURN POINT, CASEY BAY, FLORIDA PLOT OF HOURLY TIDAL HEIGHTS
00 04/02175 00 04/03175
APRIL 1975
00 04/14175 00 04/20175 00 04/26175
w
0,
w >:,: 0:::, OJ ,< <
0
o::z
00
CD ,-0:: <
�:::, < OJ O< - ,,,-
Figure 6. -- EXAMPLE JF M)XED TYPE OF Ti DE BECOMING DIURNAL WHFN LONGITUDE OF MOONS NODE ;s ZERO DEGREE
CEDP,R KEY, FLGR!DA
_,-w w
co
00
3.00
00 -I
I
-? . 00
FEBRUARY 1969
PLOT OF HOURLY TIDAL HEIGHTS
00 02/02/69 00 02/0&/69 00 02/14/69 00 02/20/69 00 02/26/69
w
"'J
Figure 7
>:,:: 0::: O'.) �
<< C
Iz w GC W
u. w II<
- :::,
< [D O< - ,...
,...
7_00
\. 00
3. 00
LOO
. 00
�>A�;.E JF MIXED TYPE OF TIDE WHEN LONGITUDE OF MOONS NODE IS 18C DEGREES
CEDAR KEY, FLORIDA NOVEMBER 1959
PLOT OF HOURLY TIDAL HEIGHTS
00 i 1 / 20 / 59 00 i 1 / 26 / 59
CJ) w w O'. CJ LJJ 0
0 O'. U.J N
CJ)
w 0 0 ;z
CJ) 2'. 0 0 :,:
•J.. 0 0-
-0 w 0' 0 co
I- >-0'.
CJ -ct: ;? :J C) er:: _..J OJ (f)
UJ 1--z I W CJ :r: :J: UJ
<( :r: W 0 0 .J
O'. <( I--- 0 0
tJ_ LI. I-· 0
>-LU C'.) ....J Q. 0::: a: >- :-..:J ::J I- 0:, 0
(J) :r: _, er <( W LL 2 !-- 0 O'. w ::J Cl. j-
0 0 1--- __ J
"·
0
00
LL
CJ) Q_
0
0
13 3,J
WnJVO NO!lVlnBVl
3A08V lHQIJH lVOll
38
0
0
0
0
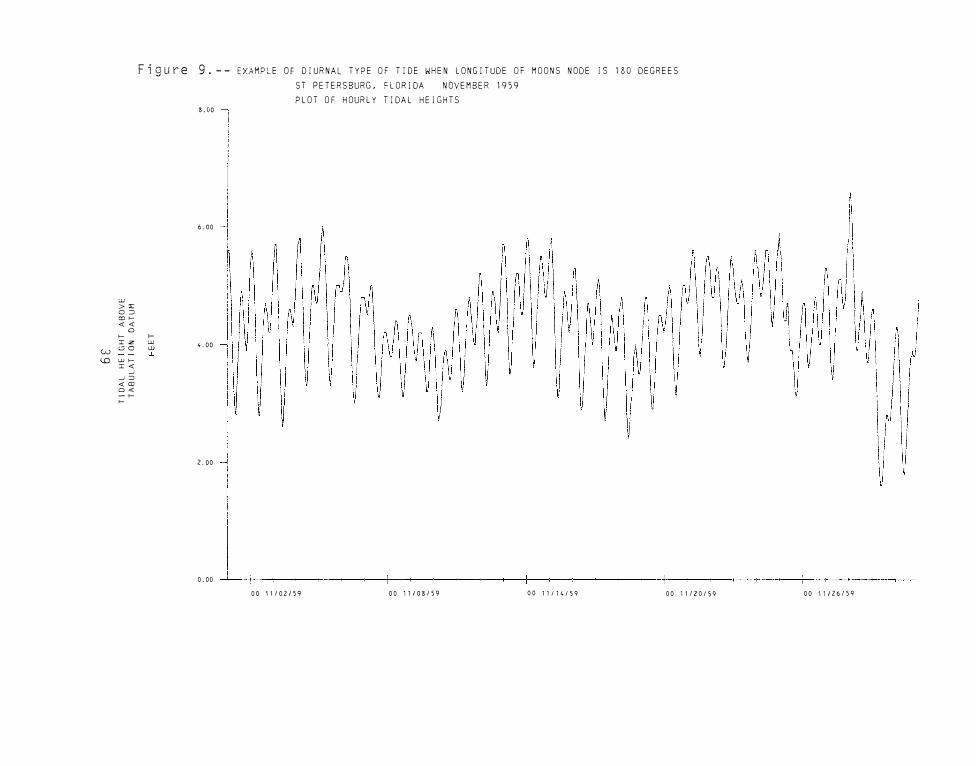
Figure 9. - - EXAMPLE OF DIURNAL TYPE OF TI DE WHEN LONGITUDE OF MOONS NODE is 180 DEGREES
ST PETERSBURG, cLORiDA NOVEMBER 1959
PLOT OF HOURLY TIDAL HEIGHTS 8.00
6.00
w
> :c
0 ::J
CI) >-
<<
0
>- >-
IZ w
w VO w
4.00
'° w >-
I< ..J
..J ::J
<aJ o< - >-
>-
z. 00
0.00
00 il/02/59 00 11/08159 00 11 / 14 / 59 00 11/20/59 00 11 / 26/ 59

+s
0
Figure 10. -- ::XA,�C_E OF MIXED TYPE OF Tl DE BECOMING DIURNAL WHEN LONGITUDE OF MOONS NODE IS ZERO DtGREE
CJ
> ,::
0 =i
CD ,-...
< <
0
f- f-
:;: z
G 0
w r-:;: <
�::,
< OJ
o<
w w
S. 00
6. 00
4.00
2. 00
0. 00
FOR' MYERS, FLORIDA FE BRL!ARY 1969
PLOT OF HOURLY TIDAL HEIGHTS
00 DZ/02/69 00 OZ/08169 00 02/1.4/69 00 02120/69 00 02126/69
UJ w ,�
'-" UJ C)
0 er: UJ N
UJ 0 0
UJ C) ::
:.J I-
'-" ;z 0
<.:)
z O' V) -0 1-
:r.:: a- ::r: 0 CJ u W I UJ CD LJ :r.:
n'. UJ «:{ .-l 0 ,:: <(
0
<L <( 0 0 >·
.. J UJ 0:'. 0::: Cl.. 0 :·::i >- _ _J 0 I- u. :r.:
0 � ll.J lf) 0 X UJ
fa.•• �..:: 0.. C)
<( . .,,J z 0..
0
GJ
>-
::,
0)
LL wn.tV(I NOl.lV1118VJ
]/\OBV J H'l I JI; IVU 11
41

.j:,,
N
1 1 1 1 7
Figure 12.--Averaged sea-level series and curve for the United States (except Alaska and Hawaii)
7
2
1
E
>i
+" w
OLD EAN GH WATER
NE HIGHER HI
HIGHER HIGH WATER
HIGH
EAN HIGH WATER
C,
w
:c
COAST WATER--11uJ ___ _
E TIDAL E DAL DAY--
DI L IXED
Figure 13.--Schematic of diurnal and mixed tides showing comparisons of tidal datum concepts, elevations, and names
� t:c t!)
w :::c
SEMI DIURNAL
--ONE TIDAL DAY-----:7
MEAN LOW WATER-
OLD CHART DATUM
MEAN LOWER LOW WATER -
NEW CHART DATUM
Figure 14.--Schematic of semidiurnal tide showing comparisons of tidal datum concepts, elevations, and names
44


NOM--S/T 80-177