the nation’s pulse - tmc - leader in collaborative ...tmc.edu ryan holeywell communications...
TRANSCRIPT

THE NATION’S PULSE:
The Texas Medical Center’s
Consumer & Physician Survey

Arthur “Tim” Garson, Jr., MD, [email protected]
Stephen H. Linder, PhDAssociate [email protected]
Ryan HoleywellCommunications [email protected]
from
The Texas Medical Center
Health Policy Institute
TMC Health Policy Institute
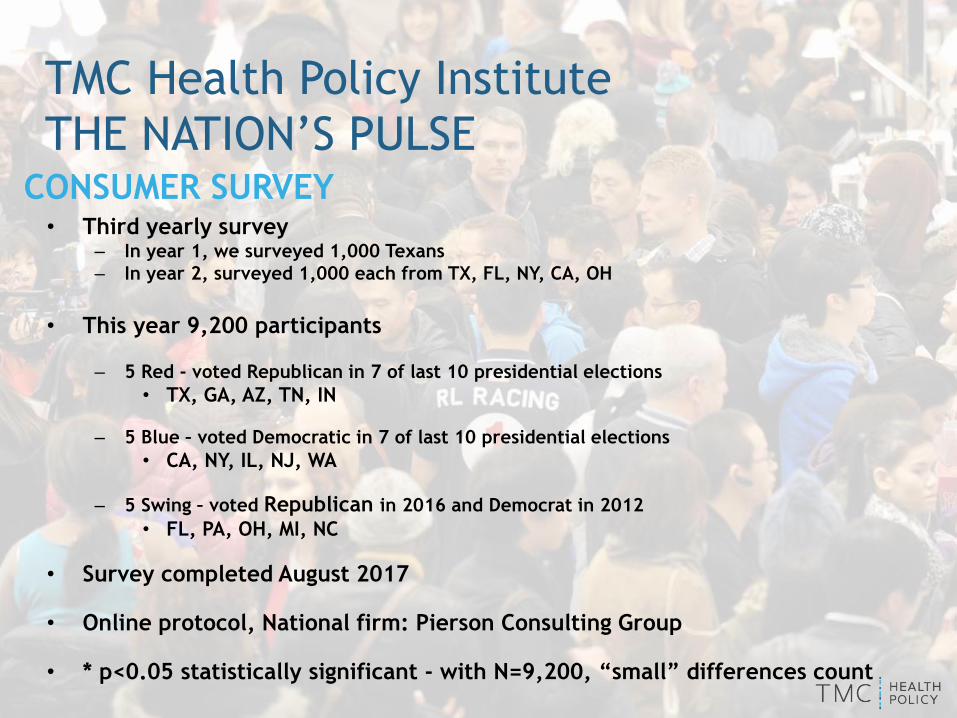
THE NATION’S PULSECONSUMER SURVEY
• Third yearly survey– In year 1, we surveyed 1,000 Texans
– In year 2, surveyed 1,000 each from TX, FL, NY, CA, OH
• This year 9,200 participants
– 5 Red - voted Republican in 7 of last 10 presidential elections
• TX, GA, AZ, TN, IN
– 5 Blue – voted Democratic in 7 of last 10 presidential elections
• CA, NY, IL, NJ, WA
– 5 Swing – voted Republican in 2016 and Democrat in 2012
• FL, PA, OH, MI, NC
• Survey completed August 2017
• Online protocol, National firm: Pierson Consulting Group
• * p<0.05 statistically significant - with N=9,200, “small” differences count
TMC Health Policy Institute
THE NATION’S PULSE
PHYSICIAN SURVEY
• Included only physicians currently spending at least 50% of
time in patient care
• Online protocol, National firm: Pierson Consulting Group
• Survey completed August 2017
• 452 physicians
• 241 Primary care
• 211 Specialists
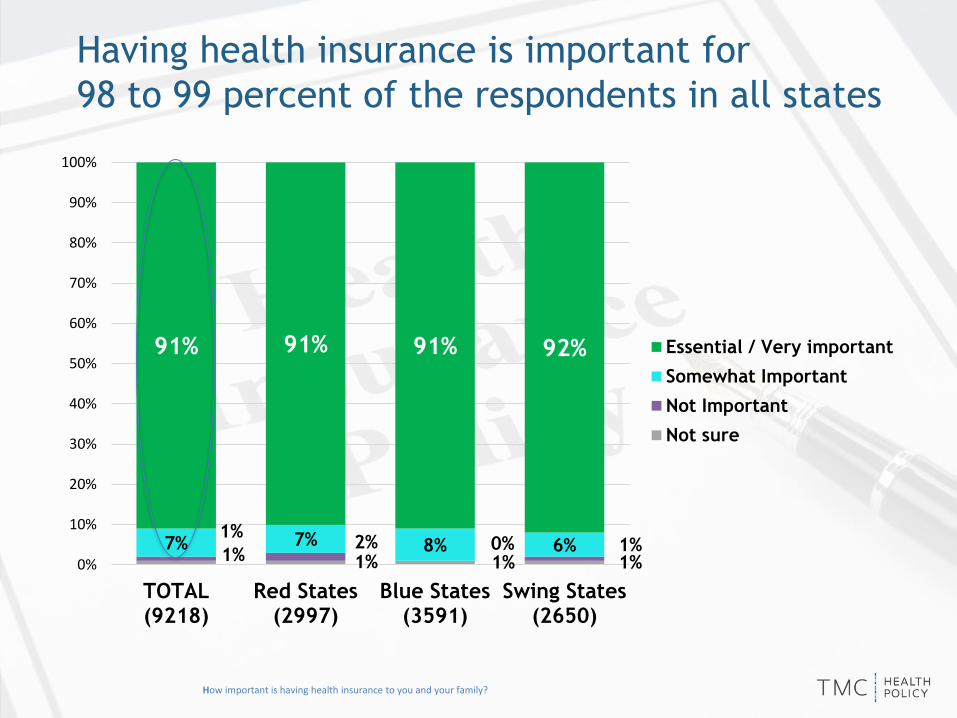
Having health insurance is important for
98 to 99 percent of the respondents in all states
1%
1% 1% 1%1%2% 0% 1%7% 7% 8% 6%
91% 91% 91% 92%
0%
10%
20%
30%
40%
50%
60%
70%
80%
90%
100%
TOTAL(9218)
Red States(2997)
Blue States(3591)
Swing States(2650)
Essential / Very important
Somewhat Important
Not Important
Not sure
How important is having health insurance to you and your family?

Basic coverage for all ranked by respondents as
most important characteristic of a health system;
red = blue
11% 11% 12%
10% 11% 10%
10% 9% 10%
12% 11% 12%
13% 13% 13%
16% 17% 15%
28% 28% 28%
0%
10%
20%
30%
40%
50%
60%
70%
80%
90%
100%
TOTAL Red States Blue States
Basic coverage for all
Choice of physician
Treatment makes patientsbetter
Pay without cuttingexpenses
No mistakes
Appointment when needed
Other
Below are statements describing a healthcare system. Please rank these where 1 is the most important characteristic and 9 is the least important characteristic of a healthcare system

Expense is by far the main reason for being
uninsured, red even more than blue
Which of the following is the main reason you do not currently have health insurance?
8% 9%15%
5% 3%
7%4%
2%
2%6%
7%
5%8%6%
13%14%
10%
13%
55% 63% 45%
0%
10%
20%
30%
40%
50%
60%
70%
80%
90%
100%
TOTAL Red States Blue States
Too expensive
Not eligible for Medicare /Medicaid
Employer doesn’t offer
Part time
Don’t know how to get it
Don’t need it
Other
*

Half of consumers must cut down on other
expenses to pay for health care; red states worse.
51% 48%55%
49% 52% 45%
0%
10%
20%
30%
40%
50%
60%
70%
80%
90%
100%
TOTAL Red States Blue States
Cut other expenses
Do not cut other expenses
Please tell us whether you agree or disagree with each of the statements below: I have to cut down on other expenses to pay for healthcare
*
*
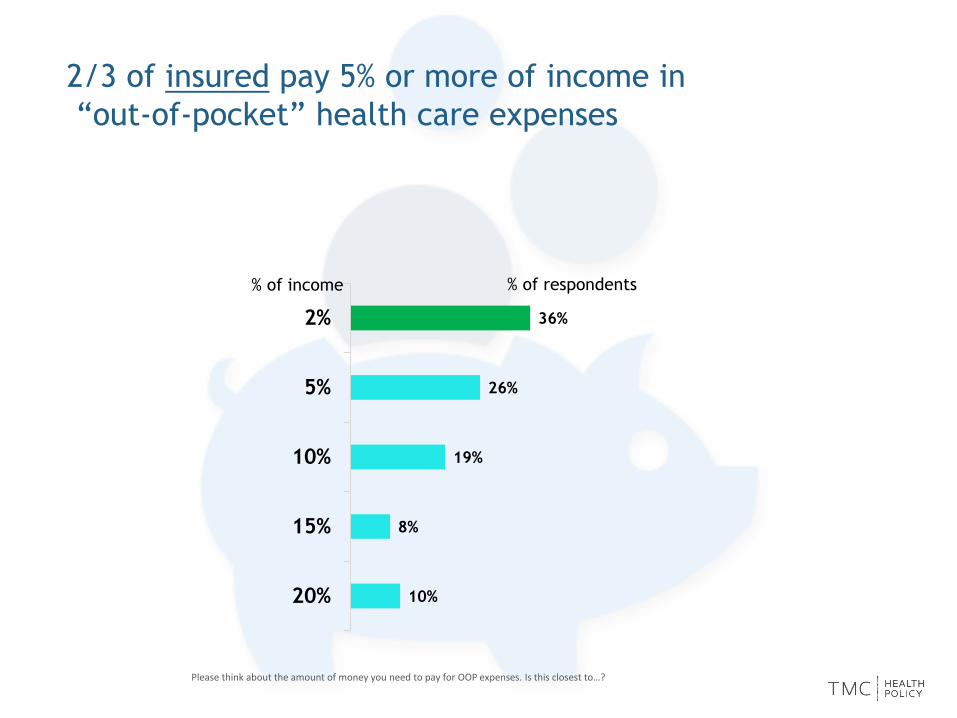
2/3 of insured pay 5% or more of income in
“out-of-pocket” health care expenses
Please think about the amount of money you need to pay for OOP expenses. Is this closest to…?
36%
26%
19%
8%
10%
2%
5%
10%
15%
20%
% of income % of respondents

As expenses increase from 2% to 20% of income,
affordability decreases, prompting cutbacks.
Please think about the amount of money you need to pay for OOP expenses. Is this closest to…? Is [insert monthly OOP expenses] affordable for you? Which of the following do you need to cut back on to pay your monthly healthcare ‘out-of- pocket’ expenses?
83%
64%
56%
43%
32%
17%
36%
44%
57%
68%
2%
5%
10%
15%
20%
Affordable Not Affordable
For each level of
income, what %
found it
affordable
If not affordable,
respondents cut
back on…
Savings 50% Food 40% Clothing 33%
Savings 62% Clothing 49% Food 42%
Savings 65% Clothing 59% Food 45%
Savings 74% Clothing 62% Food 51%
Savings 72% Clothing 57% Food 49%

For the insured who find their “out-of-pocket”
health care expenses affordable, over 70% are
spending 2-5% of their income
67%61%
52%47% 44%
39%45%
16%22%
20% 31%28%
30%25%
0%
10%
20%
30%
40%
50%
60%
70%
80%
90%
100%
< $15K $15K-24K $25K-34K $35K-49K $50K-74K $75K-99K >=$100K
Yearly Income
20%
15%
10%
5%
2%
% of income
considered
affordable% at each
income
level
Is [insert monthly OOP expenses] affordable for you?

For 25-50% of insured people, “out-of-pocket”
health care expense is not affordable.
42%46%
50%
45%
38%
31%
25%
0%
10%
20%
30%
40%
50%
60%
<$15K $15-24K $25-34K $35-49K $50-74K $74-99K >=$100K
% of insured who find OOP not affordable
Please think about the amount of money you need to pay for OOP expenses. Is this closest to…?
Is [insert monthly OOP expenses] affordable for you?

For a majority of the uninsured, 2% of income is
affordable for “out-of-pocket” health expenses
68% 68% 70%
41%51%
60%
0%
10%
20%
30%
40%
50%
60%
70%
80%
90%
100%
< $15K $15-$24K $25-34K $35K-49K $50K-74K >=$75K
Yearly Income
20%
15%
10%
5%
2%
% of income
considered
affordable
% of people
at each
income
level
‡https://www.thehortongroup.com/resources/acas-affordability-contribution-percentage-increase-for-2017

• The uninsured public’s view of affordability
is 2% of income.
• In the Affordable Care Act, coverage is considered
affordable if the required contribution for the
lowest-cost coverage does not exceed
8.2% of income.‡ If it is above this level the
individual penalty does not apply.
• This is significant because it show’s the public’s
view of affordability is vastly different from the
lawmakers’ view of affordability.
‡https://www.thehortongroup.com/resources/acas-affordability-contribution-percentage-increase-for-2017

Blame for rising health care costs: Health insurance
companies, drug and device manufacturers,
federal government. Consumers & physicians agree
4% 2%
10%9%
5% 11%
23%12%
30%
19%
28%
47%
0%
10%
20%
30%
40%
50%
60%
70%
80%
90%
100%
Consumers Physicians
Insurance Companies
Drug & DeviceManufacturers
Federal government
Patients
Hospitals
Physicians
Who do you think deserves the most blame for rising healthcare costs? Please select one response only.

Which of the following is most likely to decrease the cost of healthcare
Most likely to reduce the expense of health care:
increasing cost for poor health habits,
and creating an affordable catastrophic plan.
Consumers and physicians agree.

Background: Former CMS Administrator Berwick
estimates overtreatment wastes $192 billion per year JAMA 2012;307(14):1513
• “Overtreatment: the waste that comes from subjecting patients to
care that, according to sound science and the patients’ own
preferences, cannot possibly help them” Berwick
• “The way physicians are paid [fee-for-service] drives up medical
expenditures” Schroeder and Frist N Engl J Med 2013; 368:2029
• “CMS announced a new payment methodology in 2015 …U.S. health
care payments linked to quality and value” HHS Secy Burwell N Engl J Med 2015; 372:897
• Paying physicians salary is associated with 9% to 33% less tests and
procedures than fee-for-service Gosden, Broomberg, Manning
• Who salaries physicians? Mayo Clinic, Cleveland Clinic, Kaiser
Permanente

Only 1 in 3 physicians is currently paid 100% salary;
the remainder have a portion paid fee-for-service
17% 18% 16%
8% 8% 8%
10% 7% 9%
33% 33% 36%
32% 34% 31%
0%
10%
20%
30%
40%
50%
60%
70%
80%
90%
100%
TOTAL GENERALISTS SPECIALISTS
100% Salary
75-99% Salary
50-74% Salary
1-49% Salary
0% Salary (100% FFS)
Physician compensation is often a mix of fixed pay (standard wages you receive from your employer, excluding benefits and bonus) and variable pay (wages you receive that fluctuate based on performance). Please tell us what percentage of your current salary/compensation is fixed and what percentage is variable. If you are paid entirely fee-for-service, enter 100% under VARIABLE PAY. Please keep in mind that your answers below must total 100%.
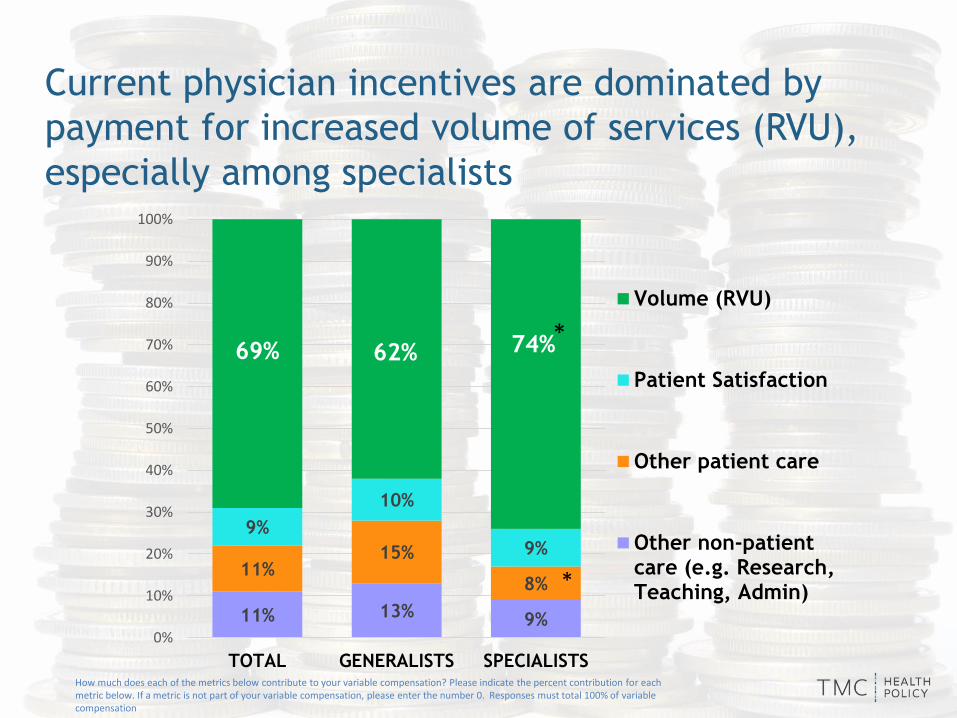
Current physician incentives are dominated by
payment for increased volume of services (RVU),
especially among specialists
11% 13% 9%
11%15%
8%
9%
10%
9%
69% 62% 74%
0%
10%
20%
30%
40%
50%
60%
70%
80%
90%
100%
TOTAL GENERALISTS SPECIALISTS
Volume (RVU)
Patient Satisfaction
Other patient care
Other non-patientcare (e.g. Research,Teaching, Admin)
*
*
How much does each of the metrics below contribute to your variable compensation? Please indicate the percent contribution for each metric below. If a metric is not part of your variable compensation, please enter the number 0. Responses must total 100% of variable compensation

Ideal physician compensation is salary
7% 8% 7%
11% 9% 13%
13% 14% 13%
27% 31% 34%
42% 39% 44%
0%
10%
20%
30%
40%
50%
60%
70%
80%
90%
100%
TOTAL GENERALISTS SPECIALISTS
High % salary with lowincentives
Salary only
Straight volume (RVU)
50% salary / 50%incentives
Low % salary with highincentives
Which of the following physician compensation models is most ideal for you? (Note: For the “fixed salary only” option below,the pay would be the same as your current fee-for-service compensation; raises would be determined by your employer)
69%

10% of physicians and 19% of consumers think that
President Trump is doing a good job on health care –
red states more
Please provide your response using a 7-point scale where ‘1’ means No, definitely not and ‘7’ means Yes, definitely. Do you think President Trump is doing a good job right now regarding his plans for health care
54% 50%45%
54%
36%
31%34%
28%
10%19% 21% 18%
0%
10%
20%
30%
40%
50%
60%
70%
80%
90%
100%
PHYSICIANSTOTAL
CONSUMERSTOTAL
Red States Blue States
Good Job
Neutral
Not good job
*

Key take-away points
1. 98-99% of public across all states considers having
health insurance important to their family
2. Half must cut down on other expenses to pay for health care
3. The public’s view of affordability is vastly different
from the lawmakers’ view of affordability.
4. A majority of physicians and consumers blame insurance companies
and drug & device manufacturers for the current high cost
5. Physicians and consumers say most likely to reduce cost of health care
• Increase costs for those with poor health habits
• Create an affordable “catastrophic plan”
6. Over 2/3 of physicians want to be paid mostly or entirely by salary.
Evidence suggests salaried physicians may order fewer tests
and procedures, and could help reduce the $200B in overtreatment

The Graham-Cassidy bill has until October 1.
1. Eventually (2026) eliminates all federal money currently funding
Medicaid expansion and subsidies for low income to buy insurance
2. Transition “equalizes” funding to states by a new formula with a
block grant (per capita), reducing payments to states with Medicaid
expansion and increasing to those without.
• This transition funding disappears in 2025
3. Prohibits Medicaid coverage of childless adults
4. Permits states to
• Adjust “essential benefits”
• Allow premium rating based on health status
5. Eliminates ACA individual and employer mandates
6. No “score” from Congressional Budget Office
on effect on numbers of uninsured or deficit

“No current or proposed legislation has
addressed the cost of health care for each
American in a substantive way.
Until we do that, we will not be able to
afford health care for all.
Otherwise,
it will be moving deck chairs on the Titanic.”