the natural food habits of grizzly bears in yellowstone · tance of food items used by grizzly...
TRANSCRIPT
THE NATURAL FOOD HABITS OF GRIZZLY BEARS IN YELLOWSTONE NATIONAL PARK, 1973-741 STEPHEN PATRICK MEALEY, U.S. Forest Service, Cody, Wyoming 82414
Abstract: The natural food habits of grizzly bears (Ursus arctos horribilis Ord) in Yellowstone National Park were investigated in 1973-74 to identify the grizzly's energy sources and trophic level(s), nutrient use, and distribution. Food consumption was determined by scat analysis and field observations. Food quality and digestibility were estimated by chemical analysis. Grizzlies were distributed in 3 distinctive feeding economies: valley/plateau, a grass/rodent economy where grizzlies were intensive diggers; mountain, primarily a grass/springbeauty/root economy where grizzlies were casual diggers; and lake, primarily a fish/grass economy where grizzlies were fishers. The economies occured in areas with fertile soils; distribution of bears within each was related to the occurrence of succulent plants. The feeding cycle in the valley/plateau and mountain economies followed plant phenology. Grizzlies fed primarily on meat before green-up and on succulent herbs afterwards; meat, corms, berries, and nuts became important during the postgrowing season. Succulent grasses and sedges with an importance value percentage of 78.5 were the most important food items consumed. Protein from animal tissue was more digestible than protein from plant tissue. Storage fats were more digestible than structural fats. Food energy and digestibility were directly related. Five principle nutrient materials (listed with their percentage digestibilities) contributed to total energy intake: protein from succulent herbs, 42.8; protein and fat from animal material, 78.1; fat and protein from pine nuts, 73.6; starch, 78.8; and sugar from berries and fruits, digestibility undetermined. Protein from succulent herbs, with a nutritive value percentage of 77.3, was the grizzlies' primary energy source. Because succulent, preflowering herbs had higher protein levels than dry, mature herbs, grizzly use of succulent herbs guaranteed them the highest source of herbaceous protein. Low protein digestibility of succulent herbs was compenstated for by high intake. Grizzlies were digestively flexible and maximized use of protein from plant and animal sources. They were adapted to the most constant and abundant sources of protein: succulent herbs and animal material from open, fertile grasslands. Competition among grizzlies for animal food during the pregrowing season may be regulatory for the grizzly population. The grizzly population level can be partially accounted for by the grizzlies' status as secondary consumers during pregreen-up periods and primary consumers during the growing and postgrowing seasons. The essential environmental requirement was the availability of fertile grasslands and herblands interspersed with cover and capable of maintaining artiodactyls, rodents, and abundant nutritious herbs as sources of food.
Extensive grizzly bear (Rausch 1963) use of un- natural foods (garbage and camp groceries) in Yel- lowstone National Park occured from the early days of the park until closure of the Trout Creek and West Yellowstone open-pit garbage dumps in 1971 (Skinner 1925, Cole 1976). After these primary sources of un- natural foods were removed, most grizzlies resumed use of natural foods (Cole 1974).
This report on grizzly bear use of natural foods is based on research conducted in 1973 and 1974 as part of the Interagency Grizzly Bear Team Study. The overall objectives were to develop hypotheses about the grizzly's natural energy sources and tropic level(s), the quality and quantity of nutrient use, and grizzly dis- tribution.
I am grateful to all those who gave help, advice, and encouragement during this study. R. R. Knight pro- vided the research opportunity, aided in scat collection, and critically read the manuscript. H. D. Picton pro- vided advice throughout the study and aided in prep- aration of the manuscript. R. J. Mackie and W. R. Gould critically read an early draft of the manuscript. J. H. Rumely aided in identification of plant specimens. G. F. Cole gave valuable advice and aided in scat collection. D. G. Despain helped to identify plant specimens, interpreted the distribution of vegetation, and aided in scat collection. D. B. Houston, M. M.
'This study was funded by the National Park Service con- tract CX-6860-4-0486 and the Montana Agricultural Ex- periment Station (Journal Series No. 751).
Meagher, G. Merin, R. Schmidt, J. M. Chester, B. Hoskins, D. C. Graham, and T. Haraden aided in scat collection. K. R. Greer provided technical advice and laboratory facilities, and J. Montagne provided infor- mation on geology and soils. I am especially grateful to my wife, Marjorie, for her aid in the collection and preparation of plant specimens and in the preparation of scat samples, for typing the rough draft of the manuscript, and for her encouragement during the research.
STUDY AREA
The study area included all of Yellowstone National Park, which occupies about 8,900 km2 in the states of Wyoming, Montana, and Idaho. The geology of the park was described by Keefer (1972) and Eaton et al. (1975), the climate by Lowery (1959), and the vegeta- tion zones by Despain (1973b). Soil types in the park were described by Washington (1917), Despain (1973a), and Stermitz et al. (1974).
Interactions among the park's geologic events, cli- mate, soils, and vegetation resulted in 3 apparent physiographic/vegetative units (Fig. 1). These units are as follows: (1) the mountainous unit with the spruce-fir (Picea engelmanii-Abies lasiocarpa) and alpine-tundra zones and herblands and grasslands covering fertile an- desitic soil; (2) the valley and plateau units with grass- lands and the Douglas-fir (Pseudotsuga menziesii) zone covering fertile, transported soils; and (3) the plateau unit with lodgepole pine (Pinus contorta) covering in- fertile rhyolitic soils.

282 BEARS- THEIR BIOLOGY AND MANAGEMENT
?. ........ '*... . . . / /'?,,::-.v':
:~~~~.-. ... .. .. .. ? .I ? ~ ~ ~ ~ ~......... ??i?tt...........
?i?? &llItl
,~,~,'~~~~~~~~~ . '.'.'. . . . .. ....... ....
?
.
??~?????????????i
::~..{~j
.. ? . . . . . . ? . . ...... . ?..' ... :::::::::::::::::::::::::::::::::::::::::::::::::................. .. ''.*'
' ' * '
** ............
'
'....... ,~~~~~~~~~...... . .. ~ . :.:::::::::. . . . . . !. : ..,,,,,,, .',.,. .. .. .. ... .. .. .. . .... . .
. . . ., .,,. . . . .. . . .. .. .. .. . .. . . .....
.. .. .. . . . .?
. ?. . //.'.' /.
. . . . . .~ ~ ~ ~ .'. '..'.',..'.'...'.' .'.'.' . . .
Valley and Plateau Units: Fertile Soils; Douglas-fir and Grassland Zones.
1/1It Mountainous Unit: Fertile Soils; Spruce Fir and Alpine-Tundra Zones.
.'' Plateau Unit: Infertile Soils; Lodgepole Pine Zone with Spruce and F. ' Fir.
Fig. 1. Map showing 3 generalized physiographic/vegetative units in Yellowstone National Park.
METHODS
Quantitative Analysis: Scat Collection,
Preparation, and Analysis Collections of scats and visual obeservations of
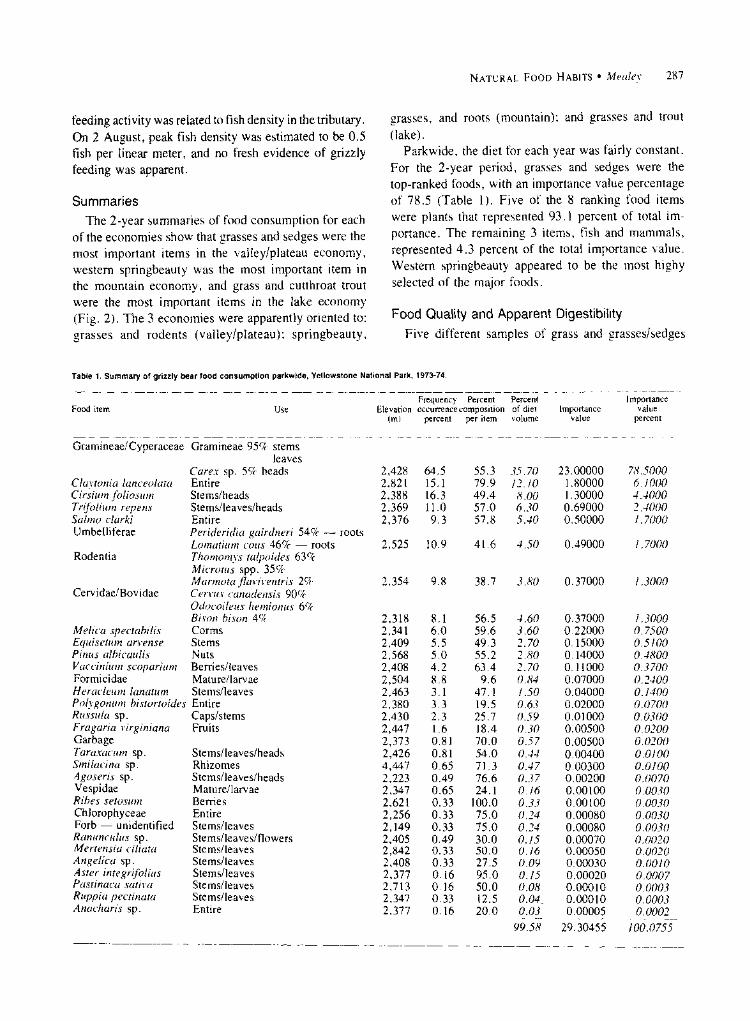
feeding that were made during 557 man-days in the field were used to determine the quantitative impor- tance of food items used by grizzly bears. In 1973, this activity was parkwide, excluding the Absaroka Range.
In 1974, activity was concentrated in major use areas identified in 1973.
Size distinguished grizzly scats from black bear scats; those with diameters 5 cm or greater were nor- mally considered grizzly scats (Murie 1954). Several field observations verified the validity of this criterion. Other evidence considered in identifying grizzly scats consisted of associated track sign and feeding activity sign, visual observation of bears, and the general nature of the location. Scats with diameters less than 5 cm were
--------- I I I ~~~~~~ ~ - . . . . - . I I j~~~?? .. . t- ... - ' ?: ?? ... ... ? )
NATURAL FOOD HABITS * Mealev 283
assumed to be those of small or immature grizzlies only if there was some evidence of grizzly use of the loca- tion.
Every grizzly scat located singly was collected. When groups of 10-25 scats were located, one-half the total in each group was collected. When groups of more than 25 scats were located, one-third the total in each was collected. All scats were individually identified according to location, altitude, vegetative surroundings, and age estimated to the nearest month by characteris- tics of the site (Mealey 1975). Scats were air-dried for storage; those that were extremely moist or infested with insect eggs or larvae were oven-dried at low heat to kill organisms that could change the nature of scat contents.
Analysis of scat contents was conducted in the field and in the laboratory. Scat contents were more identifi- able when fresh in the field, and plant remains were easily compared with nearby specimens. Materials analyzed in the field were taken to the laboratory for further study.
Analysis of bear scats in the laboratory followed the techniques of Tisch (1961). Russell (1971), and Sumner and Craighead (1973). Basic steps involved (1) rehydration of fecal material to render it pliable and to restore its original form, (2) separation of material into homogeneous groups by use of screens (No. 10 and No. 20 mesh), (3) identification of contents, and (4) recording of identified materials.
Identification to species, through macroscopic and microscopic examination, was usually successful for all plants except grass and sedge. Animal materials were identified with the aid of reference collections of bones and hair and textual references (Spence 1963, Hoffman and Pattie 1968).
The occurence and volume of each identified food item were recorded as each scat was analyzed. Visual estimates of volume were recorded under 1 of 4 categories: trace-25 percent, 25-50 percent, 50-75 per- cent, and 75-100 percent. Estimation of scat composi- tion by volume undervalued the use of some foods as indicated by proximate analysis techniques that estab- lished differential digestibility of food items.
Data were grouped in a number of categories in- cluding 3 that related grizzly food use and plant phenology: pregrowing season, 1 April-1 June; grow- ing season, 1 June-1 September; and postgrowing sea- son, 1 September-15 November. These periods reflect plant growth conditions in Yellowstone Park (D. G. Despain, personal communication, 1974).
Food items were ranked according to importance value (Sumner and Craighead 1973) calculated as:
Percent frequency x Percent of Importance of occurrence diet volume
value 100
where percent frequency of occurrence equals the total number of times a specific food item appeared in scats of the sample group, divided by the total number of scats in the sample; and percent of diet volume equals the total percentage volume of an item occurring in scats of the sample group, divided by the total number of scats in the sample.
Importance value was chosen as the indicator of food item importance because it establishes relative equilib- rium between items that occurred frequently but in low volume percentages.
Percents composition per item and importance value percents were calculated. Percentage composition per item suggests a degree of selection for particular foods; values were derived by dividing the total percent vol- ume of an item by the total number of scats containing that food item. Importance value percentages were de- rived by adding the importance values in the group and dividing individual values in the group by the sum.
Qualitative Analysis: Food Quality, Digestibility, and Nutritive Value
Identities, energy values, and apparent digestibilities of the principal nutrient materials of the most important grizzly foods were determined, as were seasonal nutri- tive values.
Standard proximate analysis procedure detailed by Crampton and Harris (1969) was used in estimating the quality and apparent digestibility of food items. Food items containing starch were also evaluated by a special starch analysis method (Banks et al. 1970). Food qual- ity is defined in terms of the amounts of protein, fat, and carbohydrate present in a food item and the caloric values of the item. Apparent digestibility is an estimate of nutrient utilization and digestive efficiency. Digesti- bility was estimated by calculating the percentage of nutrient intake not present in food item residues in scats.
Determinations of food quality and apparent digesti- bility were subject to a minimum of 4 sources of possi- ble error: (1) analytic procedures could not account for all material completely assimilated; (2) in proximate
284 BEARS - THEIR BIOLOGY AND MANAGEMENT
analysis, nitrogen-free extract values are determined by difference; (3) feces probably contained protein and fat from nondietary origin (Crampton and Harris 1969); and (4) sampling error.
Food items and scats containing residues of the same items were collected at the feeding sites. Scat and food item samples were paired and submitted for analysis. Analytical methods for proximate analysis followed the Association of Official Agricultural Chemists hand- book (Horowitz 1975), and the analyses were per- formed by the Analytical Chemistry Laboratory of Montana State University.
The digestibilities of 4 principal grizzly nutrient materials were estimated by averaging the values for individual food items.
Seasonal nutritive values were calculated from data on seasonal food use in 1974. Nutrient importance val- ues were determined by a method similar to that used for the determination of food item importance values.
A nutritive value index (NVI) of the principal nutrients was calculated to estimate each nutrient's contribution toward the grizzly's energy intake. The index was calcu- lated according to the formula: NVI =
Nutrient intake percent Digestibility (Percent importance value) percent
100 Nutritive value indices were converted to percentages to facilitate comparisons.
RESULTS
Distribution
Grizzly distribution in the park was influenced by unique processes of interaction between bears and their foods. In 1973, 3 such processes were hypothesized and each identified as an economy. These were the
valley/plateau, mountain, and lake economies. The basis for initially distinguishing these economies was the simultaneous occurence of scats in each. After further study in 1974, each economy seemed to repre- sent a mix of physiographic and biotic conditions re-
sulting in a characteristic pattern of interactions be- tween grizzlies and food items that allowed the bears to maximize food use. Each economy appeared to repre- sent a center of concentrated grizzly feeding activity determined by locations of scats collected in 1973 and 1974. Areas of high grizzly density determined by ae- rial surveys were coincident (Knight 1974, 1975).
Feeding economies were centered on areas with fer- tile soils (Fig. 1). Little feeding activity was apparent on infertile soils. Highest grizzly densities, excluding the lake economy, were reported on the rich grasslands of Hayden and Pelican valleys (Knight 1975), although use of these areas was not as evident in 1975 as in 1973-74 (Knight 1976).
Valley/Plateau Economy
Major epicenters of the valley/plateau economy were Hayden, Pelican, and Lamar valleys, and Cougar Creek Flat. Fertile, transported soils support an abun- dant grassland biota that provided most of the food used in the economy. The valleys and flat were largely surrounded by plateaus with infertile soils and lodgepole pine forests. The plateau component pro- vided cover and occasional food.
Comparing grizzly foods of the valley/plateau economy between years indicated that the diets in 1973 and 1974 were similar. Grasses and sedges were the most important items both years. The importance of white clover (Trifolium repens) and elk thistle (Cirsium
foliosum) differed between years because an area with scats containing primarily the remains of these items was sampled in 1973 but not in 1974. For the 2-year period, grasses and sedges constituted 82 percent of diet importance.
The general feeding cycle appeared to follow plant phenology. During the pregrowing season, grizzlies were primarily meat eaters, congregating on ruminant wintering areas and taking the animal material avail- able. Cole (1972) has detailed this activity. Corms, roots, and grass were eaten before and during early green-up. During the growing season, grasses, sedges, forbs, and rodents were the primary foods. Succulent vegetation in open areas near cover was perferred; its availability, linked with that of rodents, influenced distribution of grizzlies. Most plants were succulent at that time and bears were widely distributed.
During the postgrowing season, succulent grasses and forbs remained important foods. Since these foods were associated only with moist sites, feeding was limited to such sites and bears were narrowly distributed. Sea- sonal foods in the lodgepole pine forests became available as grasses, sedges, and forbs in the valleys desiccated; whitebark pine (Pinus albicaulis) nuts, and berries were taken along with mushrooms (Russula sp.) and the rhizomes of smilacina (Smilacina sp.). Predation on
male, breeding elk (Cervus canadenis nelsoni) may also have occurred. Extensive use was made of melica
(Melica spectabilis) corms in Pelican and Lamar valleys.

NATURAL FOOD HABITS * Mealey 285
Intensive digging was the characteristic feeding ac- tivity of grizzlies in the valley/plateau economy, espe- cially during the growing season. Pocket gophers (Thomomys talpoides) and voles (Microtus sp.) appar- ently motivated this activity. Locally concentrated ex- cavations ranged in volume from a few hundred cubic centimeters to nearly a hundred cubic meters. Most were from 1 to 5 m3 in volume. Large numbers of scats were often found at digging sites. Average residues in scat contents were 90 percent grasses and forbs and 10 percent rodents. Grizzlies apparently pursued rodents but often settled for grasses, forbs, and a small amount of meat. Bears were observed locating, digging out, and eating roots, corms, bulbs, and young gophers. The small but consistent degree of success in catching rodents probably held the bears in the feeding pattern. Intensive digging activity and associated evidence of grazing usually occurred in locations where xeric sites were interspersed with mesic or hydric sites. The exca- vations occurred on the xeric sites and grazing occurred on the adjacent mesic or hydric sites.
White clover was used extensively where it was abundant and associated with other foods. As many as 50 scats containing only white clover residues were found in individual white clover patches.
Possession of a bull elk carcass during the post- growing season, after herbs had dried, did not preclude a grizzly's other foraging activities. Most scats col- lected near its meat cache contained residues of plants and elk.
Mountain Economy The Gallatin and Washburn ranges were major cen-
ters of the mountain economy. Their fertile andesitic and sedimentary soils supported abundant vegetation in mountain meadows, herblands, parklands, and on ridgetops.
The most important food items consumed in the mountain economy in 1973 and 1974 were identical and were similarly ranked. For the 2-year period, springbeauty (Claytonia lanceolata) ranked first in food consumption importance, grasses and sedges ranked second, the roots of Umbelliferae ranked third and whitebark pine nuts ranked fourth.
Again, the general feeding cycle followed plant phenology. There were elk and moose (Alces alces shirasi) wintering areas in the economy, and use of ruminant material probably occurred during the pre- growing season although this period was not sampled. During the growing season, springbeauty, grasses, and sedges were the most important foods. Springbeauty
was taken primarily in ridgetop herblands; grasses and sedges were taken in meadows and parklands. Feeding activities and distribution of bears in relation to these foods were influenced by plant succulence. Feeding began in snow-free locations and followed snowmelt and green-up to the highest elevations by late June and August. After desiccation of plants on the highest ridgetops in late August, feeding occurred at lower elevations where plants remained green. Such sites were stream bottoms, springs, and herblands associated with persistent snowbanks. During the early post- growing season, feeding activities continued to be in- fluenced primarily by succulent vegetation on moist sites. Pine nuts and gooseberries (Ribes setosum) ap- peared to be incidental foods. In October, after the desiccation of most herbs, feeding activity was con- centrated on ridges at elevations of about 2,740 m where pine nuts, Umbelliferae roots, and springbeauty corms were taken exclusively.
Foraging patterns of the early postgrowing season in the mountain and valley/plateau economies were simi- lar in that grizzlies concentrated on moist sites with succulent herbs and used seasonal foods incidentally. Foraging in the late postgrowing season was different in the 2 economies because grizzlies in the mountain economy ate pine nuts, roots, and corms on high ridges, whereas in the valley/plateau economy grizzlies fed on grasses, forbs, pine nuts, mushroons, rhizomes, and ruminants in the lodgepole pine forest.
Casual digging for springbeauty corms and biscuit- root (Lomatium cous) roots was the characteristic feeding activity of grizzlies in the mountain economy. The resulting excavations were usually shallow, a few cubic centimeters in volume.
Eating of whitebark pine nuts occurred in 2 ways. Incidental use occurred in late August and September, when the mature cones remained on the trees. Since most grizzlies do not climb, the only cones available to the bears during this time were those on the ground as a result of squirrel (Tamiasciurus hudsonicus) cuts and windthrow. Exclusive use occurred in October and probably November after cone disintegration and/or abscission. At that time, nuts and cones were abundant on the ground and grizzlies were linked directly to them. A move to higher-elevation ridges where whitebark pine is abundant was a response to cone dis- integration and abscission.
Grazing on grasses and sedges was concentrated in dense stands of succulent forage at least 8 cm tall. Grizzlies usually grazed with a sideways motion of the head, which placed the muzzle perpendicular to the
286 BEARS THEIR BIOLOGY AND MANAGEMENT
vegetation. The food was grasped with the molars and plucked. Feeding activity was rapid and was sustained for prolonged, uninterrupted periods.
Lake Economy The lake economy consisted of Yellowstone Lake
tributaries that supported spawning cutthroat trout (Salmo clarki) used as food by grizzlies. The economy functioned in the south, southeast, and Flat Mountain arms of the lake.
The food items contributing to the diet in the lake economy were similar in 1973 and 1974 but differed in rank and importance value, probably because of sam- pling differences. During the 2-year period, grass and cutthroat trout were the most important foods.
The feeding cycle was directly related to spawning activities of cutthroat trout, which extended from late June to early August. Time of occurrence of spawning trout varied among individual tributaries (Knight 1975).
Feeding activity was observed along a tributary at the tip of Flat Mountain Arm during the last half of July 1974. Estimated flow in the steam was 0.13 m3/ second, and estimated peak fish density was 6 fish per linear meter within 0.8 km of the mouth. Cutthroat trout in this segment averaged 38 cm in length and 0.6 kg in weight. Eleven different grizzlies were sighted fishing in the vicinity between 16 July and 18 July 1974 (Knight 1975). Grass, horsetail (Equisetum arvense), and elk thistle were heavily grazed in the area. Grizzly
VALLEY/PLATEAU ECONOMY
Scat Sample - 340
MOUNTAIN ECONOMY
Scat Sample - 170
LAKE ECONOMY
Scat Sample - 105
1-
1-
I-
-I
=1
= .O
=. t
= ..
= IS
1-i
tt) 1u
L:
-
-
*
1- =
-=
a
-
m-=
m =
m (3)
Lr) -a (1) 4i
. 00 0 'n
C ' 0 r- Lr) CIJ . r- .
. --I
I[ l Vaccinium scoparium
i | MelZica spectabilis (Corms) [ Rodentia
ervidae/Bovidae ireium foziosum
Trifolium repens Craminae/Cyperaceae
C14 Q) . c
! -3- .1-i C14 0 SN C m
Ol
pinus albicaulis Umbelliferae (Roots)
raminae/Cyperaceae tZaytonia Zanceo ata
*r L ' .
IIi4 I I ~Teracleum lanatunm
Umbelliferae (Roots)
|quisetum arvense ircium foliosum
Salmo clarki Graminae
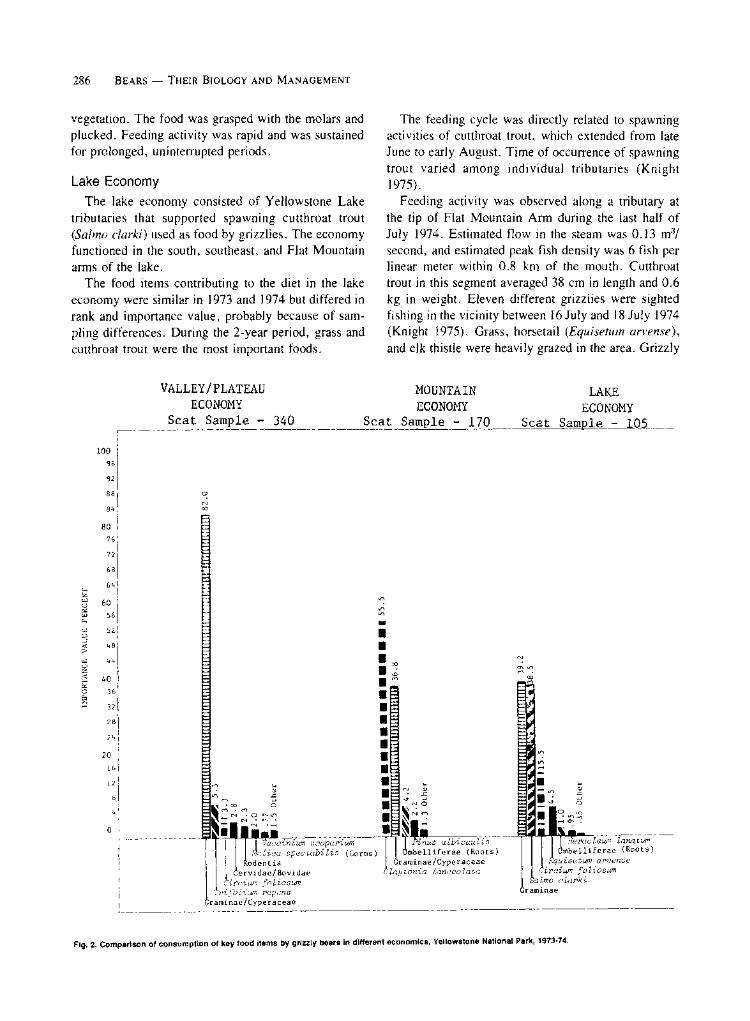
Fig. 2. Comparison of consumption of key food items by grizzly bears in different economics, Yellowstone National Park, 1973-74.
C4
7.
~-l
H PC 0)
100
96
92
88
84
80
76
72
68
64
60
56
52
48
44
40
36
32
28
24
20
16
12
8
4
C14
C Lr)
Cl) C
E I = I
m ~ . - q-- a
NATURAL FOOD HABITS * Mealey 287
feeding activity was related to fish density in the tributary. On 2 August, peak fish density was estimated to be 0.5 fish per linear meter, and no fresh evidence of grizzly feeding was apparent.
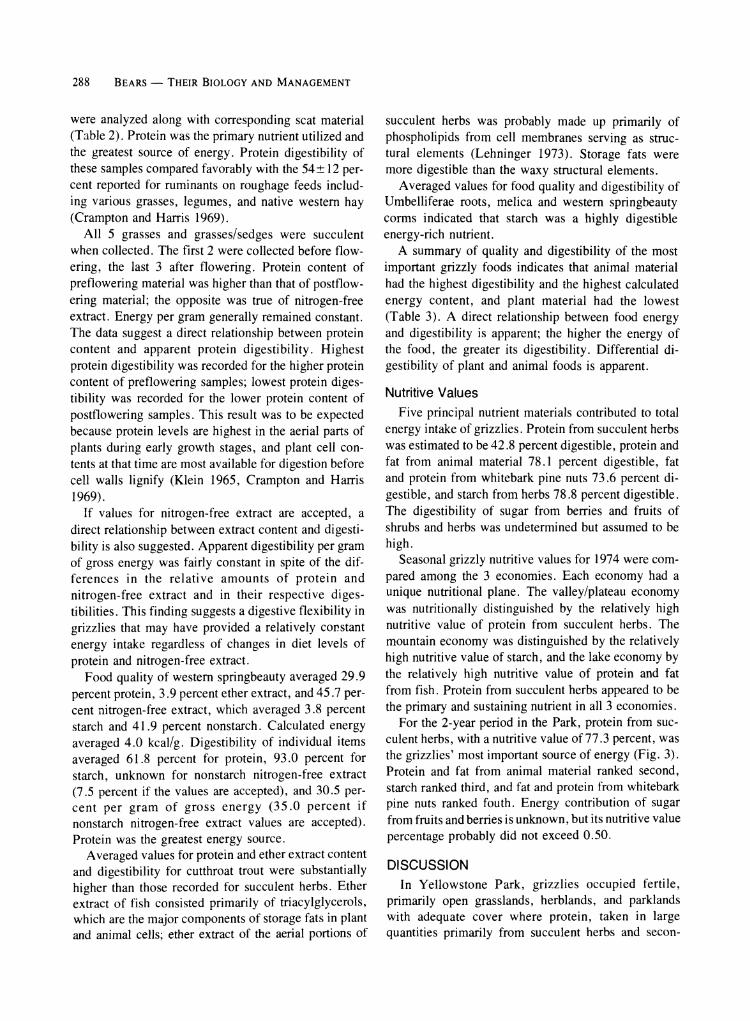
Summaries The 2-year summaries of food consumption for each
of the economies show that grasses and sedges were the most important items in the valley/plateau economy, western springbeauty was the most important item in the mountain economy, and grass and cutthroat trout were the most important items in the lake economy (Fig. 2). The 3 economies were apparently oriented to: grasses and rodents (valley/plateau); springbeauty,
grasses, and roots (mountain); and grasses and trout (lake).
Parkwide, the diet for each year was fairly constant. For the 2-year period, grasses and sedges were the top-ranked foods, with an importance value percentage of 78.5 (Table 1). Five of the 8 ranking food items were plants that represented 93.1 percent of total im- portance. The remaining 3 items, fish and mammals, represented 4.3 percent of the total importance value. Western springbeauty appeared to be the most highy selected of the major foods.
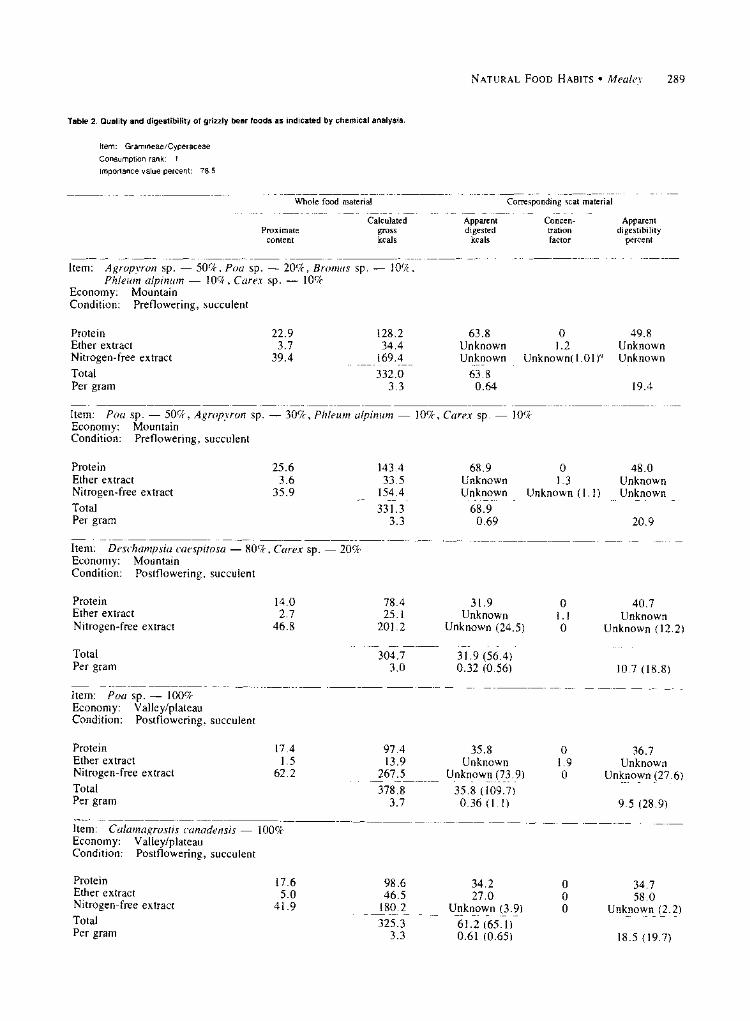
Food Quality and Apparent Digestibility Five different samples of grass and grasses/sedges
Table 1. Summary of grizzly bear food consumption parkwide, Yellowstone National Park, 1973-74.
Food item Use Frequency PercPercentPercent
Elevation occurrence composition of diet (m) percent per item volume
Importance value
Importance value
percent
Gramineae/Cyperaceae Gramineae 95% stems leaves
Carex sp. 5% heads Claytonia lanceolata Entire Cirsium foliosum Stems/heads Trifolium repens Stems/leaves/heads Salmo clarki Entire Umbelliferae Perideridia gairdneri 54% - roots
Lomatium cous 46% - roots Rodentia Thomomys talpoides 63%
Microtus spp. 35% Marmota flaviventris 2%
Cervidae/Bovidae Cervus canadensis 90% Odocoileus hemionus 6% Bison bison 4%
Melica spectabilis Corms Equisetum arvense Stems Pinus albicaulis Nuts Vaccinium scoparium Berries/leaves Formicidae Mature/larvae Heracleum lanatum Stems/leaves Polygonum bistortoides Entire Russula sp. Caps/stems Fragaria virginiana Fruits Garbage Taraxacum sp. Stems/leaves/heads Smilacina sp. Rhizomes Agoseris sp. Stems/leaves/heads Vespidae Mature/larvae Ribes setosum Berries Chlorophyceae Entire Forb - unidentified Stems/leaves Ranunculus sp. Stems/leaves/flowers Mertensia ciliata Stems/leaves Angelica sp. Stems/leaves Aster integrifolius Stems/leaves Pastinaca sativa Stems/leaves Ruppia pectinata Stems/leaves Anacharis sp. Entire
2,428 2,821 2,388 2,369 2,376
2,525
64.5 15.1 16.3 11.0 9.3
10.9
55.3 79.9 49.4 57.0 57.8
41.6
35.70 12.10 8.00 6.30 5.40
4.50
23.00000 1.80000 1.30000 0.69000 0.50000
0.49000
78.5000 6.1000 4.4000 2.4000 1.7000
1.7000
2,354 9.8 38.7 3.80 0.37000 1.3000
2,318 2,341 2,409 2,568 2,408 2,504 2,463 2,380 2,430 2,447 2,373 2,426 4,447 2,223 2,347 2,621 2,256 2,149 2,405 2,842 2,408 2,377 2,713 2,347 2,377
8.1 6.0 5.5 5.0 4.2 8.8 3.1 3.3 2.3 1.6 0.81 0.81 0.65 0.49 0.65 0.33 0.33 0.33 0.49 0.33 0.33 0.16 0.16 0.33 0.16
56.5 59.6 49.3 55.2 63.4
9.6 47.1 19.5 25.7 18.4 70.0 54.0 71.3 76.6 24.1
100.0 75.0 75.0 30.0 50.0 27.5 95.0 50.0 12.5 20.0
4.60 3.60 2.70 2.80 2.70 0.84 1.50 0.63 0.59 0.30 0.57 0.44 0.47 0.37 0.16 0.33 0.24 0.24 0.15 0.16 0.09 0.15 0.08 0.04. 0.03
99.58
0.37000 0.22000 0.15000 0.14000 0.11000 0.07000 0.04000 0.02000 0.01000 0.00500 0.00500 0.00400 0.00300 0.00200 0.00100 0.00100 0.00080 0.00080 0.00070 0.00050 0.00030 0.00020 0.00010 0.00010 0.00005
29.30455
1.3000 0.7500 0.5100 0.4800 0.3700 0.2400 0.1400 0.0700 0.0300 0.0200 0.0200 0.0100 0.0100 0.0070 0.0030 0.0030 0.0030 0.0030 0.0020 0.0020 0.0010 0.0007 0.0003 0.0003 0.0002
100.0755
288 BEARS- THEIR BIOLOGY AND MANAGEMENT
were analyzed along with corresponding scat material (Table 2). Protein was the primary nutrient utilized and the greatest source of energy. Protein digestibility of these samples compared favorably with the 54+ 12 per- cent reported for ruminants on roughage feeds includ- ing various grasses, legumes, and native western hay (Crampton and Harris 1969).
All 5 grasses and grasses/sedges were succulent when collected. The first 2 were collected before flow- ering, the last 3 after flowering. Protein content of preflowering material was higher than that of postflow- ering material; the opposite was true of nitrogen-free extract. Energy per gram generally remained constant. The data suggest a direct relationship between protein content and apparent protein digestibility. Highest protein digestibility was recorded for the higher protein content of preflowering samples; lowest protein diges- tibility was recorded for the lower protein content of postflowering samples. This result was to be expected because protein levels are highest in the aerial parts of plants during early growth stages, and plant cell con- tents at that time are most available for digestion before cell walls lignify (Klein 1965, Crampton and Harris 1969).
If values for nitrogen-free extract are accepted, a direct relationship between extract content and digesti- bility is also suggested. Apparent digestibility per gram of gross energy was fairly constant in spite of the dif- ferences in the relative amounts of protein and nitrogen-free extract and in their respective diges- tibilities. This finding suggests a digestive flexibility in grizzlies that may have provided a relatively constant energy intake regardless of changes in diet levels of
protein and nitrogen-free extract. Food quality of western springbeauty averaged 29.9
percent protein, 3.9 percent ether extract, and 45.7 per- cent nitrogen-free extract, which averaged 3.8 percent starch and 41.9 percent nonstarch. Calculated energy averaged 4.0 kcal/g. Digestibility of individual items averaged 61.8 percent for protein, 93.0 percent for starch, unknown for nonstarch nitrogen-free extract (7.5 percent if the values are accepted), and 30.5 per- cent per gram of gross energy (35.0 percent if nonstarch nitrogen-free extract values are accepted). Protein was the greatest energy source.
Averaged values for protein and ether extract content and digestibility for cutthroat trout were substantially higher than those recorded for succulent herbs. Ether extract of fish consisted primarily of triacylglycerols, which are the major components of storage fats in plant and animal cells; ether extract of the aerial portions of
succulent herbs was probably made up primarily of phospholipids from cell membranes serving as struc- tural elements (Lehninger 1973). Storage fats were more digestible than the waxy structural elements.
Averaged values for food quality and digestibility of Umbelliferae roots, melica and western springbeauty corms indicated that starch was a highly digestible energy-rich nutrient.
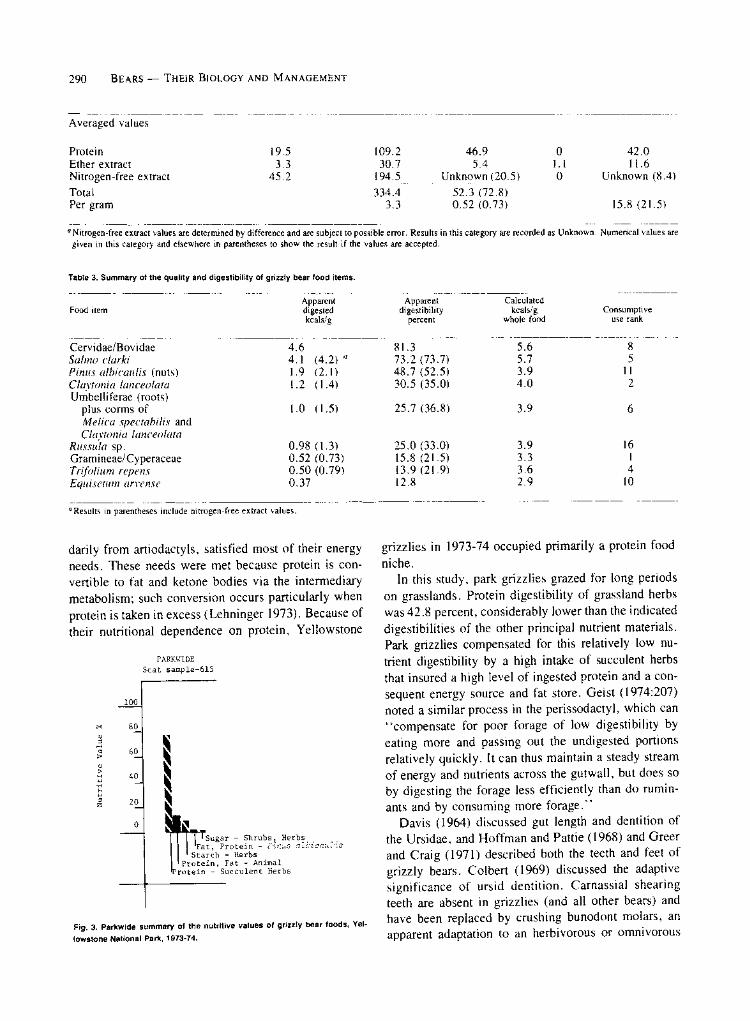
A summary of quality and digestibility of the most important grizzly foods indicates that animal material had the highest digestibility and the highest calculated energy content, and plant material had the lowest (Table 3). A direct relationship between food energy and digestibility is apparent; the higher the energy of the food, the greater its digestibility. Differential di- gestibility of plant and animal foods is apparent.
Nutritive Values Five principal nutrient materials contributed to total
energy intake of grizzlies. Protein from succulent herbs was estimated to be 42.8 percent digestible, protein and fat from animal material 78.1 percent digestible, fat and protein from whitebark pine nuts 73.6 percent di- gestible, and starch from herbs 78.8 percent digestible. The digestibility of sugar from berries and fruits of shrubs and herbs was undetermined but assumed to be high.
Seasonal grizzly nutritive values for 1974 were com- pared among the 3 economies. Each economy had a unique nutritional plane. The valley/plateau economy was nutritionally distinguished by the relatively high nutritive value of protein from succulent herbs. The mountain economy was distinguished by the relatively high nutritive value of starch, and the lake economy by the relatively high nutritive value of protein and fat from fish. Protein from succulent herbs appeared to be the primary and sustaining nutrient in all 3 economies.
For the 2-year period in the Park, protein from suc- culent herbs, with a nutritive value of 77.3 percent, was the grizzlies' most important source of energy (Fig. 3). Protein and fat from animal material ranked second, starch ranked third, and fat and protein from whitebark pine nuts ranked fouth. Energy contribution of sugar from fruits and berries is unknown, but its nutritive value
percentage probably did not exceed 0.50.
DISCUSSION In Yellowstone Park, grizzlies occupied fertile,
primarily open grasslands, herblands, and parklands with adequate cover where protein, taken in large quantities primarily from succulent herbs and secon-
NATURAL FOOD HABITS * Mealey 289
Table 2. Quality and digestibility of grizzly bear foods as indicated by chemical analysis.
Item: Gramineae/Cyperaceae
Consumption rank: 1
Importance value percent: 78.5
Whole food material
Proximate content
Calculated gross kcals
Corresponding scat material
Apparent digested
kcals
Concen- tration factor
Item: Agropyron sp. - 50%, Poa sp. - 20%, Bromus sp. - 10%, Phleum alpinum - 10%, Carex sp. - 10%
Economy: Mountain Condition: Preflowering, succulent
Protein Ether extract Nitrogen-free extract Total Per gram
Item: Poa sp. - 50%, Agropyron sp. Economy: Mountain Condition: Preflowering, succulent
22.9 3.7
39.4
128.2 34.4
169.4 332.0
3.3
63.8 Unknown Unknown
63.8 0.64
0 1.2
Unknown(1 .01)
-30%, Phleum alpinum - 10%, Carex sp. - 10%
Protein Ether extract Nitrogen-free extract Total Per gram
25.6 3.6
35.9
Item: Deschampsia caespitosa 80%, Carex sp. Economy: Mountain Condition: Postflowering, succulent
143.4 33.5
154.4 331.3
3.3
68.9 Unknown Unknown
68.9 0.69
0 1.3
Unknown (1.1)
20%
Protein Ether extract Nitrogen-free extract
14.0 2.7
46.8
78.4 25.1
201.2
304.7 3.0
Total Per gram
31.9 Unknown
Unknown (24.5)
0 1.1 0
31.9 (56.4) 0.32 (0.56)
40.7 Unknown
Unknown (12.2)
10.7 (18.8)
Item: Poa sp. - 100% Economy: Valley/plateau Condition: Postflowering, succulent
Protein Ether extract Nitrogen-free extract Total Per gram
17.4 1.5
62.2
97.4 13.9
267.5 378.8
3.7
35.8 Unknown
Unknown (73.9) 35.8 (109.7) 0.36 (1.1)
0 1.9 0
36.7 Unknown
Unknown (27.6)
9.5 (28.9)
Item: Calamagrostis canadensis 100% Economy: Valley/plateau Condition: Postflowering, succulent
Protein Ether extract Nitrogen-free extract Total Per gram
17.6 5.0
41.9
98.6 46.5
180.2
325.3 3.3
34.2 27.0
Unknown (3.9) 61.2 (65.1) 0.61 (0.65)
0 0 0
34.7 58.0
Unknown (2.2)
18.5 (19.7)
Apparent digestibility
percent
49.8 Unknown Unknown
19.4
48.0 Unknown Unknown
20.9
290 BEARS THEIR BIOLOGY AND MANAGEMENT
Averaged values
Protein Ether extract Nitrogen-free extract Total Per gram
19.5 3.3
45.2
1C
32 33
)9.2 46.9 30.7 5.4 )4.5 Unknown (20.5) 34.4 52.3 (72.8) 3.3 0.52 (0.73)
0 42.0 1.1 11.6 0 Unknown (8.4)
15.8 (21.5)
a Nitrogen-free extract values are determined by difference and are subject to possible error. Results in this category are recorded as Unknown. Numerical values are given in this category and elsewhere in parentheses to show the result if the values are accepted.
Table 3. Summary of the quality and digestibility of grizzly bear food items.
Food item Apparent digested kcals/g
Cervidae/Bovidae Salmo clarki Pinus albicaulis (nuts) Claytonia lanceolata Umbelliferae (roots)
plus corms of Melica spectabilis and Claytonia lanceolata
Russula sp. Gramineae/Cyperaceae Trifolium repens Equisetum arvense
4.6 4.1 (4.2) a 1.9 (2.1) 1.2 (1.4)
1.0 (1.5)
0.98 (1.3) 0.52 (0.73) 0.50 (0.79) 0.37
Apparent digestibility
percent
81.3 73.2 (73.7) 48.7 (52.5) 30.5 (35.0)
25.7 (36.8)
25.0 (33.0) 15.8 (21.5) 13.9 (21.9) 12.8
Calculated kcals/g
whole food
5.6 5.7 3.9 4.0
3.9
3.9 3.3 3.6 2.9
Consumptive use rank
8 5
11 2
6
16 1 4
10
"Results in parentheses include nitrogen-free extract values.
darily from artiodactyls, satisfied most of their energy needs. These needs were met because protein is con- vertible to fat and ketone bodies via the intermediary metabolism; such conversion occurs particularly when
protein is taken in excess (Lehninger 1973). Because of
their nutritional dependence on protein, Yellowstone
PARKWIDE Scat sample-615
100
80
X 60
H 40 3
j 20
0
_| Sugar - Shrubs, Herbs I Fat, Protein - Pinus albicauZis
Starch - Herbs Protein, Fat - Animal
Protein - Succulent Herbs
Fig. 3. Parkwide summary of the nutritive values of grizzly bear foods, Yel-
lowstone National Park, 1973-74.
grizzlies in 1973-74 occupied primarily a protein food niche.
In this study, park grizzlies grazed for long periods on grasslands. Protein digestibility of grassland herbs was 42.8 percent, considerably lower than the indicated
digestibilities of the other principal nutrient materials. Park grizzlies compensated for this relatively low nu-
trient digestibility by a high intake of succulent herbs that insured a high level of ingested protein and a con-
sequent energy source and fat store. Geist (1974:207) noted a similar process in the perissodactyl, which can
"compensate for poor forage of low digestibility by eating more and passing out the undigested portions relatively quickly. It can thus maintain a steady stream of energy and nutrients across the gutwall, but does so
by digesting the forage less efficiently than do rumin- ants and by consuming more forage."
Davis (1964) discussed gut length and dentition of the Ursidae, and Hoffman and Pattie (1968) and Greer and Craig (1971) described both the teeth and feet of
grizzly bears. Colbert (1969) discussed the adaptive significance of ursid dentition. Carnassial shearing teeth are absent in grizzlies (and all other bears) and have been replaced by crushing bunodont molars, an
apparent adaptation to an herbivorous or omnivorous
NATURAL FOOD HABITS * Mealev 291
diet. The front claws of grizzlies are longer than 55 mm, allowing these bears to be effective diggers, possi- bly an additional adaptation to herbivory. The food niche (primarily plant protein) occupied by Yel- lowstone grizzlies is attributable in part to their rela- tively long gut length, bunodont molars, and long claws. These physical characteristics allowed utiliza- tion of plant materials without preventing a high diges- tibility of animal material. As a result, grizzlies were digestively flexible and were able to make maximum use of both plant and animal protein. This digestive flexibility accounted in part for the successful exploita- tion of the park's 3 different food economies.
Yellowstone grizzlies appeared to be adapted primarily to the most constant and abundant protein sources in their environment. Fertile grasslands and herblands provided a constant supply of protein be- cause a relatively large portion of fixed light energy was available as food energy directly in succulent herbs and indirectly in herbivores. Conferous forests did not provide such rich souces of energy. In 1974, seasonal foods such as pine nuts and berries were relatively abundant and contributed importantly to the grizzly diet. In 1973, pine nuts and berries were not abundant and were relatively scarce in the diet. A periodic low an- nual production of nuts and berries, such as occurred in 1973, probably has no major impact on park grizzlies because nutritionally they are anchored to the more stable energy supply available from grasslands, herb- lands, and associated forested edges.
Relative scarcity of animal foods during the pregreen-up period probably sets absolute limits on the protein available to grizzlies at this time. This limited protein availability could in turn limit grizzly numbers when their demand for animal protein exceeds the sup- ply. At such times, competition among grizzlies for animal food (Cole 1972) may result in population losses. Dispersal and direct mortality may cause losses among subordinate bears (Stokes 1970, Martinka 1976). The pregrowing season is the only time in the park when bears' supply of protein could be strictly limited. This period is likely to be the primary one in which natural regulation of grizzly populations occurs.
The grizzly population in the park has been esti- mated to be 178-270; the highest density, excluding the Yellowstone Lake area, has been estimated to be 1 bear
LITERATURE CITED
BANKS, W., C. T. GREENWOOD, AND D. D. MUIR. 1970. The characterization of starch and its components. Die Starke 22(4):105-108.
per 5.7 km2 in Hayden and Pelican valleys (Knight 1974). These estimates indicate a lower population level and a lower density than might otherwise be ex- pected of an animal population at the primary consumer level in pristine grassland habitat (Odum 1971). Two explanations at least partially account for the grizzly population level and densities in the park:
1. Grizzlies are secondary consumers during pregreen-up periods, when they are probably subject to population-limiting pressures related to the amounts of available animal protein. 2. Grizzlies are relatively inefficient grazers because of their dentition and digestive structure. Hence, the available supply of areas providing the tall, dense stands of succulent protein-rich herbs that grizzlies require probably has a limiting effect on grizzly numbers.
Grizzly digestive capability with respect to succulent herbs was limited primarily to the extraction of protein. By comparison, artiodactyls digest protein, ether extract, fiber, and nitrogen-free extract from herbs in nearly any condition (Crampton and Harris 1969) and consequently obtain more energy per gram of vegeta- tion than do grizzlies. To maximize energy intake and compensate for low energy per gram of forage, grizzlies sought out and ingested large quantities of succulent herbs growing in tall, dense stands. Such high-quality stands were extensive in the park but not unlimited.
Nutritionally, free-ranging Yellowstone grizzlies using natural foods were primarily herbivores and sec- ondarily carnivores in 1973-74, obtaining protein from succulent herbs and artiodactyls. Digestive flexibility permitted maximum protein use of both plant and ani- mal foods. The principal environmental requirement necessary for continued support of grizzlies in their multi- and mixed-level trophic niche appeared to be the availability of grasslands and herblands capable of maintaining elk and bison in sufficient numbers to pro- vide adequate food for pregreen-up secondary con- sumption, of providing rodents for growing-season mixed consumption, and plentiful, succulent and nutritious herbs for growing- and postgrowing-season primary and mixed consumption.
COLBERT, E. H. 1969. Evolution of the vertebrates. 2nd ed. John Wiley and Sons, Inc., New York. 535pp.
COLE, G. F. 1972. Grizzly bear-elk relationships in Yel- lowstone National Park. J. Wildl. Manage. 36(2):556- 561.
292 BEARS- THEIR BIOLOGY AND MANAGEMENT
__. 1974. Management involving grizzly bears and hu- mans in Yellowstone National Park. 1970-73. BioSci- ence 24(6):335-338. . 1976. Progress in restoring a natural grizzly bear population in Yellowstone National Park. Natl. Park Serv. Symp. Ser. 1:183-193.
CRAMPTON, E. W., AND L. E. HARRIS. 1969. Applied ani- mal nutrition. 2nd ed. W. H. Freeman and Co., San Francisco. 753pp.
DAVIS, D. D. 1964. The giant panda, a morphological study of evolutionary mechanisms. Chicago Nat. Hist. Mus. Fieldiana Zool. Mem. 3. 339pp.
DESPAIN, D. G. 1973a. Vegetation of the Bighorn Moun- tains, Wyoming, in relation to substrate and climate. Ecol. Monogr. 43(3):329-353. . 1973b. Major vegetation zones of Yellowstone Na- tional Park. Yellowstone Natl. Park Info. Pap. 10. 4pp.
EATON, G. P., R. L. CHRISTIANSEN, H. J. IYER, A. M. PITT, D. R. MABEY, H. R. BLANK, JR., I. ZIETZ, AND M. E. GETTINGS. 1975. Magma beneath Yellowstone National Park. Science 188(4190):787-796.
GEIST, V. 1974. On the relationship of social evolution and ecology in ungulates. Am. Zool. 14(1):205-220.
GREER, K. R., AND V. CRAIG. 1971. Bear hunting in Mon- tana. Montana Fish and Game Dept., Helena. 7pp.
HOFFMAN, R. S., AND D. L. PATTIE. 1968. A guide to Montana mammals. University of Montana Printing Services, Missoula. 133pp.
HOROWITZ, W., ed. 1975. Official methods of analysis of the AOAC. 12th ed. Association of Official Analytical Chemists, Washington, D.C. 1094pp.
KEEFER, W. R. 1972. The geologic story of Yellowstone National Park. U.S. Geol. Surv. Bull. 1347. 92pp.
KLEIN, D. R. 1965. Ecology of deer range in Alaska. Ecol. Monogr. 35(3):259-284.
KNIGHT, R. R. 1974. Grizzly Bear Study Team, first interim report, 1974. Interagency Grizzly Bear Study Team, Bozeman, Mont. llpp. . 1975. Interagency Grizzly Bear Study Team annual report, 1974. Interagency Grizzy Bear Study Team, Bozeman, Mont. 60pp.
__ . 1976. Yellowstone grizzly bear investigations: annual report of the Interagency Study Team, 1975. Natl. Park Serv. Misc. Rept. 9. 46pp.
LEHNINGER, A. L. 1973. Short course in biochemistry. Worth Publishers, Inc., New York. 420pp.
LOWERY, A. R. 1959. Climatological summary for Yel- lowstone National Park. U.S. Dept. Commerce Climatography of the United States 20-48. 2pp.
MARTINKA, C. J. 1976. Ecological role and management of grizzly bears in Glacier National Park, Montana. Pages 147-156in M. R. Pelton, J. W. Lentfer, and G. E. Folk, Jr., eds. Bears - their biology and management. IUCN Publ. New Ser. 40.
MEALEY, S. P. 1975. The natural food habits of free-ranging grizzly bears in Yellowstone National Park, 1973-74. M.S. Thesis. Montana State Univ., Bozeman. 158pp.
MURIE, 0. J. 1954. Bear family: Ursidae. Pages 25-36 in A field guide to animal tracks. Houghton Mifflin Co., Boston. 374pp.
ODUM, E. P. 1971. Fundamentals of ecology. 3rd ed. W. B. Saunders Co., Philadelphia. 574pp.
RAUSCH, R. L. 1963. Geographic variation in size in North American brown bears, Ursus arctos L., as indicated by condylobasal length. Can. J. Zool. 41:33-45.
RUSSELL, R. H. 1971. Summer and autumn food habits of island and mainland populations of polar bears- a comparative study. M.S. Thesis. Univ. of Alberta, Ed- monton. 87pp.
SKINNER, M. P. 1925. Bears in the Yellowstone. A. C. McClurg and Co., Chicago. 158pp.
SPENCE, L. E., JR. 1963. Study of identifying characteristics of mammal hair. Wyoming Game and Fish Comm. Wildl. Dis. Res. Lab. 121pp.
STERMITZ, J. E., M. G. KLAGES, AND J. E. LOGAN. 1974. Soil characteristics influencing lodgepole pine regenera- tion near West Yellowstone, Montana. USDA For. Serv. Res. Pap. INT-163. 16pp.
STOKES, A. W. 1970. An ethologist's views on managing grizzly bears. BioScience 20(21):1154-1157.
SUMNER, J., AND J. J. CRAIGHEAD. 1973. Grizzly bear habitat survey in the Scapegoat Wilderness, Montana. Montana Coop. Wildl. Res. Unit, Mssoula. 49pp.
TISCH, E. L. 1961. Seasonal food habits of the black bear in the Whitefish Range of northwestern Montana. M.S. Thesis. Montana State Univ., Missoula. 108pp.
WASHINGTON, H. S. 1917. Chemical analysis of igneous rocks. U.S. Geol. Surv. Prof. Pap. 99. 1,201pp.