the nature and sources of competitive advantage the emergence of competitive advantage sustaining...
Post on 22-Dec-2015
282 views
TRANSCRIPT
The Nature and Sources of Competitive Advantage
The Nature and Sources of Competitive Advantage
• The emergence of competitive advantage• Sustaining competitive advantage• Competitive advantage in different market
settings• Types of competitive advantage: cost and
differentiation
OUTLINE

What is competitive advantage?
• The potential to earn a persistently high rate of profit
• Not the same as profitability– Long term investments may not show up in
short term profits• Investing in market share, technology, customer
loyalty or even executive perks
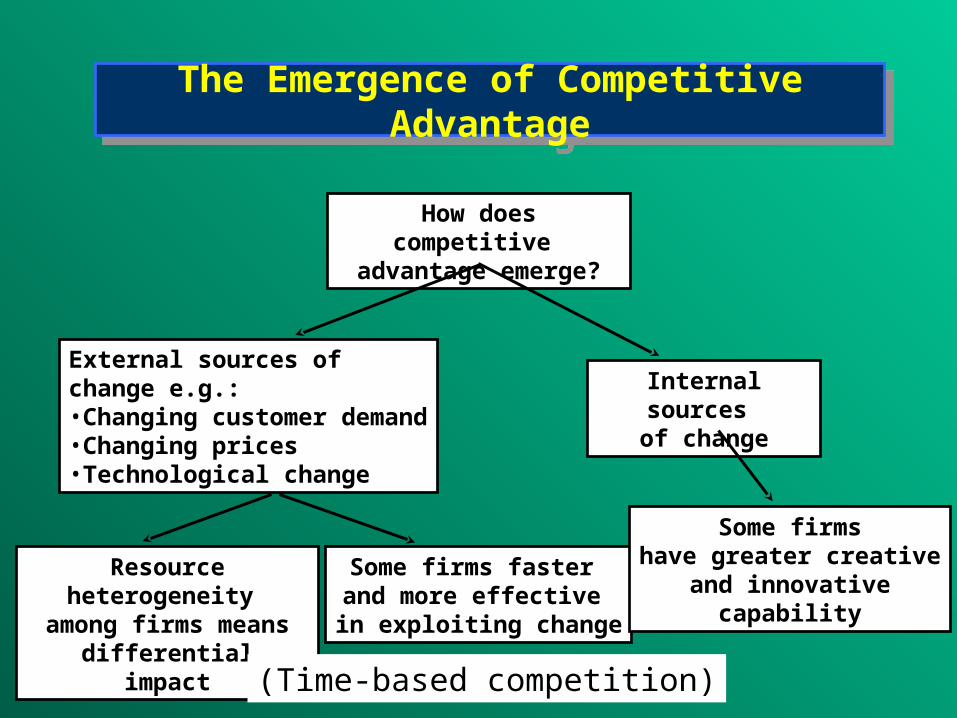
How does competitive advantage emerge?
External sources ofchange e.g.:•Changing customer demand•Changing prices•Technological change
Internal sources of change
Resource heterogeneity among firms means differential impact
Some firms faster and more effective
in exploiting change
Some firmshave greater creative
and innovativecapability
The Emergence of Competitive AdvantageThe Emergence of Competitive Advantage
(Time-based competition)
Competitive Advantage from Internally-Generated Change: Strategic Innovation
Competitive Advantage from Internally-Generated Change: Strategic Innovation
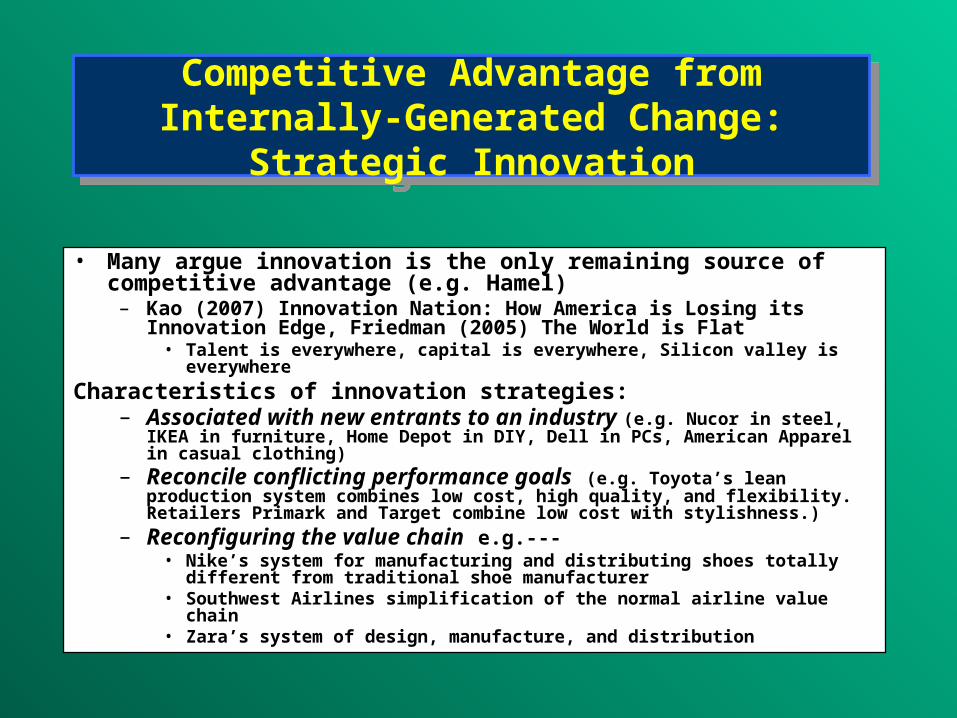
• Many argue innovation is the only remaining source of competitive advantage (e.g. Hamel)
– Kao (2007) Innovation Nation: How America is Losing its Innovation Edge, Friedman (2005) The World is Flat
• Talent is everywhere, capital is everywhere, Silicon valley is everywhere
Characteristics of innovation strategies:– Associated with new entrants to an industry (e.g. Nucor in steel,
IKEA in furniture, Home Depot in DIY, Dell in PCs, American Apparel in casual clothing)
– Reconcile conflicting performance goals (e.g. Toyota’s lean production system combines low cost, high quality, and flexibility. Retailers Primark and Target combine low cost with stylishness.)
– Reconfiguring the value chain e.g.---• Nike’s system for manufacturing and distributing shoes totally different from
traditional shoe manufacturer• Southwest Airlines simplification of the normal airline value chain• Zara’s system of design, manufacture, and distribution
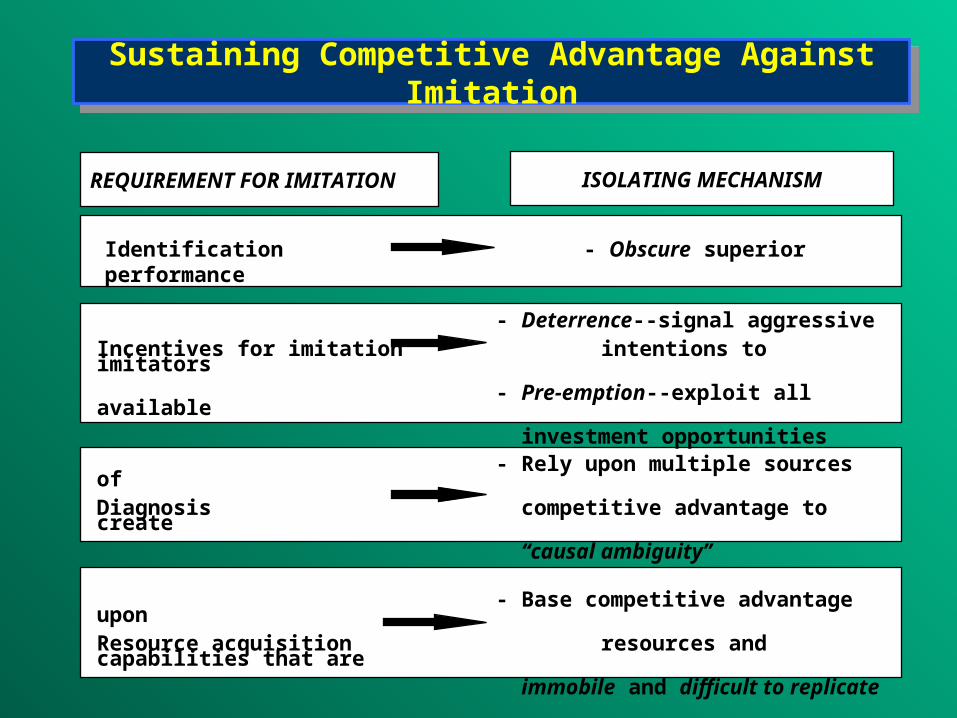
REQUIREMENT FOR IMITATION
Identification - Obscure superior performance
- Deterrence--signal aggressiveIncentives for imitation intentions to imitators
- Pre-emption--exploit all available investment opportunities
- Rely upon multiple sources of Diagnosis competitive advantage to create
“causal ambiguity”
- Base competitive advantage upon Resource acquisition resources and capabilities that are
immobile and difficult to replicate
ISOLATING MECHANISM
Sustaining Competitive Advantage Against ImitationSustaining Competitive Advantage Against Imitation
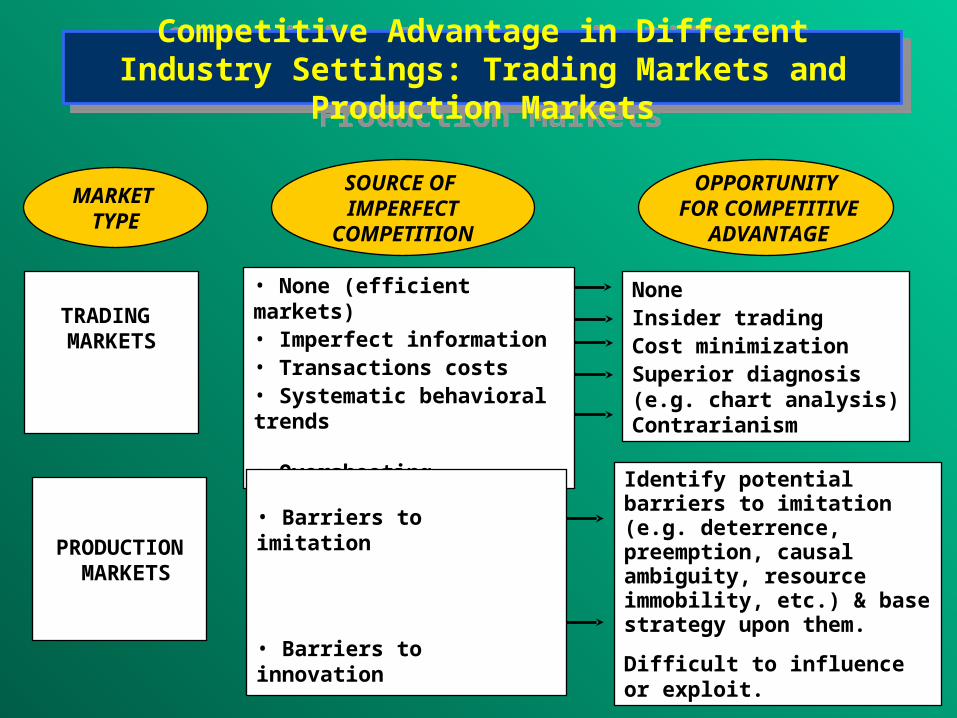
TRADING MARKETS
• None (efficient markets)• Imperfect information• Transactions costs• Systematic behavioral trends
• Overshooting
NoneInsider tradingCost minimizationSuperior diagnosis(e.g. chart analysis)Contrarianism
PRODUCTION MARKETS
• Barriers to imitation
• Barriers to innovation
Identify potential barriers to imitation (e.g. deterrence, preemption, causal ambiguity, resource immobility, etc.) & base strategy upon them.
Difficult to influence or exploit.
MARKET TYPE
SOURCE OF IMPERFECT
COMPETITION
OPPORTUNITY FOR COMPETITIVE
ADVANTAGE
Competitive Advantage in Different Industry Settings: Trading Markets and Production Markets
Competitive Advantage in Different Industry Settings: Trading Markets and Production Markets
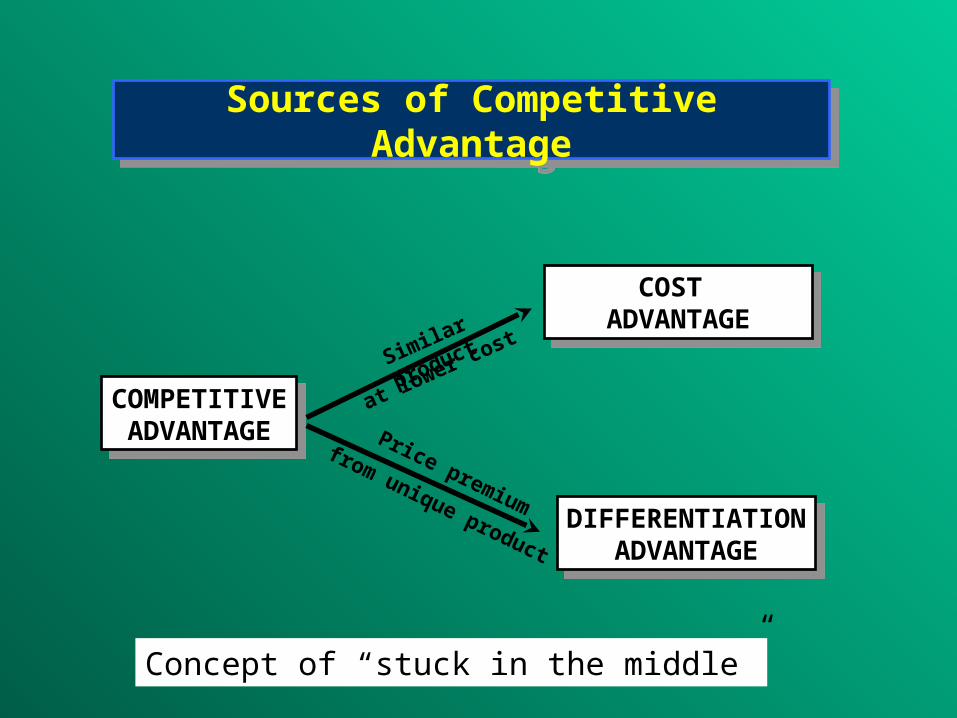
Sources of Competitive AdvantageSources of Competitive Advantage
COST ADVANTAGE
COST ADVANTAGE
DIFFERENTIATIONADVANTAGE
DIFFERENTIATIONADVANTAGE
COMPETITIVEADVANTAGE
COMPETITIVEADVANTAGE
Similar product
at lower cost
Price premium
from unique product
Concept of “stuck in the middle”
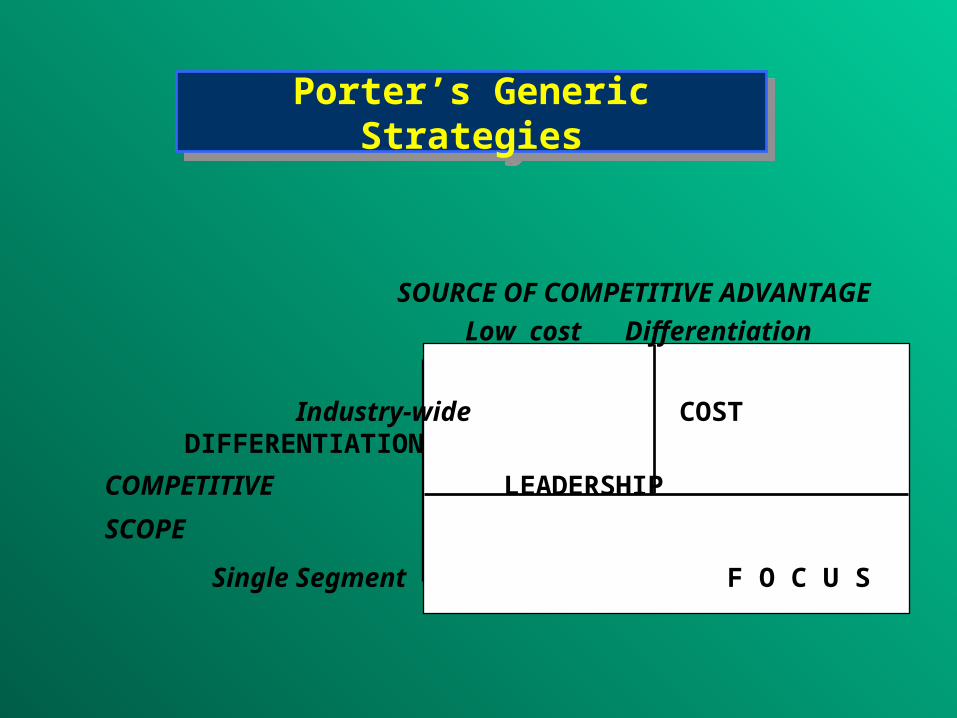
Porter’s Generic StrategiesPorter’s Generic Strategies
SOURCE OF COMPETITIVE ADVANTAGE
Low cost Differentiation
Industry-wide COST DIFFERENTIATION
COMPETITIVE LEADERSHIP
SCOPE
Single Segment F O C U S
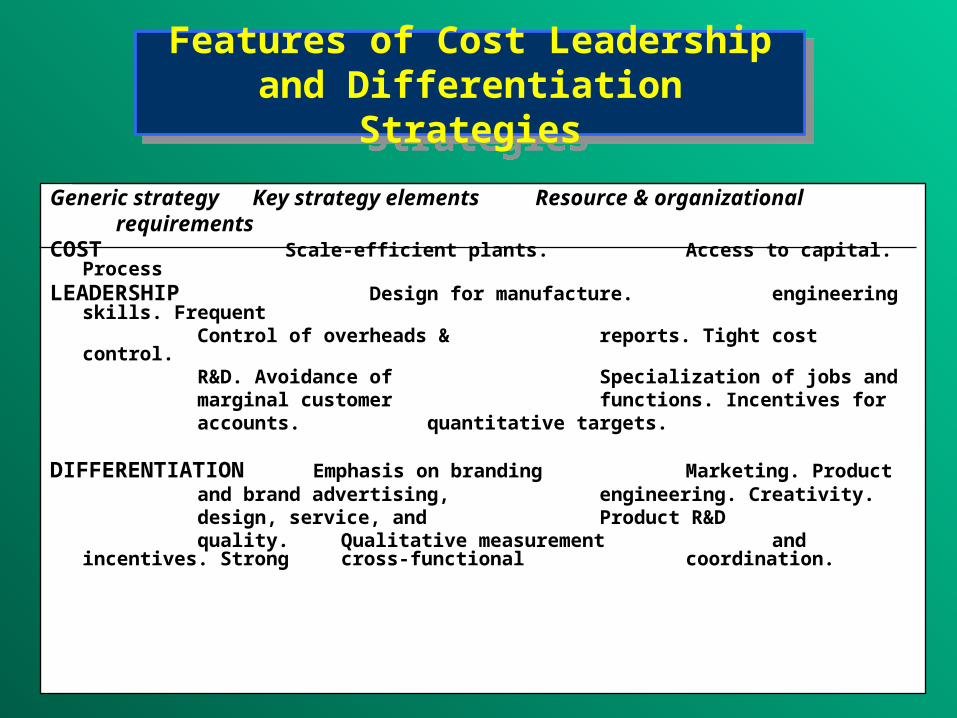
Features of Cost Leadership and Differentiation Strategies
Features of Cost Leadership and Differentiation Strategies
Generic strategy Key strategy elements Resource & organizational requirements
COST Scale-efficient plants. Access to capital. Process
LEADERSHIP Design for manufacture. engineering skills. Frequent
Control of overheads & reports. Tight cost control.
R&D. Avoidance of Specialization of jobs and
marginal customer functions. Incentives for accounts. quantitative targets.
DIFFERENTIATION Emphasis on branding Marketing. Product and brand advertising, engineering. Creativity. design, service, and Product R&D quality. Qualitative measurement
and incentives. Strong cross-functional
coordination.
Cost AdvantageCost Advantage
• Economies of experience curve and the benefits of market share
• Sources of cost advantage
• Using the value chain to analyze costs
• Current approaches to managing costs
OUTLINE
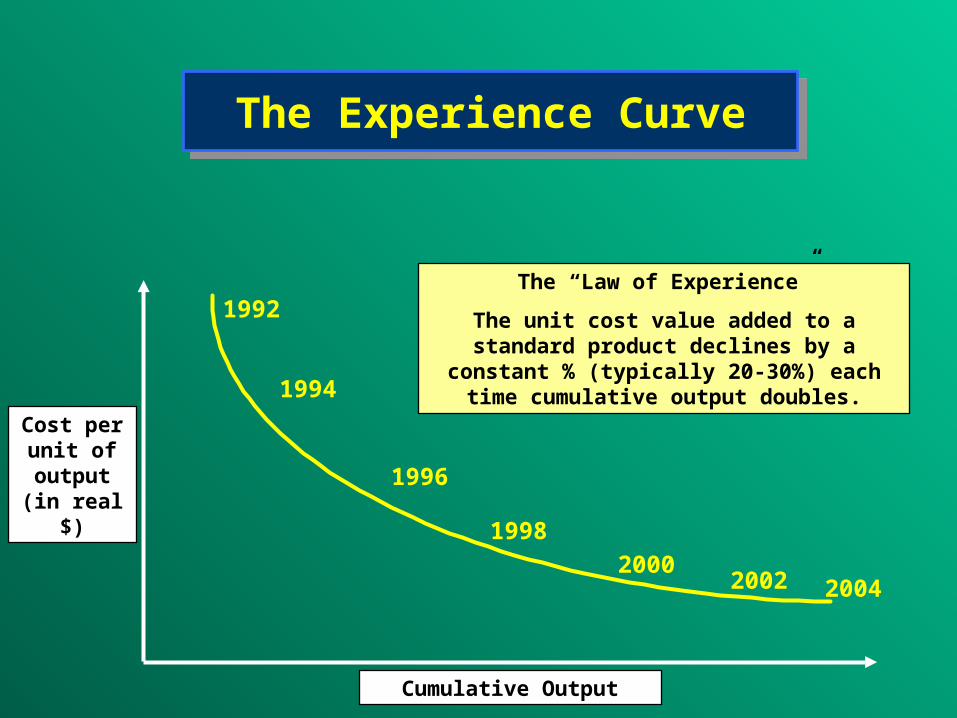
The Experience CurveThe Experience Curve
The “Law of Experience”
The unit cost value added to a standard product declines by a constant % (typically 20-
30%) each time cumulative output doubles.
Cost per unit of
output (in real $)
Cumulative Output
1992
1994
1996
1998
20002002 2004
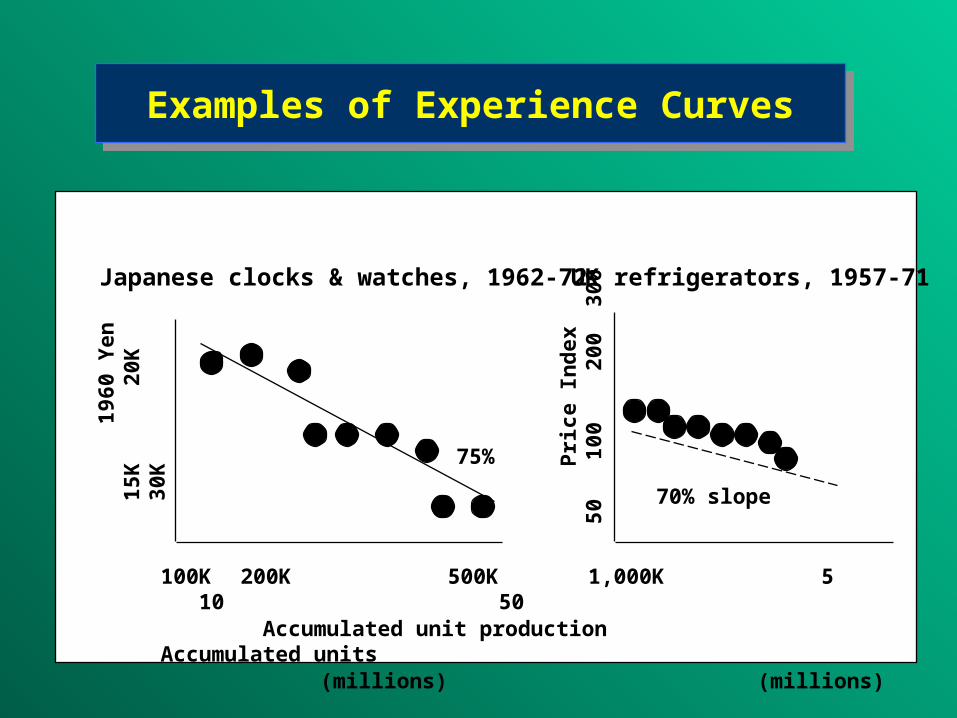
Examples of Experience CurvesExamples of Experience Curves
100K 200K 500K 1,000K 5 10 50 Accumulated unit production Accumulated units
(millions) (millions)
1960
Yen
15K
20K
30
K
Pri
ce In
dex
50
100
20
0 3
00
70% slope
75%
Japanese clocks & watches, 1962-72 UK refrigerators, 1957-71
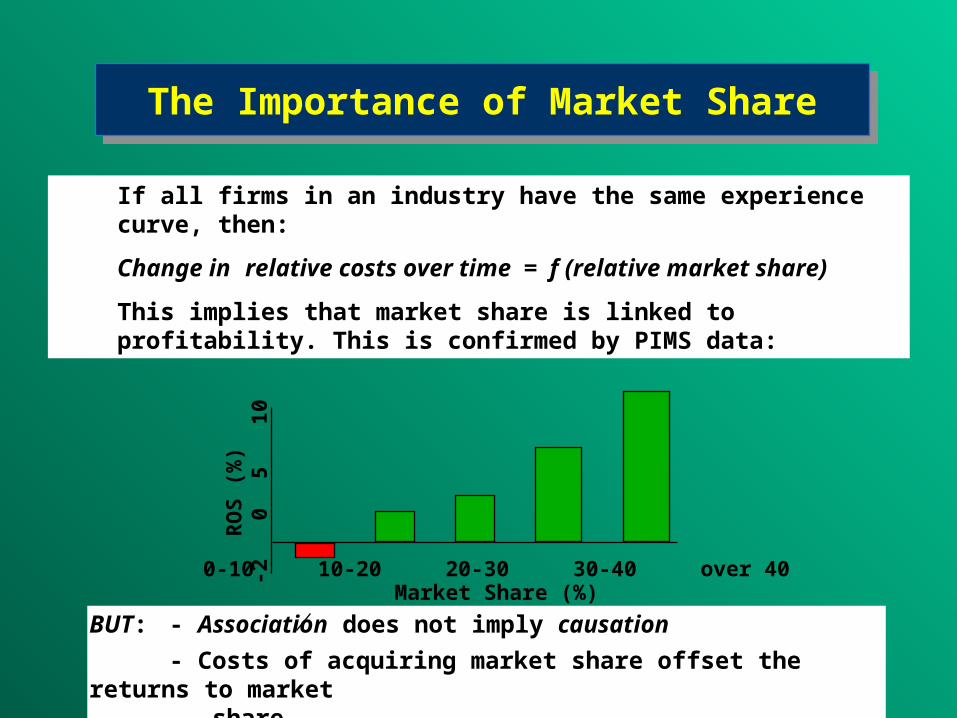
The Importance of Market ShareThe Importance of Market Share
If all firms in an industry have the same experience curve, then:
Change in relative costs over time = f (relative market share)
This implies that market share is linked to profitability. This is confirmed by PIMS data:
BUT: - Association does not imply causation
- Costs of acquiring market share offset the returns to market share
RO
S (
%)
-2
0 5
10
0-10 10-20 20-30 30-40 over 40Market Share (%)
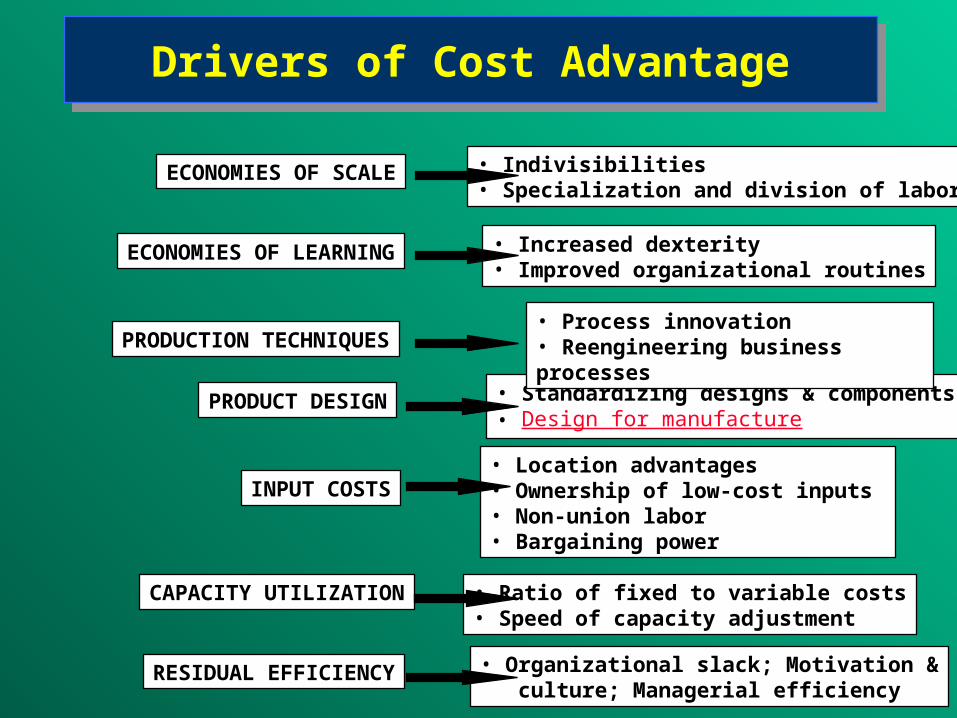
Drivers of Cost AdvantageDrivers of Cost Advantage
PRODUCTION TECHNIQUES
PRODUCT DESIGN
INPUT COSTS
CAPACITY UTILIZATION
RESIDUAL EFFICIENCY
ECONOMIES OF LEARNING
ECONOMIES OF SCALE
• Organizational slack; Motivation & culture; Managerial efficiency
• Ratio of fixed to variable costs• Speed of capacity adjustment
• Location advantages• Ownership of low-cost inputs • Non-union labor• Bargaining power
• Standardizing designs & components• Design for manufacture
• Process innovation• Reengineering business processes
• Increased dexterity• Improved organizational routines
• Indivisibilities• Specialization and division of labor
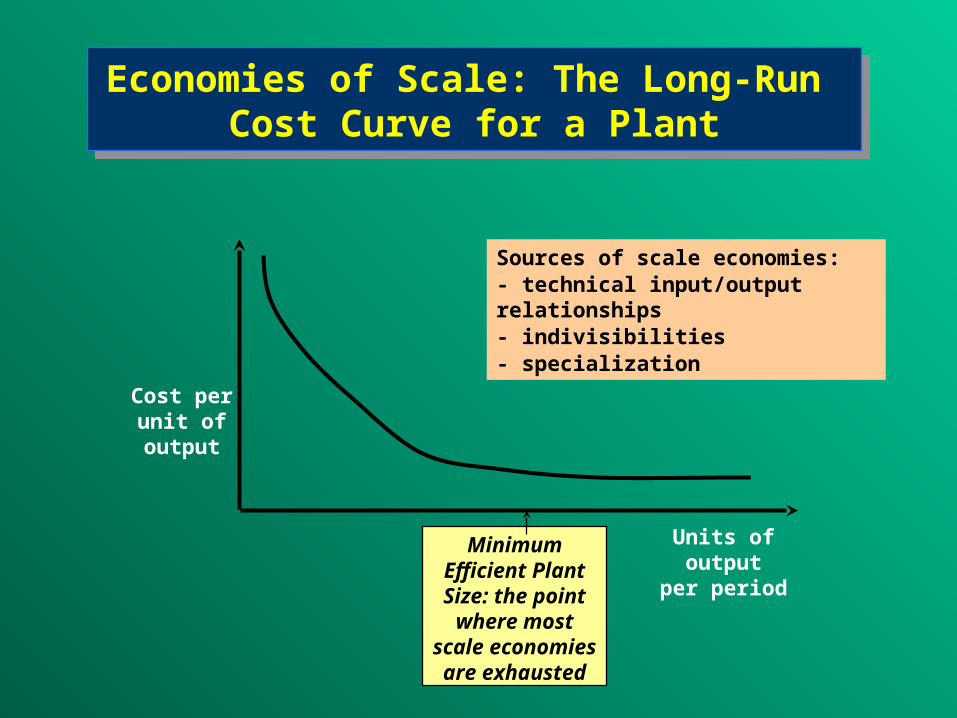
Economies of Scale: The Long-Run Cost Curve for a Plant
Economies of Scale: The Long-Run Cost Curve for a Plant
Units of outputper period
MinimumEfficient Plant Size: the point
where most scale economies
are exhausted
Cost perunit ofoutput
Sources of scale economies:- technical input/output relationships- indivisibilities- specialization
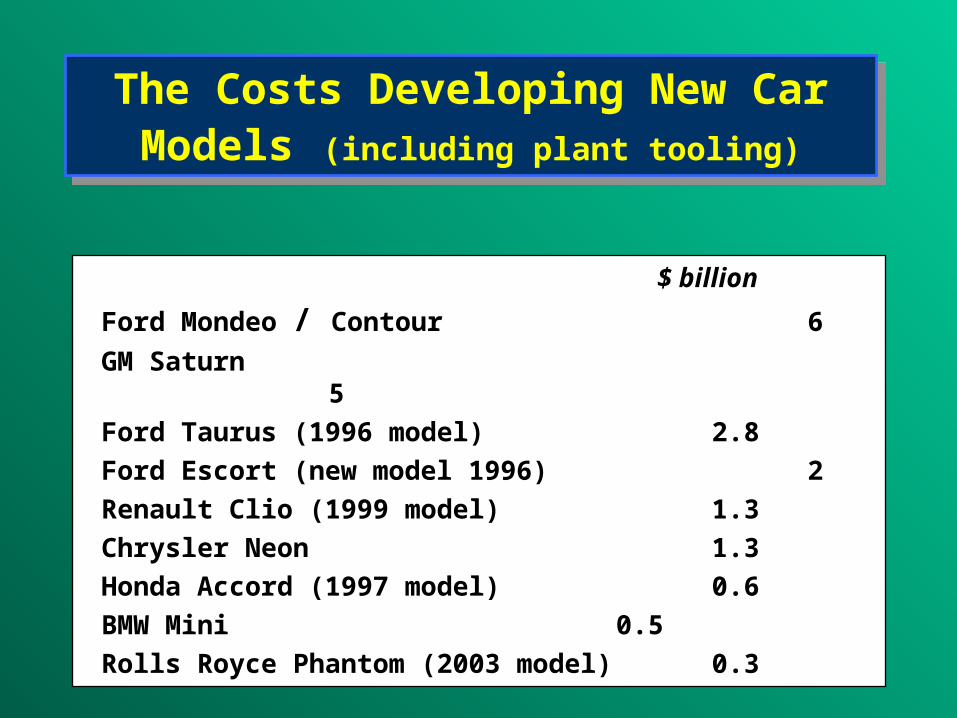
The Costs Developing New Car Models (including plant tooling)
The Costs Developing New Car Models (including plant tooling)
$ billion
Ford Mondeo / Contour 6
GM Saturn 5
Ford Taurus (1996 model) 2.8
Ford Escort (new model 1996) 2
Renault Clio (1999 model) 1.3
Chrysler Neon 1.3
Honda Accord (1997 model) 0.6
BMW Mini 0.5
Rolls Royce Phantom (2003 model) 0.3
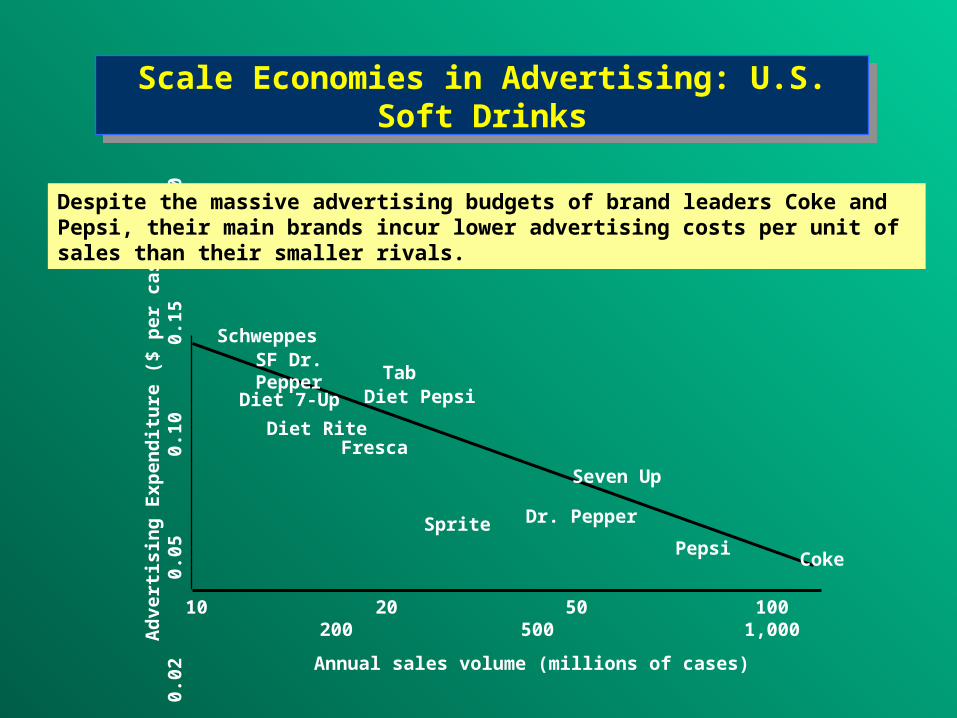
10 20 50 100 200 500 1,000
Annual sales volume (millions of cases)
Ad
vert
isin
g E
xpen
dit
ure
($
pe
r ca
se)
0.02
0
.05
0.
10
0.1
5
0.20
CokePepsi
Seven Up
Dr. PepperSprite
Diet PepsiTab
FrescaDiet Rite
Diet 7-Up
Schweppes SF Dr. Pepper
Despite the massive advertising budgets of brand leaders Coke and Pepsi, their main brands incur lower advertising costs per unit of sales than their smaller rivals.
Scale Economies in Advertising: U.S. Soft DrinksScale Economies in Advertising: U.S. Soft Drinks
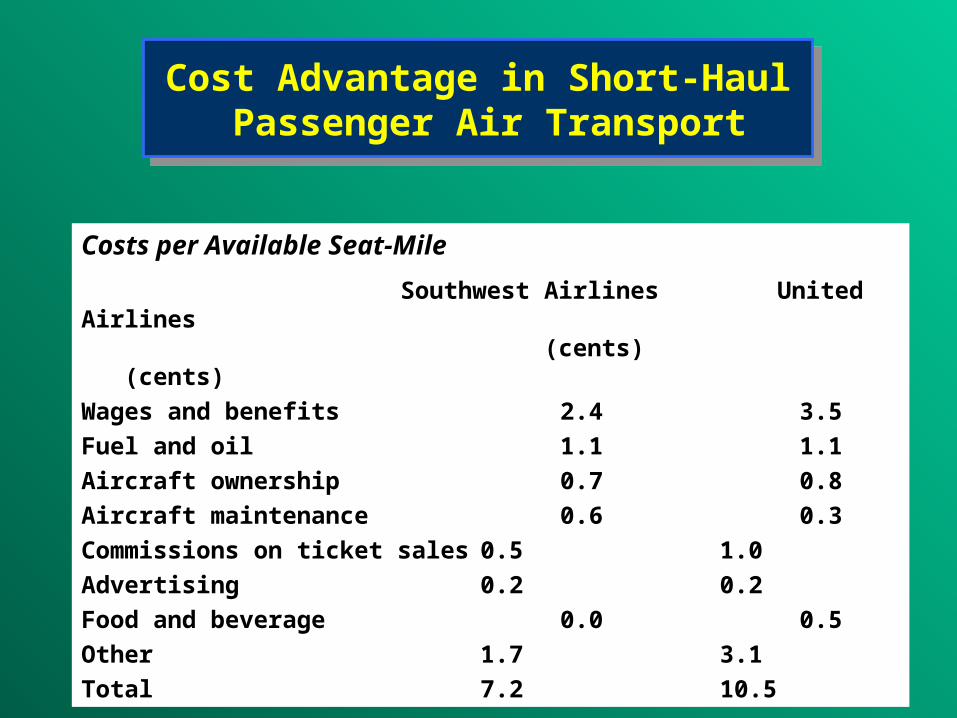
Cost Advantage in Short-Haul Passenger Air Transport
Cost Advantage in Short-Haul Passenger Air Transport
Costs per Available Seat-Mile
Southwest Airlines United Airlines (cents) (cents)
Wages and benefits 2.4 3.5
Fuel and oil 1.1 1.1
Aircraft ownership 0.7 0.8
Aircraft maintenance 0.6 0.3
Commissions on ticket sales 0.5 1.0
Advertising 0.2 0.2
Food and beverage 0.0 0.5
Other 1.7 3.1
Total 7.2 10.5
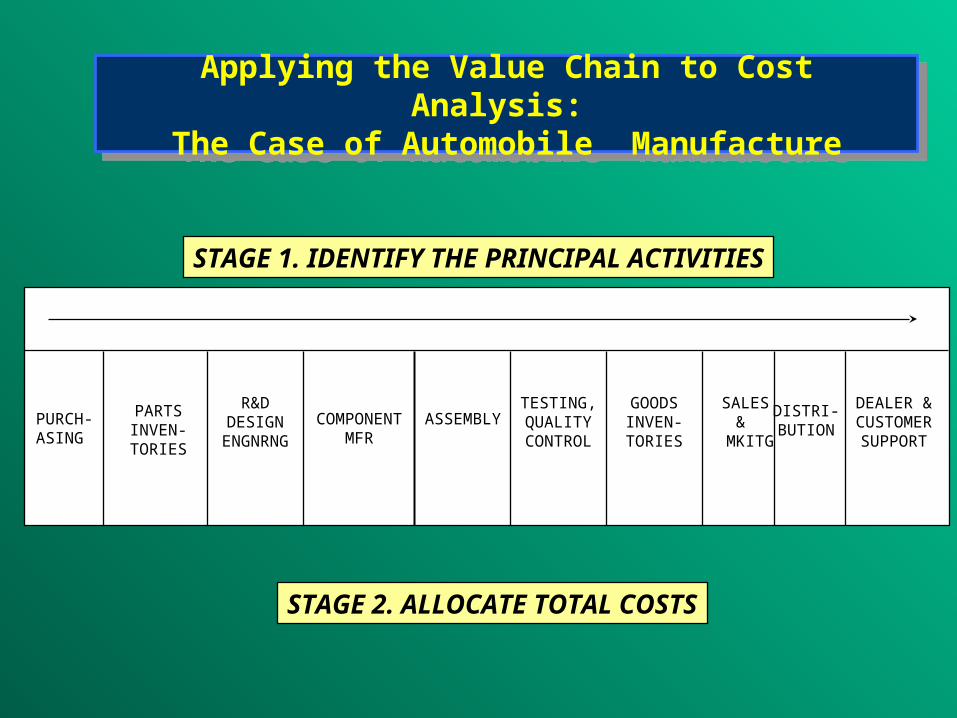
Applying the Value Chain to Cost Analysis: The Case of Automobile Manufacture
Applying the Value Chain to Cost Analysis: The Case of Automobile Manufacture
STAGE 1. IDENTIFY THE PRINCIPAL ACTIVITIES
STAGE 2. ALLOCATE TOTAL COSTS
PURCH-ASING
PARTSINVEN-TORIES
R&DDESIGN
ENGNRNG
COMPONENTMFR
ASSEMBLYTESTING,QUALITY
CONTROL
GOODSINVEN-TORIES
SALES &
MKITG
DISTRI-BUTION
DEALER &CUSTOMERSUPPORT
PURCH-ASING
PARTSINVEN-TORIES
R&DDESIGN
ENGNRNG
COMPONENTMFR
ASSEMBLYTESTING,QUALITY
CONTROL
GOODSINVEN-TORIES
SALES&
MKITG
DISTRI-BUTION
DEALER &CUSTOMERSUPPORT
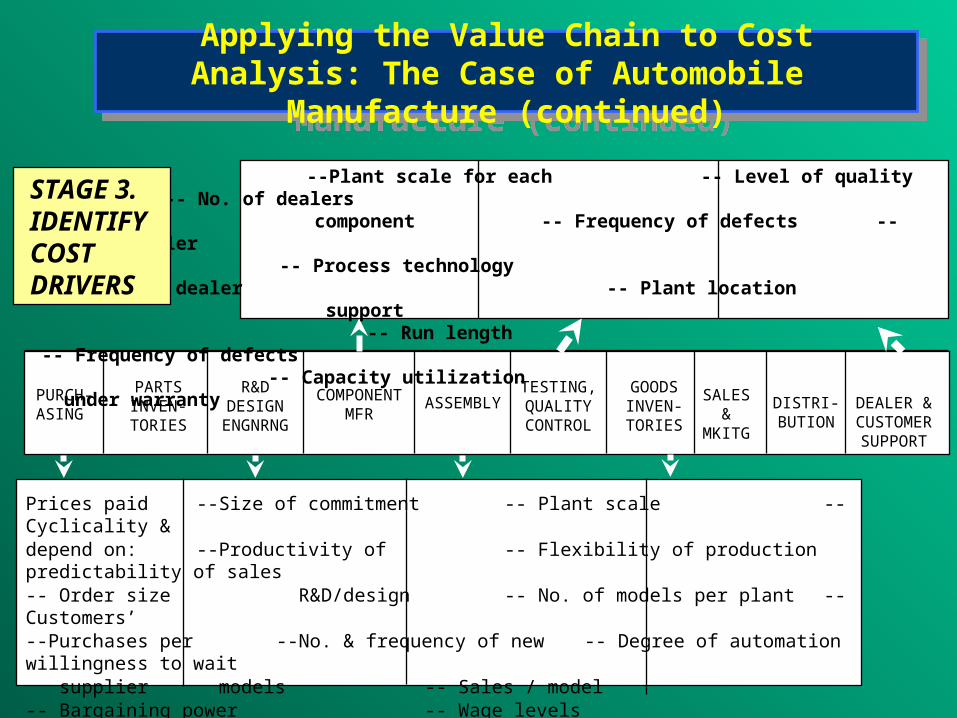
--Plant scale for each -- Level of quality targets -- No. of dealers component -- Frequency of defects -- Sales / dealer
-- Process technology -- Level of dealer -- Plant location support -- Run length -- Frequency of
defects -- Capacity utilization under warranty
Prices paid --Size of commitment -- Plant scale --Cyclicality &depend on: --Productivity of -- Flexibility of production predictability of sales-- Order size R&D/design -- No. of models per plant --Customers’--Purchases per --No. & frequency of new -- Degree of automation willingness to wait supplier models -- Sales / model -- Bargaining power -- Wage levels-- Supplier location -- Capacity utilization
STAGE 3. IDENTIFY COST DRIVERS
Applying the Value Chain to Cost Analysis: The Case of Automobile Manufacture (continued)
Applying the Value Chain to Cost Analysis: The Case of Automobile Manufacture (continued)
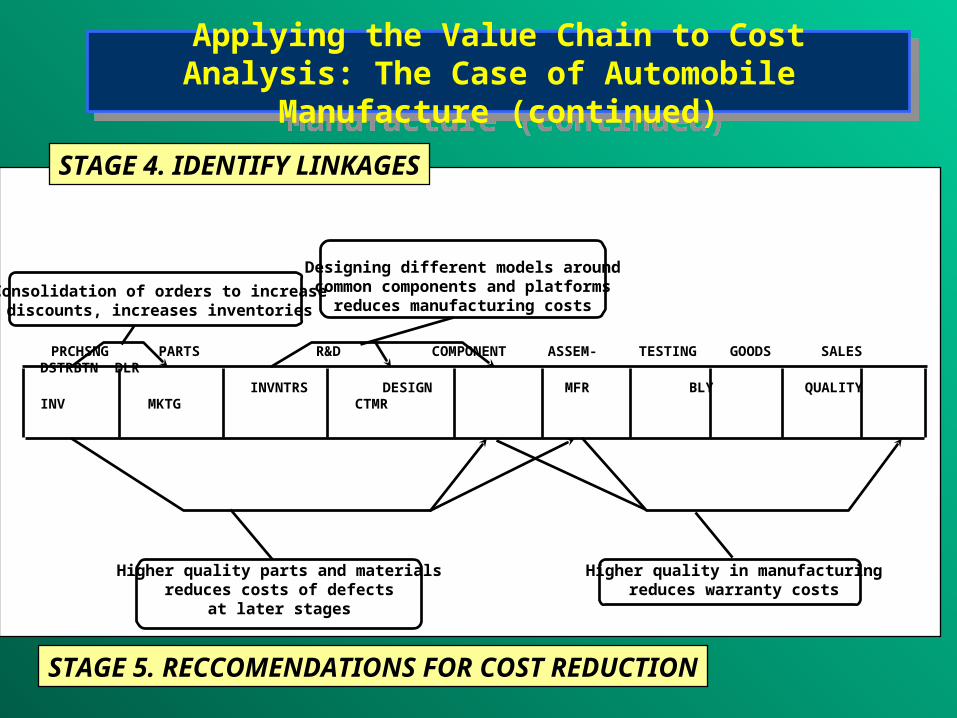
PRCHSNG PARTS R&D COMPONENT ASSEM- TESTING GOODS SALES DSTRBTN DLR
INVNTRS DESIGN MFR BLY QUALITY INV MKTG CTMR
Consolidation of orders to increasediscounts, increases inventories
Designing different models aroundcommon components and platforms
reduces manufacturing costs
Higher quality parts and materialsreduces costs of defects
at later stages
Higher quality in manufacturingreduces warranty costs
STAGE 5. RECCOMENDATIONS FOR COST REDUCTION
STAGE 4. IDENTIFY LINKAGES
Applying the Value Chain to Cost Analysis: The Case of Automobile Manufacture (continued)
Applying the Value Chain to Cost Analysis: The Case of Automobile Manufacture (continued)
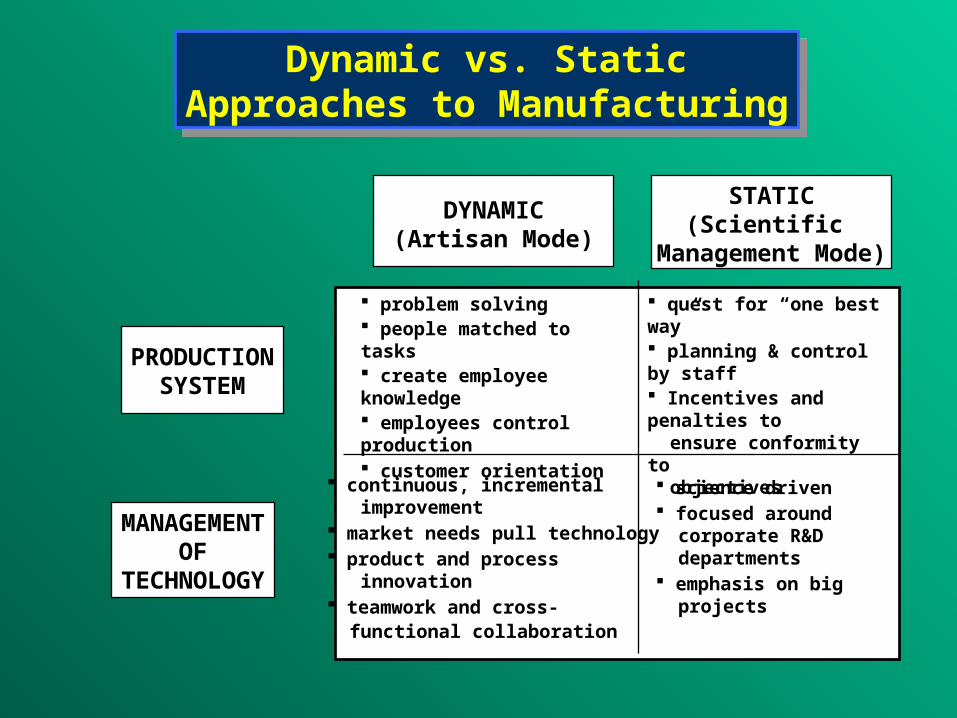
Dynamic vs. Static Approaches to Manufacturing
Dynamic vs. Static Approaches to Manufacturing
PRODUCTIONSYSTEM
MANAGEMENTOF
TECHNOLOGY
DYNAMIC(Artisan Mode)
STATIC(Scientific
Management Mode)
problem solving people matched to tasks create employee knowledge employees control production customer orientation
quest for “one best way” planning & control by staff Incentives and penalties to ensure conformity to objectives
science driven focused around corporate R&D departments emphasis on big projects
continuous, incremental improvement market needs pull technology product and process innovation teamwork and cross- functional collaboration
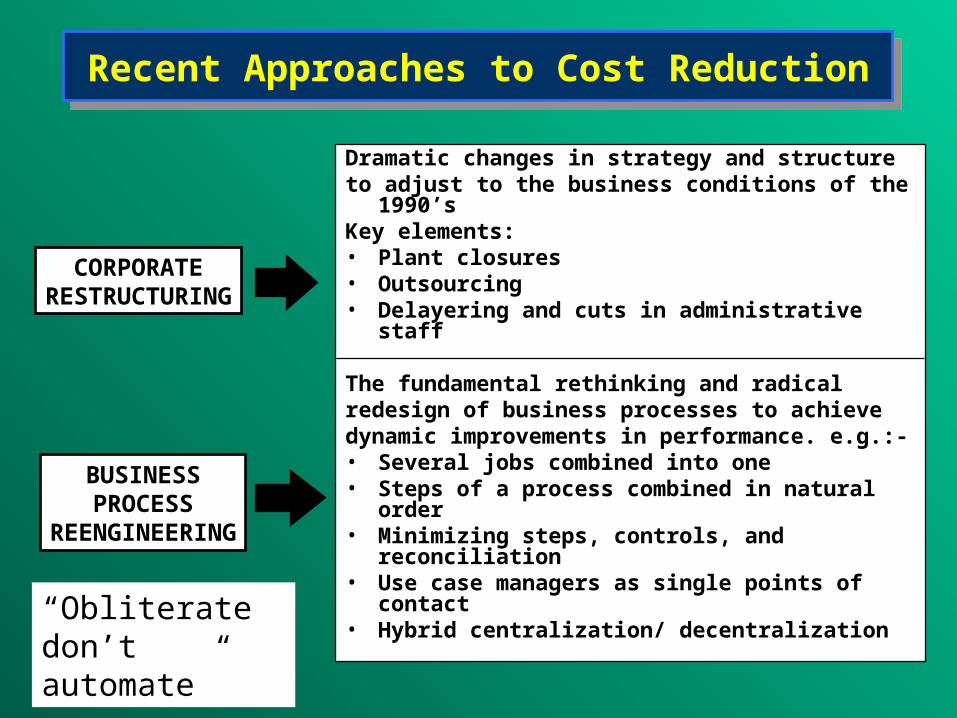
Recent Approaches to Cost ReductionRecent Approaches to Cost Reduction
Dramatic changes in strategy and structureto adjust to the business conditions of the 1990’sKey elements:• Plant closures• Outsourcing• Delayering and cuts in administrative staff
The fundamental rethinking and radicalredesign of business processes to achievedynamic improvements in performance. e.g.:-• Several jobs combined into one • Steps of a process combined in natural order• Minimizing steps, controls, and reconciliation• Use case managers as single points of contact• Hybrid centralization/ decentralization
CORPORATERESTRUCTURING
BUSINESSPROCESS
REENGINEERING
“Obliterate don’t automate”
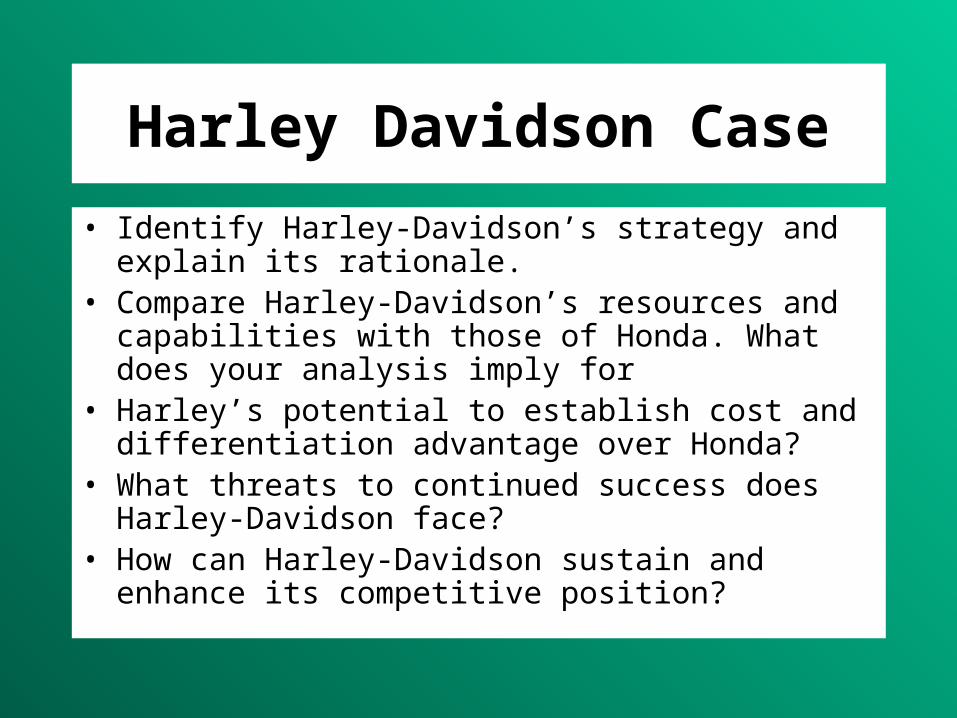
Harley Davidson Case
• Identify Harley-Davidson’s strategy and explain its rationale.
• Compare Harley-Davidson’s resources and capabilities with those of Honda. What does your analysis imply for
• Harley’s potential to establish cost and differentiation advantage over Honda?
• What threats to continued success does Harley-Davidson face?
• How can Harley-Davidson sustain and enhance its competitive position?