the nature of asteroid itokawa revealed by hayabusa
TRANSCRIPT

Near Earth Objects, our Celestial Neighbors: Opportunity and RiskProceedings IAU Symposium No. 236, 2006A. Milani, G.B. Valsecchi & D. Vokrouhlicky, eds.
c© 2007 International Astronomical Uniondoi:10.1017/S174392130700350X
The nature of asteroid Itokawa revealedby Hayabusa
M. Yoshikawa, A. Fujiwara, J. Kawaguchiand
Hayabusa Mission & Science TeamJAXA, 3-1-1 Yoshinodai, Sagamihara, Kanagawa, 229-8510, Japan,
email: [email protected]
Abstract. The spacecraft Hayabusa, which was launched in 2003, arrived at its destination,asteroid (25143) Itokawa in September 2005. The appearance of Itokawa, a small S-type nearEarth asteroids, was totally unexpected. The surface is covered with a lot of boulders and thereare only a few craters on it. It looks like a contact binary asteroid. The surface compositionis quite similar to LL-chondrite. The estimated density is 1.9 ± 0.13 (g/cm3), so the macro-porosity is about 40%. This means that Itokawa is a rubble pile object. In Itokawa, we maysee such things that are very close to building blocks of asteroids. In this paper, we review themission and the first scientific results.
Keywords. space missions; rendezvous; asteroid surface; asteroid landing; sample return; in-strumentation; mass determination
1. IntroductionHayabusa mission, which was originally called MUSES-C mission, is the asteroid sam-
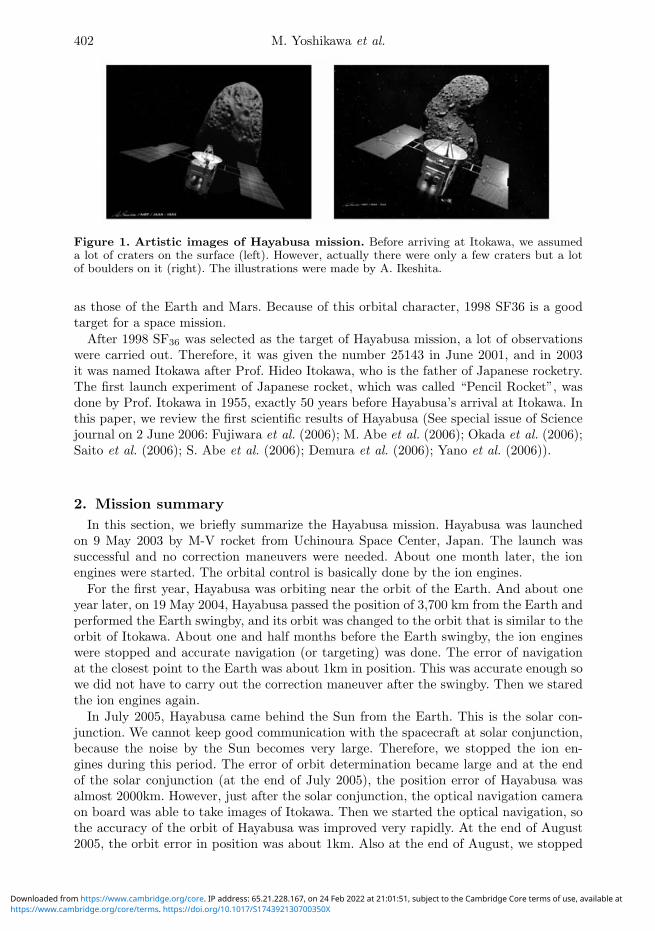
ple return mission of Japan (The literal meaning of Hayabusa is “falcon.”). The space-craft was launched in May 2003, and it arrived at its target asteroid, (25143) Itokawa, inSeptember 2005. Before the arrival, it was already known by ground-based observationthat the size of Itokawa is rather small, about 500 m in length. This is correct. WhatHayabusa saw was certainly a very tiny object as expected. However the appearance ofits surface was completely unexpected. There are only a few craters on its surface butit is covered with a lot of boulders. Figure 1 shows the artistic images of Hayabusa mis-sion before and after arriving at the asteroid. As this figure shows, the concept of smallasteroid has been largely changed by Hayabusa mission.
Hayabusa stayed around Itokawa for about three months. In the first two months,Hayabusa carried out detailed scientific observations. And in the third month, November2005, it tried to approach closely to Itokawa several times and to touch down twice.Although the sampling sequence was not executed as planed, Hayabusa became the firstspacecraft that lifted off from a solar system bodies except the Earth and the Moon. Afterthe second touchdown, some troubles occurred in the spacecraft and the communicationwas lost for about one and half months. Fortunately, the communication was recoveredat the end of January 2006, and since then daily operations are going on. But the Eartharrival date has been delayed and now Hayabusa is planed to come back to the Earth inJune 2010.
The asteroid Itokawa was known as 1998 SF36, discovered by LINEAR (Lincoln Near-Earth Asteroid Research) team. The perihelion distance is 0.95 AU and the apheliondistance is 1.70 AU, so it is an Apollo-type NEO (Near Earth Object). The orbitalinclination is about 1.7 degrees, so the orbital plane of 1998 SF36 is almost the same
401
https://www.cambridge.org/core/terms. https://doi.org/10.1017/S174392130700350XDownloaded from https://www.cambridge.org/core. IP address: 65.21.228.167, on 24 Feb 2022 at 21:01:51, subject to the Cambridge Core terms of use, available at
402 M. Yoshikawa et al.
Figure 1. Artistic images of Hayabusa mission. Before arriving at Itokawa, we assumeda lot of craters on the surface (left). However, actually there were only a few craters but a lotof boulders on it (right). The illustrations were made by A. Ikeshita.
as those of the Earth and Mars. Because of this orbital character, 1998 SF36 is a goodtarget for a space mission.
After 1998 SF36 was selected as the target of Hayabusa mission, a lot of observationswere carried out. Therefore, it was given the number 25143 in June 2001, and in 2003it was named Itokawa after Prof. Hideo Itokawa, who is the father of Japanese rocketry.The first launch experiment of Japanese rocket, which was called “Pencil Rocket”, wasdone by Prof. Itokawa in 1955, exactly 50 years before Hayabusa’s arrival at Itokawa. Inthis paper, we review the first scientific results of Hayabusa (See special issue of Sciencejournal on 2 June 2006: Fujiwara et al. (2006); M. Abe et al. (2006); Okada et al. (2006);Saito et al. (2006); S. Abe et al. (2006); Demura et al. (2006); Yano et al. (2006)).
2. Mission summaryIn this section, we briefly summarize the Hayabusa mission. Hayabusa was launched
on 9 May 2003 by M-V rocket from Uchinoura Space Center, Japan. The launch wassuccessful and no correction maneuvers were needed. About one month later, the ionengines were started. The orbital control is basically done by the ion engines.
For the first year, Hayabusa was orbiting near the orbit of the Earth. And about oneyear later, on 19 May 2004, Hayabusa passed the position of 3,700 km from the Earth andperformed the Earth swingby, and its orbit was changed to the orbit that is similar to theorbit of Itokawa. About one and half months before the Earth swingby, the ion engineswere stopped and accurate navigation (or targeting) was done. The error of navigationat the closest point to the Earth was about 1km in position. This was accurate enough sowe did not have to carry out the correction maneuver after the swingby. Then we staredthe ion engines again.
In July 2005, Hayabusa came behind the Sun from the Earth. This is the solar con-junction. We cannot keep good communication with the spacecraft at solar conjunction,because the noise by the Sun becomes very large. Therefore, we stopped the ion en-gines during this period. The error of orbit determination became large and at the endof the solar conjunction (at the end of July 2005), the position error of Hayabusa wasalmost 2000km. However, just after the solar conjunction, the optical navigation cameraon board was able to take images of Itokawa. Then we started the optical navigation, sothe accuracy of the orbit of Hayabusa was improved very rapidly. At the end of August2005, the orbit error in position was about 1km. Also at the end of August, we stopped
https://www.cambridge.org/core/terms. https://doi.org/10.1017/S174392130700350XDownloaded from https://www.cambridge.org/core. IP address: 65.21.228.167, on 24 Feb 2022 at 21:01:51, subject to the Cambridge Core terms of use, available at

Nature of Itokawa 403
the operation of ion engines. The ion engines fulfilled their duty. In Figure 2, the orbithistory up to the arrival is summarized schematically.
Figure 2. Orbit history from the launch to the asteroid arrival. IES means the periods whenthe ion engines were operated.
The approach phase was started from the end of August 2005. The distance fromItokawa became smaller and smaller everyday, and the image of Itokawa became largerand larger. We stopped the motion of Hayabusa relative to Itokawa for the first time on12 September 2005, so we say that the arrival date is 12 September 2005. The arrivalpoint of Hayabusa was about 20 km away from the surface of Itokawa. We call thisposition as “Gate position.”
At first, Hayabusa was moving around this gate position, and gradually it went downtoward the asteroid. At the end of September 2005, Hayabusa arrived at the position ofabout 7 km from the asteroid. We call this position as “Home position.” Hayabusa didnot revolve around the asteroid, but it moved along the line that connects the Earthand the asteroid. In October 2005, Hayabusa was located around the Home positionand made some “tour” to observe Itokawa from various angles. At the end of October,Hayabusa approached to less than 4 km from the surface of Itokawa. The orbital operationis schematically summarized in Figure 3. The actual orbit and the orbital operation indetail are shown in Figure 4.
By the end of October, we almost finished the basic observations of Itokawa. We hadinformation about the surface of Itokawa and we constructed the shape model of Itokawa.Moreover, we have selected the candidate places for touchdown. Thus, we were ready fortouchdown.
In November 2005, Hayabusa tried the touchdown. The first touchdown rehearsal wasexecuted on November 4, 2005. In this first descent to Itokawa, we encountered severalproblems that we did not expect, so we carried out two more descent operations onNovember 9 and 12. Then we had confidence to carry out touchdown, and the firsttouchdown was executed on November 20. In this first touchdown, totally unexpectedthings happened again. We learned later that Hayabusa stayed on the surface of Itokawamore than 30 minutes. However, the sampling sequence was not performed in this firsttouchdown, so we tried a second touchdown on November 26. All of these descent andtouchdown operations are summarized in Table 1.
https://www.cambridge.org/core/terms. https://doi.org/10.1017/S174392130700350XDownloaded from https://www.cambridge.org/core. IP address: 65.21.228.167, on 24 Feb 2022 at 21:01:51, subject to the Cambridge Core terms of use, available at

404 M. Yoshikawa et al.
Table 1. Descent and Touchdown Operations
Operation Date Comments
Rehearsal #1 Nov. 4, 2005Nav & Guidance Practice Nov. 9, 2005 Target Marker Release #1 (rehearsal)Rehearsal #2 Nov. 12, 2005 MINERVA Lander ReleaseTouchdown #1 Nov. 20, 2005 Target Marker Release #2
Two Touchdowns + One LandingTouchdown #2 Nov. 26, 2005 One Touchdown
Figure 3. Schematic figure of Hayabusa operation near Itokawa.
The mission sequence was perfect in the second touchdown, so all of us thought thatHayabusa was successful in getting the surface material. However, after the liftoff fromItokawa, a fuel leak occurred. We were forced to operate Hayabusa in a very difficultstatus and we were not able to confirm that the bullet for collecting samples was firedat the moment of the second touchdown. Anyway, at present (November 2006) we areoperating Hayabusa, and we think we can make it return to the Earth in June 2010,which is three years behind the schedule. We hope that some of the surface materials areinside the capsule of Hayabusa.
This is the short history of Hayabusa mission. We have learned a lot of engineeringmatters as well as we have discovered many scientifically new things. In the followingsessions, we review the scientific results.
3. Features of Itokawa3.1. Science instruments
Hayabusa has four science instruments, AMICA, NIRS, XRS, and LIDAR. They areshown in Figure 5.
The Asteroid Multi-band Imaging Camera (AMICA) is also called the telescopic opticalnavigation camera (ONC-T), and it is used both for navigation and scientific observations.AMICA has both a wide band-pass filter and seven narrow band filters, the centralwavelengths of which are nearly equivalent to those of the Eight Color Asteroid Survey
https://www.cambridge.org/core/terms. https://doi.org/10.1017/S174392130700350XDownloaded from https://www.cambridge.org/core. IP address: 65.21.228.167, on 24 Feb 2022 at 21:01:51, subject to the Cambridge Core terms of use, available at

Nature of Itokawa 405
Figure 4. The orbit of Hayabusa near Itokawa. The left figure shows the actual orbit ofHayabusa near Itokawa. The Earth is located in the +Z direction. The numbers in the figureare month/date in 2005. The right figure shows the path of what we call “tour.” The spacecraftundertook a tour near the asteroid after achieving the home position observation. The view isfrom the Sun. Arrows indicate the sequential path of the spacecraft. Dots show the hoveringsites. Each spacecraft position indicated by the number in the figure corresponds to the datesas follows: (1) 8 to 10 October, westward, high phase angle; (2) 12 and 13 October, zero solarphase angle; (3) 15 October, east side high, phase-angle; (4) 17 and 18 October, south pole; (5)20 October, south pole, low altitude (∼4 km); (6) 22 October, north pole, low altitude (∼4 km);(7) 23 and 24 October, north pole; (8) 27 and 28 October, low altitude observation (∼3 km).Dashed lines include low-altitude observation.
(ECAS) system as follows: 380 (ul), 430 (b), 550 (v), 700 (w), 860 (x), 960 (p), and 1010nm (zs). AMICA imaged the entire surface of Itokawa with a solar phase angle of ∼10degrees at the home position. Because the angular resolution is 0.0057 deg / pixel (99.3micro-rad/pixel), the nominal spatial resolution is 70 cm/pixel at the home position.Four position-angle glass polarizers were mounted on an edge of the 1024 pixel by 1024pixel CCD chip.
The Near-Infrared Spectrometer (NIRS) has a 64-channel InGaAs photodiode arraydetector and a grism (a diffraction grating combined with a prism). The dispersion perpixel is 23.6 nm. Spectra were collected from 0.76 to 2.1 mm. The NIRS field of view(0.1deg × 0.1deg) was aligned with the fields of view of LIDAR and AMICA.
The X-ray Fluorescence Spectrometer (XRS) is an advanced type spectrometer witha light-weighted (1.5 kg) sensor unit based on a CCD X-ray detector. This is the firsttime a CCD has been used for such a purpose on a planetary mission. The CCD has anenergy resolution of 160 eV at 5.9 keV when cooled, which is much higher than that of theproportional counters used in previous planetary missions. In addition, the XRS has astandard sample plate (SSP) for concurrently calibrating the X-ray fluorescence when it isexcited by the Sun. The SSP is a glassy plate whose composition is intermediate betweenthose of chondrites and basalts. By comparing X-ray spectra from the asteroid and fromthe SSP, quantitative elemental analysis can be achieved, although the intensities andspectral profiles of solar X-rays change over time.
The Light Detection and Ranging Instrument (LIDAR) measures distance by deter-mining the time of flight for laser light to travel from the spacecraft to the asteroidand return. The LIDAR averages the topography within the LIDAR footprint on thesurface of the asteroid, which approximates 5 by 12 m at a 7-km altitude for normal
https://www.cambridge.org/core/terms. https://doi.org/10.1017/S174392130700350XDownloaded from https://www.cambridge.org/core. IP address: 65.21.228.167, on 24 Feb 2022 at 21:01:51, subject to the Cambridge Core terms of use, available at

406 M. Yoshikawa et al.
Figure 5. Science Instruments of Hayabusa and their fields of view. Left image shows thecomparison of the field of view of each instrument.
incidence. The accuracy of LIDAR ranging obtained from ground calibration was 1 mfrom a distance of 50 m and 10 m from 50 km.
3.2. Basic parameters of ItokawaThere are a lot of ground based observations of Itokawa, so we knew several characteris-tics of Itokawa before Hayabusa arrived at Itokawa. For example, the rotational periodof Itokawa is 12.1324 hours, the spin axis is almost perpendicular to the ecliptic andretrograde, and its shape is elongated, about 0.5 km long. By Hayabusa, the length ofthe principal axes were determined as X=535 m, Y=294 m, Z=209 m. The orientationof the spin axis in the ecliptic coordinate is [β,λ]=[128.5, -89.66], and the nutation wasnot detected.
Other important parameters are the mass, volume, and density. These were estimatedas follows: mass = (3.51±0.105) × 1010 kg, volume = (1.84±|,0.092) × 107 m3, density= 1.90±0.13 g/cm3. We will discuss about the mass estimation in section 3.5.
3.3. Surface features of ItokawaAs already mentioned, the most distinctive feature of Itokawa is the large number ofboulders. Most of its surface is covered by many small and large boulders. Figure 6shows the images of Itokawa taken from four directions. We can see some smooth areas,but such regions occupy only a small fraction in the total surface. Thus, the surfaceof Itokawa is clearly divided into two parts; one is rough terrains, that is boulder richregion, and the other is smooth terrains. There are several large boulders, and one ofthem is shown in Figure 7, which is the enlargement of the region marked in Figure 6.The sharply sticking boulder in this image is what we call “Pencil Boulder.” Anotherlarge boulder is seen at the right side of Itokawa in the lower images of Figure 6. Actuallythis is the largest boulder on Itokawa and we call it “Yoshinodai Boulder.”
Some parts of the surface of Itokawa seem to be polygonal planes (one of the examplesis indicated by an arrow in Figure 6). We call such planes as “facet.” We think that facetswere created by collisions or they are parts of the original surface of the parent body.Facets may be the part of basic building blocks of the asteroid.
https://www.cambridge.org/core/terms. https://doi.org/10.1017/S174392130700350XDownloaded from https://www.cambridge.org/core. IP address: 65.21.228.167, on 24 Feb 2022 at 21:01:51, subject to the Cambridge Core terms of use, available at

Nature of Itokawa 407
Figure 6. Images of Itokawa. The arrow in upper right figure shows facet. The regionmarked in lower left figure is shown in detail in Figure 8.
Figure 7. A part of Itokawa marked in Figure 6. The very sharp boulder in the lower leftcorner is called “Pencil boulder” by the mission team.
At first sight, we do not notice craters, but crates actually exist. Figure 8 shows someof the examples of craters. They are very small and maybe they were formed by impactsof small meteorites. Moreover, we found much smaller features, which might be createdby impacts of small meteorites.
In Figure 9, we show two close-up views of the surface of Itokawa. One is the close-upview of one of the smooth terrains, “MUSES-Sea” (IAU officially approved name for this
https://www.cambridge.org/core/terms. https://doi.org/10.1017/S174392130700350XDownloaded from https://www.cambridge.org/core. IP address: 65.21.228.167, on 24 Feb 2022 at 21:01:51, subject to the Cambridge Core terms of use, available at

408 M. Yoshikawa et al.
Figure 8. Some of the craters on the Itokawa. Mission team call each crater as follows ; A: Komaba crater (D=27m), B : Kamisunagawa crater (D=10m), C : Fuchinobe crater (D=36m).
Figure 9. Images of surface close up. Images A, B, C, and D are the sequential images,and each image shows the region within the rectangular section in the previous image. The finalimage D shows the region where touchdown was performed. Image E is the boundary regionbetween rough and smooth terrains.
region is “MUSES-C”). In this region, the touchdown of Hayabusa was performed. Thefinal image, whose spatial resolution is 6-8 mm, shows that this area is covered by cm-sizedgravel and it looks like pavement. Another close-up image in Figure 9 is the boundarybetween smooth terrain and rough terrain, which is the border of “MUSES-Sea.” Theresolution is about 20 mm. We can see a clear transition of rock size distribution fromthe rough terrain to smooth terrain.
Local topography is also measured by LIDAR. For example, in Figure 10, we showone of the results by LIDAR, where “Tsukuba Boulder” was measured. We know theroughness of the surface and in this region it is about 2.2 m. The roughness of “MUSES-Sea” region is about 0.6 m.
Figure 11 shows the distribution of the surface potential and the surface slope. Thelowest potential regions coincide with the smooth terrains, suggesting the mobility offine materials due to external forces after the formation of the asteroid such as seismicshaking and perturbation by planetary encounters. Evolution of the smooth terrains likely
https://www.cambridge.org/core/terms. https://doi.org/10.1017/S174392130700350XDownloaded from https://www.cambridge.org/core. IP address: 65.21.228.167, on 24 Feb 2022 at 21:01:51, subject to the Cambridge Core terms of use, available at

Nature of Itokawa 409
Figure 10. Local topography measured by LIDAR. Figure (a) shows the measuredpoints and (b) is the horizontal distance between each point and (c) is relative elevation.
Figure 11. Potential and slope. Left figure shows the potential difference and right figureshows the slope.
involve processes for grain-size sorting and dynamical interactions between regolith andboulders, although the transport/deposition mechanisms must be carefully investigatedfurther.
3.4. Surface composition of ItokawaThe surface composition of Itokawa can be investigated by NIRS and XRS. Figure 12shows the comparison of NIRS data with the reflectance spectrum of ordinary chondrites.The features of these spectra agree well, so this indicates that the surface of Itokawa isolivine and pyroxene assemblage. NIRS took the spectrum of various part of the surface,and the spectrum was almost the same. So we can also say that the mineralogical materialis almost the same all over the surface of Itokawa. Figure 13 also shows the data obtainedby NIRS, and it shows the correlation of the band strength ratios for average Itokawaspectra. This figure shows that the surface of Itokawa is especially olivine-rich surface,compared with other S-type asteroids, and it supports that the surface materials ofItokawa are quite similar to LL-chondrites.
Consistent results were obtained by the analysis of XRS data. One of the XRS data isshown in Figure 14, where both spectra of the standard on-board sample and of Itokawaare plotted. X-rays from Itokawa (right) have larger Mg/Si and smaller Al/Si than thoseof X-rays from the standard sample (left), which indicates that Itokawa is similar to
https://www.cambridge.org/core/terms. https://doi.org/10.1017/S174392130700350XDownloaded from https://www.cambridge.org/core. IP address: 65.21.228.167, on 24 Feb 2022 at 21:01:51, subject to the Cambridge Core terms of use, available at

410 M. Yoshikawa et al.
Figure 12. Near infrared reflectance spectrum. Dots show the observed data of Itokawaand the line is a spectrum of ordinary chondrite.
Figure 13. Natural log absorption strengths at 1.05 and 1.25 mm relative to that at 0.95 mmof average Itokawa spectra (filled circle).
ordinary chondrites in composition. Major elemental ratios obtained by XRS are Mg/Si= 0.78±0.09 and Al/Si = 0.07±0.03. This result also shows that Itokawa seems similar toordinary chondrites, especially LL- or L-chondrites but some primitive achondrites witha small degree of melting cannot be ruled out. No substantial regional variation is found,indicating homogeneity in composition.
Thus, from the observations by NIRS and XRS, we can say that the surface compositionof Itokawa is quite similar to LL-chondrites and the surface of Itokawa is homogeneousfrom the point of view of the composition.
However, we detected that there is heterogeneity in the distribution of the color andalbedo. Figure 15 shows the image of Itokawa in enhanced composite color. We can seethat some parts are brighter than the basic brightness of Itokawa. Some bright regionscorrespond to the borders of facets or land-slide region. So we think we can explain thisby space weathering. By the effect of space weathering, the surface of asteroid becomesdark. But if meteorites collide with Itokawa or the asteroid encounters planets, it will be
https://www.cambridge.org/core/terms. https://doi.org/10.1017/S174392130700350XDownloaded from https://www.cambridge.org/core. IP address: 65.21.228.167, on 24 Feb 2022 at 21:01:51, subject to the Cambridge Core terms of use, available at

Nature of Itokawa 411
Figure 14. X-ray spectra of the onboard standard sample (A) and asteroid Itokawa (B) weresimultaneously observed by the XRS at 9:27 UTC on 19 November 2005. The observed spectra(OBS) are fitted by Gaussian profiles to K- lines of major elements (Mg, Al, and Si) and by abackground continuum component (CONT).
Figure 15. Color composite images constructed from b-, v-, and w-band data. Thecontrast adjustment was done in each image to enhance the color variation.
shaken and sub-surface fresh materials, whose color is not dark, appear on the surface. Infact, generally, the brighter area is bluer, while the darker area is redder, which supportsthis hypothesis of space weathering.
3.5. Mass of ItokawaThe mass of an asteroid is quite important because it will be an important clue to knowthe structure of the asteroid, when the mass is converted to the density. The mass itselfis also important for the spacecraft navigation. Therefore, four independent teams triedto estimate the mass of Itokawa by using different data and different methods. In thissection, we summarize the results of these mass estimations.
https://www.cambridge.org/core/terms. https://doi.org/10.1017/S174392130700350XDownloaded from https://www.cambridge.org/core. IP address: 65.21.228.167, on 24 Feb 2022 at 21:01:51, subject to the Cambridge Core terms of use, available at
412 M. Yoshikawa et al.
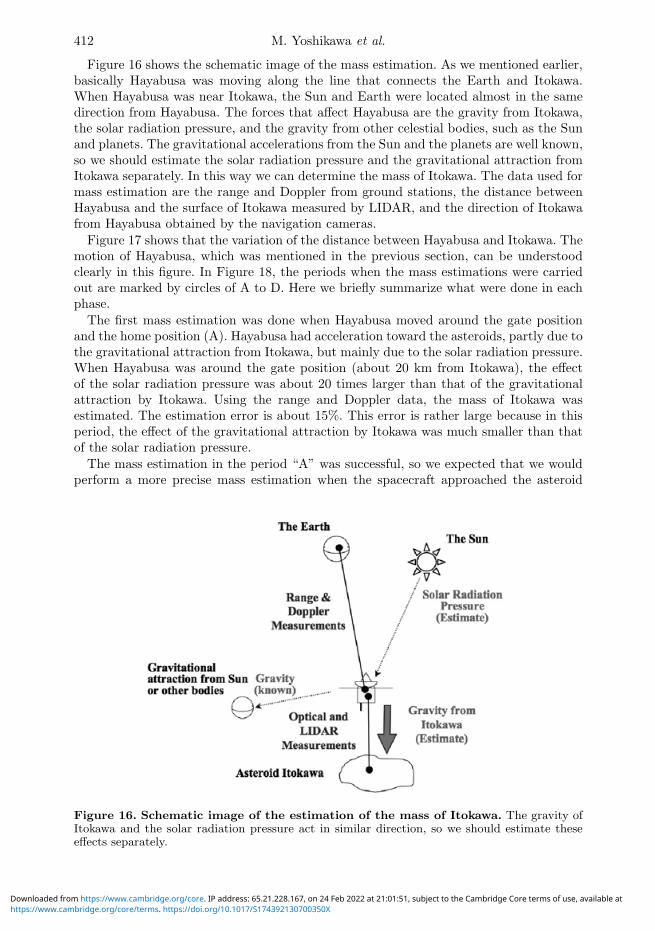
Figure 16 shows the schematic image of the mass estimation. As we mentioned earlier,basically Hayabusa was moving along the line that connects the Earth and Itokawa.When Hayabusa was near Itokawa, the Sun and Earth were located almost in the samedirection from Hayabusa. The forces that affect Hayabusa are the gravity from Itokawa,the solar radiation pressure, and the gravity from other celestial bodies, such as the Sunand planets. The gravitational accelerations from the Sun and the planets are well known,so we should estimate the solar radiation pressure and the gravitational attraction fromItokawa separately. In this way we can determine the mass of Itokawa. The data used formass estimation are the range and Doppler from ground stations, the distance betweenHayabusa and the surface of Itokawa measured by LIDAR, and the direction of Itokawafrom Hayabusa obtained by the navigation cameras.
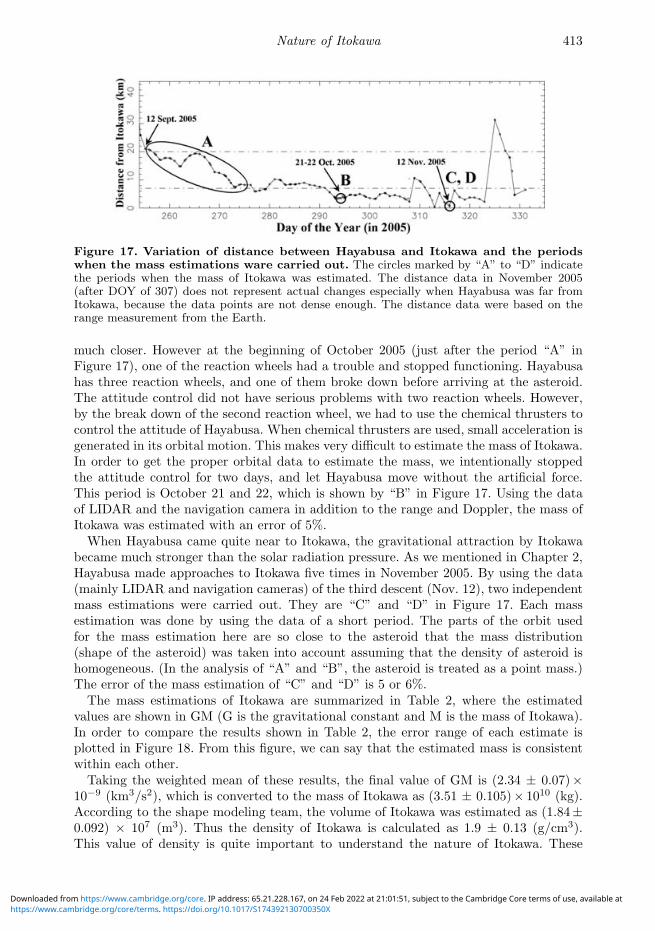
Figure 17 shows that the variation of the distance between Hayabusa and Itokawa. Themotion of Hayabusa, which was mentioned in the previous section, can be understoodclearly in this figure. In Figure 18, the periods when the mass estimations were carriedout are marked by circles of A to D. Here we briefly summarize what were done in eachphase.
The first mass estimation was done when Hayabusa moved around the gate positionand the home position (A). Hayabusa had acceleration toward the asteroids, partly due tothe gravitational attraction from Itokawa, but mainly due to the solar radiation pressure.When Hayabusa was around the gate position (about 20 km from Itokawa), the effectof the solar radiation pressure was about 20 times larger than that of the gravitationalattraction by Itokawa. Using the range and Doppler data, the mass of Itokawa wasestimated. The estimation error is about 15%. This error is rather large because in thisperiod, the effect of the gravitational attraction by Itokawa was much smaller than thatof the solar radiation pressure.
The mass estimation in the period “A” was successful, so we expected that we wouldperform a more precise mass estimation when the spacecraft approached the asteroid
Figure 16. Schematic image of the estimation of the mass of Itokawa. The gravity ofItokawa and the solar radiation pressure act in similar direction, so we should estimate theseeffects separately.
https://www.cambridge.org/core/terms. https://doi.org/10.1017/S174392130700350XDownloaded from https://www.cambridge.org/core. IP address: 65.21.228.167, on 24 Feb 2022 at 21:01:51, subject to the Cambridge Core terms of use, available at
Nature of Itokawa 413
Figure 17. Variation of distance between Hayabusa and Itokawa and the periodswhen the mass estimations ware carried out. The circles marked by “A” to “D” indicatethe periods when the mass of Itokawa was estimated. The distance data in November 2005(after DOY of 307) does not represent actual changes especially when Hayabusa was far fromItokawa, because the data points are not dense enough. The distance data were based on therange measurement from the Earth.
much closer. However at the beginning of October 2005 (just after the period “A” inFigure 17), one of the reaction wheels had a trouble and stopped functioning. Hayabusahas three reaction wheels, and one of them broke down before arriving at the asteroid.The attitude control did not have serious problems with two reaction wheels. However,by the break down of the second reaction wheel, we had to use the chemical thrusters tocontrol the attitude of Hayabusa. When chemical thrusters are used, small acceleration isgenerated in its orbital motion. This makes very difficult to estimate the mass of Itokawa.In order to get the proper orbital data to estimate the mass, we intentionally stoppedthe attitude control for two days, and let Hayabusa move without the artificial force.This period is October 21 and 22, which is shown by “B” in Figure 17. Using the dataof LIDAR and the navigation camera in addition to the range and Doppler, the mass ofItokawa was estimated with an error of 5%.
When Hayabusa came quite near to Itokawa, the gravitational attraction by Itokawabecame much stronger than the solar radiation pressure. As we mentioned in Chapter 2,Hayabusa made approaches to Itokawa five times in November 2005. By using the data(mainly LIDAR and navigation cameras) of the third descent (Nov. 12), two independentmass estimations were carried out. They are “C” and “D” in Figure 17. Each massestimation was done by using the data of a short period. The parts of the orbit usedfor the mass estimation here are so close to the asteroid that the mass distribution(shape of the asteroid) was taken into account assuming that the density of asteroid ishomogeneous. (In the analysis of “A” and “B”, the asteroid is treated as a point mass.)The error of the mass estimation of “C” and “D” is 5 or 6%.
The mass estimations of Itokawa are summarized in Table 2, where the estimatedvalues are shown in GM (G is the gravitational constant and M is the mass of Itokawa).In order to compare the results shown in Table 2, the error range of each estimate isplotted in Figure 18. From this figure, we can say that the estimated mass is consistentwithin each other.
Taking the weighted mean of these results, the final value of GM is (2.34 ± 0.07)×10−9 (km3/s2), which is converted to the mass of Itokawa as (3.51 ± 0.105)× 1010 (kg).According to the shape modeling team, the volume of Itokawa was estimated as (1.84±0.092) × 107 (m3). Thus the density of Itokawa is calculated as 1.9 ± 0.13 (g/cm3).This value of density is quite important to understand the nature of Itokawa. These
https://www.cambridge.org/core/terms. https://doi.org/10.1017/S174392130700350XDownloaded from https://www.cambridge.org/core. IP address: 65.21.228.167, on 24 Feb 2022 at 21:01:51, subject to the Cambridge Core terms of use, available at

414 M. Yoshikawa et al.
Table 2. Results of Mass Estimation of Asteroid Itokawa
Phase Period Data Type∗ Distance from Model of GM ErrorItokawa Itokawa 10−9km3/s2
A Sep. 12 – Oct. 2 R, Dop 20 – 7 km point mass 2.34 15%B Oct. 21 – 22 R, Dop, Opt, LI 3.5 km point mass 2.29 5%C Nov. 12 LI, Opt 1427 – 825 m polyhedron 2.39 5%D Nov. 12 Opt, LI 800 – 100 m polyhedron 2.36 6%
∗R: Range, Dop: Doppler, LI: LIDAR, Opt: Optical images
Figure 18. Estimated GM values with the error range. The values of GM and error inTable 2 are shown graphically. The dark lines indicate the range of estimated GM for each phaseof the orbit.
results of the mass and the density were taken as the first reference for the basic physicalcharacteristics of Itokawa, which was mentioned in chapter 3.2.
4. SummaryNow we know that the density of Itokawa is 1.9 g/cm3, and the surface material is
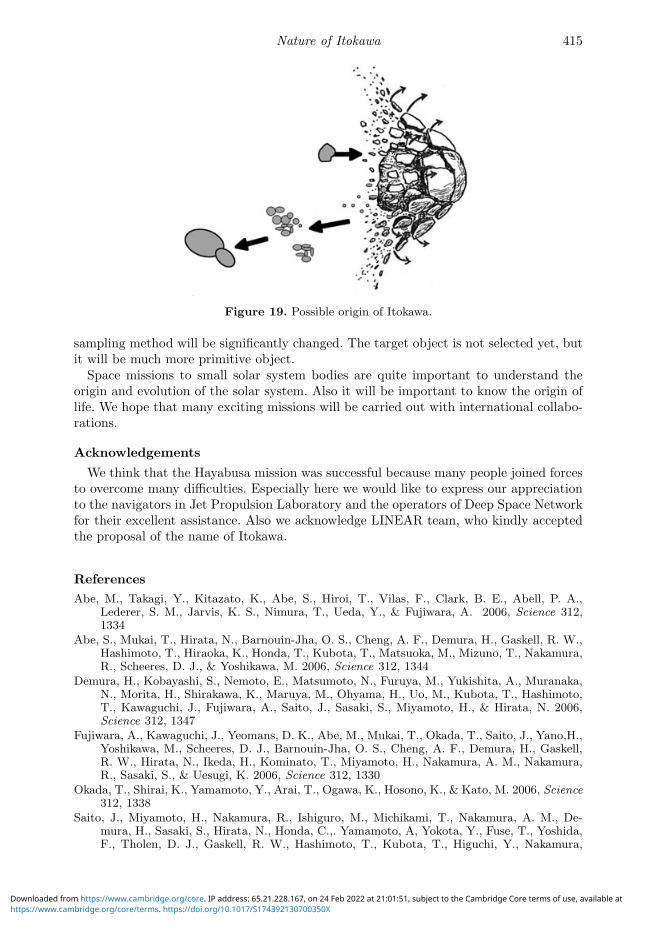
probably LL-chondrite. A macro-porosity equal to 40% was calculated. This means thatthere is large vacant space inside of Itokawa. Therefore, we concluded that Itokawa isa rubble pile object. A possible formation scenario is as follows (Figure 19) : (a) Theparent body was disrupted by impact. (b) A portion of fragments coagulated each otherforming two objects, which were forming a contact binary. (c) These two bodies weremerged into one and became Itokawa.
For the first time, we saw a very small asteroid from its vicinity. This tiny asteroid wasvery different from what was expected. We can say that we saw more basic and originalelements that created larger asteroids and planets.
The Hayabusa mission is still going on. Although the probability that some surfacematerials are inside the capsule is small, we have not gave up. The operation of thespacecraft is rather difficult because we can use only the ion engines, but we will try tobring it back to the Earth in June 2010. From the point of the engineering of Hayabusa,the only thing that we have not yet tried is the capsule reentry.
At the same time, we are planning post-Hayabusa missions. One is what we call“Haybusa-2.” Hayabusa-2 is almost the copy of Hayabusa, but the target asteroid isa C-type NEO. The target asteroid is tentatively 1999 JU3. Since Hayabusa-2 is a copymission of Hayabusa, we can save the time for development. The possible launch windowis November 2010 (backup window is November 2011). It will arrive at the asteroid in2013 and it will come back to the Earth in 2015 or 2016. The other mission is whatwe call “Hayabusa-Mk2,” where we will develop a totally new spacecraft. Especially the
https://www.cambridge.org/core/terms. https://doi.org/10.1017/S174392130700350XDownloaded from https://www.cambridge.org/core. IP address: 65.21.228.167, on 24 Feb 2022 at 21:01:51, subject to the Cambridge Core terms of use, available at
Nature of Itokawa 415
Figure 19. Possible origin of Itokawa.
sampling method will be significantly changed. The target object is not selected yet, butit will be much more primitive object.
Space missions to small solar system bodies are quite important to understand theorigin and evolution of the solar system. Also it will be important to know the origin oflife. We hope that many exciting missions will be carried out with international collabo-rations.
Acknowledgements
We think that the Hayabusa mission was successful because many people joined forcesto overcome many difficulties. Especially here we would like to express our appreciationto the navigators in Jet Propulsion Laboratory and the operators of Deep Space Networkfor their excellent assistance. Also we acknowledge LINEAR team, who kindly acceptedthe proposal of the name of Itokawa.
ReferencesAbe, M., Takagi, Y., Kitazato, K., Abe, S., Hiroi, T., Vilas, F., Clark, B. E., Abell, P. A.,
Lederer, S. M., Jarvis, K. S., Nimura, T., Ueda, Y., & Fujiwara, A. 2006, Science 312,1334
Abe, S., Mukai, T., Hirata, N., Barnouin-Jha, O. S., Cheng, A. F., Demura, H., Gaskell, R. W.,Hashimoto, T., Hiraoka, K., Honda, T., Kubota, T., Matsuoka, M., Mizuno, T., Nakamura,R., Scheeres, D. J., & Yoshikawa, M. 2006, Science 312, 1344
Demura, H., Kobayashi, S., Nemoto, E., Matsumoto, N., Furuya, M., Yukishita, A., Muranaka,N., Morita, H., Shirakawa, K., Maruya, M., Ohyama, H., Uo, M., Kubota, T., Hashimoto,T., Kawaguchi, J., Fujiwara, A., Saito, J., Sasaki, S., Miyamoto, H., & Hirata, N. 2006,Science 312, 1347
Fujiwara, A., Kawaguchi, J., Yeomans, D. K., Abe, M., Mukai, T., Okada, T., Saito, J., Yano,H.,Yoshikawa, M., Scheeres, D. J., Barnouin-Jha, O. S., Cheng, A. F., Demura, H., Gaskell,R. W., Hirata, N., Ikeda, H., Kominato, T., Miyamoto, H., Nakamura, A. M., Nakamura,R., Sasaki, S., & Uesugi, K. 2006, Science 312, 1330
Okada, T., Shirai, K., Yamamoto, Y., Arai, T., Ogawa, K., Hosono, K., & Kato, M. 2006, Science312, 1338
Saito, J., Miyamoto, H., Nakamura, R., Ishiguro, M., Michikami, T., Nakamura, A. M., De-mura, H., Sasaki, S., Hirata, N., Honda, C.,. Yamamoto, A, Yokota, Y., Fuse, T., Yoshida,F., Tholen, D. J., Gaskell, R. W., Hashimoto, T., Kubota, T., Higuchi, Y., Nakamura,
https://www.cambridge.org/core/terms. https://doi.org/10.1017/S174392130700350XDownloaded from https://www.cambridge.org/core. IP address: 65.21.228.167, on 24 Feb 2022 at 21:01:51, subject to the Cambridge Core terms of use, available at

416 M. Yoshikawa et al.
T.,Smith, P., Hiraoka, K., Honda, T., Kobayashi, S., Furuya, M., Matsumoto, N., Nemoto,E., Yukishita, A., Kitazato, K., Dermawan, B., Sogame, A., Terazono, J., Shinohara, C.,& Akiyama H. 2006, Science 312, 1341
Yano, H., Kubota, T., Miyamoto, H., Okada, T., Scheeres, D. J., Takagi, Y., Yoshida, K., Abe,M., Abe, S., Barnouin-Jha, O. S., Fujiwara, A., Hasegawa, S., Hashimoto, T., Ishiguro, M.,Kato, M., Kawaguchi, J., Mukai, T., Saito, J., Sasaki, S., & Yoshikawa, M. 2006, Science312, 1350
https://www.cambridge.org/core/terms. https://doi.org/10.1017/S174392130700350XDownloaded from https://www.cambridge.org/core. IP address: 65.21.228.167, on 24 Feb 2022 at 21:01:51, subject to the Cambridge Core terms of use, available at