the nature of ligand efficiency
TRANSCRIPT

doi.org/10.26434/chemrxiv.7263983.v1
The Nature of Ligand EfficiencyPeter Kenny
Submitted date: 28/10/2018 • Posted date: 29/10/2018Licence: CC BY-NC-ND 4.0Citation information: Kenny, Peter (2018): The Nature of Ligand Efficiency. ChemRxiv. Preprint.
Ligand efficiency is a widely used design parameter in drug discovery. It is calculated by scaling affinity bymolecular size and has a nontrivial dependency on the concentration unit used to express affinity that stemsfrom the inability of the logarithm function to take dimensioned arguments. Consequently, perception ofefficiency varies with the choice of concentration unit and it is argued that the ligand efficiency metric is notphysically meaningful nor should it be considered to be a metric. The dependence of ligand efficiency on theconcentration unit can be eliminated by defining efficiency in terms of sensitivity of affinity to molecular sizeand this is illustrated with reference to fragment-to-lead optimizations. An alternative to ligand efficiency fornormalization of affinity with respect to molecular size is presented. Group efficiency and fit quality are alsoexamined in detail from a physicochemical perspective. The importance of examining relationships betweenaffinity and molecular size directly is stressed throughout this study.
File list (2)
download fileview on ChemRxivpwk_le_oct2018_v1.0.pdf (1.14 MiB)
download fileview on ChemRxivpwk_le_oct2018_v1.0.docx (777.12 KiB)

1
The nature of ligand efficiency
Peter W. Kenny*
Berwick-on-Sea, North Coast Road, Blanchisseuse, Saint George, Trinidad and Tobago
ABSTRACT
∆𝑝𝐾𝐷
∆𝑁𝑛𝐻≠ ∆ (
𝑝𝐾𝐷
𝑁𝑛𝐻)
Ligand efficiency is a widely used design parameter in drug discovery. It is calculated by
scaling affinity by molecular size and has a nontrivial dependency on the concentration unit
used to express affinity that stems from the inability of the logarithm function to take
dimensioned arguments. Consequently, perception of efficiency varies with the choice of
concentration unit and it is argued that the ligand efficiency metric is not physically meaningful
nor should it be considered to be a metric. The dependence of ligand efficiency on the
concentration unit can be eliminated by defining efficiency in terms of sensitivity of affinity to
molecular size and this is illustrated with reference to fragment-to-lead optimizations. An
alternative to ligand efficiency for normalization of affinity with respect to molecular size is
presented. Group efficiency and fit quality are also examined in detail from a physicochemical
perspective. The importance of examining relationships between affinity and molecular size
directly is stressed throughout this study.
Keywords: cheminformatics, drug design, drug discovery, FBDD, FBLD, fragment-based lead
discovery, fit quality, group efficiency, hit-to-lead, LE, ligand efficiency, maximal binding
affinity, medicinal chemistry, molecular design, molecular interactions, molecular recognition,
physical-organic chemistry, property-based design, thermodynamics

2
INTRODUCTION
“I know I could,” the VP of discovery responded tartly. “But what do you think you’re here
for? I could order my own consumables, too, but that’s Milo’s job. Your job is to lead us in
prayers, and from now on you’re going to lead us in a prayer for more ligand efficiency in
every project. Is that clear? I think more ligand efficiency is something really worth praying
for.”
Adapted from Joseph Heller, Catch 22
Ligand efficiency (LE) is, in essence, a good concept that is poorly served by a bad metric. It
was introduced [1] as “a useful metric for lead selection”, has been discussed at length in
reviews [2-6] and is routinely tracked in drug discovery projects. There are actually two ligand
efficiencies in drug discovery and these can be seen as different manifestations of what might
be called molecular size efficiency (MSE). First, the LE concept, sometimes summarized as
‘bang for buck’, which can be expressed in terms of the sensitivity of affinity to an increase in
molecular size. Second, the compound-level LE metric (more accurately, family of metrics)
that was introduced [1] with a view to normalizing affinity of compounds with respect to
molecular size. While the LE concept has a solid basis, the LE metric cannot be regarded as
physically meaningful because perception of efficiency varies with the concentration unit in
which affinity is expressed [7,8]. The difficulty stems from the inability of the logarithm
function to take a dimensioned [9] argument which means that it is necessary to scale a KD
value by an arbitrary concentration unit to enable its logarithm to be calculated.
Drug design is incremental in nature. This reflects a view [10-12] that it is easier to
understand and predict differences in chemical behavior between structurally-related
compounds than it is to make absolute predictions directly from molecular structure. Drug
action is driven by concentration and affinity determines sensitivity of response to this driving
force. Drug design is a multi-objective [13] endeavor and some objectives, such as
maximization of affinity against the therapeutic target(s) and minimization of affinity against
anti-targets, can be defined clearly. Other objectives, such as controllability of exposure are
much more difficult to define and this means that drug design is typically indirect. One
significant difficulty [14] in drug design is that unbound intracellular concentration [15,16]
cannot generally be measured for drugs in vivo.

3
Most chemical starting points for design lack the affinity required to function as drugs and
optimization typically results in increased lipophilicity, molecular size and molecular
complexity [17,18]. This is the essence of lead-likeness [19]. The Rule of 5 (Ro5) [20]
highlights excessive molecular size and lipophilicity as primary design risk factors. Risks
associated with molecular complexity [18] are more likely to be encountered in the screening
phase of a project. Molecular complexity can also be seen inversely as the degree to which a
compound is structurally prototypical [21,22] (e.g., minimally substituted) and might also be
defined in terms of the molecular shape [23] of a compound or the roughness [24,25] of its
molecular surface. Molecular recognition [26] provides much of the conceptual framework for
drug design and many medicinal chemists consider molecular interactions [27] when
elaborating chemical start points. While a structure-activity relationship (SAR) can point to the
importance of individual interactions, the contribution of a protein-ligand contact to affinity is
not, in general an experimental observable [8,28].
In property-based design [29,30], risks associated with structural elaboration, such as poor
oral absorption, are assessed according to physicochemical criteria. Within this framework, the
most efficient optimization paths are those for which the necessary potency gains are
accompanied by the smallest increases in perceived risk. One general objective of optimization
projects has been stated [31] as “ensuring that any additional molecular weight and
lipophilicity also produces an acceptable increase in affinity”. Efficiency can be seen as
sensitivity of affinity to increased risk and this is the basis of what might be termed the LE
concept. Kuntz et al (K1999) [32] examined the response of maximal affinity to number of
non-hydrogen atoms and Hajduk (H2006) [33] noted that “along the path of ideal optimization,
an increase of 1 pKD unit can be expected for every 64 mass units”. Saxty et al (S2007) [34]
defined group efficiency (GE) for substitutions by scaling the change in affinity resulting from
addition of a substituent by the number of non-hydrogen atoms added. The idea of quantifying
sensitivity of chemical behavior to changes in molecular structure can be traced to the work of
Hammett [35,36] and the activity cliff [37,38] concept can be seen as part of the same general
framework.
Compound-level efficiency metrics are typically constructed by either scaling (i.e., divide
affinity by risk factor) or offsetting (i.e., subtract risk factor from affinity) [8]. LE was
introduced [1] as a metric to normalize affinity with respect to molecular size by scaling the

4
standard free energy of binding, G, by the number, NnH, of non-hydrogen atoms (the term
heavy atoms is also used) in the molecular structure as follows:
∆𝑔(𝑇, 𝑃, 𝐶°) = − (∆𝐺°
𝑁𝑛𝐻) (1)
The standard state was not specified when the LE metric was introduced [1] although it appears
to be widely believed [3] that C must be set to 1 M for calculation of LE. The Achilles heel of
the LE metric is its nontrivial dependency [7] on C and, as conventionally [3] defined, LE has
a 1 M concentration unit built into it. As noted [39] by Gilson et al, the choice of a particular
value of C, such as 1 M, to define the standard state is entirely arbitrary and a requirement
that C only take a specific value cannot be accommodated within the framework of
thermodynamics. This means that LE cannot be defined objectively in absolute terms for
individual compounds because there is no physical basis for favoring a particular value of C
for calculation of LE.
Although a quantity derived by scaling G by a risk factor does not have physical
significance, offsetting affinity by a risk factor may give a physically meaningful quantity [8].
Provided that ligand ionization is insignificant, ligand lipophilicity efficiency (LLE) [40],
which is also known as lipophilic ligand efficiency (LLE) [3] and lipophilic efficiency (LipE)
[41], can be interpreted as the ease of transfer of a ligand from 1-octanol to its binding site [8].
Furthermore, some of the limitations of the 1-octanol/water partitioning system become less
significant when working within structural series, as is usually the case for lead optimization
[42]. While physical interpretability is certainly a desirable feature for a drug design metric,
this alone does not guarantee that a metric will be usefully predictive in drug design.
The principal objectives of this study are to provide an in-depth analysis of LE (and its
variants) and to highlight ways in which consideration of LE as a concept might address the
serious deficiencies of the compound-level metric. LE is discussed in terms of molecular
interactions and binding thermodynamics and some of this discussion is likely to be generally
relevant to drug design. A recurring theme in this study is a view that it is generally better to
observe the response of affinity to molecular size directly rather than through the distorting
lens of the flawed LE metric.

5
MOLECULAR SIZE AND DESIGN RISK
It is important that drug discovery scientists be fully aware of the assumptions on which the
LE metric is based and that they carefully consider their motivation for using LE (or indeed
any design guidelines). Property-based design [29,30] can be seen in terms of balancing the
risk associated with poor physicochemical characteristics against the risk of not being able to
achieve the necessary level of affinity. Ro5 [20] is based on analysis of property distributions
of drugs (defined as compounds that had progressed into Phase 2 trials) and the assessment of
risk is indirect because non-drugs were not included in the original analysis. Ro5 [20] neither
takes account of correlations between risk factors nor does it provide a means to deconvolute
the risks associated with excessive molecular size and lipophilicity. The LE metric can be seen
as a simple means with which to balance risk and there are more rigorous and sophisticated
ways for doing this [43]. Simple drug design guidelines based on molecular size and/or
lipophilicity typically become progressively less useful as more measured data become
available to the drug discovery team.
Drug design guidelines are typically based on trends observed in data and the strengths of
these trends indicate how rigidly guidelines should be adhered to. While excessive molecular
size and lipophilicity are widely accepted as primary risk factors in design, it is unclear how
directly predictive they are of more tangible risks such as poor oral absorption, inadequate
intracellular exposure and rapid turnover by metabolic enzymes. This is an important
consideration because the strength of the rationale for using LE depends on the degree to which
molecular size is predictive of risk. Drug discovery scientists need to be wary of correlation
inflation [14] (the term voodoo correlation [44] is also used) which can be loosely defined as
presentation or analysis of data in any way that makes trends appear to be stronger than they
actually are. Correlation inflation is a particular concern when analysis of proprietary data is
presented in support of a view that a set of guidelines is especially useful or predictive.
Published analyses of relationships [40,45] between pharmacological promiscuity and
molecular size and lipophilicity exemplify the problem. Comparison of average values without
taking account of variance is one way in which trends can be made to appear to be stronger
than they actually are and correlation inflation is acknowledged [46,47] as an issue in drug
design. Variance in the dependent variable can also be hidden by representing a distribution
(e.g., aqueous solubility of compounds with property forecast index in the range 6 – 7) by a
single percentile (e.g., percentage of those compounds with aqueous solubility > 200 M) [48].
6
The relevance of data must also be considered when using physicochemical characteristics
such as molecular size to assess risk. For example, an activity threshold [40] of > 30%
inhibition at 10 M for promiscuity analysis is not especially relevant if considering the
likelihood of off-target effects for a drug with a peak unbound plasma concentration of 100
nM. Sample bias can be significant, even in large datasets, as exemplified by divergent
conclusions of two apparently similar studies [40,45] with respect to the relationship between
pharmacological promiscuity and molecular size. The observation that average molecular
weight appears to decrease [45] with promiscuity is particularly relevant to the use of LE
because promiscuity would generally be considered [40] to be an undesirable characteristic for
a compound. Drug designers should not automatically assume that conclusions drawn from
analysis of large, structurally-diverse data sets are necessarily relevant to the specific drug
design projects on which they are working.
THERMODYNAMIC ASPECTS OF LIGAND-PROTEIN ASSOCIATION
The LE metric [1] was introduced in thermodynamic terms and it is sometimes believed that it
measures the degree to which molecular interactions between ligand and target are optimal.
For example, it has been asserted [49] “Because of these optimal interactions, fragments are
very ‘atom efficient’ binders, demonstrated by high ligand efficiency”. This section focuses on
thermodynamic [7,39] aspects of protein-ligand association most relevant to LE and to the
interpretation of affinity in terms of molecular interactions [26,27].
The standard free energy of binding, G, [39] can be written in terms of the gas constant
(R), thermodynamic temperature (T), C and the equilibrium concentrations of protein ([P]),
ligand ([L]), and protein-ligand complex ([P.L]):
𝐺° = 𝑅𝑇𝑙𝑛 ([𝑃][𝐿]
[𝑃. 𝐿]𝐶°) (2)
Equation (2) shows that G is a function of C and this is one reason that values of standard
free energy of binding should not be termed absolute. By convention, C is taken to be 1 M
although, this is arbitrary and the value of C has no physical significance [39]. In
thermodynamic analysis, a change in perception resulting from a change in a standard state
definition would generally be regarded as a serious error rather than a penetrating insight. In
some situations, the dissociation constant, KD, is defined to be equal to the argument of the
logarithm in equation (2) and is therefore dimensionless. However, in medicinal chemistry,

7
biochemistry and biophysics, KD values are conventionally quoted in units of concentration
and equation (2) can be written as:
𝐺°(𝑇, 𝑃, 𝐶°) = 𝑅𝑇𝑙𝑛 (𝐾𝐷(𝑇, 𝑃)
𝐶°) (3)
Equation (3) shows that a tenfold increase in C leads to a decrease in G of 1.36 kcal/mol
at 298 K. The sign of G has no special significance and simply indicates whether or not KD
is greater or less than C. The dependence of G on C is a consequence of the stoichiometry
of association of ligand with target and G for formation of a ternary complex (relevant when
considering the thermodynamic consequences of fragment linking) will exhibit a different
dependence on C to G for a binary complex. The stoichiometry corresponding to a G
value is specified by the change, N, in the number of species for the corresponding reaction
and it can also be seen as a ‘hidden dimension’ of G. For example, formation and dissociation
of 1:1 complexes have N values of 1 and +1 respectively. The value of N determines the
dimensions of the corresponding equilibrium constant:
dim 𝐾 = (𝑐𝑜𝑛𝑐𝑒𝑛𝑡𝑟𝑎𝑡𝑖𝑜𝑛)∆𝑁 (4)
The dependence of G on C is a consequence of the loss of translational entropy resulting
from association and it has two important implications. First, ratios of G values also depend
on C even though the ratios themselves are dimensionless and G values should therefore be
compared as differences (i.e., G). Second, if a free energy change is written as a sum of free
energy changes then the sum needs to have the same dependency on C as the original free
energy change since the equality must hold for all values of C. This is equivalent to requiring
that the sum of N values for the components of a free energy decomposition be equal to the
N value for the free energy change that is decomposed.

8
One way in which stoichiometry can be accounted for in free energy decompositions is to
associate each free change with its corresponding N value using square brackets. The study
by Jencks [50] (J1981) on attribution and additivity of binding energies can be used to illustrate
this. J1981 [50] defines the intrinsic binding energy for a group X as the difference in G for
compounds in which X is present (AX) or absent (A) in the relevant molecular structures:
∆𝐺𝑋𝑖 [0] = ∆𝐺𝐴𝑋° [−1] − ∆𝐺𝐴°[−1] (5)
The intrinsic binding energy is associated with a zero value of N and is therefore independent
of C. J1981 [50] writes the G value for a compound with linked groups A and B in its
molecular structure as the sum of the intrinsic binding energies of A and B, and the “connection
Gibbs energy” (Gs):
∆𝐺𝐴𝐵° [−1] = ∆𝐺𝐴𝑖 [0] + ∆𝐺𝐵
𝑖 [0] + ∆𝐺𝑠[−1] (6)
Equation (6) is particularly relevant to fragment linking and it is important to note that Gs
does depend on C [7,50]. In some studies, G is decomposed into a value corresponding to
zero molecular size (GMS=0) and a G value:
∆𝐺°[−1] = ∆𝐺𝑀𝑆=0[−1] ∆∆𝐺[0] (7)
For example, K1999 [32] and S2007 [34] use GMS=0 values of 0 and +4.2 kcal/mol
respectively. While this decomposition is valid to the extent that the sum has same dependence
on C as G, the assignment of an affinity value (e.g., KD = 1 M) to a solute of zero molecular
size for efficiency calculations does not appear to have any physical basis.
One general approach to modelling affinity is to use equation (8) in which Ai (i > 0) is a
parameter associated with the substructure i and ni is the number of occurrences of that
substructural element:
∆𝐺°[−1] = 𝐴0[−1] + ∑ 𝑛𝑖
𝑁𝑆𝑆
𝑖=1
× 𝐴𝑖[0] (8)
The A0 term has the same dependency on C as G and its inclusion in equation (8) allows
changes in concentration unit to be easily accounted for. In Free-Wilson analysis [51] the
substructures are typically groups at substitution sites on a scaffold and the ni values are either

9
1 or 0 and A0 may correspond to the affinity of the unsubstituted scaffold. In the analysis of
functional group contributions by Andrews, Craik and Martin (ACM1984) [52], A0
corresponds to the entropy term which was set to 14 kcal/mol rather than derived by fitting
the data. Schemes for decomposition of G based on equation (8) cannot be considered to be
group additive because of the presence of the A0 term which is not associated with any group.
It has been asserted [53] that “Ligand efficiency can be recast as a special case of group
additivity where ΔG/HA is the group equivalent” but this does not properly account for the
stoichiometry of the binding. Unlike is equation (8), there is no is A0 term when G (N =
1) is decomposed into a sum of NnH equal atom-based terms and this leads to significant
difficulties. Specifically, each term in the sum must have an identical dependence on C while
the sum of terms needs to reproduce the dependence of G on C. While this can be achieved
algebraically by assigning a fractional stoichiometry to each atom-based term, the physical
meaning of the resulting atom-based terms remains obscure. For example, the numerical values
that result from dividing G values of 5 kcal/mol and 10 kcal/mol by 10 and 20 respectively
are identical. However, the two quantities cannot be equated because they differ in their
dependence on C. In contrast, the enthalpy of binding, H, does not depend on C and so
enthalpic efficiency [54] can be defined unambiguously.
An equivalent way to examine the stoichiometry issue is to consider the implications of
writing KD as follows where knH corresponds to g as defined in equation (1):
𝐾𝐷 = (𝑘𝑛𝐻)𝑁𝑛𝐻 (9)
Consider two compounds X (KD = 103 M; NnH = 10) and Y (KD = 106 M; NnH = 20) that would
usually be considered to be equally ligand-efficient (g = 0.4 kcal/mol per non-hydrogen atom
at 298 K for C = 1 M). While the values of knH calculated for X (0.501 M0.1) and Y (0.501
M0.05) have the same numerical value, it is incorrect to equate them because their dimensions
differ, as reflected by the difference in their respective units. If KD is expressed in millimolar
units, the numerical values of knH for X (1 mM0.1) and Y (0.708 mM0.05) are no longer identical.
The need to properly account for stoichiometry is one reason that the contribution of an
intermolecular contact (or a substructure) to affinity is not an experimental observable [8]
although this appears to be the case even when stoichiometry is not an issue [28]. Some of the
entropy of binding results from molecular interactions (e.g., between water molecules) that are

10
non-local with respect to protein-ligand contacts. Some contributions to binding enthalpy, such
as the enthalpic penalties associated with ligand and target adopting their bound conformations
are also inherently non-local. A less obvious example of a non-local effect would be
substitution at one position of a molecular structure preventing a substituent at another position
from forming optimal interactions with the target. When interpreting binding thermodynamics
in terms of molecular interactions, it should always be kept in mind that intermolecular contacts
(e.g., between unbound ligand and solvent) that are not present in the protein-ligand complex
also influence H and S.
Target interaction potential (TIP) can be a helpful concept when considering association of
ligands with their targets. TIP takes account of both the nature of the interactions (e.g.,
hydrogen bonds) and the fact that ligand-target association takes place in an aqueous
environment. Hotspots [55] on the molecular surface of a target can be seen as regions of high
TIP while ligandability [56] is determined both by the magnitude of TIP and the extent to which
it can be exploited. An ability to reversibly form covalent bonds (e.g., catalytic cysteine thiol
or a protein-bound metal cation such as zinc) with ligands would generally be associated with
high TIP as would depletion [57] of water from a binding pocket or the “frustrated” hydration
[42] resulting from the overlap of solvation spheres of adjacent hydrogen bond donors (or
acceptors). A key challenge in drug design is to determine whether inadequate affinity is due
to low TIP (i.e., target is the problem) or underexploited TIP (i.e., compound is the problem).
PERCEPTION OF AFFINITY VARIES WITH CONCENTRATION UNIT
Although the implications for LE of the dependence of G on C were first highlighted [7] in
2009 by Zhou and Gilson, they have been overlooked by LE advocates. For example, Murray
et al (M2014) [58] discussed the validity of LE but demonstrated no awareness of the relevance
of the dependence of G on C. A Future Medicinal Chemistry editorial [59] claimed that
“Ligand efficiency validated fragment-based design” while reassuring its readers that “There
is no need to become overly concerned with noisy arguments for or against ligand efficiency
metrics being exchanged in the literature.” However, this editorial [59] neither makes
reference to criticism [7] of LE made in 2009 nor does it address the implications [8] of the
nontrivial dependence of the metric on what is an entirely arbitrary concentration unit.
11
Some of the problems that result from using LE as a design metric can be seen more clearly
if it is expressed using a base 10 logarithm and without energy units:
𝜂𝑏𝑖𝑛𝑑 = − (1
𝑁𝑛𝐻) × 𝑙𝑜𝑔10 (
𝐾𝐷
𝐶°) =
∆𝑔
𝑅𝑇𝑙𝑛(10) (10)
The quantity bind is related to g by a multiplicative factor of RTln(10) that is independent of
C and therefore both quantities respond in an identical manner to a change in C. One rationale
for using bind is that drug discovery scientists typically use pIC50 or pKD rather than G in
SAR analysis. The quantity bind is also related to ligand efficiency by atomic number (LEAN)
[60] that is calculated by scaling pIC50 by NnH. Unlike LEAN, bind is a function of C and can
also be written as bind(C) to emphasize this. Although standard state conventions do not apply
to potency measures such as IC50 and EC50, which are usually quoted in M or nM, potency
must still be scaled by a concentration value for the logarithm calculation because the logarithm
function is not defined for dimensioned quantities [9]. Using bind rather than G reinforces
the point that the problems associated with LE are due to the mathematical behavior of the
logarithm function. While the use of a concentration unit other than 1 M to define LE is
unusual, there certainly is precedent for doing so. For example, minimum inhibitory
concentration, used to define antibacterial efficiency [61], was scaled by mg/ml in order that
the logarithm could be calculated.
Table 1 illustrates how a change in C alters the perception of efficiency. The hypothetical
set of three compounds consists of a fragment hit (NnH = 10; KD = 1 mM), a lead (NnH = 20; KD
= 1 M) and a clinical candidate (NnH = 30; KD = 1 nM) that would usually be regarded as
equally ligand-efficient (g = 0.4 kcal/mol per non-hydrogen atom at 298 K for C = 1 M) [8].
An identical bind value of 0.3 per non-hydrogen atom is indeed calculated for all three
compounds when C is set to the conventional value of 1 M. Using a value of 0.1 M for C
leads to the conclusion that the clinical candidate is more ligand-efficient than the fragment
but, if C is set to 10 M, we come to the opposite conclusion. Given that rankings of compounds
can change with C and that there is no way of objectively selecting a value of C for these
calculations, neither bind nor g would appear to be fit for the purpose of assessing
performance, potential or quality of compounds in drug discovery projects. An analogous
criticism can also be made of the BEI [2], LEAN [60], LLEAT [3] and LELP [3] metrics.

12
Table 1. Dependence of ligand efficiency on C
bind(C) a
NnH b KD/M c C = 0.1 M C = 1 M C = 10 M
10 10-3 0.20 0.30 0.40
20 10-6 0.25 0.30 0.35
30 10-9 0.27 0.30 0.33
a Ligand efficiency defined in (10)
b Number of non-hydrogen atoms in molecular structure
c Dissociation constant for protein-ligand complex
The change in perception of efficiency that results from a change in C shows that neither
bind nor g has thermodynamic significance. A necessary, but not sufficient, condition for
validity of thermodynamic analysis is that conclusions drawn from the analysis cannot depend
on the choice of C. Although C is an integral component of the framework of solution
thermodynamics, it can also be seen simply as a unit used to express affinity so that a logarithm
can be calculated for KD. A physical quantity that is expressed in different units is still the same
quantity. If perception changes when a quantity is expressed using a different unit then neither
the change in perception nor the quantity itself can be regarded as physically meaningful.
Provided that C is known, log(KD/C) is physically meaningful and the effect of a change in
C is both constant and calculable. In contrast, knowing values of bind and C does not allow
us to calculate the bind value corresponding to another value of C. Furthermore, the results
presented in Table 1 show that a single bind value can transform to more than one bind value
in response to a change in C.
The change in perception resulting from a change of unit raises the question of whether or
not LE can accurately be described as a metric. The defining characteristic of a metric is that it
measures and it is necessary to state clearly what a quantity measures if claiming that the
quantity is a metric. While units are essential for measurement, a valid and credible framework
for measurement must allow for quantities to be expressed in different units (e.g. M and nM).
For example, readers might consider their likely responses to a hypothetical report that the
space group for a crystal structure differed according to whether unit cell parameters were

13
expressed in Ångstrom or in nanometer units. There are two reasons that LE should not be
considered to be a metric. First, it is not clear what LE measures since neither the extent to
which molecular interactions are optimal nor interaction quality are experimental observables.
Second, LE has a unit (1 M) built into it and perception of efficiency is altered (Table 1) when
another concentration unit is used. It would actually be more accurate to describe LE as a
simple predictor of potency in cell-based assays or of in vivo activity that, like property forecast
index [48], has neither been validated nor optimized for prediction.
A B
Key: (C = 1 M) (C = 0.1 M) (C = 0.01 M)
Figure 1. (A) Response of affinity to molecular size for plotted for three different C values
(B) Plot of LE (bind) calculated from the response of affinity to molecular size using three
different C values
Figure 1 illustrates the impact of the dependence of bind on C in an alternative manner to
Table 1. Figure 1A shows a hypothetical response of affinity to NnH that has been constructed
to have a linear region (slope = 0.3 per non-hydrogen atom) at low NnH and a plateau at high
NnH. The response is plotted for three different values (1 M; 0.1 M; 0.01 M) of C and this
shows how expressing affinity in a different unit shifts the entire response by a constant amount
without affecting the shape of the response. In contrast, using a different unit to express bind
actually changes the shape of the response of bind to C. Furthermore, transformation of
affinity to bind typically makes it more difficult to perceive the linear and plateau regions of
the response of affinity to NnH. The results presented in Figure 1 highlight the importance of
observing relationships between affinity and molecular size directly.

14
LE is used to specify affinity cutoffs as a function of molecular size and a g value of 0.3
kcal/mol per non-hydrogen atom has been suggested [3]. Specification of affinity cutoffs in
this manner forces the line defining acceptable affinity to intersect the affinity axis at a point
corresponding to a KD value of 1 M. This causes considerable difficulties when the range in
NnH is large as is the case for beyond rule of 5 (bRo5) [62] compounds. The minimum g value
of 0.12 kcal/mol per non-hydrogen atom recommended [62] for bRo5 compounds can be
translated (C = 1 M; T = 300 K) to pKD values corresponding to the lower (700 Da; NnH 50)
and upper (3000 Da; NnH 214) limits for bRo5 space. The lower (pKD = 4.4) of these two
values would not appear to be a useful design criterion while the higher value (pKD = 18.7)
would not generally be measurable. In general, affinity thresholds should be specified directly
and LE should only be used for this purpose if supported by the data.
LE was introduced [1] with the claim that it was useful but it is rarely, if ever, shown to be
predictive of pharmaceutically-relevant behavior. As such, the utility of LE as a design metric
hinges on it being meaningful and there is a burden of proof on those who advocate the use of
LE to demonstrate that their choice of unit is universally appropriate. The importance of
physicochemical properties is widely accepted in drug design and many medicinal chemists
would regard it as routine to monitor progress in projects by plotting potency against molecular
size or lipophilicity. A critique of LE metrics actually emphasized the importance of modeling
relationships between affinity and risk factors for compounds of interest [8]. However, a
depiction [6] of an optimization path for a project that has achieved a satisfactory endpoint is
not direct evidence that consideration of molecular size or lipophilicity made a significant
contribution toward achieving that endpoint. Furthermore, explicit consideration of
lipophilicity and molecular size in design does not mean that efficiency metrics were actually
used for this purpose. Design decisions in lead optimization are typically supported by assays
for a range of properties such as solubility, permeability, metabolic stability and off-target
activity as well as pharmacokinetic studies. This makes it difficult to assess the extent to which
efficiency metrics have actually been used to make decisions in specific projects, especially
given the proprietary nature of much project-related data.

15
LIGAND EFFICIENCY AND FRAGMENT-BASED DESIGN
LE features prominently in the literature of fragment-based lead discovery (FBLD) [63-68] to
the extent that it is sometimes presented as an important rationale for screening fragments. For
example, it has been claimed [64] that “fragment hits typically possess high ‘ligand efficiency’
(binding affinity per heavy atom) and so are highly suitable for optimization into clinical
candidates with good drug-like properties”. It has been asserted [31] that “fragment hits form
high-quality interactions with the target” although it is not clear if interaction quality involves
aesthetic aspects in addition to the physical forces more usually associated with molecular
recognition [26,27]. I would argue that the rationale for screening fragments against targets of
interest is actually based on two conjectures. First, chemical space can be covered most
effectively by fragments because compounds of low molecular complexity [18,21,22] allow
TIP to be explored [69-73] more efficiently and accurately. Second, a fragment that has been
observed to bind to a target may be a better starting point for design than a higher affinity ligand
whose greater molecular complexity prevents it from presenting molecular recognition
elements to the target in an optimal manner. While proving either conjecture definitively is
difficult, the success [74] of fragment-based approaches indicate that the underlying
assumptions are reasonable.
The Johnson et al 2018 study (J2018) [75] examined start-finish differences in LE for a
number for a number of fragment-to-lead (F2L) optimizations that had been published in 2016
and there is precedent [48] for analyzing start-finish differences for projects in this manner.
J2018 [75] notes that differences in LE between fragment hits and leads were not statistically
significant and states that “in contrast to anecdotal reports that LE tends to decline during the
F2L process, LE decreased during optimization for only a minority of examples”. This analysis
is repeated using bind values calculated for different values of C ranging from 0.001 M to
10 M and the results are summarized in Table 2. As C increases, the leads appear to become
less ligand-efficient in comparison with the fragment hits from which they had been derived
and this is analogous to what is shown in Table 1. Statistically significant differences between
values for fragment hits and leads are only observed if C is 0.01 M or 0.001 M.
16
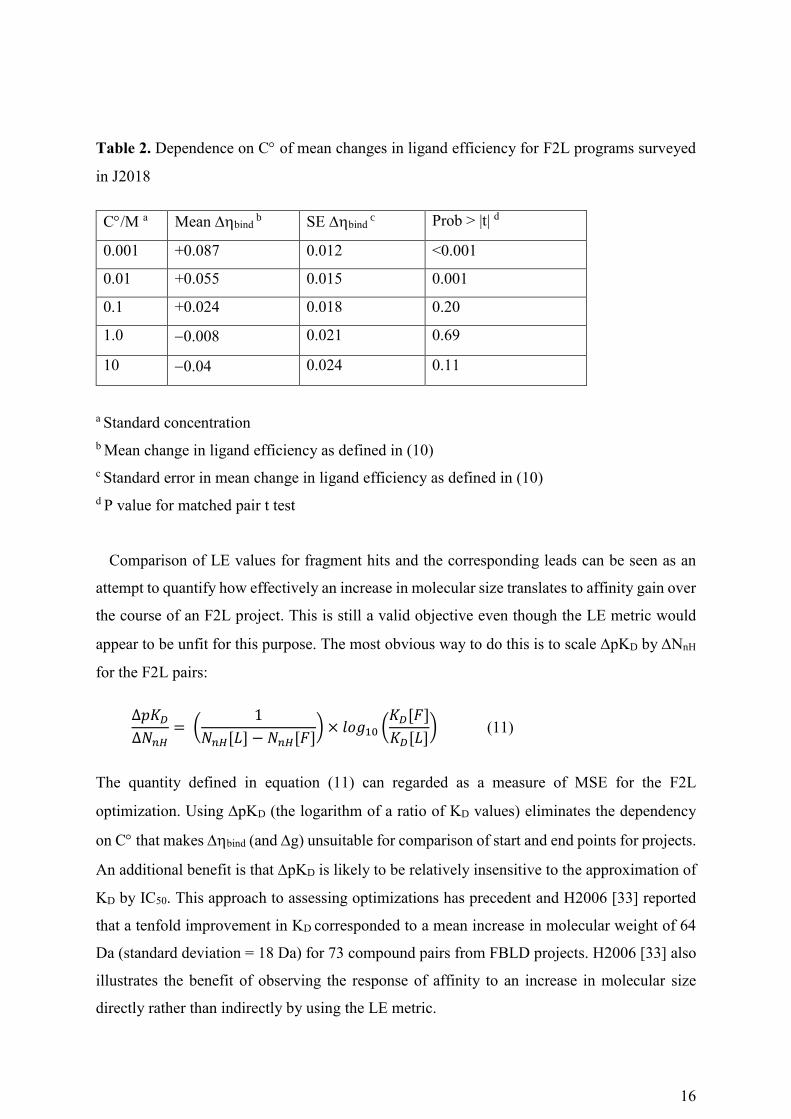
Table 2. Dependence on C of mean changes in ligand efficiency for F2L programs surveyed
in J2018
C/M a Mean bind b SE bind
c Prob > |t| d
0.001 +0.087 0.012 <0.001
0.01 +0.055 0.015 0.001
0.1 +0.024 0.018 0.20
1.0 0.008 0.021 0.69
10 0.04 0.024 0.11
a Standard concentration
b Mean change in ligand efficiency as defined in (10)
c Standard error in mean change in ligand efficiency as defined in (10)
d P value for matched pair t test
Comparison of LE values for fragment hits and the corresponding leads can be seen as an
attempt to quantify how effectively an increase in molecular size translates to affinity gain over
the course of an F2L project. This is still a valid objective even though the LE metric would
appear to be unfit for this purpose. The most obvious way to do this is to scale pKD by NnH
for the F2L pairs:
∆𝑝𝐾𝐷
∆𝑁𝑛𝐻= (
1
𝑁𝑛𝐻[𝐿] − 𝑁𝑛𝐻[𝐹]) × 𝑙𝑜𝑔10 (
𝐾𝐷[𝐹]
𝐾𝐷[𝐿]) (11)
The quantity defined in equation (11) can regarded as a measure of MSE for the F2L
optimization. Using pKD (the logarithm of a ratio of KD values) eliminates the dependency
on C that makes bind (and g) unsuitable for comparison of start and end points for projects.
An additional benefit is that pKD is likely to be relatively insensitive to the approximation of
KD by IC50. This approach to assessing optimizations has precedent and H2006 [33] reported
that a tenfold improvement in KD corresponded to a mean increase in molecular weight of 64
Da (standard deviation = 18 Da) for 73 compound pairs from FBLD projects. H2006 [33] also
illustrates the benefit of observing the response of affinity to an increase in molecular size
directly rather than indirectly by using the LE metric.

17
It can be useful to compare the changes in affinity and lipophilicity that result from structural
elaboration and one way of achieving this is to offset the change in affinity by change in
lipophilicity:
∆𝑝𝐾𝐷 − ∆𝑙𝑜𝑔𝑃 = 𝑙𝑜𝑔10 (𝐾𝐷[𝐹] × 𝑃[𝐹]
𝐾𝐷[𝐿] × 𝑃[𝐿]) (12)
The quantity in equation (12) may be regarded as a measure of the lipophilicity efficiency for
the F2L optimization and is equivalent to the change in what would be termed LLE [3,40] or
LipE [41]. It is desirable that it should be as large as possible for F2L projects. Variations of
equation (12) can also be written using potency (e.g. pIC50) with a measured distribution
coefficient (logD) or a predicted [76] value of logP. Where pKD was not available, it has been
approximated by pIC50 and the ClogP values reported in J2018 [75] are used as the measure of
lipophilicity.
A plot of pKD against NnH with reference lines of constant (pKD/NnH) is shown in
Figure 2A. This depiction is intended to map the distribution of (pKD/NnH) values so the
reference lines are drawn to mark quartiles rather than at equally-spaced intervals. A plot of
(pKD ClogP) against NnH is shown in Figure 2B with reference lines to map the
distribution. Affinity gains for optimizations with zero values of (pKD ClogP) would
typically be regarded as being entirely due to increased hydrophobic contact with target.
However, it is important to be aware that the octanol/water partitioning system is relatively
insensitive to the presence of hydrogen bond donors [14,42]. Large positive values of (pKD
ClogP) might be considered to be evidence that the optimization process has introduced
additional polar interactions although polar functionality can still be tolerated, for example by
being exposed to solvent, without actually making contact with target.

18
A
B
Figure 2. (A) Plot of pKD against NnH for J2018 F2L optimizations showing reference lines
for minimum (min = 0.13), first quartile (Q1 = 0.18), median (Q2 = 0.28), third quartile (Q3 =
0.37) and maximum (max = 1.32) values of (pKD/NnH) (B) Plot of (pKD ClogP) against
NnH
An observation that can be made about the J2018 [75] analysis is that the start points for 15
of the 28 F2L projects surveyed do not appear to comply with the rule of 3 (Ro3) [77] if Ro5
[20] hydrogen bond definitions are used. This would appear to contradict the claim [74] that
“Most libraries consist of molecules that adhere to the 'rule of three'.” It has been suggested
[22,78] that Ro3 [77] may be overly restrictive and applying the rule in this manner would
eliminate carboxylic acid bioisosteres [79] such as tetrazole [80] and N-acylsulfonamide [81]
as well as the isocytosine fragment hit [82] that led to the discovery of potent -secretase

19
inhibitors [83]. All lead compounds surveyed in J2018 [75] are of greater molecular size than
the corresponding fragments but this is not the case for lipophilicity. Calculated logP values
for five of the leads were lower than for the fragment hits from which they were derived,
suggesting that a logP cutoff value of 3 may be overly restrictive for design of compound
libraries for FBLD. The Ro5 [20] cutoff values for molecular weight (500 Da) and logP (5)
were directly derived from the relevant data since they correspond to specific percentiles in the
distributions observed for these quantities. However, it should not automatically be assumed
that there is an analogous correspondence between the Ro3 [77] cutoff values for molecular
weight (300 Da) and logP (3).
GROUP EFFICIENCY
Medicinal chemists typically view SAR in terms of affinity differences resulting from
structural modifications. Observation that a small structural change leads to a large change in
affinity is usually informative. Group efficiency (GE) [34] is defined for the addition of a
group, X, to A by scaling the value of the associated G (∆𝐺𝑋𝑖 as defined in [50]) by NnH:
𝐺𝐸[𝐴 → 𝐴𝑋] = − (∆∆𝐺[𝐴 → 𝐴𝑋]
∆𝑁𝑛𝐻[𝐴 → 𝐴𝑋]) (13)
The notation [XY] can be used to specify structural transformations and to indicate that a
change in the value of a property such as G, pKD or NnH has been calculated by subtracting
the value of the property for compound X from that for compound Y [84]. The definition of
GE expresses equation (11) in terms of free energy rather than dissociation constant and
equation (12) could be used in an analogous manner to specify the efficiency of substitutions
from the perspective of lipophilicity. GE was stated [85] to be “a more sensitive metric to
define the quality of an added group than a comparison of the LE of the parent and newly
formed compounds” and the introduction of the metric can be seen as an attempt to address a
perceived deficiency in LE. The more fundamental difference between the two metrics is that
GE is independent of C because it is defined in terms of G. Although GE is sometimes
presented as a substructural (e.g. chloro substituent) property, it is actually structural
transformations (e.g. substitute hydrogen with chlorine) with which values of GE should be
associated. The G values used for calculation of GE cannot generally be interpreted as
substructural contributions to affinity because summation of values of G (N 0) cannot
reproduce the dependency of G (N 1) on C.

20
The GE analysis in S2007 [34] was performed using data from a fragment growing project
directed against protein kinase B (PKB) that is summarized in Figure 3. The G values in
S2007 had been calculated from IC50 measurements and, in one case (1), KD estimated from
crystallographic occupancy [34]. The structural prototype 1 (NnH = 5) that defines the series, is
included in the data set although it was not the initial screening hit. Affinity measurements are
rare for fragments of this size and are particularly valuable for mapping biophysical limits of
binding. The slope of the line joining each pair of results in Figure 3B indicates the sensitivity
of affinity to an increase in molecular size for each structural transformation and in some cases
this is equal to GE. Compound 5 is racemic and so [56] can be considered to be a composite
transformation consisting of both chloro-substitution and chiral resolution. The (pIC50/NnH)
value of 0.37 per non-hydrogen atom for [36] would place it on the Q3 reference line for the
F2L optimizations surveyed in J2018 [75].
A
B
Figure 3. (A) Compounds described in S2007 [75] group efficiency study (B) Plot of G
against NnH; broken lines indicate steps corresponding to addition of pyrazole.

21
S2007 [34] reports a GE value of 1.5 kcal/mol per non-hydrogen atom for the structural
prototype 1. The substructural transformation leading to 1 poses special difficulties for G
calculation since this requires that an affinity value be assigned to a species of zero molecular
size. The G value for this transformation was derived [34] by subtracting an estimate for
rigid body entropy (Grigid = 4.2 kcal/mol) lost on binding from the G value for 1. The large
GE value calculated for 1 is presented [34] as evidence that the interactions of pyrazole
substructure with the PKB make a particularly large contribution to affinity. One interpretation
of the analysis presented in S2007 [34] appears to be that to be that the molecular interactions
of the pyrazole substructure of 6 are assigned full credit for overcoming the penalties resulting
from loss of translational and rotational entropy. This interpretation appears to be based on
two assumptions. First, 1 and 6 lose identical amounts of rigid body entropy when they bind to
PKB. Second, the pyrazole substructure makes identical interactions with the protein when 1
and 6 bind to PKB.
In SAR analysis, it would not be considered generally feasible to infer the importance of a
substructure as a determinant of affinity using only measurements for compounds in which the
substructure is conserved. Calculation of GE for 1 appears to require that a value of KD be
assigned to a species of zero molecular size. The value of GE derived in this manner is
determined just as much by the affinity assumed for the zero molecular size species as by the
affinity that is actually measured for the compound. The G values for 7 (5.9 kcal/mol) and
6 (10.6 kcal/mol) can also be used to derive a GE value of (0.9 kcal/mol per non-hydrogen
atom) for the addition of the pyrazole to 6. It is unclear why the GE value of 1.5 kcal/mol per
non-hydrogen atom is preferred to the value of 0.9 kcal/mol per non-hydrogen atom that can
be derived from the G values measured for 6 and 7.
The F2L optimization in S2007 [34] is essentially a sequence of substitutions and G values
can be associated with structural modifications in a consistent manner. Drug design frequently
consists of optimization of groups at two or more substitution sites on a scaffold and non-
additive [86-91] SAR needs to be considered. Free and Wilson [51] were fully aware of the
problems that can result from non-additive SAR and it is not possible to assign G values
(and therefore GE values) in a consistent manner to individual structural modifications if SAR
is non-additive. Subadditive SAR should be should be anticipated whenever there is a high
degree of constraint in the system and might be considered to be a natural consequence of high

22
molecular complexity [18]. Structural features likely to constrain ligand-target binding include
conformational rigidity and multiple hydrogen bonds between ligand and protein.
Figure 4 illustrates some of the difficulties in using GE in analysis of SAR. The two GE
values reported [3] for the Hsp90 inhibitor shown in Figure 4A were derived from published
SAR [92] that is summarized in Figure 4B. The (pKD/NnH) value of 0.8 per non-hydrogen
atom for [912] would place it in the top quartile of the F2L optimizations surveyed in J2018
[75]. Addition of the second hydroxyl group and merging the diethylamino group with a
benzene ring each appears to result in an affinity increase of two orders of magnitude. However,
it is not possible to determine whether or not the SAR is additive without knowing the affinity
for 11. Graphics such as Figure 4A cannot capture the order in which the structural
transformations are carried out and, in some cases, even the starting point for the transformation
is not clear. For example, it is not possible to determine from Figure 4A whether the isoindoline
in 8 had been derived from the corresponding dimethylamino, diethylamino or pyrrolidinyl
group.
A
B
Figure 4. (A) Group efficiency values reported in reference 3 for an HSP90 inhibitor (B)
SAR of HSP90 inhibitors from reference 92

23
MAXIMAL AFFINITY OF LIGANDS AND FIT QUALITY
K1999 [32] explored the limits that protein structure may impose on affinity and it is also is
widely regarded to have introduced the LE concept. K1999 [32] uses affinity measurements
against multiple targets and medicinal chemists should not automatically assume that this study
is directly relevant to specific targets on which they may be working. Put another way, if a
micromolar activity against a target of interest has been observed for a compound, how useful
is it to know that another compound of comparable molecular size has shown picomolar affinity
against another target? Sample size is an important consideration in studies of biophysical
limits of affinity since the observation of maximal affinity can be regarded as a relatively rare
event. How many observations of affinity against how many targets would one need to make
for compounds with 20 non-hydrogen atoms in order to have a 95% chance of observing
affinity within 1.4 kcal/mol of a theoretical affinity limit for compounds of this molecular size?
K1999 [32] analyzes the relationship between Gbinding (numerically equivalent to G for
C 1 M) and number of non-hydrogen atoms:
“If we ignore simple cations and anions, the data show a sharp improvement in binding free
energy until 15 heavy atoms per molecule. The Gbinding binding of the tightest-binding
ligands then plateaus at 15 kcal/mol (i.e., picomolar dissociation constants). The initial
slope is approximately 1.5 kcal/mol per atom.”
While the response of G to NnH (0.44 kcal/mol per non-hydrogen atom) shown in Figure
3B is much less steep than the initial response of Gbinding to NnH (1.5 kcal/mol per non-
hydrogen atom) reported by K1999 [32], its linearity appears to be maintained over the entire
molecular size range (5 NnH 21) for the data. The findings from K1999 [32] do not appear
to provide insights that would be useful for the interpretation of the results shown in Figure 3B
and this reflects the fact that affinity measured against multiple targets was used for the analysis
in that study. While the Gbinding values used in K1999 [32] do not depend on C, the line
describing the initial response of Gbinding to NnH was constrained to pass through the point
(NnH = 0; Gbinding = 0). Shultz noted [93] that imposition of this constraint (equivalent to
assuming that KD = 1 M for zero molecular size) is likely to have biased the estimate for the
steepness of the initial response and others [8] subsequently made similar observations.

24
The response of maximal affinity to molecular size shown in K1999 [32] might be anticipated
from consideration of molecular complexity [18] and it provides support for the view that
additivity [86-91] in SAR decreases with molecular size. Although the choice of intercept in
the K1999 [32] has been criticized [8,93], the response of maximal affinity to molecular size
was modeled directly in the study. In contrast, Reynolds, Tounge and Bembenek (RTB2008)
[94] modeled the response of maximal LE to molecular size. RTB2008 [94] asserted that
“ligand efficiency is dependent on ligand size with smaller ligands having greater efficiencies,
on average, than larger ligands” and M2014 [58] repeated this assertion. As shown in Figure
1B, the apparently greater efficiency of smaller ligands can reflect the choice of unit used to
express affinity and, therefore, should be not interpreted as having any special significance.
RTB2008 [94] uses fit quality (FQ) to normalize LE with respect to molecular size and claims
that “the fit quality score provides a simple method for directly measuring how optimally a
ligand binds relative to other ligands of any size” [94]. However, the results presented in Table
1 show that it is not valid to claim that LE measures how optimally a ligand binds, even to a
single protein, since rankings of compounds can vary with the concentration unit in which KD
is expressed. Given that the degree to which a ligand binds optimally has not been shown to be
an experimental observable, it would not be valid to make a claim for direct measurement even
if perception of efficiency was independent of C. FQ was introduced to address a perceived
deficiency of LE and it has been stated [59] that “LE can break down when comparing ligands
of disparate size (LLE, FQ and size independent ligand efficiency [SILE] are better).”
The calculation of FQ involves first deriving the LE_Scale function by modelling the
maximal LE as a function of NnH to provide a reference for scaling LE values [94]. FQ is
defined as the ratio of LE to LE_Scale which means that it is simply a ratio of G values and
therefore dependent on C. This is a separate issue from the dependence of LE on C since the
comparison between LE and LE_Scale is made using the same value of NnH. Although it should
be possible to address the problems associated with using G ratios by using G, there
remains the issue that affinity values used for the calculation of LE and LE_scale do not
generally correspond to the same protein. This means that a low value of FQ could just as
plausibly be explained by low TIP of the target as by suboptimal interactions with the target.
The analysis presented in RTB2008 [94] can also be criticized from a general cheminformatic
perspective. While the dependence of maximal binding affinity on molecular size may be of
interest to drug discovery scientists, there are a number of reasons why this relationship would

25
be better modelled directly with G (or pKD) as the dependent variable and NnH as the
independent variable. First, using affinity as the dependent variable means that there are none
of the difficulties caused by the dependence of LE on C since a change in C simply shifts
affinity by a constant amount that is independent of molecular size. Second, it is not generally
possible to assess quality of fit in a meaningful manner when fitting a quantity (e.g., pKD/NnH)
that depends explicitly on the independent variable (e.g., NnH). This is because, to some extent,
the modelling process involves fitting the independent variable to itself. Third, scaling affinity
by molecular size also scales the uncertainty in the affinity by molecular size and this needs to
be properly accounted for when performing the regression analysis. Sheridan has debunked the
suggestion that LE is inherently more predictable than affinity [95].
ALTERNATIVES TO LIGAND EFFICIENCY FOR NORMALIZATION OF AFFINITY
Despite the criticisms made of the LE metric and its variants, the view that the best compounds
punch above their weight is still valid. While it does not appear possible to define LE
objectively in an absolute sense, the H2006 [33] and S2007 [34] studies showed that efficiency
can be defined in relative terms. With appropriate data analysis, it may be possible to establish
a particular value of (pKD/NnH) as indicative that two compounds bind with equal efficiency.
LE was introduced [1] as a means to normalize affinity with respect to molecular size and
this raises the question of whether or not meaningful normalization can be achieved without
having to assume a particular value of C. Although GE does not vary with C, this metric is
associated with structural transformations, rather than compounds, and so cannot be used to
normalize affinity of compounds. To describe data as normalized would generally imply that
some preliminary analysis has been performed on the data. For example, one might subtract
the mean molecular weight for the fragments in a screening library from the molecular weight
of each fragment. Mean-centering data in this manner makes it possible to determine at a glance
whether or not a fragment in the library is larger than average.
Affinity can be normalized with respect to design risk factors such as molecular size in a
manner that is analogous to mean-centering by using the trend in the data instead of the mean.
This is analogous to the approach that was used in the ACM1984 study [52] and has been
outlined in previous studies [8,42]. The response of affinity to molecular size is first modelled
so that the trend in the data can be represented by the pKD values predicted by the model.

26
Affinity is then normalized by subtraction of predicted pKD from the experimentally measured
value (this difference is conventionally referred to as the residual):
𝑝𝐾𝐷[𝑟𝑒𝑠𝑑] = 𝑝𝐾𝐷[𝑒𝑥𝑝𝑡] − 𝑝𝐾𝐷[𝑝𝑟𝑒𝑑] (14)
A large absolute value of a residual can be seen as a type of activity cliff [37,38] and the
most interesting SAR is likely to be associated with the most deviant values. A large positive
residual could reflect a different type of molecular interaction while a large negative residual
might be linked to the absence of a key molecular recognition element. Affinity (or potency)
should always be plotted as a function of molecular size during the course of an F2L project
and even a weak trend can be used to normalize data. Modelling the data in the initial stages of
an F2L project may indicate the likely response of affinity to a further increase in molecular
size and the greater sensitivity to structural elaboration of one fragment hit may trump the
greater potency of another when setting priorities.
A
B
Figure 5. Normalization of data from reference 34 (A) Data set includes 7 (B) Data set
excludes 7
This approach to normalization of affinity with respect to molecular size can be illustrated
using the data from S2007 [34]. The results of fitting G to NnH are shown in Figure 5 and
summarized in Table 3. The large negative residual (1.7 kcal/mol) for 7 shown in Figure 5A
highlights the importance of the pyrazole substructure for affinity. One advantage of analyzing

27
the data in this manner is that all compounds are treated equivalently in the analysis so there is
no need to make a special case of the structural prototype 1.
Once it has been established that the pyrazole substructure is important for affinity, the non-
pyrazole 7 can be excluded from the dataset to enable affinity to be normalized for the pyrazoles
(Figure 5B). The results in Table 3 show a very strong relationship (R2 = 0.98; RMSE = 0.42
kcal/mol) between G and NnH and practically all the variation in G for these compounds
can be explained by differences in molecular size. The two residuals of greatest magnitude
correspond to 5 (0.6 kcal/mol) and 6 (+0.5 kcal/mol) and these values reflect the large GE
value of 1.6 kcal/mol per non-hydrogen atom reported for the [56] transformation. A
significant portion ( 0.4 kcal/mol) of the residual for 5 can probably be explained by its
racemic nature. Had the more active enantiomer of 5 been used in the analysis, the GE value
for the chloro-substitution might have been 1.2 kcal/mol per non-hydrogen atom rather than
1.6 kcal/mol per non-hydrogen atom as reported in S2007.35 Both the residual for 6 and the GE
value for the [56] transformation highlight the importance of the chloro substituent as a
molecular recognition element in this system. Given that the pyrazole ring is present in all
structures, it is not possible to draw any inference about the contribution of this molecular
recognition element to affinity although the excellent linear fit to the data shown in Figure 5B
is consistent with a view that structural elaboration did not compromise the hydrogen bonding
between pyrazole and the hinge region of PKB.
Table 3. Results of fitting linear model to data from S2007 study
G/(kcal/mol) A0 + (A1 NnH)
Dataset N a A0 SE A0 b A1 SE A1
c RMSE d R2 e
Compounds 1 – 7 7 0.85 1.00 0.42 0.07 0.89 0.89
Compounds 1 – 6 6 0.87 0.48 0.44 0.03 0.42 0.98
a Number of observations
b Standard error in A0
c Standard error in A1
d Root mean square error
e Coefficient of determination

28
Analyzing affinity data in this manner effectively partitions MSE for a compound into a term
that characterizes the steepness of response of affinity to molecular size for the particular
selection of compounds and a residual term that quantifies the extent to which the affinity of a
compound beats (or is beaten by) the trend in the data. The residuals are invariant with respect
to change in C so there is no change in perception if affinity is expressed using a different
concentration unit. Although residuals cannot be used to define efficiency in an absolute sense,
compounds can still be ranked and there is no requirement, as is the case for analysis based on
GE [34,85], that the compounds be structurally related. Affinity can be normalized with respect
to other risk factors (e.g., lipophilicity) using residuals and other properties (e.g., aqueous
solubility) can be normalized in an analogous manner. When using residuals for normalization
of affinity, there is no requirement that the model be either linear or univariate. This means
that affinity can be normalized with respect to more than one risk factor in a single analysis.
Drug discovery scientists typically need be able to address a range of questions when
interrogating project data. For example, it may be useful to focus analysis on the most active
compounds in an optimization project. It is important to stress that residuals are not generated
in isolation and they result from analysis that, arguably, should be performed anyway. The line
fit to a plot of affinity against molecular size is likely to be a better predictor of outcome than
a line that has been artificially forced to intercept the affinity axis at a point corresponding to a
KD value of 1 M [8]. The strength of the trend also provides an indication of how useful
normalization of the data is likely to be. For example, the observation of a very weak correlation
between affinity and molecular size for hits from a fragment screen suggests that molecular
size need not be accounted for when assessing the fragment hits in question. In an optimization
project, a relatively weak correlation between affinity and molecular size may point to SAR
that is specific to the extent that it cannot be adequately explained by molecular size alone.
29
CONCLUSIONS
LE has been discussed in depth from a physicochemical perspective in this study and the
difficulty of interpreting affinity in terms of molecular interactions was highlighted. The
nontrivial dependency of LE on the concentration unit in which affinity is expressed means
that LE has no physical significance and, strictly, should not even be considered to be a metric.
As such, LE is unsuitable for ranking compounds, setting acceptability thresholds for affinity
and modeling relationships between affinity and molecular size. While it does not appear to be
possible to quantify efficiency of binding objectively for compounds in an absolute manner,
efficiency can still be defined in a relative manner by scaling affinity differences by the
corresponding molecular size differences.
AUTHOR INFORMATION
Corresponding Author
*Email, [email protected]
ACKNOWLEDGMENT
I thank Michael Gilson for helpful comments on the manuscript.
ABBREVIATIONS
C, standard concentration, FBLD, fragment-based lead discovery; FQ, fit quality; F2L,
fragment-to-lead; GE, group efficiency; IC50 , half maximal inhibitory concentration; KD,
dissociation constant; LE, ligand efficiency; LE_Scale, estimate for maximal ligand efficiency
as function of NnH; LipE, lipophilic efficiency; LLE, ligand lipophilicity efficiency or lipophilic
ligand efficiency; logD, base 10 logarithm of octanol/water distribution coefficient; logP, base
10 logarithm of octanol/water partition coefficient; NnH, number of non-hydrogen atoms in a
molecular structure; P, octanol/water partition coefficient; pIC50, log10(IC50/M); pKD,
log10(KD/M); pKD[expt], experimentally measured pKD; pKD[pred], value of pKD predicted
by model; pKD[resd], residual pKD; R, gas constant; Ro3, rule of 3; Ro5, rule of 5; T,
thermodynamic temperature; TIP, target interaction potential; g, ligand efficiency calculated
from standard free energy of binding ; G, standard free energy of binding; N, change in
number of chemical species; bind, ligand efficiency calculated from logarithmically expressed
KD without energy units.

30
REFERENCES
1. Hopkins AL, Groom CR, Alex A (2004) Ligand efficiency: a useful metric for lead selection. Drug
Discov Today 9:430-431. http://doi.org/10.1016/S1359-6446(04)03069-7
2. Abad-Zapatero C, Perisic O, Wass J, Bento PA, Overington J, Al-Lazikani B, Johnson ME (2010)
Ligand efficiency indices for an effective mapping of chemico-biological space: the concept of an
atlas-like representation. Drug Discov Today 2010, 15, 804-811.
http://doi.org/10.1016/j.drudis.2010.08.004
3. Hopkins AL, Keseru GM, Leeson PD, Rees DC, Reynolds CH (2014) The role of ligand efficiency
metrics in drug discovery. Nat Rev Drug Discov 13:105-121. http://doi.org/10.1038/nrd4163
4. Meanwell NA (2016) Improving drug design: an update on recent applications of efficiency metrics,
strategies for replacing problematic elements, and compounds in nontraditional drug space. Chem Res
Toxicol 29:564-616. http://dx.doi.org/10.1021/acs.chemrestox.6b00043
5. Cavalluzzi MM, Mangiatordi GF, Moro A, Nicolotti O, Lentini G (2017) Ligand efficiency metrics in
drug discovery: the pros and cons from a practical perspective. Exp Opin Drug Discov 12:1087-1104. http://doi.org/10.1080/17460441.2017.1365056
6. Young RJ, Leeson PD (2018) Mapping the efficiency and physicochemical trajectories of successful
optimizations. J Med Chem 61:6421-6467. http://dx.doi.org/10.1021/acs.jmedchem.8b00180
7. Zhou HX, Gilson MK (2009) Theory of free energy and entropy in noncovalent binding. Chem Rev
109:4092-4107. http://doi.org/10.1021/cr800551w
8. Kenny PW, Leitão A, Montanari CA (2014) Ligand efficiency metrics considered harmful. J. Comput
Aided Mol Des 28:699-710. http://doi.org/10.1007/s10822-014-9757-8
9. Matta CF, Massa L, Gubskaya AV, Knoll E (2011) Can one take the logarithm or the sine of a
dimensioned quantity or a unit? Dimensional analysis involving transcendental functions. J Chem Educ
88:67-70. http://dx.doi.org/10.1021/ed1000476
10. Birch AM, Kenny PW, Simpson I, Whittamore PRO (2009) Matched molecular pair analysis of activity
and properties of glycogen phosphorylase inhibitors. Bioorg Med Chem Lett 19:850-853.
http://doi.org/10.1016/j.bmcl.2008.12.003
11. Chodera JD, Mobley DL, Shirts MR, Dixon RW, Branson K, Pande VS (2011) Alchemical free energy
methods for drug discovery: progress and challenges. Curr Opin Struct Biol 21:150-160.
http://doi.org/10.1016/j.sbi.2011.01.011
12. Cournia Z, Allen B, Sherman W (2017) Relative binding free energy calculations in drug discovery:
recent advances and practical considerations. J Chem Inf Model 57:2911-2937.
http://dx.doi.org/10.1021/acs.jcim.7b00564
13. Nicolaou CA, Brown N (2013) Multi-objective optimization methods in drug design. Drug Discov Today
Technol 10:e427-e435. http://doi.org/10.1016/j.ddtec.2013.02.001
14. Kenny PW, Montanari CA (2013) Inflation of correlation in the pursuit of drug-likeness. J Comput-
Aided Mol Des 2013, 27, 1-13. http://doi.org/10.1007/s10822-012-9631-5
15. Mateus A, Matsson P, Artursson P (2013) Rapid measurement of intracellular unbound drug
concentrations. Mol Pharm 10:2467-2478. http://dx.doi.org/10.1021/mp4000822
16. Gordon LJ, Allen M, Artursson P, Hann MM, Leavens BJ, Mateus A, Readshaw S, Valko K, Wayne
GJ, West A (2016) Direct measurement of intracellular compound concentration by RapidFire mass
spectrometry offers insights into cell permeability. J Biomol Screen 21:156-164.
http://doi.org/10.1177/1087057115604141
17. Oprea TI, Davis AM, Teague SJ, Leeson PD (2001) Is there a difference between leads and drugs? A
historical perspective. J Chem Inf Comput Sci 41:1308-1315. http://dx.doi.org/10.1021/ci010366a

31
18. Hann MM, Leach AR, Harper G (2001) Molecular complexity and its impact on the probability of finding
leads for drug discovery. J Chem Inf Comp Sci 41:856-864. http://dx.doi.org/10.1021/ci000403i
19. Teague SJ, Davis AM, Leeson PD, Oprea T (1999) The design of leadlike combinatorial libraries. Angew
Chem Int Ed Engl 38:3743-3748. http://doi.org/10.1002/(SICI)1521-3773(19991216)38:24<3743::AID-
ANIE3743>3.0.CO;2-U
20. Lipinski CA, Lombardo F, Dominy BW, Feeney PJ (1997) Experimental and computational approaches
to estimate solubility and permeability in drug discovery and development settings. Adv Drug Delivery
Rev 23:4-25. http://doi.org/10.1016/S0169-409X(96)00423-1
21. Boehm HJ, Boehringer M, Bur D, Gmuender H, Huber W, Klaus W, Kostrewa D, Kuehne, H, Luebbers
T, Meunier-Keller N, Mueller F (2000) Novel inhibitors of DNA gyrase: 3D structure based biased
needle screening, hit validation by biophysical methods, and 3D guided optimization. A promising
alternative to random screening. J Med Chem 43:2664-2674. http://doi.org/10.1021/jm000017s
22. Blomberg N, Cosgrove DA, Kenny PW, Kolmodin K (2009) Design of compound libraries for fragment
screening. J Comput Aided Mol Des 23:513-525. http://doi.org/10.1007/s10822-009-9264-5
23. Nicholls A, McGaughey GB, Sheridan RP, Good AC, Warren G, Mathieu M, Muchmore SW, Brown
SP, Grant JA, Haigh JA, Nevins N, Jain AN, Kelley B (2010) Molecular shape and medicinal chemistry:
A perspective. J Med Chem 53:3862-3886. http://dx.doi.org/10.1021/jm900818s
24. Richards FM (1977) Areas, volumes, packing, and protein structure. Ann Rev Biophys Bioeng 6:151-
176. http://dx.doi.org/10.1146/annurev.bb.06.060177.001055
25. Pettit FK, Bowie JU (1999) Protein surface roughness and small molecular binding sites. J Mol Biol
285:1377-1382. http://doi.org/10.1006/jmbi.1998.2411
26. Persch E, Dumele O, Diederich F (2015) Molecular recognition in chemical and biological systems.
Angew Chem Int Ed 54:3290-3327. http://doi.org/10.1002/anie.201408487
27. Bissantz C, Kuhn B, Stahl M (2010) A medicinal chemist’s guide to molecular interactions. J Med Chem
53:5061-5064. http://doi.org/10.1021/jm100112j
28. Mark AE, van Gunsteren WF (1994) Decomposition of the free energy of a system in terms of specific
interactions. Implications for theoretical and experimental studies. J Mol Biol 240:167-176.
http://doi.org/10.1006/jmbi.1994.1430
29. van de Waterbeemd H, Smith DA, Beaumont K, Walker DK (2001) Property-based design: optimization
of drug absorption and pharmacokinetics. J Med Chem. 44:1313-1333.
http://dx.doi.org/10.1021/jm000407e
30. Meanwell NA (2011) Improving drug candidates by design: a focus on physicochemical properties as a
means of improving compound disposition and safety. Chem Res Toxicol 24:1420-1456.
http://dx.doi.org/10.1021/tx200211v
31. Keserű GM, Erlanson DA, Ferenczy GG, Hann MM, Murray CW, Pickett SD (2016) Design principles
for fragment libraries − Maximizing the value of learnings from pharma fragment based drug discovery
(FBDD) programs for use in academia. J Med Chem 59:8189-8206. http://dx.doi.org/10.1021/acs.jmedchem.6b00197
32. Kuntz ID, Chen K, Sharp KA, Kollman PA (1999) The maximal affinity of ligands. Proc Natl Acad Sci
USA 96:9997-10002. http://doi.org/10.1073/pnas.96.18.9997
33. Hajduk PJ (2006) Fragment-based drug design: how big is too big? J Med Chem 49:6972-6976.
http://doi.org/10.1021/jm060511h
34. Saxty G, Woodhead SJ, Berdini V, Davies TG, Verdonk ML, Wyatt PG, Boyle RG, Barford D,
Downham R, Garrett MD, Carr RA (2007) Identification of inhibitors of protein kinase B using fragment-
based lead discovery. J Med Chem 50:2293-2296. http://dx.doi.org/10.1021/jm070091b

32
35. Hammett LP (1937) The effect of structure upon the reactions of organic compounds. Benzene
derivatives. J Am Chem Soc 59:96-103. http://dx.doi.org/10.1021/ja01280a022
36. Hammett LP (1938) Linear free energy relationships in rate and equilibrium phenomena. J Chem Soc
Faraday Trans 34:156-165. http://dx.doi.org/10.1039/TF9383400156
37. Maggiora GM (2006) On outliers and activity cliffs – Why QSAR often disappoints. J Chem Inf Model
46:1535-1535. http://doi.org/10.1021/ci060117s
38. Stumpfe D, Bajorath J (2012) Exploring activity cliffs in medicinal chemistry. J Med Chem 55:2932-
2942. http://doi.org/10.1021/jm201706b
39. Gilson MK, Given JA, Bush BL, McCammon JA (1997) The statistical-thermodynamic basis for
computation of binding affinities: a critical review. Biophys J 72:1047-1069.
http://doi.org/10.1016/S0006-3495(97)78756-3
40. Leeson PD, Springthorpe B (2007) The influence of druglike concepts on decision-making in medicinal
chemistry. Nat Rev Drug Discov 6:881-890. http://doi.org/10.1038/nrd2445
41. Ryckmans T, Edwards MP, Horne VA, Correia AM, Owen DR, Thompson LR, Tran I, Tutt MF, Young
T (2009) Rapid assessment of a novel series of selective CB2 antagonists using parallel synthesis
protocols: a lipophilic efficiency analysis. Bioorg Med Chem Lett 19:4406-4409.
https://doi.org/10.1016/j.bmcl.2009.05.062
42. Borges NM, Kenny PW, Montanari CA, Prokopozyk IM, Ribeiro JF, Rocha JR, Sartori GR (2017) The
influence of hydrogen bonding on partition coefficients. J Comput-Aided Mol Des 31:163-181.
http://doi.org/10.1007/s10822-016-0002-5
43. Maynard AT, Roberts CD (2016) Quantifying, visualizing, and monitoring lead optimization. J Med
Chem 59:4189-4201. http://dx.doi.org/10.1021/acs.jmedchem.5b00948
44. Fiedler K (2011) Voodoo correlations are everywhere — Not only in neuroscience. Perspect Psychol Sci
6:163-171. http://doi.org/10.1177/1745691611400237
45. Hopkins AL, Mason JS, Overington JP (2006) Can we rationally design promiscuous drugs? Curr Opin
Struct Biol 16:127-136. http://doi.org/10.1016/j.sbi.2006.01.013
46. Cumming JG, Davis AM, Muresan S, Haeberlein M, Chen H. Chemical predictive modelling to improve
compound quality. Nature Rev Drug Discov 12:948-962. http://doi.org/10.1038/nrd4128
47. Oprea TI, Hasselgren C (2017) Predicting target and chemical druggability. In Comprehensive Medicinal
Chemistry III; Chackalamannil S, Rotella D, Ward S, Eds; Elsevier pp 429-439.
http://dx.doi.org/10.1016/B978-0-12-409547-2.12342-X
48. Leeson PD, Young RJ (2015) Molecular property design: does everyone get it? ACS Med Chem Lett
6:722-725. http://dx.doi.org/10.1021/acsmedchemlett.5b00157
49. Scott DE, Coyne AG, Hudson SA, Abell C (2012) Fragment-based approaches in drug discovery and
chemical biology. Biochem 51:4990-5003. http://dx.doi.org/10.1021/bi3005126
50. Jencks WP (1981) On the attribution and additivity of binding energies. Proc Natl Acad Sci USA
78:4046-4050. http://doi.org/10.1073/pnas.78.7.4046
51. Free SM, Wilson JW (1964) A Mathematical contribution to structure-activity studies. J Med Chem
7:395-399. http://doi.org/10.1021/jm00334a001
52. Andrews PR, Craik DJ, Martin JL (1984) Functional group contributions to drug-receptor interactions. J
Med Chem 27:1648-1657. http://dx.doi.org/10.1021/jm00378a021
53. Reynolds CH, Reynolds RC (2017) Group additivity in ligand binding affinity: an alternative approach
to ligand efficiency. J Chem Inf Model 57:3086-3093. http://dx.doi.org/10.1021/acs.jcim.7b00381
33
54. Ladbury JE (2007) Enthalpic efficiency and the role of thermodynamic data in drug development:
possibility or a pipeline dream. Eur Pharm Rev 12:59-62.
http://www.europeanpharmaceuticalreview.com/article/1835/enthalpic-efficiency-and-the-role-of-
thermodynamic-data-in-drug-development-possibility-or-a-pipeline-dream/
55. Bogan AA, Thorn KS (1998) Anatomy of hot spots in protein interfaces. J Mol Biol 280:1-9.
http://doi.org/10.1006/jmbi.1998.1843
56. Edfeldt FNB, Folmer RHA, Breeze AL (2011) Fragment screening to predict druggability (ligandability)
and lead discovery success. Drug Discov Today 16:284-287. http://doi.org/10.1016/j.drudis.2011.02.002
57. Krimmer SG, Cramer J, Schiebel J, Heine A, Klebe G (2017) How nothing boosts affinity: hydrophobic
ligand binding to the virtually vacated S1′ pocket of thermolysin. J Am Chem Soc 139:10419-10431.
http://dx.doi.org/10.1021/jacs.7b05028
58. Murray CW, Erlanson DA, Hopkins AL, Keserü GM, Leeson PD, Rees DC, Reynolds CH, Richmond
NJ (2014) Validity of ligand efficiency metrics. ACS Med Chem Lett 5:616-618.
http://doi.org/10.1021/ml500146d
59. Reynolds CH (2015) Ligand efficiency metrics: why all the fuss? Future Med Chem 7:1363-1365.
http://doi.org/10.4155/fmc.15.70
60. May PC, Dean RA, Lowe SL, Martenyi F, Sheehan SM, Boggs LN, Monk SA, Mathes BM, Mergott DJ,
Watson BM, Stout SL, Timm DE, LaBell ES, Gonzales CR, Nakano M, Jhee SS, Yen M, Ereshefsky L,
Lindstrom TD, Calligaro DO, Cocke PJ, Hall DG, Friedrich S, Citron M, Audia JE (2011) Robust central
reduction of Amyloid-β in humans with an orally available, non-peptidic β-secretase inhibitor. J
Neurosci 31:16507-16516. http://doi.org/10.1523/JNEUROSCI.3647-11.2011
61. Czaplewski LG, Collins I, Boyd EA, Brown D, East SP, Gardiner M, Fletcher R, Haydon DJ, Henstock
V, Ingram P, Jones C, Noula C, Kennison L, Rockley C, Rose V, Thomaides-Brears HB, Ure R,
Whittaker M, Stokes NR (2009) Antibacterial alkoxybenzamide inhibitors of the essential bacterial cell
division protein FtsZ. Bioorg Med Chem Lett 19:524-527. http://doi.org/10.1016/j.bmcl.2008.11.021
62. Doak BC, Zheng J, Dobritzsch D, Kihlberg J (2016) How beyond rule of 5 drugs and clinical candidates
bind to their targets. J Med Chem 59:2312-2327. http://dx.doi.org/10.1021/acs.jmedchem.5b01286
63. Verlinde CLJ, Rudenko G, Hol WG (1992) In search of new lead compounds for trypanosomiasis drug
design: A protein structure-based linked-fragment approach. J. Comput-Aided Mol Des 6:131-147.
https://doi.org/10.1007/BF00129424
64. Carr RA, Congreve M, Murray CW, Rees DC (2005) Fragment based lead discovery: leads by design.
Drug Discov Today 10:987-992. http://doi.org/10.1016/S1359-6446(05)03511-7
65. Albert JS, Blomberg N, Breeze AL, Brown AJ, Burrows JN, Edwards PD, Folmer RH, Geschwindner S,
Griffen EJ, Kenny PW, Nowak T, Olsson LL, Sanganee H, Shapiro AB (2007) An integrated approach
to fragment-based lead generation: philosophy, strategy and case studies from AstraZeneca’s drug
discovery programmes. Curr Top Med Chem 7:1600-1629. http://doi.org/10.2174/156802607782341091
66. Hubbard RE, Murray JB (2011) Experiences in fragment-based lead discovery. Methods Enzymol
493:509-531. https://doi.org/10.1016/B978-0-12-381274-2.00020-0
67. Davis BJ, Roughley SD (2017) Fragment-based lead discovery. Ann Rep Med Chem 50:371-439.
http://doi.org/10.1016/bs.armc.2017.07.002
68. Lamoree B, Hubbard RE (2017) Current perspectives in fragment-based lead discovery (FBLD). Essays
Biochem 61:453-464. http://dx.doi.org/10.1042/EBC20170028
69. Miranker A, Karplus M (1991) Functionality maps of binding sites: a multiple copy simultaneous search
method. Proteins 11:29-34. http://doi.org/10.1002/prot.340110104
70. Böhm H-J (1992) The computer program LUDI: a new method for the de novo design of enzyme
inhibitors. J Comput-Aided Mol Des 6:61-78. http://doi.org/10.1007/BF00124387

34
71. Allen KN, Bellamacina CR, Ding X, Jeffery CJ, Mattos C, Petsko GA, Ringe D (1996) An experimental
approach to mapping the binding surfaces of crystalline proteins. J Phys Chem 100:2605-2611.
http://doi.org/10.1021/jp952516o
72. Shuker SB, Hajduk PJ, Meadows RP, Fesik SW (1996) Discovering high-affinity ligands for proteins:
SAR by NMR. Science 274:1531-1534. http://doi.org/10.1126/science.274.5292.1531
73. McCoy MA, Wyss DF (2002) Spatial localization of ligand binding sites from electron current density
surfaces calculated from NMR chemical shift perturbations. J Am Chem Soc 124:11758-11763.
http://dx.doi.org/10.1021/ja026166c
74. Erlanson DA, Fesik SW, Hubbard RE, Jahnke W, Jhoti H (2016) Twenty years on: the impact of
fragments on drug discovery. Nat Rev Drug Discov 15:605-619. http://dx.doi.org/10.1038/nrd.2016.109
75. Johnson CN, Erlanson DA, Jahnke W, Mortenson PN, Rees DC (2018) Fragment-to-lead medicinal
chemistry publications in 2016. J Med Chem 61:1774-1784.
http://dx.doi.org/10.1021/acs.jmedchem.7b01298
76. Mannhold R, Poda GI, Ostermann C, Tetko IV (2009) Calculation of molecular lipophilicity: State-of-
the-art and comparison of log P methods on more than 96000 compounds. J Pharm Sci 98:861-893. http://doi.org/10.1002/jps.21494
77. Congreve M, Carr R, Murray C, Jhoti H (2003) A “rule of three” for fragment-based lead discovery?
Drug Discov Today 8:876-877. http://doi.org/10.1016/S1359-6446(03)02831-9
78. Köster H, Craan T, Brass S, Herhaus C, Zentgraf M, Neumann L, Heine A, Klebe GA (2011) Small
nonrule of 3 compatible fragment library provides high hit rate of endothiapepsin crystal structures with
various fragment chemotypes, J Med Chem 54:7784-7796. http://dx.doi.org/10.1021/jm200642w
79. Meanwell NA (2011) Synopsis of some recent tactical application of bioisosteres in drug design. J Med
Chem 54:2529-2591. http://doi.org/10.1021/jm1013693
80. Herr RJ (2002) 5-Substituted-1H-tetrazoles as carboxylic acid isosteres: medicinal chemistry and
synthetic methods. Bioorg Med Chem 10:3379-3393. http://doi.org/10.1016/S0968-0896(02)00239-0
81. Ammazzalorso A, De Filippis B, Giampietro L, Amoroso R (2017) N-acylsulfonamides: synthetic routes
and biological potential in medicinal chemistry. Chem Biol Drug Des 90:1094-1105.
http://doi.org/10.1111/cbdd.13043
82. Geschwindner S, Olsson LL, Albert JS, Deinum J, Edwards PD, Beer T, Folmer RH (2007) Discovery
of a novel warhead against beta-secretase through fragment-based lead generation. J Med Chem 50:5903-
5911. http://doi.org/10.1021/jm070825k
83. Edwards P D, Albert J S, Sylvester M, Aharony D, Andisik D, Callaghan O, Campbell J B, Carr R A,
Chessari G, Congreve M, Frederickson M, Folmer R H, Geschwindner S, Koether G, Kolmodin K,
Krumrine J, Mauger R C, Murray C W, Olsson L L, Patel S, Spear N, Tian G (2007) Application of
fragment-based lead generation to the discovery of novel, cyclic amidine beta-secretase Inhibitors with
nanomolar potency, cellular activity, and high ligand efficiency. J Med Chem 50:5912-5925. https://doi.org/10.1021/jm070829p
84. Silva DG, Ribeiro JFR, De Vita D; Cianni L, Franco CH, Freitas-Junior LH, Moraes CB, Rocha JR,
Burtoloso ACB, Kenny PW, Leitão A, Montanari CA (2017) A comparative study of warheads for design
of cysteine protease inhibitors. Bioorg Med Chem Lett 27:5031-5035.
https://doi.org/10.1016/j.bmcl.2017.10.002
85. Verdonk ML, Rees DC (2008) Group efficiency: a guideline for hits-to-leads chemistry. ChemMedChem
3:1179-1180. https://doi.org/10.1002/cmdc.200800132
86. Bridges AJ, Zhou H, Cody DR, Rewcastle GW, McMichael A, Showalter HD, Fry DW, Kraker AJ,
Denny WA (1996) Tyrosine kinase inhibitors. 8. An unusually steep structure-activity relationship for
analogues of 4-(3-bromoanilino)-6,7- dimethoxyquinazoline (PD 153035), a potent inhibitor of the
epidermal growth factor receptor. J Med Chem 39:267-276. http://dx.doi.org/10.1021/jm9503613

35
87. Dill KA (1997) Additivity principles in biochemistry. J Biol Chem 272:701-704.
http://dx.doi.org/10.1074/jbc.272.2.701
88. Baum B, Muley L, Smolinski M, Heine A, Hangauer D, Klebe G (2010) Non-additivity of functional
group contributions in protein-ligand binding: a comprehensive study by crystallography and isothermal
titration calorimetry. J Mol Biol 397:1042-1054. http://doi.org/10.1016/j.jmb.2010.02.007
89. Biela A, Betz M, Heine A, Klebe G (2012) Water makes the difference: rearrangement of water solvation
layer triggers non-additivity of functional group contributions in protein-ligand binding. ChemMedChem
7:1423-1434. http://doi.org/10.1002/cmdc.201200206
90. Kramer C, Fuchs JE, Liedl KR (2015) Strong nonadditivity as a key structure–activity relationship
feature: distinguishing structural changes from assay artifacts. J Chem Inf Model 55:483-494.
http://dx.doi.org/10.1021/acs.jcim.5b00018
91. Calabrò G, Woods CJ, Powlesland F, Mey ASJS, Mulholland AJ, Michel J (2016) Elucidation of
nonadditive effects in protein-ligand binding energies: thrombin as a case study. J Phys Chem B
120:5340-5350. http://dx.doi.org/10.1021/acs.jpcb.6b03296
92. Murray CW, Carr MG, Callaghan O, Chessari G, Congreve M, Cowan S, Coyle JE, Downham R,
Figueroa E, Frederickson M, Graham B, McMenamin R, O’Brien MA, Patel S, Phillips TR, Williams G,
Woodhead AJ, Woolford A (2010) J. Fragment-based drug discovery applied to Hsp90. Discovery of
two lead series with high ligand efficiency. J Med Chem 53:5942-5955.
http://dx.doi.org/10.1021/jm100059d
93. Shultz MD (2013) Setting expectations in molecular optimizations: strengths and limitations of
commonly used composite parameters. Bioorg Med Chem Lett 23:5980-5991. https://doi.org/10.1016/j.bmcl.2013.08.029
94. Reynolds CH, Tounge BA, Bembenek SD (2008) Ligand binding efficiency: trends, physical basis, and
implications. J Med Chem 51:2432-2438. https://doi.org/10.1021/jm701255b
95. Sheridan RP (2016) Debunking the idea that ligand efficiency indices are superior to pIC50 as QSAR
activities. J Chem Inf Model 56:2253-2262. http://dx.doi.org/10.1021/acs.jcim.6b00431

download fileview on ChemRxivpwk_le_oct2018_v1.0.pdf (1.14 MiB)

The nature of ligand efficiency
Peter W. Kenny*
Berwick-on-Sea, North Coast Road, Blanchisseuse, Saint George, Trinidad and Tobago
ABSTRACT
∆ p K D
∆ NnH
≠ ∆( p K D
NnH)
Ligand efficiency is a widely used design parameter in drug discovery. It is calculated by
scaling affinity by molecular size and has a nontrivial dependency on the concentration unit
used to express affinity that stems from the inability of the logarithm function to take
dimensioned arguments. Consequently, perception of efficiency varies with the choice of
concentration unit and it is argued that the ligand efficiency metric is not physically
meaningful nor should it be considered to be a metric. The dependence of ligand efficiency on
the concentration unit can be eliminated by defining efficiency in terms of sensitivity of
affinity to molecular size and this is illustrated with reference to fragment-to-lead
optimizations. An alternative to ligand efficiency for normalization of affinity with respect to
molecular size is presented. Group efficiency and fit quality are also examined in detail from a
physicochemical perspective. The importance of examining relationships between affinity and
molecular size directly is stressed throughout this study.
Keywords: cheminformatics, drug design, drug discovery, FBDD, FBLD, fragment-based
lead discovery, fit quality, group efficiency, hit-to-lead, LE, ligand efficiency, maximal
binding affinity, medicinal chemistry, molecular design, molecular interactions, molecular
recognition, physical-organic chemistry, property-based design, thermodynamics
1

INTRODUCTION
“I know I could,” the VP of discovery responded tartly. “But what do you think you’re herefor? I could order my own consumables, too, but that’s Milo’s job. Your job is to lead us inprayers, and from now on you’re going to lead us in a prayer for more ligand efficiency inevery project. Is that clear? I think more ligand efficiency is something really worth prayingfor.”
Adapted from Joseph Heller, Catch 22
Ligand efficiency (LE) is, in essence, a good concept that is poorly served by a bad metric. It
was introduced [1] as “a useful metric for lead selection”, has been discussed at length in
reviews [2-6] and is routinely tracked in drug discovery projects. There are actually two
ligand efficiencies in drug discovery and these can be seen as different manifestations of what
might be called molecular size efficiency (MSE). First, the LE concept, sometimes
summarized as ‘bang for buck’, which can be expressed in terms of the sensitivity of affinity
to an increase in molecular size. Second, the compound-level LE metric (more accurately,
family of metrics) that was introduced [1] with a view to normalizing affinity of compounds
with respect to molecular size. While the LE concept has a solid basis, the LE metric cannot
be regarded as physically meaningful because perception of efficiency varies with the
concentration unit in which affinity is expressed [7,8]. The difficulty stems from the inability
of the logarithm function to take a dimensioned [9] argument which means that it is necessary
to scale a KD value by an arbitrary concentration unit to enable its logarithm to be calculated.
Drug design is incremental in nature. This reflects a view [10-12] that it is easier to
understand and predict differences in chemical behavior between structurally-related
compounds than it is to make absolute predictions directly from molecular structure. Drug
action is driven by concentration and affinity determines sensitivity of response to this driving
force. Drug design is a multi-objective [13] endeavor and some objectives, such as
maximization of affinity against the therapeutic target(s) and minimization of affinity against
anti-targets, can be defined clearly. Other objectives, such as controllability of exposure are
much more difficult to define and this means that drug design is typically indirect. One
2

significant difficulty [14] in drug design is that unbound intracellular concentration [15,16]
cannot generally be measured for drugs in vivo.
3
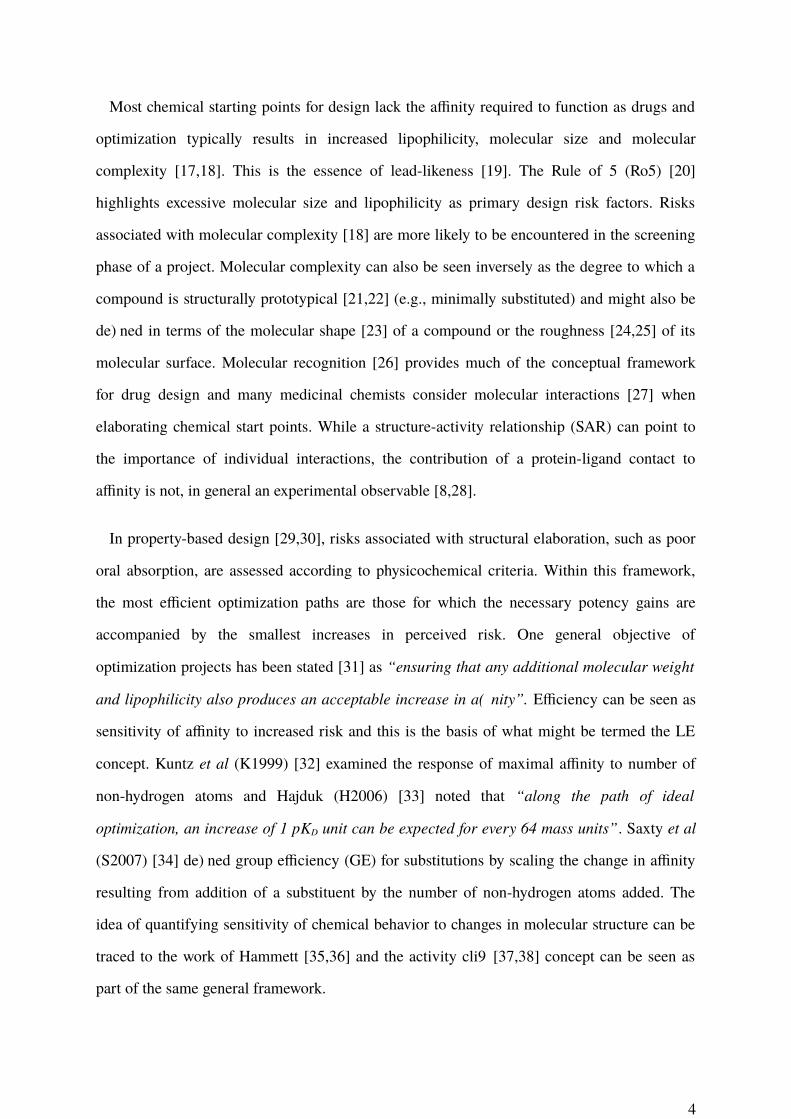
Most chemical starting points for design lack the affinity required to function as drugs and
optimization typically results in increased lipophilicity, molecular size and molecular
complexity [17,18]. This is the essence of lead-likeness [19]. The Rule of 5 (Ro5) [20]
highlights excessive molecular size and lipophilicity as primary design risk factors. Risks
associated with molecular complexity [18] are more likely to be encountered in the screening
phase of a project. Molecular complexity can also be seen inversely as the degree to which a
compound is structurally prototypical [21,22] (e.g., minimally substituted) and might also be
defined in terms of the molecular shape [23] of a compound or the roughness [24,25] of its
molecular surface. Molecular recognition [26] provides much of the conceptual framework
for drug design and many medicinal chemists consider molecular interactions [27] when
elaborating chemical start points. While a structure-activity relationship (SAR) can point to
the importance of individual interactions, the contribution of a protein-ligand contact to
affinity is not, in general an experimental observable [8,28].
In property-based design [29,30], risks associated with structural elaboration, such as poor
oral absorption, are assessed according to physicochemical criteria. Within this framework,
the most efficient optimization paths are those for which the necessary potency gains are
accompanied by the smallest increases in perceived risk. One general objective of
optimization projects has been stated [31] as “ensuring that any additional molecular weight
and lipophilicity also produces an acceptable increase in affinity”. Efficiency can be seen as
sensitivity of affinity to increased risk and this is the basis of what might be termed the LE
concept. Kuntz et al (K1999) [32] examined the response of maximal affinity to number of
non-hydrogen atoms and Hajduk (H2006) [33] noted that “along the path of ideal
optimization, an increase of 1 pKD unit can be expected for every 64 mass units”. Saxty et al
(S2007) [34] defined group efficiency (GE) for substitutions by scaling the change in affinity
resulting from addition of a substituent by the number of non-hydrogen atoms added. The
idea of quantifying sensitivity of chemical behavior to changes in molecular structure can be
traced to the work of Hammett [35,36] and the activity cliff [37,38] concept can be seen as
part of the same general framework.
4

Compound-level efficiency metrics are typically constructed by either scaling (i.e., divide
affinity by risk factor) or offsetting (i.e., subtract risk factor from affinity) [8]. LE was
introduced [1] as a metric to normalize affinity with respect to molecular size by scaling the
standard free energy of binding, G, by the number, NnH, of non-hydrogen atoms (the term
heavy atoms is also used) in the molecular structure as follows:
∆ g(T ,P ,C °)=−(∆ G °N nH
) (1)
The standard state was not specified when the LE metric was introduced [1] although it
appears to be widely believed [3] that C must be set to 1 M for calculation of LE. The
Achilles heel of the LE metric is its nontrivial dependency [7] on C and, as conventionally
[3] defined, LE has a 1 M concentration unit built into it. As noted [39] by Gilson et al, the
choice of a particular value of C, such as 1 M, to define the standard state is entirely arbitrary
and a requirement that C only take a specific value cannot be accommodated within the
framework of thermodynamics. This means that LE cannot be defined objectively in absolute
terms for individual compounds because there is no physical basis for favoring a particular
value of C for calculation of LE.
Although a quantity derived by scaling G by a risk factor does not have physical
significance, offsetting affinity by a risk factor may give a physically meaningful quantity [8].
Provided that ligand ionization is insignificant, ligand lipophilicity efficiency (LLE) [40],
which is also known as lipophilic ligand efficiency (LLE) [3] and lipophilic efficiency (LipE)
[41], can be interpreted as the ease of transfer of a ligand from 1-octanol to its binding site
[8]. Furthermore, some of the limitations of the 1-octanol/water partitioning system become
less significant when working within structural series, as is usually the case for lead
optimization [42]. While physical interpretability is certainly a desirable feature for a drug
design metric, this alone does not guarantee that a metric will be usefully predictive in drug
design.
5

The principal objectives of this study are to provide an in-depth analysis of LE (and its
variants) and to highlight ways in which consideration of LE as a concept might address the
serious deficiencies of the compound-level metric. LE is discussed in terms of molecular
interactions and binding thermodynamics and some of this discussion is likely to be generally
relevant to drug design. A recurring theme in this study is a view that it is generally better to
observe the response of affinity to molecular size directly rather than through the distorting
lens of the flawed LE metric.
6

MOLECULAR SIZE AND DESIGN RISK
It is important that drug discovery scientists be fully aware of the assumptions on which the
LE metric is based and that they carefully consider their motivation for using LE (or indeed
any design guidelines). Property-based design [29,30] can be seen in terms of balancing the
risk associated with poor physicochemical characteristics against the risk of not being able to
achieve the necessary level of affinity. Ro5 [20] is based on analysis of property distributions
of drugs (defined as compounds that had progressed into Phase 2 trials) and the assessment of
risk is indirect because non-drugs were not included in the original analysis. Ro5 [20] neither
takes account of correlations between risk factors nor does it provide a means to deconvolute
the risks associated with excessive molecular size and lipophilicity. The LE metric can be
seen as a simple means with which to balance risk and there are more rigorous and
sophisticated ways for doing this [43]. Simple drug design guidelines based on molecular size
and/or lipophilicity typically become progressively less useful as more measured data become
available to the drug discovery team.
Drug design guidelines are typically based on trends observed in data and the strengths of
these trends indicate how rigidly guidelines should be adhered to. While excessive molecular
size and lipophilicity are widely accepted as primary risk factors in design, it is unclear how
directly predictive they are of more tangible risks such as poor oral absorption, inadequate
intracellular exposure and rapid turnover by metabolic enzymes. This is an important
consideration because the strength of the rationale for using LE depends on the degree to
which molecular size is predictive of risk. Drug discovery scientists need to be wary of
correlation inflation [14] (the term voodoo correlation [44] is also used) which can be loosely
defined as presentation or analysis of data in any way that makes trends appear to be stronger
than they actually are. Correlation inflation is a particular concern when analysis of
proprietary data is presented in support of a view that a set of guidelines is especially useful
or predictive. Published analyses of relationships [40,45] between pharmacological
promiscuity and molecular size and lipophilicity exemplify the problem. Comparison of
average values without taking account of variance is one way in which trends can be made to
7

appear to be stronger than they actually are and correlation inflation is acknowledged [46,47]
as an issue in drug design. Variance in the dependent variable can also be hidden by
representing a distribution (e.g., aqueous solubility of compounds with property forecast
index in the range 6 – 7) by a single percentile (e.g., percentage of those compounds with
aqueous solubility > 200 M) [48].
The relevance of data must also be considered when using physicochemical characteristics
such as molecular size to assess risk. For example, an activity threshold [40] of > 30%
inhibition at 10 M for promiscuity analysis is not especially relevant if considering the
likelihood of off-target effects for a drug with a peak unbound plasma concentration of 100
nM. Sample bias can be significant, even in large datasets, as exemplified by divergent
conclusions of two apparently similar studies [40,45] with respect to the relationship between
pharmacological promiscuity and molecular size. The observation that average molecular
weight appears to decrease [45] with promiscuity is particularly relevant to the use of LE
because promiscuity would generally be considered [40] to be an undesirable characteristic
for a compound. Drug designers should not automatically assume that conclusions drawn
from analysis of large, structurally-diverse data sets are necessarily relevant to the specific
drug design projects on which they are working.
THERMODYNAMIC ASPECTS OF LIGAND-PROTEIN ASSOCIATION
The LE metric [1] was introduced in thermodynamic terms and it is sometimes believed that
it measures the degree to which molecular interactions between ligand and target are optimal.
For example, it has been asserted [49] “Because of these optimal interactions, fragments are
very ‘atom efficient’ binders, demonstrated by high ligand efficiency”. This section focuses on
thermodynamic [7,39] aspects of protein-ligand association most relevant to LE and to the
interpretation of affinity in terms of molecular interactions [26,27].
The standard free energy of binding, G, [39] can be written in terms of the gas constant
(R), thermodynamic temperature (T), C and the equilibrium concentrations of protein ([P]),
ligand ([L]), and protein-ligand complex ([P.L]):
8

G°=RTln( [ P ] [L][ P . L ] C ° ) (2)
Equation (2) shows that G is a function of C and this is one reason that values of standard
free energy of binding should not be termed absolute. By convention, C is taken to be 1 M
although, this is arbitrary and the value of C has no physical significance [39]. In
thermodynamic analysis, a change in perception resulting from a change in a standard state
definition would generally be regarded as a serious error rather than a penetrating insight. In
some situations, the dissociation constant, KD, is defined to be equal to the argument of the
logarithm in equation (2) and is therefore dimensionless. However, in medicinal chemistry,
biochemistry and biophysics, KD values are conventionally quoted in units of concentration
and equation (2) can be written as:
G°(T ,P ,C ° )=RTln( K D(T , P)C ° ) (3)
Equation (3) shows that a tenfold increase in C leads to a decrease in G of 1.36 kcal/mol
at 298 K. The sign of G has no special significance and simply indicates whether or not KD
is greater or less than C. The dependence of G on C is a consequence of the stoichiometry
of association of ligand with target and G for formation of a ternary complex (relevant
when considering the thermodynamic consequences of fragment linking) will exhibit a
different dependence on C to G for a binary complex. The stoichiometry corresponding to
a G value is specified by the change, N, in the number of species for the corresponding
reaction and it can also be seen as a ‘hidden dimension’ of G. For example, formation and
dissociation of 1:1 complexes have N values of 1 and +1 respectively. The value of N
determines the dimensions of the corresponding equilibrium constant:
K=¿ ( concentration)∆ N
dim ¿(4)
The dependence of G on C is a consequence of the loss of translational entropy resulting
from association and it has two important implications. First, ratios of G values also depend
on C even though the ratios themselves are dimensionless and G values should therefore be
9

compared as differences (i.e., G). Second, if a free energy change is written as a sum of
free energy changes then the sum needs to have the same dependency on C as the original
free energy change since the equality must hold for all values of C. This is equivalent to
requiring that the sum of N values for the components of a free energy decomposition be
equal to the N value for the free energy change that is decomposed.
10

One way in which stoichiometry can be accounted for in free energy decompositions is to
associate each free change with its corresponding N value using square brackets. The study
by Jencks [50] (J1981) on attribution and additivity of binding energies can be used to
illustrate this. J1981 [50] defines the intrinsic binding energy for a group X as the difference
in G for compounds in which X is present (AX) or absent (A) in the relevant molecular
structures:
∆ GXi [ 0 ]=∆ GAX
° [−1]−∆G A° [−1 ] (5)
The intrinsic binding energy is associated with a zero value of N and is therefore
independent of C. J1981 [50] writes the G value for a compound with linked groups A and
B in its molecular structure as the sum of the intrinsic binding energies of A and B, and the
“connection Gibbs energy” (Gs):
∆ GAB° [−1 ]=∆ GA
i [0 ]+∆ GBi [ 0 ]+∆ Gs [−1 ] (6)
Equation (6) is particularly relevant to fragment linking and it is important to note that Gs
does depend on C [7,50]. In some studies, G is decomposed into a value corresponding to
zero molecular size (GMS=0) and a G value:
∆ G ° [−1 ]=∆ GMS=0 [−1 ] ∆ ∆ G [0 ] (7)
For example, K1999 [32] and S2007 [34] use GMS=0 values of 0 and +4.2 kcal/mol
respectively. While this decomposition is valid to the extent that the sum has same
dependence on C as G, the assignment of an affinity value (e.g., KD = 1 M) to a solute of
zero molecular size for efficiency calculations does not appear to have any physical basis.
One general approach to modelling affinity is to use equation (8) in which A i (i > 0) is a
parameter associated with the substructure i and ni is the number of occurrences of that
substructural element:
∆ G ° [−1 ]=A0 [−1 ]+∑i=1
N SS
ni × Ai [ 0 ] (8)
11
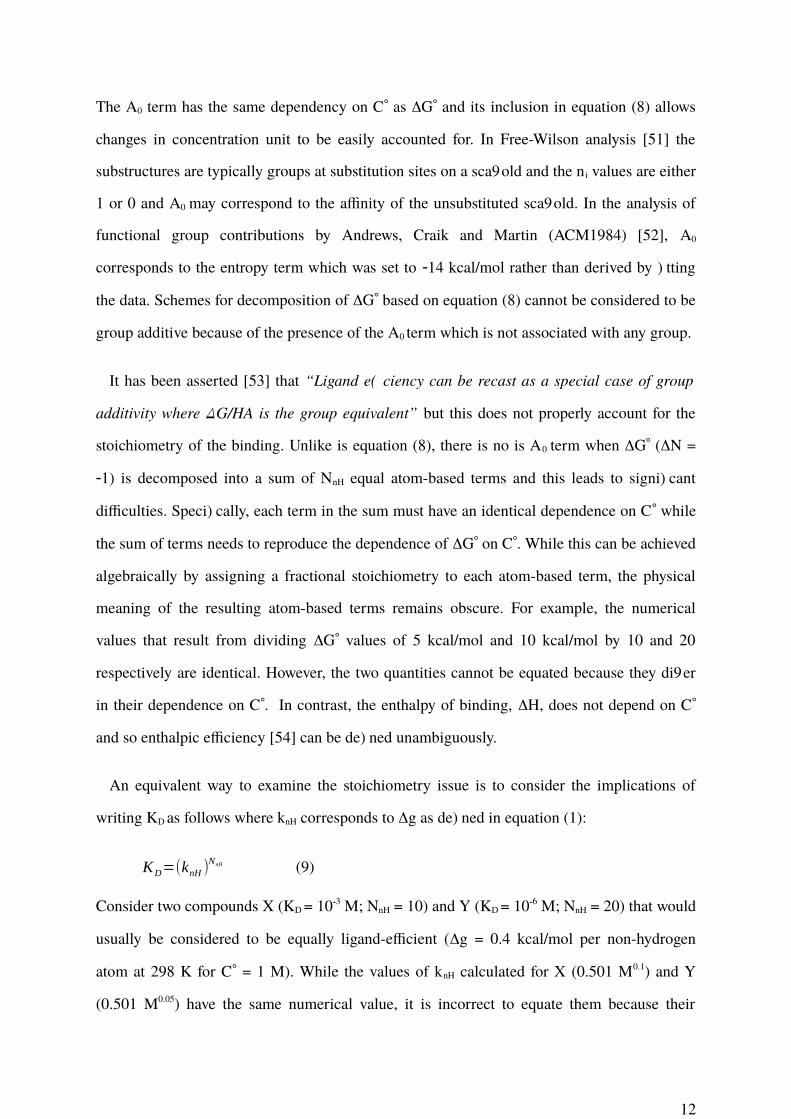
The A0 term has the same dependency on C as G and its inclusion in equation (8) allows
changes in concentration unit to be easily accounted for. In Free-Wilson analysis [51] the
substructures are typically groups at substitution sites on a scaffold and the n i values are either
1 or 0 and A0 may correspond to the affinity of the unsubstituted scaffold. In the analysis of
functional group contributions by Andrews, Craik and Martin (ACM1984) [52], A0
corresponds to the entropy term which was set to 14 kcal/mol rather than derived by fitting
the data. Schemes for decomposition of G based on equation (8) cannot be considered to be
group additive because of the presence of the A0 term which is not associated with any group.
It has been asserted [53] that “Ligand efficiency can be recast as a special case of group
additivity where ΔG/HA is the group equivalent” but this does not properly account for the
stoichiometry of the binding. Unlike is equation (8), there is no is A0 term when G (N =
1) is decomposed into a sum of NnH equal atom-based terms and this leads to significant
difficulties. Specifically, each term in the sum must have an identical dependence on C while
the sum of terms needs to reproduce the dependence of G on C. While this can be achieved
algebraically by assigning a fractional stoichiometry to each atom-based term, the physical
meaning of the resulting atom-based terms remains obscure. For example, the numerical
values that result from dividing G values of 5 kcal/mol and 10 kcal/mol by 10 and 20
respectively are identical. However, the two quantities cannot be equated because they differ
in their dependence on C. In contrast, the enthalpy of binding, H, does not depend on C
and so enthalpic efficiency [54] can be defined unambiguously.
An equivalent way to examine the stoichiometry issue is to consider the implications of
writing KD as follows where knH corresponds to g as defined in equation (1):
KD=(knH )NnH (9)
Consider two compounds X (KD = 103 M; NnH = 10) and Y (KD = 106 M; NnH = 20) that would
usually be considered to be equally ligand-efficient (g = 0.4 kcal/mol per non-hydrogen
atom at 298 K for C = 1 M). While the values of knH calculated for X (0.501 M0.1) and Y
(0.501 M0.05) have the same numerical value, it is incorrect to equate them because their
12

dimensions differ, as reflected by the difference in their respective units. If KD is expressed in
millimolar units, the numerical values of knH for X (1 mM0.1) and Y (0.708 mM0.05) are no
longer identical.
The need to properly account for stoichiometry is one reason that the contribution of an
intermolecular contact (or a substructure) to affinity is not an experimental observable [8]
although this appears to be the case even when stoichiometry is not an issue [28]. Some of the
entropy of binding results from molecular interactions (e.g., between water molecules) that
are non-local with respect to protein-ligand contacts. Some contributions to binding enthalpy,
such as the enthalpic penalties associated with ligand and target adopting their bound
conformations are also inherently non-local. A less obvious example of a non-local effect
would be substitution at one position of a molecular structure preventing a substituent at
another position from forming optimal interactions with the target. When interpreting binding
thermodynamics in terms of molecular interactions, it should always be kept in mind that
intermolecular contacts (e.g., between unbound ligand and solvent) that are not present in the
protein-ligand complex also influence H and S.
Target interaction potential (TIP) can be a helpful concept when considering association of
ligands with their targets. TIP takes account of both the nature of the interactions (e.g.,
hydrogen bonds) and the fact that ligand-target association takes place in an aqueous
environment. Hotspots [55] on the molecular surface of a target can be seen as regions of high
TIP while ligandability [56] is determined both by the magnitude of TIP and the extent to
which it can be exploited. An ability to reversibly form covalent bonds (e.g., catalytic cysteine
thiol or a protein-bound metal cation such as zinc) with ligands would generally be associated
with high TIP as would depletion [57] of water from a binding pocket or the “frustrated”
hydration [42] resulting from the overlap of solvation spheres of adjacent hydrogen bond
donors (or acceptors). A key challenge in drug design is to determine whether inadequate
affinity is due to low TIP (i.e., target is the problem) or underexploited TIP (i.e., compound is
the problem).
13
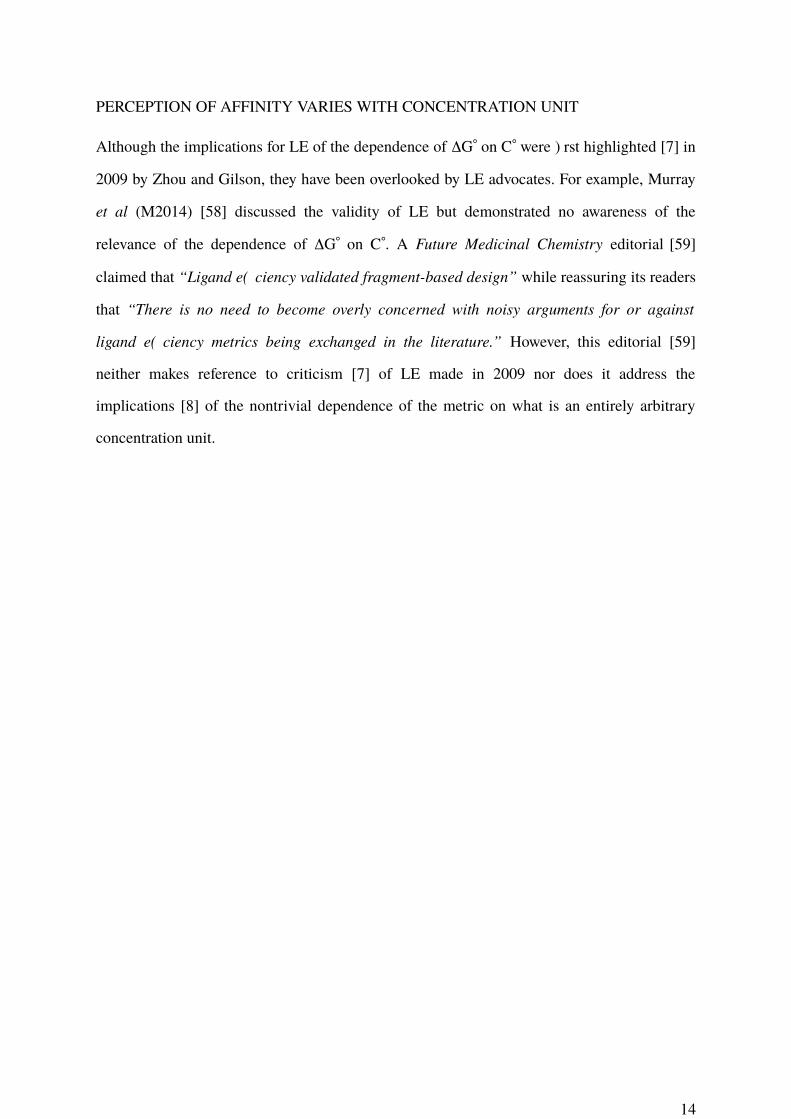
PERCEPTION OF AFFINITY VARIES WITH CONCENTRATION UNIT
Although the implications for LE of the dependence of G on C were first highlighted [7] in
2009 by Zhou and Gilson, they have been overlooked by LE advocates. For example, Murray
et al (M2014) [58] discussed the validity of LE but demonstrated no awareness of the
relevance of the dependence of G on C. A Future Medicinal Chemistry editorial [59]
claimed that “Ligand efficiency validated fragment-based design” while reassuring its readers
that “There is no need to become overly concerned with noisy arguments for or against
ligand efficiency metrics being exchanged in the literature.” However, this editorial [59]
neither makes reference to criticism [7] of LE made in 2009 nor does it address the
implications [8] of the nontrivial dependence of the metric on what is an entirely arbitrary
concentration unit.
14

Some of the problems that result from using LE as a design metric can be seen more clearly
if it is expressed using a base 10 logarithm and without energy units:
ηbind=−( 1NnH )×log10( K D
C ° )= ∆ gRTln(10) (10)
The quantity bind is related to g by a multiplicative factor of RTln(10) that is independent of
C and therefore both quantities respond in an identical manner to a change in C . One
rationale for using bind is that drug discovery scientists typically use pIC50 or pKD rather than
G in SAR analysis. The quantity bind is also related to ligand efficiency by atomic number
(LEAN) [60] that is calculated by scaling pIC50 by NnH. Unlike LEAN, bind is a function of C
and can also be written as bind(C) to emphasize this. Although standard state conventions do
not apply to potency measures such as IC50 and EC50, which are usually quoted in M or nM,
potency must still be scaled by a concentration value for the logarithm calculation because the
logarithm function is not defined for dimensioned quantities [9]. Using bind rather than G
reinforces the point that the problems associated with LE are due to the mathematical
behavior of the logarithm function. While the use of a concentration unit other than 1 M to
define LE is unusual, there certainly is precedent for doing so. For example, minimum
inhibitory concentration, used to define antibacterial efficiency [61], was scaled by mg/ml in
order that the logarithm could be calculated.
Table 1 illustrates how a change in C alters the perception of efficiency. The hypothetical
set of three compounds consists of a fragment hit (NnH = 10; KD = 1 mM), a lead (NnH = 20; KD
= 1 M) and a clinical candidate (NnH = 30; KD = 1 nM) that would usually be regarded as
equally ligand-efficient (g = 0.4 kcal/mol per non-hydrogen atom at 298 K for C = 1 M) [8].
An identical bind value of 0.3 per non-hydrogen atom is indeed calculated for all three
compounds when C is set to the conventional value of 1 M. Using a value of 0.1 M for C
leads to the conclusion that the clinical candidate is more ligand-efficient than the fragment
but, if C is set to 10 M, we come to the opposite conclusion. Given that rankings of
compounds can change with C and that there is no way of objectively selecting a value of C
for these calculations, neither bind nor g would appear to be fit for the purpose of assessing
15

performance, potential or quality of compounds in drug discovery projects. An analogous
criticism can also be made of the BEI [2], LEAN [60], LLEAT [3] and LELP [3] metrics.
16
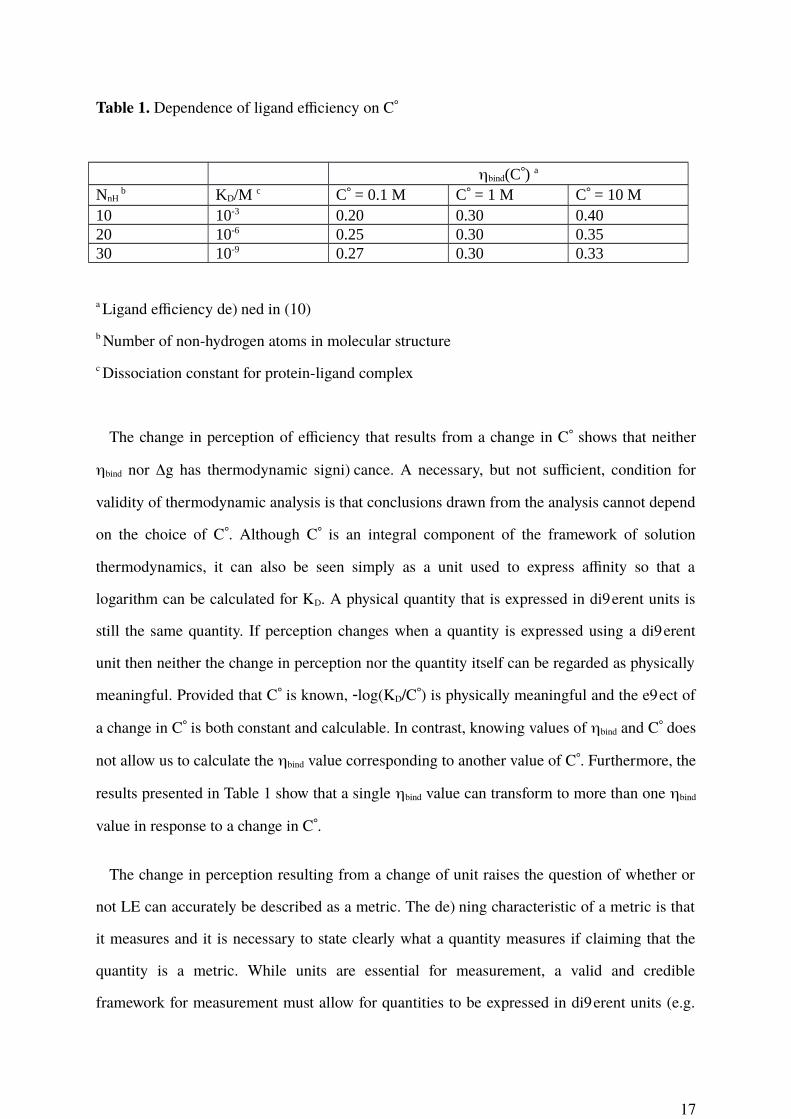
Table 1. Dependence of ligand efficiency on C
bind(C) a
NnH b KD/M c C = 0.1 M C = 1 M C = 10 M
10 10-3 0.20 0.30 0.4020 10-6 0.25 0.30 0.3530 10-9 0.27 0.30 0.33
a Ligand efficiency defined in (10)b Number of non-hydrogen atoms in molecular structurec Dissociation constant for protein-ligand complex
The change in perception of efficiency that results from a change in C shows that neither
bind nor g has thermodynamic significance. A necessary, but not sufficient, condition for
validity of thermodynamic analysis is that conclusions drawn from the analysis cannot depend
on the choice of C. Although C is an integral component of the framework of solution
thermodynamics, it can also be seen simply as a unit used to express affinity so that a
logarithm can be calculated for KD. A physical quantity that is expressed in different units is
still the same quantity. If perception changes when a quantity is expressed using a different
unit then neither the change in perception nor the quantity itself can be regarded as physically
meaningful. Provided that C is known, log(KD/C) is physically meaningful and the effect of
a change in C is both constant and calculable. In contrast, knowing values of bind and C does
not allow us to calculate the bind value corresponding to another value of C. Furthermore, the
results presented in Table 1 show that a single bind value can transform to more than one bind
value in response to a change in C.
The change in perception resulting from a change of unit raises the question of whether or
not LE can accurately be described as a metric. The defining characteristic of a metric is that
it measures and it is necessary to state clearly what a quantity measures if claiming that the
quantity is a metric. While units are essential for measurement, a valid and credible
framework for measurement must allow for quantities to be expressed in different units (e.g.
17

M and nM). For example, readers might consider their likely responses to a hypothetical
report that the space group for a crystal structure differed according to whether unit cell
parameters were expressed in Ångstrom or in nanometer units. There are two reasons that LE
should not be considered to be a metric. First, it is not clear what LE measures since neither
the extent to which molecular interactions are optimal nor interaction quality are experimental
observables. Second, LE has a unit (1 M) built into it and perception of efficiency is altered
(Table 1) when another concentration unit is used. It would actually be more accurate to
describe LE as a simple predictor of potency in cell-based assays or of in vivo activity that,
like property forecast index [48], has neither been validated nor optimized for prediction.
A B
Key: (C = 1 M) (C = 0.1 M) (C = 0.01 M)
Figure 1. (A) Response of affinity to molecular size for plotted for three different C values
(B) Plot of LE (bind) calculated from the response of affinity to molecular size using three
different C values
Figure 1 illustrates the impact of the dependence of bind on C in an alternative manner to
Table 1. Figure 1A shows a hypothetical response of affinity to NnH that has been constructed
to have a linear region (slope = 0.3 per non-hydrogen atom) at low NnH and a plateau at high
NnH. The response is plotted for three different values (1 M; 0.1 M; 0.01 M) of C and this
shows how expressing affinity in a different unit shifts the entire response by a constant
amount without affecting the shape of the response. In contrast, using a different unit to
18
express bind actually changes the shape of the response of bind to C. Furthermore,
transformation of affinity to bind typically makes it more difficult to perceive the linear and
plateau regions of the response of affinity to NnH. The results presented in Figure 1 highlight
the importance of observing relationships between affinity and molecular size directly.
LE is used to specify affinity cutoffs as a function of molecular size and a g value of 0.3
kcal/mol per non-hydrogen atom has been suggested [3]. Specification of affinity cutoffs in
this manner forces the line defining acceptable affinity to intersect the affinity axis at a point
corresponding to a KD value of 1 M. This causes considerable difficulties when the range in
NnH is large as is the case for beyond rule of 5 (bRo5) [62] compounds. The minimum g
value of 0.12 kcal/mol per non-hydrogen atom recommended [62] for bRo5 compounds can
be translated (C = 1 M; T = 300 K) to pKD values corresponding to the lower (700 Da; NnH
50) and upper (3000 Da; NnH 214) limits for bRo5 space. The lower (pKD = 4.4) of these
two values would not appear to be a useful design criterion while the higher value (pKD =
18.7) would not generally be measurable. In general, affinity thresholds should be specified
directly and LE should only be used for this purpose if supported by the data.
LE was introduced [1] with the claim that it was useful but it is rarely, if ever, shown to be
predictive of pharmaceutically-relevant behavior. As such, the utility of LE as a design metric
hinges on it being meaningful and there is a burden of proof on those who advocate the use of
LE to demonstrate that their choice of unit is universally appropriate. The importance of
physicochemical properties is widely accepted in drug design and many medicinal chemists
would regard it as routine to monitor progress in projects by plotting potency against
molecular size or lipophilicity. A critique of LE metrics actually emphasized the importance
of modeling relationships between affinity and risk factors for compounds of interest [8].
However, a depiction [6] of an optimization path for a project that has achieved a satisfactory
endpoint is not direct evidence that consideration of molecular size or lipophilicity made a
significant contribution toward achieving that endpoint. Furthermore, explicit consideration of
lipophilicity and molecular size in design does not mean that efficiency metrics were actually
used for this purpose. Design decisions in lead optimization are typically supported by assays
19

for a range of properties such as solubility, permeability, metabolic stability and off-target
activity as well as pharmacokinetic studies. This makes it difficult to assess the extent to
which efficiency metrics have actually been used to make decisions in specific projects,
especially given the proprietary nature of much project-related data.
20

LIGAND EFFICIENCY AND FRAGMENT-BASED DESIGN
LE features prominently in the literature of fragment-based lead discovery (FBLD) [63-68] to
the extent that it is sometimes presented as an important rationale for screening fragments.
For example, it has been claimed [64] that “fragment hits typically possess high ‘ligand
efficiency’ (binding affinity per heavy atom) and so are highly suitable for optimization into
clinical candidates with good drug-like properties”. It has been asserted [31] that “fragment
hits form high-quality interactions with the target” although it is not clear if interaction
quality involves aesthetic aspects in addition to the physical forces more usually associated
with molecular recognition [26,27]. I would argue that the rationale for screening fragments
against targets of interest is actually based on two conjectures. First, chemical space can be
covered most effectively by fragments because compounds of low molecular complexity
[18,21,22] allow TIP to be explored [69-73] more efficiently and accurately. Second, a
fragment that has been observed to bind to a target may be a better starting point for design
than a higher affinity ligand whose greater molecular complexity prevents it from presenting
molecular recognition elements to the target in an optimal manner. While proving either
conjecture definitively is difficult, the success [74] of fragment-based approaches indicate that
the underlying assumptions are reasonable.
The Johnson et al 2018 study (J2018) [75] examined start-finish differences in LE for a
number for a number of fragment-to-lead (F2L) optimizations that had been published in
2016 and there is precedent [48] for analyzing start-finish differences for projects in this
manner. J2018 [75] notes that differences in LE between fragment hits and leads were not
statistically significant and states that “in contrast to anecdotal reports that LE tends to
decline during the F2L process, LE decreased during optimization for only a minority of
examples”. This analysis is repeated using bind values calculated for different values of C
ranging from 0.001 M to 10 M and the results are summarized in Table 2. As C increases,
the leads appear to become less ligand-efficient in comparison with the fragment hits from
which they had been derived and this is analogous to what is shown in Table 1. Statistically
21

significant differences between values for fragment hits and leads are only observed if C is
0.01 M or 0.001 M.
22

Table 2. Dependence on C of mean changes in ligand efficiency for F2L programs surveyed
in J2018
C/M a Mean bind b SE bind
c Prob > |t| d
0.001 +0.087 0.012 <0.0010.01 +0.055 0.015 0.0010.1 +0.024 0.018 0.201.0 0.008 0.021 0.6910 0.04 0.024 0.11
a Standard concentrationb Mean change in ligand efficiency as defined in (10)c Standard error in mean change in ligand efficiency as defined in (10)d P value for matched pair t test
Comparison of LE values for fragment hits and the corresponding leads can be seen as an
attempt to quantify how effectively an increase in molecular size translates to affinity gain
over the course of an F2L project. This is still a valid objective even though the LE metric
would appear to be unfit for this purpose. The most obvious way to do this is to scale pKD by
NnH for the F2L pairs:
∆ pK D
∆ N nH
=( 1N nH [L]−NnH [F ])× log10( K D[F]
K D[L] ) (11)
The quantity defined in equation (11) can regarded as a measure of MSE for the F2L
optimization. Using pKD (the logarithm of a ratio of KD values) eliminates the dependency
on C that makes bind (and g) unsuitable for comparison of start and end points for
projects. An additional benefit is that pKD is likely to be relatively insensitive to the
approximation of KD by IC50. This approach to assessing optimizations has precedent and
H2006 [33] reported that a tenfold improvement in KD corresponded to a mean increase in
molecular weight of 64 Da (standard deviation = 18 Da) for 73 compound pairs from FBLD
23
projects. H2006 [33] also illustrates the benefit of observing the response of affinity to an
increase in molecular size directly rather than indirectly by using the LE metric.
It can be useful to compare the changes in affinity and lipophilicity that result from
structural elaboration and one way of achieving this is to offset the change in affinity by
change in lipophilicity:
∆ pK D−∆logP=log10( K D [ F ] × P[ F]K D [ L ] × P[ L] ) (12)
The quantity in equation (12) may be regarded as a measure of the lipophilicity efficiency for
the F2L optimization and is equivalent to the change in what would be termed LLE [3,40] or
LipE [41]. It is desirable that it should be as large as possible for F2L projects. Variations of
equation (12) can also be written using potency (e.g. pIC50) with a measured distribution
coefficient (logD) or a predicted [76] value of logP. Where pKD was not available, it has been
approximated by pIC50 and the ClogP values reported in J2018 [75] are used as the measure of
lipophilicity.
A plot of pKD against NnH with reference lines of constant (pKD/NnH) is shown in
Figure 2A. This depiction is intended to map the distribution of (pKD/NnH) values so the
reference lines are drawn to mark quartiles rather than at equally-spaced intervals. A plot of
(pKD ClogP) against NnH is shown in Figure 2B with reference lines to map the
distribution. Affinity gains for optimizations with zero values of (pKD ClogP) would
typically be regarded as being entirely due to increased hydrophobic contact with target.
However, it is important to be aware that the octanol/water partitioning system is relatively
insensitive to the presence of hydrogen bond donors [14,42]. Large positive values of (pKD
ClogP) might be considered to be evidence that the optimization process has introduced
additional polar interactions although polar functionality can still be tolerated, for example by
being exposed to solvent, without actually making contact with target.
24

A
B
Figure 2. (A) Plot of pKD against NnH for J2018 F2L optimizations showing reference lines
for minimum (min = 0.13), first quartile (Q1 = 0.18), median (Q2 = 0.28), third quartile (Q3 =
0.37) and maximum (max = 1.32) values of (pKD/NnH) (B) Plot of (pKD ClogP) against
NnH
An observation that can be made about the J2018 [75] analysis is that the start points for 15
of the 28 F2L projects surveyed do not appear to comply with the rule of 3 (Ro3) [77] if Ro5
[20] hydrogen bond definitions are used. This would appear to contradict the claim [74] that
“Most libraries consist of molecules that adhere to the 'rule of three'.” It has been suggested
[22,78] that Ro3 [77] may be overly restrictive and applying the rule in this manner would
eliminate carboxylic acid bioisosteres [79] such as tetrazole [80] and N-acylsulfonamide [81]
25

as well as the isocytosine fragment hit [82] that led to the discovery of potent -secretase
inhibitors [83]. All lead compounds surveyed in J2018 [75] are of greater molecular size than
the corresponding fragments but this is not the case for lipophilicity. Calculated logP values
for five of the leads were lower than for the fragment hits from which they were derived,
suggesting that a logP cutoff value of 3 may be overly restrictive for design of compound
libraries for FBLD. The Ro5 [20] cutoff values for molecular weight (500 Da) and logP (5)
were directly derived from the relevant data since they correspond to specific percentiles in
the distributions observed for these quantities. However, it should not automatically be
assumed that there is an analogous correspondence between the Ro3 [77] cutoff values for
molecular weight (300 Da) and logP (3).
GROUP EFFICIENCY
Medicinal chemists typically view SAR in terms of affinity differences resulting from
structural modifications. Observation that a small structural change leads to a large change in
affinity is usually informative. Group efficiency (GE) [34] is defined for the addition of a
group, X, to A by scaling the value of the associated G ( ∆ GXi as defined in [50]) by
NnH:
¿[ A → AX ]=−( ∆ ∆ G [A → AX ]∆ N nH [ A → AX ]) (13)
The notation [XY] can be used to specify structural transformations and to indicate that a
change in the value of a property such as G, pKD or NnH has been calculated by subtracting
the value of the property for compound X from that for compound Y [84]. The definition of
GE expresses equation (11) in terms of free energy rather than dissociation constant and
equation (12) could be used in an analogous manner to specify the efficiency of substitutions
from the perspective of lipophilicity. GE was stated [85] to be “a more sensitive metric to
define the quality of an added group than a comparison of the LE of the parent and newly
formed compounds” and the introduction of the metric can be seen as an attempt to address a
perceived deficiency in LE. The more fundamental difference between the two metrics is that
26

GE is independent of C because it is defined in terms of G. Although GE is sometimes
presented as a substructural (e.g. chloro substituent) property, it is actually structural
transformations (e.g. substitute hydrogen with chlorine) with which values of GE should be
associated. The G values used for calculation of GE cannot generally be interpreted as
substructural contributions to affinity because summation of values of G (N 0) cannot
reproduce the dependency of G (N 1) on C.
The GE analysis in S2007 [34] was performed using data from a fragment growing project
directed against protein kinase B (PKB) that is summarized in Figure 3. The G values in
S2007 had been calculated from IC50 measurements and, in one case (1), KD estimated from
crystallographic occupancy [34]. The structural prototype 1 (NnH = 5) that defines the series,
is included in the data set although it was not the initial screening hit. Affinity measurements
are rare for fragments of this size and are particularly valuable for mapping biophysical limits
of binding. The slope of the line joining each pair of results in Figure 3B indicates the
sensitivity of affinity to an increase in molecular size for each structural transformation and in
some cases this is equal to GE. Compound 5 is racemic and so [56] can be considered to be
a composite transformation consisting of both chloro-substitution and chiral resolution. The
(pIC50/NnH) value of 0.37 per non-hydrogen atom for [36] would place it on the Q3
reference line for the F2L optimizations surveyed in J2018 [75].
A
B
27

Figure 3. (A) Compounds described in S2007 [75] group efficiency study (B) Plot of G
against NnH; broken lines indicate steps corresponding to addition of pyrazole.
S2007 [34] reports a GE value of 1.5 kcal/mol per non-hydrogen atom for the structural
prototype 1. The substructural transformation leading to 1 poses special difficulties for G
calculation since this requires that an affinity value be assigned to a species of zero molecular
size. The G value for this transformation was derived [34] by subtracting an estimate for
rigid body entropy (Grigid = 4.2 kcal/mol) lost on binding from the G value for 1. The large
GE value calculated for 1 is presented [34] as evidence that the interactions of pyrazole
substructure with the PKB make a particularly large contribution to affinity. One
interpretation of the analysis presented in S2007 [34] appears to be that to be that the
molecular interactions of the pyrazole substructure of 6 are assigned full credit for
overcoming the penalties resulting from loss of translational and rotational entropy. This
interpretation appears to be based on two assumptions. First, 1 and 6 lose identical amounts
of rigid body entropy when they bind to PKB. Second, the pyrazole substructure makes
identical interactions with the protein when 1 and 6 bind to PKB.
In SAR analysis, it would not be considered generally feasible to infer the importance of a
substructure as a determinant of affinity using only measurements for compounds in which
the substructure is conserved. Calculation of GE for 1 appears to require that a value of KD be
assigned to a species of zero molecular size. The value of GE derived in this manner is
determined just as much by the affinity assumed for the zero molecular size species as by the
28

affinity that is actually measured for the compound. The G values for 7 (5.9 kcal/mol) and
6 (10.6 kcal/mol) can also be used to derive a GE value of (0.9 kcal/mol per non-hydrogen
atom) for the addition of the pyrazole to 6. It is unclear why the GE value of 1.5 kcal/mol per
non-hydrogen atom is preferred to the value of 0.9 kcal/mol per non-hydrogen atom that can
be derived from the G values measured for 6 and 7.
The F2L optimization in S2007 [34] is essentially a sequence of substitutions and G
values can be associated with structural modifications in a consistent manner. Drug design
frequently consists of optimization of groups at two or more substitution sites on a scaffold
and non-additive [86-91] SAR needs to be considered. Free and Wilson [51] were fully aware
of the problems that can result from non-additive SAR and it is not possible to assign G
values (and therefore GE values) in a consistent manner to individual structural modifications
if SAR is non-additive. Subadditive SAR should be should be anticipated whenever there is a
high degree of constraint in the system and might be considered to be a natural consequence
of high molecular complexity [18]. Structural features likely to constrain ligand-target binding
include conformational rigidity and multiple hydrogen bonds between ligand and protein.
Figure 4 illustrates some of the difficulties in using GE in analysis of SAR. The two GE
values reported [3] for the Hsp90 inhibitor shown in Figure 4A were derived from published
SAR [92] that is summarized in Figure 4B. The (pKD/NnH) value of 0.8 per non-hydrogen
atom for [912] would place it in the top quartile of the F2L optimizations surveyed in J2018
[75]. Addition of the second hydroxyl group and merging the diethylamino group with a
benzene ring each appears to result in an affinity increase of two orders of magnitude.
However, it is not possible to determine whether or not the SAR is additive without knowing
the affinity for 11. Graphics such as Figure 4A cannot capture the order in which the
structural transformations are carried out and, in some cases, even the starting point for the
transformation is not clear. For example, it is not possible to determine from Figure 4A
whether the isoindoline in 8 had been derived from the corresponding dimethylamino,
diethylamino or pyrrolidinyl group.
29

A B
Figure 4. (A) Group efficiency values reported in reference 3 for an HSP90 inhibitor (B) SAR
of HSP90 inhibitors from reference 92
30
MAXIMAL AFFINITY OF LIGANDS AND FIT QUALITY
K1999 [32] explored the limits that protein structure may impose on affinity and it is also is
widely regarded to have introduced the LE concept. K1999 [32] uses affinity measurements
against multiple targets and medicinal chemists should not automatically assume that this
study is directly relevant to specific targets on which they may be working. Put another way, if
a micromolar activity against a target of interest has been observed for a compound, how
useful is it to know that another compound of comparable molecular size has shown
picomolar affinity against another target? Sample size is an important consideration in studies
of biophysical limits of affinity since the observation of maximal affinity can be regarded as a
relatively rare event. How many observations of affinity against how many targets would one
need to make for compounds with 20 non-hydrogen atoms in order to have a 95% chance of
observing affinity within 1.4 kcal/mol of a theoretical affinity limit for compounds of this
molecular size?
K1999 [32] analyzes the relationship between Gbinding (numerically equivalent to G for
C 1 M) and number of non-hydrogen atoms:
“If we ignore simple cations and anions, the data show a sharp improvement in binding free
energy until 15 heavy atoms per molecule. The Gbinding binding of the tightest-binding
ligands then plateaus at 15 kcal/mol (i.e., picomolar dissociation constants). The initial
slope is approximately 1.5 kcal/mol per atom.”
While the response of G to NnH (0.44 kcal/mol per non-hydrogen atom) shown in Figure
3B is much less steep than the initial response of Gbinding to NnH (1.5 kcal/mol per non-
hydrogen atom) reported by K1999 [32], its linearity appears to be maintained over the entire
molecular size range (5 NnH 21) for the data. The findings from K1999 [32] do not
appear to provide insights that would be useful for the interpretation of the results shown in
Figure 3B and this reflects the fact that affinity measured against multiple targets was used for
the analysis in that study. While the Gbinding values used in K1999 [32] do not depend on C,
the line describing the initial response of Gbinding to NnH was constrained to pass through the
31

point (NnH = 0; Gbinding = 0). Shultz noted [93] that imposition of this constraint (equivalent
to assuming that KD = 1 M for zero molecular size) is likely to have biased the estimate for the
steepness of the initial response and others [8] subsequently made similar observations.
The response of maximal affinity to molecular size shown in K1999 [32] might be
anticipated from consideration of molecular complexity [18] and it provides support for the
view that additivity [86-91] in SAR decreases with molecular size. Although the choice of
intercept in the K1999 [32] has been criticized [8,93], the response of maximal affinity to
molecular size was modeled directly in the study. In contrast, Reynolds, Tounge and
Bembenek (RTB2008) [94] modeled the response of maximal LE to molecular size.
RTB2008 [94] asserted that “ligand efficiency is dependent on ligand size with smaller
ligands having greater efficiencies, on average, than larger ligands” and M2014 [58] repeated
this assertion. As shown in Figure 1B, the apparently greater efficiency of smaller ligands
can reflect the choice of unit used to express affinity and, therefore, should be not interpreted
as having any special significance.
RTB2008 [94] uses fit quality (FQ) to normalize LE with respect to molecular size and
claims that “the fit quality score provides a simple method for directly measuring how
optimally a ligand binds relative to other ligands of any size” [94]. However, the results
presented in Table 1 show that it is not valid to claim that LE measures how optimally a
ligand binds, even to a single protein, since rankings of compounds can vary with the
concentration unit in which KD is expressed. Given that the degree to which a ligand binds
optimally has not been shown to be an experimental observable, it would not be valid to make
a claim for direct measurement even if perception of efficiency was independent of C. FQ
was introduced to address a perceived deficiency of LE and it has been stated [59] that “LE
can break down when comparing ligands of disparate size (LLE, FQ and size independent
ligand efficiency [SILE] are better).”
The calculation of FQ involves first deriving the LE_Scale function by modelling the
maximal LE as a function of NnH to provide a reference for scaling LE values [94]. FQ is
32

defined as the ratio of LE to LE_Scale which means that it is simply a ratio of G values and
therefore dependent on C. This is a separate issue from the dependence of LE on C since the
comparison between LE and LE_Scale is made using the same value of NnH. Although it
should be possible to address the problems associated with using G ratios by using G,
there remains the issue that affinity values used for the calculation of LE and LE_scale do not
generally correspond to the same protein. This means that a low value of FQ could just as
plausibly be explained by low TIP of the target as by suboptimal interactions with the target.
The analysis presented in RTB2008 [94] can also be criticized from a general
cheminformatic perspective. While the dependence of maximal binding affinity on molecular
size may be of interest to drug discovery scientists, there are a number of reasons why this
relationship would be better modelled directly with G (or pKD) as the dependent variable
and NnH as the independent variable. First, using affinity as the dependent variable means that
there are none of the difficulties caused by the dependence of LE on C since a change in C
simply shifts affinity by a constant amount that is independent of molecular size. Second, it is
not generally possible to assess quality of fit in a meaningful manner when fitting a quantity
(e.g., pKD/NnH) that depends explicitly on the independent variable (e.g., NnH). This is
because, to some extent, the modelling process involves fitting the independent variable to
itself. Third, scaling affinity by molecular size also scales the uncertainty in the affinity by
molecular size and this needs to be properly accounted for when performing the regression
analysis. Sheridan has debunked the suggestion that LE is inherently more predictable than
affinity [95].
ALTERNATIVES TO LIGAND EFFICIENCY FOR NORMALIZATION OF AFFINITY
Despite the criticisms made of the LE metric and its variants, the view that the best
compounds punch above their weight is still valid. While it does not appear possible to define
LE objectively in an absolute sense, the H2006 [33] and S2007 [34] studies showed that
efficiency can be defined in relative terms. With appropriate data analysis, it may be possible
33

to establish a particular value of (pKD/NnH) as indicative that two compounds bind with
equal efficiency.
LE was introduced [1] as a means to normalize affinity with respect to molecular size and
this raises the question of whether or not meaningful normalization can be achieved without
having to assume a particular value of C. Although GE does not vary with C, this metric is
associated with structural transformations, rather than compounds, and so cannot be used to
normalize affinity of compounds. To describe data as normalized would generally imply that
some preliminary analysis has been performed on the data. For example, one might subtract
the mean molecular weight for the fragments in a screening library from the molecular weight
of each fragment. Mean-centering data in this manner makes it possible to determine at a
glance whether or not a fragment in the library is larger than average.
Affinity can be normalized with respect to design risk factors such as molecular size in a
manner that is analogous to mean-centering by using the trend in the data instead of the mean.
This is analogous to the approach that was used in the ACM1984 study [52] and has been
outlined in previous studies [8,42]. The response of affinity to molecular size is first modelled
so that the trend in the data can be represented by the pKD values predicted by the model.
Affinity is then normalized by subtraction of predicted pKD from the experimentally measured
value (this difference is conventionally referred to as the residual):
pK D [ resd ]=pK D [ expt ]−p KD [ pred ] (14)
A large absolute value of a residual can be seen as a type of activity cliff [37,38] and the
most interesting SAR is likely to be associated with the most deviant values. A large positive
residual could reflect a different type of molecular interaction while a large negative residual
might be linked to the absence of a key molecular recognition element. Affinity (or potency)
should always be plotted as a function of molecular size during the course of an F2L project
and even a weak trend can be used to normalize data. Modelling the data in the initial stages
of an F2L project may indicate the likely response of affinity to a further increase in
34

molecular size and the greater sensitivity to structural elaboration of one fragment hit may
trump the greater potency of another when setting priorities.
A B
Figure 5. Normalization of data from reference 34 (A) Data set includes 7 (B) Data set
excludes 7
This approach to normalization of affinity with respect to molecular size can be illustrated
using the data from S2007 [34]. The results of fitting G to NnH are shown in Figure 5 and
summarized in Table 3. The large negative residual (1.7 kcal/mol) for 7 shown in Figure 5A
highlights the importance of the pyrazole substructure for affinity. One advantage of analyzing
the data in this manner is that all compounds are treated equivalently in the analysis so there
is no need to make a special case of the structural prototype 1.
Once it has been established that the pyrazole substructure is important for affinity, the non-
pyrazole 7 can be excluded from the dataset to enable affinity to be normalized for the
pyrazoles (Figure 5B). The results in Table 3 show a very strong relationship (R2 = 0.98;
RMSE = 0.42 kcal/mol) between G and NnH and practically all the variation in G for these
compounds can be explained by differences in molecular size. The two residuals of greatest
35

magnitude correspond to 5 (0.6 kcal/mol) and 6 (+0.5 kcal/mol) and these values reflect the
large GE value of 1.6 kcal/mol per non-hydrogen atom reported for the [56] transformation.
A significant portion ( 0.4 kcal/mol) of the residual for 5 can probably be explained by its
racemic nature. Had the more active enantiomer of 5 been used in the analysis, the GE value
for the chloro-substitution might have been 1.2 kcal/mol per non-hydrogen atom rather than
1.6 kcal/mol per non-hydrogen atom as reported in S2007.35 Both the residual for 6 and the
GE value for the [56] transformation highlight the importance of the chloro substituent as a
molecular recognition element in this system. Given that the pyrazole ring is present in all
structures, it is not possible to draw any inference about the contribution of this molecular
recognition element to affinity although the excellent linear fit to the data shown in Figure 5B
is consistent with a view that structural elaboration did not compromise the hydrogen bonding
between pyrazole and the hinge region of PKB.
Table 3. Results of fitting linear model to data from S2007 study
G/(kcal/mol) A0 + (A1 NnH)Dataset N a A0 SE A0 b A1 SE A1 c RMSE d R2 e
Compounds 1 – 7 7 0.85 1.00 0.42 0.07 0.89 0.89Compounds 1 – 6 6 0.87 0.48 0.44 0.03 0.42 0.98
a Number of observationsb Standard error in A0 c Standard error in A1
d Root mean square errore Coefficient of determination
Analyzing affinity data in this manner effectively partitions MSE for a compound into a
term that characterizes the steepness of response of affinity to molecular size for the particular
selection of compounds and a residual term that quantifies the extent to which the affinity of a
36

compound beats (or is beaten by) the trend in the data. The residuals are invariant with
respect to change in C so there is no change in perception if affinity is expressed using a
different concentration unit. Although residuals cannot be used to define efficiency in an
absolute sense, compounds can still be ranked and there is no requirement, as is the case for
analysis based on GE [34,85], that the compounds be structurally related. Affinity can be
normalized with respect to other risk factors (e.g., lipophilicity) using residuals and other
properties (e.g., aqueous solubility) can be normalized in an analogous manner. When using
residuals for normalization of affinity, there is no requirement that the model be either linear
or univariate. This means that affinity can be normalized with respect to more than one risk
factor in a single analysis.
Drug discovery scientists typically need be able to address a range of questions when
interrogating project data. For example, it may be useful to focus analysis on the most active
compounds in an optimization project. It is important to stress that residuals are not generated
in isolation and they result from analysis that, arguably, should be performed anyway. The
line fit to a plot of affinity against molecular size is likely to be a better predictor of outcome
than a line that has been artificially forced to intercept the affinity axis at a point
corresponding to a KD value of 1 M [8]. The strength of the trend also provides an indication
of how useful normalization of the data is likely to be. For example, the observation of a very
weak correlation between affinity and molecular size for hits from a fragment screen suggests
that molecular size need not be accounted for when assessing the fragment hits in question. In
an optimization project, a relatively weak correlation between affinity and molecular size may
point to SAR that is specific to the extent that it cannot be adequately explained by molecular
size alone.
37

CONCLUSIONS
LE has been discussed in depth from a physicochemical perspective in this study and the
difficulty of interpreting affinity in terms of molecular interactions was highlighted. The
nontrivial dependency of LE on the concentration unit in which affinity is expressed means
that LE has no physical significance and, strictly, should not even be considered to be a
metric. As such, LE is unsuitable for ranking compounds, setting acceptability thresholds for
affinity and modeling relationships between affinity and molecular size. While it does not
appear to be possible to quantify efficiency of binding objectively for compounds in an
absolute manner, efficiency can still be defined in a relative manner by scaling affinity
differences by the corresponding molecular size differences.
AUTHOR INFORMATION
Corresponding Author
*Email, [email protected]
ACKNOWLEDGMENT
I thank Michael Gilson for helpful comments on the manuscript.
ABBREVIATIONS
C, standard concentration, FBLD, fragment-based lead discovery; FQ, fit quality; F2L,
fragment-to-lead; GE, group efficiency; IC50 , half maximal inhibitory concentration; KD,
dissociation constant; LE, ligand efficiency; LE_Scale, estimate for maximal ligand efficiency
as function of NnH; LipE, lipophilic efficiency; LLE, ligand lipophilicity efficiency or
lipophilic ligand efficiency; logD, base 10 logarithm of octanol/water distribution
coefficient; logP, base 10 logarithm of octanol/water partition coefficient; NnH, number of non-
hydrogen atoms in a molecular structure; P, octanol/water partition coefficient; pIC50,
log10(IC50/M); pKD, log10(KD/M); pKD[expt], experimentally measured pKD; pKD[pred],
value of pKD predicted by model; pKD[resd], residual pKD; R, gas constant; Ro3, rule of 3;
Ro5, rule of 5; T, thermodynamic temperature; TIP, target interaction potential; g, ligand
38

efficiency calculated from standard free energy of binding ; G, standard free energy of
binding; N, change in number of chemical species; bind, ligand efficiency calculated from
logarithmically expressed KD without energy units.
39

REFERENCES
1. Hopkins AL, Groom CR, Alex A (2004) Ligand efficiency: a useful metric for lead selection. Drug Discov Today 9:430-431. http://doi.org/10.1016/S1359-6446(04)03069-7
2. Abad-Zapatero C, Perisic O, Wass J, Bento PA, Overington J, Al-Lazikani B, Johnson ME (2010) Ligand efficiency indices for an effective mapping of chemico-biological space: the concept of an atlas-like representation. Drug Discov Today 2010, 15, 804-811. http://doi.org/10.1016/j.drudis.2010.08.004
3. Hopkins AL, Keseru GM, Leeson PD, Rees DC, Reynolds CH (2014) The role of ligand efficiencymetrics in drug discovery. Nat Rev Drug Discov 13:105-121. http://doi.org/10.1038/nrd4163
4. Meanwell NA (2016) Improving drug design: an update on recent applications of efficiency metrics,strategies for replacing problematic elements, and compounds in nontraditional drug space. Chem ResToxicol 29:564-616. http://dx.doi.org/10.1021/acs.chemrestox.6b00043
5. Cavalluzzi MM, Mangiatordi GF, Moro A, Nicolotti O, Lentini G (2017) Ligand efficiency metrics indrug discovery: the pros and cons from a practical perspective. Exp Opin Drug Discov 12:1087-1104.http://doi.org/10.1080/17460441.2017.1365056
6. Young RJ, Leeson PD (2018) Mapping the efficiency and physicochemical trajectories of successful
optimizations. J Med Chem 61:6421-6467. http://dx.doi.org/10.1021/acs.jmedchem.8b00180
7. Zhou HX, Gilson MK (2009) Theory of free energy and entropy in noncovalent binding. Chem Rev109:4092-4107. http://doi.org/10.1021/cr800551w
8. Kenny PW, Leitão A, Montanari CA (2014) Ligand efficiency metrics considered harmful. J. ComputAided Mol Des 28:699-710. http://doi.org/10.1007/s10822-014-9757-8
9. Matta CF, Massa L, Gubskaya AV, Knoll E (2011) Can one take the logarithm or the sine of adimensioned quantity or a unit? Dimensional analysis involving transcendental functions. J ChemEduc 88:67-70. http://dx.doi.org/10.1021/ed1000476
10. Birch AM, Kenny PW, Simpson I, Whittamore PRO (2009) Matched molecular pair analysis of activityand properties of glycogen phosphorylase inhibitors. Bioorg Med Chem Lett 19:850-853.http://doi.org/10.1016/j.bmcl.2008.12.003
11. Chodera JD, Mobley DL, Shirts MR, Dixon RW, Branson K, Pande VS (2011) Alchemical free energymethods for drug discovery: progress and challenges. Curr Opin Struct Biol 21:150-160.http://doi.org/10.1016/j.sbi.2011.01.011
12. Cournia Z, Allen B, Sherman W (2017) Relative binding free energy calculations in drug discovery: recent advances and practical considerations. J Chem Inf Model 57:2911-2937. http://dx.doi.org/10.1021/acs.jcim.7b00564
13. Nicolaou CA, Brown N (2013) Multi-objective optimization methods in drug design. Drug DiscovToday Technol 10:e427-e435. http://doi.org/10.1016/j.ddtec.2013.02.001
14. Kenny PW, Montanari CA (2013) Inflation of correlation in the pursuit of drug-likeness. J Comput-Aided Mol Des 2013, 27, 1-13. http://doi.org/10.1007/s10822-012-9631-5
15. Mateus A, Matsson P, Artursson P (2013) Rapid measurement of intracellular unbound drugconcentrations. Mol Pharm 10:2467-2478. http://dx.doi.org/10.1021/mp4000822
16. Gordon LJ, Allen M, Artursson P, Hann MM, Leavens BJ, Mateus A, Readshaw S, Valko K, Wayne GJ,West A (2016) Direct measurement of intracellular compound concentration by RapidFire mass spectrometry offers insights into cell permeability. J Biomol Screen 21:156-164. http://doi.org/10.1177/1087057115604141
40

17. Oprea TI, Davis AM, Teague SJ, Leeson PD (2001) Is there a difference between leads and drugs? Ahistorical perspective. J Chem Inf Comput Sci 41:1308-1315. http://dx.doi.org/10.1021/ci010366a
18. Hann MM, Leach AR, Harper G (2001) Molecular complexity and its impact on the probability offinding leads for drug discovery. J Chem Inf Comp Sci 41:856-864.http://dx.doi.org/10.1021/ci000403i
19. Teague SJ, Davis AM, Leeson PD, Oprea T (1999) The design of leadlike combinatorial libraries.Angew Chem Int Ed Engl 38:3743-3748. http://doi.org/10.1002/(SICI)1521-3773(19991216)38:24<3743::AID-ANIE3743>3.0.CO;2-U
20. Lipinski CA, Lombardo F, Dominy BW, Feeney PJ (1997) Experimental and computational approachesto estimate solubility and permeability in drug discovery and development settings. Adv Drug DeliveryRev 23:4-25. http://doi.org/10.1016/S0169-409X(96)00423-1
21. Boehm HJ, Boehringer M, Bur D, Gmuender H, Huber W, Klaus W, Kostrewa D, Kuehne, H, LuebbersT, Meunier-Keller N, Mueller F (2000) Novel inhibitors of DNA gyrase: 3D structure based biasedneedle screening, hit validation by biophysical methods, and 3D guided optimization. A promisingalternative to random screening. J Med Chem 43:2664-2674. http://doi.org/10.1021/jm000017s
22. Blomberg N, Cosgrove DA, Kenny PW, Kolmodin K (2009) Design of compound libraries forfragment screening. J Comput Aided Mol Des 23:513-525. http://doi.org/10.1007/s10822-009-9264-5
23. Nicholls A, McGaughey GB, Sheridan RP, Good AC, Warren G, Mathieu M, Muchmore SW, BrownSP, Grant JA, Haigh JA, Nevins N, Jain AN, Kelley B (2010) Molecular shape and medicinalchemistry: A perspective. J Med Chem 53:3862-3886. http://dx.doi.org/10.1021/jm900818s
24. Richards FM (1977) Areas, volumes, packing, and protein structure. Ann Rev Biophys Bioeng 6:151-176. http://dx.doi.org/10.1146/annurev.bb.06.060177.001055
25. Pettit FK, Bowie JU (1999) Protein surface roughness and small molecular binding sites. J Mol Biol285:1377-1382. http://doi.org/10.1006/jmbi.1998.2411
26. Persch E, Dumele O, Diederich F (2015) Molecular recognition in chemical and biological systems.Angew Chem Int Ed 54:3290-3327. http://doi.org/10.1002/anie.201408487
27. Bissantz C, Kuhn B, Stahl M (2010) A medicinal chemist’s guide to molecular interactions. J MedChem 53:5061-5064. http://doi.org/10.1021/jm100112j
28. Mark AE, van Gunsteren WF (1994) Decomposition of the free energy of a system in terms of specificinteractions. Implications for theoretical and experimental studies. J Mol Biol 240:167-176.http://doi.org/10.1006/jmbi.1994.1430
29. van de Waterbeemd H, Smith DA, Beaumont K, Walker DK (2001) Property-based design:optimization of drug absorption and pharmacokinetics. J Med Chem. 44:1313-1333.http://dx.doi.org/10.1021/jm000407e
30. Meanwell NA (2011) Improving drug candidates by design: a focus on physicochemical properties as ameans of improving compound disposition and safety. Chem Res Toxicol 24:1420-1456.http://dx.doi.org/10.1021/tx200211v
31. Keserű GM, Erlanson DA, Ferenczy GG, Hann MM, Murray CW, Pickett SD (2016) Design principlesfor fragment libraries − Maximizing the value of learnings from pharma fragment based drug discovery(FBDD) programs for use in academia. J Med Chem 59:8189-8206.http://dx.doi.org/10.1021/acs.jmedchem.6b00197
32. Kuntz ID, Chen K, Sharp KA, Kollman PA (1999) The maximal affinity of ligands. Proc Natl Acad SciUSA 96:9997-10002. http://doi.org/10.1073/pnas.96.18.9997
33. Hajduk PJ (2006) Fragment-based drug design: how big is too big? J Med Chem 49:6972-6976.http://doi.org/10.1021/jm060511h
41

34. Saxty G, Woodhead SJ, Berdini V, Davies TG, Verdonk ML, Wyatt PG, Boyle RG, Barford D,Downham R, Garrett MD, Carr RA (2007) Identification of inhibitors of protein kinase B usingfragment-based lead discovery. J Med Chem 50:2293-2296. http://dx.doi.org/10.1021/jm070091b
35. Hammett LP (1937) The effect of structure upon the reactions of organic compounds. Benzenederivatives. J Am Chem Soc 59:96-103. http://dx.doi.org/10.1021/ja01280a022
36. Hammett LP (1938) Linear free energy relationships in rate and equilibrium phenomena. J Chem SocFaraday Trans 34:156-165. http://dx.doi.org/10.1039/TF9383400156
37. Maggiora GM (2006) On outliers and activity cliffs – Why QSAR often disappoints. J Chem Inf Model46:1535-1535. http://doi.org/10.1021/ci060117s
38. Stumpfe D, Bajorath J (2012) Exploring activity cliffs in medicinal chemistry. J Med Chem 55:2932-2942. http://doi.org/10.1021/jm201706b
39. Gilson MK, Given JA, Bush BL, McCammon JA (1997) The statistical-thermodynamic basis forcomputation of binding affinities: a critical review. Biophys J 72:1047-1069.http://doi.org/10.1016/S0006-3495(97)78756-3
40. Leeson PD, Springthorpe B (2007) The influence of druglike concepts on decision-making in medicinalchemistry. Nat Rev Drug Discov 6:881-890. http://doi.org/10.1038/nrd2445
41. Ryckmans T, Edwards MP, Horne VA, Correia AM, Owen DR, Thompson LR, Tran I, Tutt MF, YoungT (2009) Rapid assessment of a novel series of selective CB2 antagonists using parallel synthesisprotocols: a lipophilic efficiency analysis. Bioorg Med Chem Lett 19:4406-4409.https://doi.org/10.1016/j.bmcl.2009.05.062
42. Borges NM, Kenny PW, Montanari CA, Prokopozyk IM, Ribeiro JF, Rocha JR, Sartori GR (2017) Theinfluence of hydrogen bonding on partition coefficients. J Comput-Aided Mol Des 31:163-181.http://doi.org/10.1007/s10822-016-0002-5
43. Maynard AT, Roberts CD (2016) Quantifying, visualizing, and monitoring lead optimization. J MedChem 59:4189-4201. http://dx.doi.org/10.1021/acs.jmedchem.5b00948
44. Fiedler K (2011) Voodoo correlations are everywhere — Not only in neuroscience. Perspect PsycholSci 6:163-171. http://doi.org/10.1177/1745691611400237
45. Hopkins AL, Mason JS, Overington JP (2006) Can we rationally design promiscuous drugs? Curr OpinStruct Biol 16:127-136. http://doi.org/10.1016/j.sbi.2006.01.013
46. Cumming JG, Davis AM, Muresan S, Haeberlein M, Chen H. Chemical predictive modelling toimprove compound quality. Nature Rev Drug Discov 12:948-962. http://doi.org/10.1038/nrd4128
47. Oprea TI, Hasselgren C (2017) Predicting target and chemical druggability. In ComprehensiveMedicinal Chemistry III; Chackalamannil S, Rotella D, Ward S, Eds; Elsevier pp 429-439.http://dx.doi.org/10.1016/B978-0-12-409547-2.12342-X
48. Leeson PD, Young RJ (2015) Molecular property design: does everyone get it? ACS Med Chem Lett6:722-725. http://dx.doi.org/10.1021/acsmedchemlett.5b00157
49. Scott DE, Coyne AG, Hudson SA, Abell C (2012) Fragment-based approaches in drug discovery andchemical biology. Biochem 51:4990-5003. http://dx.doi.org/10.1021/bi3005126
50. Jencks WP (1981) On the attribution and additivity of binding energies. Proc Natl Acad Sci USA78:4046-4050. http://doi.org/10.1073/pnas.78.7.4046
51. Free SM, Wilson JW (1964) A Mathematical contribution to structure-activity studies. J Med Chem7:395-399. http://doi.org/10.1021/jm00334a001
52. Andrews PR, Craik DJ, Martin JL (1984) Functional group contributions to drug-receptor interactions .J Med Chem 27:1648-1657. http://dx.doi.org/10.1021/jm00378a021
42

53. Reynolds CH, Reynolds RC (2017) Group additivity in ligand binding affinity: an alternative approachto ligand efficiency. J Chem Inf Model 57:3086-3093. http://dx.doi.org/10.1021/acs.jcim.7b00381
54. Ladbury JE (2007) Enthalpic efficiency and the role of thermodynamic data in drug development: possibility or a pipeline dream. Eur Pharm Rev 12:59-62. http://www.europeanpharmaceuticalreview.com/article/1835/enthalpic-efficiency-and-the-role-of-thermodynamic-data-in-drug-development-possibility-or-a-pipeline-dream/
55. Bogan AA, Thorn KS (1998) Anatomy of hot spots in protein interfaces. J Mol Biol 280:1-9.http://doi.org/10.1006/jmbi.1998.1843
56. Edfeldt FNB, Folmer RHA, Breeze AL (2011) Fragment screening to predict druggability(ligandability) and lead discovery success. Drug Discov Today 16:284-287.http://doi.org/10.1016/j.drudis.2011.02.002
57. Krimmer SG, Cramer J, Schiebel J, Heine A, Klebe G (2017) How nothing boosts affinity:hydrophobic ligand binding to the virtually vacated S1′ pocket of thermolysin. J Am Chem Soc139:10419-10431. http://dx.doi.org/10.1021/jacs.7b05028
58. Murray CW, Erlanson DA, Hopkins AL, Keseru GM, Leeson PD, Rees DC, Reynolds CH, RichmondNJ (2014) Validity of ligand efficiency metrics. ACS Med Chem Lett 5:616-618.http://doi.org/10.1021/ml500146d
59. Reynolds CH (2015) Ligand efficiency metrics: why all the fuss? Future Med Chem 7:1363-1365.http://doi.org/10.4155/fmc.15.70
60. May PC, Dean RA, Lowe SL, Martenyi F, Sheehan SM, Boggs LN, Monk SA, Mathes BM, MergottDJ, Watson BM, Stout SL, Timm DE, LaBell ES, Gonzales CR, Nakano M, Jhee SS, Yen M,Ereshefsky L, Lindstrom TD, Calligaro DO, Cocke PJ, Hall DG, Friedrich S, Citron M, Audia JE(2011) Robust central reduction of Amyloid-β in humans with an orally available, non-peptidic β-secretase inhibitor. J Neurosci 31:16507-16516. http://doi.org/10.1523/JNEUROSCI.3647-11.2011
61. Czaplewski LG, Collins I, Boyd EA, Brown D, East SP, Gardiner M, Fletcher R, Haydon DJ, HenstockV, Ingram P, Jones C, Noula C, Kennison L, Rockley C, Rose V, Thomaides-Brears HB, Ure R,Whittaker M, Stokes NR (2009) Antibacterial alkoxybenzamide inhibitors of the essential bacterial celldivision protein FtsZ. Bioorg Med Chem Lett 19:524-527. http://doi.org/10.1016/j.bmcl.2008.11.021
62. Doak BC, Zheng J, Dobritzsch D, Kihlberg J (2016) How beyond rule of 5 drugs and clinicalcandidates bind to their targets. J Med Chem 59:2312-2327.http://dx.doi.org/10.1021/acs.jmedchem.5b01286
63. Verlinde CLJ, Rudenko G, Hol WG (1992) In search of new lead compounds for trypanosomiasis drugdesign: A protein structure-based linked-fragment approach. J. Comput-Aided Mol Des 6:131-147.https://doi.org/10.1007/BF00129424
64. Carr RA, Congreve M, Murray CW, Rees DC (2005) Fragment based lead discovery: leads by design.Drug Discov Today 10:987-992. http://doi.org/10.1016/S1359-6446(05)03511-7
65. Albert JS, Blomberg N, Breeze AL, Brown AJ, Burrows JN, Edwards PD, Folmer RH, GeschwindnerS, Griffen EJ, Kenny PW, Nowak T, Olsson LL, Sanganee H, Shapiro AB (2007) An integratedapproach to fragment-based lead generation: philosophy, strategy and case studies from AstraZeneca’sdrug discovery programmes. Curr Top Med Chem 7:1600-1629.http://doi.org/10.2174/156802607782341091
66. Hubbard RE, Murray JB (2011) Experiences in fragment-based lead discovery. Methods Enzymol493:509-531. https://doi.org/10.1016/B978-0-12-381274-2.00020-0
67. Davis BJ, Roughley SD (2017) Fragment-based lead discovery. Ann Rep Med Chem 50:371-439.http://doi.org/10.1016/bs.armc.2017.07.002
68. Lamoree B, Hubbard RE (2017) Current perspectives in fragment-based lead discovery (FBLD).Essays Biochem 61:453-464. http://dx.doi.org/10.1042/EBC20170028
43

69. Miranker A, Karplus M (1991) Functionality maps of binding sites: a multiple copy simultaneoussearch method. Proteins 11:29-34. http://doi.org/10.1002/prot.340110104
70. Böhm H-J (1992) The computer program LUDI: a new method for the de novo design of enzymeinhibitors. J Comput-Aided Mol Des 6:61-78. http://doi.org/10.1007/BF00124387
71. Allen KN, Bellamacina CR, Ding X, Jeffery CJ, Mattos C, Petsko GA, Ringe D (1996) Anexperimental approach to mapping the binding surfaces of crystalline proteins. J Phys Chem 100:2605-2611. http://doi.org/10.1021/jp952516o
72. Shuker SB, Hajduk PJ, Meadows RP, Fesik SW (1996) Discovering high-affinity ligands for proteins:SAR by NMR. Science 274:1531-1534. http://doi.org/10.1126/science.274.5292.1531
73. McCoy MA, Wyss DF (2002) Spatial localization of ligand binding sites from electron current densitysurfaces calculated from NMR chemical shift perturbations. J Am Chem Soc 124:11758-11763.http://dx.doi.org/10.1021/ja026166c
74. Erlanson DA, Fesik SW, Hubbard RE, Jahnke W, Jhoti H (2016) Twenty years on: the impact offragments on drug discovery. Nat Rev Drug Discov 15:605-619.http://dx.doi.org/10.1038/nrd.2016.109
75. Johnson CN, Erlanson DA, Jahnke W, Mortenson PN, Rees DC (2018) Fragment-to-lead medicinal chemistry publications in 2016. J Med Chem 61:1774-1784. http://dx.doi.org/10.1021/acs.jmedchem.7b01298
76. Mannhold R, Poda GI, Ostermann C, Tetko IV (2009) Calculation of molecular lipophilicity: State-of-the-art and comparison of log P methods on more than 96000 compounds. J Pharm Sci 98:861-893. http://doi.org/10.1002/jps.21494
77. Congreve M, Carr R, Murray C, Jhoti H (2003) A “rule of three” for fragment-based lead discovery?Drug Discov Today 8:876-877. http://doi.org/10.1016/S1359-6446(03)02831-9
78. Köster H, Craan T, Brass S, Herhaus C, Zentgraf M, Neumann L, Heine A, Klebe GA (2011) Smallnonrule of 3 compatible fragment library provides high hit rate of endothiapepsin crystal structureswith various fragment chemotypes, J Med Chem 54:7784-7796. http://dx.doi.org/10.1021/jm200642w
79. Meanwell NA (2011) Synopsis of some recent tactical application of bioisosteres in drug design. J MedChem 54:2529-2591. http://doi.org/10.1021/jm1013693
80. Herr RJ (2002) 5-Substituted-1H-tetrazoles as carboxylic acid isosteres: medicinal chemistry andsynthetic methods. Bioorg Med Chem 10:3379-3393. http://doi.org/10.1016/S0968-0896(02)00239-0
81. Ammazzalorso A, De Filippis B, Giampietro L, Amoroso R (2017) N-acylsulfonamides: syntheticroutes and biological potential in medicinal chemistry. Chem Biol Drug Des 90:1094-1105.http://doi.org/10.1111/cbdd.13043
82. Geschwindner S, Olsson LL, Albert JS, Deinum J, Edwards PD, Beer T, Folmer RH (2007) Discoveryof a novel warhead against beta-secretase through fragment-based lead generation. J Med Chem50:5903-5911. http://doi.org/10.1021/jm070825k
83. Edwards P D, Albert J S, Sylvester M, Aharony D, Andisik D, Callaghan O, Campbell J B, Carr R A,Chessari G, Congreve M, Frederickson M, Folmer R H, Geschwindner S, Koether G, Kolmodin K,Krumrine J, Mauger R C, Murray C W, Olsson L L, Patel S, Spear N, Tian G (2007) Application offragment-based lead generation to the discovery of novel, cyclic amidine beta-secretase Inhibitors withnanomolar potency, cellular activity, and high ligand efficiency. J Med Chem 50:5912-5925.https://doi.org/10.1021/jm070829p
84. Silva DG, Ribeiro JFR, De Vita D; Cianni L, Franco CH, Freitas-Junior LH, Moraes CB, Rocha JR,Burtoloso ACB, Kenny PW, Leitão A, Montanari CA (2017) A comparative study of warheads fordesign of cysteine protease inhibitors. Bioorg Med Chem Lett 27:5031-5035.https://doi.org/10.1016/j.bmcl.2017.10.002
44

85. Verdonk ML, Rees DC (2008) Group efficiency: a guideline for hits-to-leads chemistry.ChemMedChem 3:1179-1180. https://doi.org/10.1002/cmdc.200800132
86. Bridges AJ, Zhou H, Cody DR, Rewcastle GW, McMichael A, Showalter HD, Fry DW, Kraker AJ,Denny WA (1996) Tyrosine kinase inhibitors. 8. An unusually steep structure-activity relationship foranalogues of 4-(3-bromoanilino)-6,7- dimethoxyquinazoline (PD 153035), a potent inhibitor of theepidermal growth factor receptor. J Med Chem 39:267-276. http://dx.doi.org/10.1021/jm9503613
87. Dill KA (1997) Additivity principles in biochemistry. J Biol Chem 272:701-704. http://dx.doi.org/10.1074/jbc.272.2.701
88. Baum B, Muley L, Smolinski M, Heine A, Hangauer D, Klebe G (2010) Non-additivity of functionalgroup contributions in protein-ligand binding: a comprehensive study by crystallography andisothermal titration calorimetry. J Mol Biol 397:1042-1054. http://doi.org/10.1016/j.jmb.2010.02.007
89. Biela A, Betz M, Heine A, Klebe G (2012) Water makes the difference: rearrangement of watersolvation layer triggers non-additivity of functional group contributions in protein-ligand binding.ChemMedChem 7:1423-1434. http://doi.org/10.1002/cmdc.201200206
90. Kramer C, Fuchs JE, Liedl KR (2015) Strong nonadditivity as a key structure–activity relationshipfeature: distinguishing structural changes from assay artifacts. J Chem Inf Model 55:483-494.http://dx.doi.org/10.1021/acs.jcim.5b00018
91. Calabrò G, Woods CJ, Powlesland F, Mey ASJS, Mulholland AJ, Michel J (2016) Elucidation ofnonadditive effects in protein-ligand binding energies: thrombin as a case study. J Phys Chem B120:5340-5350. http://dx.doi.org/10.1021/acs.jpcb.6b03296
92. Murray CW, Carr MG, Callaghan O, Chessari G, Congreve M, Cowan S, Coyle JE, Downham R,Figueroa E, Frederickson M, Graham B, McMenamin R, O’Brien MA, Patel S, Phillips TR, WilliamsG, Woodhead AJ, Woolford A (2010) J. Fragment-based drug discovery applied to Hsp90. Discovery oftwo lead series with high ligand efficiency. J Med Chem 53:5942-5955.http://dx.doi.org/10.1021/jm100059d
93. Shultz MD (2013) Setting expectations in molecular optimizations: strengths and limitations ofcommonly used composite parameters. Bioorg Med Chem Lett 23:5980-5991.https://doi.org/10.1016/j.bmcl.2013.08.029
94. Reynolds CH, Tounge BA, Bembenek SD (2008) Ligand binding efficiency: trends, physical basis, andimplications. J Med Chem 51:2432-2438. https://doi.org/10.1021/jm701255b
95. Sheridan RP (2016) Debunking the idea that ligand efficiency indices are superior to pIC50 as QSARactivities. J Chem Inf Model 56:2253-2262. http://dx.doi.org/10.1021/acs.jcim.6b00431
45

download fileview on ChemRxivpwk_le_oct2018_v1.0.docx (777.12 KiB)