the nature of regional policy work in canada’s federal
TRANSCRIPT

CanadianPoliticalScienceReview3(1)March2009
TheNatureofRegionalPolicyWork(34‐56) 34
TheNatureofRegionalPolicyWorkinCanada’sFederalPublicService
AdamM.Wellstead(NaturalResourcesCanada),RichardC.Stedman(CornellUniversity)andEvertA.Lindquist(UniversityofVictoria)1
Abstract1
This paper compares rank‐and‐file policy‐based Canadian federal governmentemployees both in the National Capital Region and in the regions. Datawascollected from an online survey, the results find a number of significantdifferences between the two groups in terms of demographics, tasks, andattitudes. Weconcludethatregionalorientedpolicytasksarecarriedoutbyarelatively few number of people and this group is, at best, on themargins ofwhat could be considered to policy work. These differences may have asignificantimpactonthefederalgovernment’soverallpolicycapacity.
Introduction
ForacountryaslargeasCanada,itsnationalcivilserviceismoreconcentratedwithinitscapitalcity‐‐theNationalCapitalRegion(NCR)(Ottawa‐Gatineau)—thaninotherindustrializedcountriessuchastheU.K.andtheU.S.(LeGoff2006).In2006,theNCRaccountedfor113,800(31%)ofall369,300 federal government civil servant positions (LeGoff 2006). Those involved in policyrelated work (e.g., preparing briefing notes, environmental scans, research) are especiallyconcentratedwithinCanada’scapital.Thisgrouphasbeenthefocusofanumberofstudiesandreports(Prince1979;Anderson1996;Fellegi1996;Côtéetal2007;Voyer2007).
Instarkcontrast,theroleoffederalgovernmentregionalpolicyworkisseldomraisednorhasitbeen the subject of public administration‐based scholarly investigation. However, withCanada’s increasinglydecentralized federal system,a trend towardsdevolvingnetwork‐based,andmorelocalizedgovernance,thequestionofregionalpolicyworkwillbecomeanimportantconsiderationinfuturefederalgovernmentdecision‐making.
1AdamM.Wellstead,NaturalResourcesCanadaNorthernForestryCentre,5320122ndStreet,Edmonton,Alberta, T6E 3S5 Canada [email protected]; Richard C. Stedman Department of Natural Resources122D Fernow Hall, Cornell University, Ithaca, NY 14850 USA [email protected]; and Evert A. LindquistSchool of Public Administration, University of Victoria Victoria, British Columbia V8W 2Y2 [email protected]
CanadianPoliticalScienceReview3(1)March2009
TheNatureofRegionalPolicyWork(34‐56) 35
Thispapercompareskeyattributessuchasthebackground,taskscarriedout,networks,andtheattitudes of NCR and regionally based “rank‐and‐file” federal government employeesresponsible for policy work. Two major research questions are posed. First, are theresignificantdifferencesbetweenregionalandNationalCapitalRegion(NCR)policyrespondentsinthetypeofworkundertakenortheirattitudestowardsthepolicyprocess?Orisregionalpolicyworkmerelywhat Pitkin (1967) refers to as a “descriptive” ormirror representation ofwhatoccursintheNCR?Todoso,wecomparethemeanscoresofthetwogroups(regionalvs.NCRbased respondents) from such variables as demographic characteristics, roles, networks, andpolicyorientedattitudes.Second,ifregionalpolicy‐basedemployeesareindeeddifferentfromtheir NCR counterparts, how can they be characterized based upon the typologies that havebeendeveloped inthe literature? And,what is theirarole inthefederalpolicyprocess? Weargue that the differences between the two groupsmay present a number of policy capacityimplicationsforthefederalgovernment.
PolicyCapacityandPolicyWork
There are two sources of literature considered in this paper. The first examines the broaderquestionofwhatdrivespolicycapacitywithinthestate.Thepolicycapacityliteratureexamineshowthestatecanrespondtothepoliticalsystemthroughitspolicychoices(PainterandPierre2005).Thesecondbodyofliteratureexaminestheroleofthosewhoactuallyundertakepolicywork:thepolicyanalysts.Understandingthechangingroleofpolicyanalystsprovidesonekeyindicator of policy capacity. Scholars who investigate the role of policy work focus on theprofession. By doing so, they become more interested in the bureaucratic capacity,competency, and commitments within departments and agencies rather than the broaderquestionofpolicycapacity(LindquistandDesveaux2007).
There aremany competing definitions of policy capacity. Honadle (1981) defines it as “theability to: anticipate and influence change;make informed, intelligent decisions about policy;develop programs to implement policy; attract and absorb resources;manage resources; andevaluatecurrentactivitiestoguidefutureaction”(p.578).Othersaremoreconcernedwiththeability to respondtochange (Weiss1998), the intellectualandorganizational resourcesof thestate (Cummings and Nørgaard 2004), knowledge management and organizational learning(Parsons2004),orwithpolicyformulation(GoetzandWollmann2001).Withthesedefinitionsin hand, scholars have asked whether policy capacity has declined in light of public servicereforms? In the case of the Canadian experience, there has been amixed response. Bakvis(2000) contends that some departments have improved their capacity. Prince and Chenier(1980)andHollanderandPrince(1993)highlightthehistoricaldevelopmentandtheimportanceof policy units within departments. Voyer (2007) notes that some federal governmentdepartments suchas theDepartmentof Finance,HumanResourcesDevelopment,andHealthCanada have responded by increasing their long term research and analytical capacities.Despite these changes, he found that “the tyrannyof theurgent still dominants” policyworkacrossalldepartments(Voyer2007,p.232).
Canadian federal policy capacity research has a long history (Prince 1979; Prince 1983). Thisliterature points to a decline in such capacity.Weak federal government policy capacity hasbeen acknowledgedby those in Canadianpublic administration circles forwell over a decade

CanadianPoliticalScienceReview3(1)March2009
TheNatureofRegionalPolicyWork(34‐56) 36
(Howlett2009b). In1995,theClerkof thePrivyCouncilofCanadaestablishedatask forcetoexamine the existing federal policy making processes and make recommendations. The taskforcereportknownastheFellegiReport–foundthattheemphasisonmanagerialismcombinedwithgrowingpublicscrutinyhascontributedto thegovernment’sdeclining functionsas ithassimultaneously augmented the need for a strong federal policy capacity (Fellegi 1996). In arecentreport,AVitalNationalInstitution?WhataCross‐SectionofCanadiansThinkabouttheProspects for Canada’s Public Service in the 21st Century, the Public Policy Forum (PPF), anOttawabasedthinktank,examinedanumberofissuesimpactingCanada’sfederalcivilservice,oneofthembeingtheenduringproblemofpolicycapacity.BasedonaseriesofcrossCanadaworkshops,leadingpublicserviceexpertsconcluded“thatthedevelopmentofpolicyoptionsistoo removed from ‘on the ground’ considerations related to the effective implementation ofpolicy”(Côtéetal2007).OtherliteraturecontendsthatthestateofCanadianpolicycapacityisat best, unknown (Howlett and Lindquist 2007), and atworst, non‐existent or in severe crisis(Savoie2003).Ineithercase,thechallengeforgovernmentstodayistodeterminetheirexistingpolicycapacityandthendecide thepreferredmixof resourcesskillsandexpertise thatwouldstrengthenit.
There is alsoa large literatureexamining the rolesof thoseengaged inpolicywork.Meltsner(1976)producedoneofthefirsttypologiesofpolicyanalysts,laterusedbyDurningandOsuna(1994),Mayeretal(2004),andHoppeandJeliazkova(2006).Meltsnercontendedthatanalysts’particularpolicystyledependsontheirendowmentsofpoliticalandanalyticalskillswhichareshaped by their unique combination of education, professional training, beliefs, and personalmotivations.Thefourdifferentcombinationsoflevels(high/low)ofanalyticalandpoliticalskillscorrespondedtofourdifferenttypesofpolicyanalysts:technicians,politicians,entrepreneurs,andpretenders(1976,p.15).
Durning andOsuna (1994) state the “the variety andmulti‐faceted nature of policy analysismakesitclearthatthereisnosingle,letalone‘onebest’,wayofconductingpolicyanalyses.Thedisciplineconsistsofmanydifferentschools,approaches,rolesandmethods.”TheyrespondedbystudyingtheorganizationalrolesandvalueorientationsadoptedbyanalystsinthreeUSStategovernments.IndoingsotheyfoundasignificantoverlapwithMeltsner’smodel.Inparticular,the location of the individual within the organization aswell as their educational attainmentlevelwasstronglyassociatedwithdifferencesinpolicywork. Thisworkincludedresearchandanalysis, designing and recommending, the clarification of arguments and values, providingstrategicadvice,andmediation.Mayeretal(2004)presentthemostcomprehensiveoverviewof the components that define contemporary policy capacity. They present six interactingactivities: research and analysis, design and recommendation, providing strategic advice,mediation,clarificationofvaluesandarguments,andthedemocratizationofinformationflows.Moreover,policywork,theyargueisalsoidentifiedbydifferentstylesandunderlyingvalues.
CurrentPolicyContext
Lindquist and Desveaux (2007) argue that the effectiveness of policy work within currentgovernance structures (i.e. alternative service delivery and decentralization) will invariablydependonrecruitmentpracticesandtheabilityofmanagers tobalanceshort‐termobjectiveswithlong‐termstrategies.Recentliteraturehasfocusedondetailingtherapidlychangingstate

CanadianPoliticalScienceReview3(1)March2009
TheNatureofRegionalPolicyWork(34‐56) 37
of government bureaucracies in what has been coined the “new environment” (Rasmussen,1999; Savoie, 2003; Pal, 2005; Prince, 2007). This setting for policy analysis has beencharacterized by 1) a diverse set of internal and external actors equipped with valuableresources who are keen on providing their policy guidance to government; 2) the public’sdeclining trust inbothpoliticiansand thebureaucraciesand thus theirdesire tobeevermoreinvolvedinthepolicy‐makingprocess;3)ageneraltrendtowardsprivatizationofoperationsandprogram delivery brought on in the spirit of New Public Management (NPM); and finally 4)adapting tonew localizedgovernancearrangements thatemphasize the roleofnetworks. Allthese trends point to the growing complexity in public administration, particularly a growingevolutionbetweenlocalandnationalissuesandactors(Shulock1999;Klijn2008).
Policy analysts are now expected to engage in greater consultation, consensus building andpublicdialogueaspartoftheirpolicyworkwhichinevitablyleaveslessspaceforthetraditionaltypeofpolicyanalysis.Moreover, thisnewenvironmenthasresulted inthebreakdownoftheimplicit bargain thatwas traditionally struck betweenpublic servants and theirministers: theformer would offer professionalism, discretion, and non partisan loyalty to the latter inexchangeforanonymityandsecurityoftenure(Savoie2003).
OpeningupthisrelationshiptopublicscrutinythroughmeasuressuchtheAccesstoInformationAct1985andtheFederalAccountabilityAct2007hasprofoundlytransformedtheethosofthepublic service, especiallywith respect to how andwhat information is exchanged, effectivelyblurringthe linebetween“partisanpoliticsandpublicadministration”(Savoie2003). Withoutthe anonymity that protects the public service from being influenced by political processes,public officials are now inclined to promote the easy policy options that are certain to bepreferredbypoliticians,andtoengagein“policyfirefighting”byfocusingonimmediatepoliticalissueswithdisregard for long termpolicyplanning.Policymakershave increasinglydependedupon political and ideological preferences rather than formal analysis and modeling torationalizepolicydecisionsdue to thepoliticizationofpolicy thathasbeenbroughtonby themultitude of new actors in the policy‐making process (Painter and Pierre 2005). Thispoliticizationofthepolicy‐makingprocesshasinturnmeanttheerosionofanalyticalcapacityingovernment, and a new emphasis on public relations and environmental scans as modes ofpolicy advice (Peters 1995). Officials now use a wider set of policy instruments, includingprocedural ones such as private partnerships, roundtables, and funding to organized societalgroups.Recently,Howlett(2009b)arguedthatthesuccessofevidence‐basedpolicymakingwillhinge on enhanced policy analytical capacity. Policy failures throughout the policy process(agenda setting, policy formation, decision‐making, policy implementation, and policyevaluation),heargues,canbeovercomethoughenhancedcapacitymeasuressuchasbetterriskanalysis and assessment, research, or more emphasis on environmental scanning andforecastingmethods(Howlett2009b).
Thepolicycapacityandanalysis literatureshavescarcelyconsideredtheroleofregionalpolicywork. The exception is a dated 1996 Treasury Board Secretariat of Canada discussion paper,RegionalParticipationinthePolicyProcess.Thepaperarguedthatthe“[r]egionalsensitizationof departmental decision‐making must [also] be supported by government‐wide policy anddecision‐making processes” (Treasury Board Secretariat of Canada 1996). Moreover, policyroles beyond program delivery in areas such as issue identification, research, consultation,producingpolicyoptions,evaluation,andimplementationwerealsorecommended.Thereport
CanadianPoliticalScienceReview3(1)March2009
TheNatureofRegionalPolicyWork(34‐56) 38
alsosuggestedthatregionallybasedpolicystaffisengagedinahostofothertasks,mostnotablyprogramdeliveryandliaisonactivitieswiththepublicandstakeholders.
DataandMethods
Asurveyofregionally‐basedandNationalCapitalRegion(NCR)federalgovernmentemployeesengaged in policy relatedworkwas conducted in early 2007. For the regional portionof thesurvey, Regional Federal Council members provided contact information of those employeeswhomet thecriteriasetoutby the investigators. A totalof1,442peoplewere identified. Inaddition,theRegionalFederalCouncilmembersthemselvesweresurveyed(N=495).2AnonlinesurveyusingtheZoomerang®softwarewasdeployedduringautumn2006.Thesurveygarnered1125useableresponsesforanoverallresponserateof56.8%.Arandomsampleof725NCR‐basedpolicypeoplewas identifiedusing thepublicly accessibleonlineGovernmentElectronicDirectory Services (GEDS) using parallel criteria for inclusion. This secondonline survey alsousingtheZoomerang®surveywasdeployedinearly2007andgarnered395useableresponsesforanoverallresponserateof56.4%.WecomparethemeanscoresbetweentheregionalandNCRrespondentsusingat‐testforindependentsamples.
Results
Whoaretherespondents?
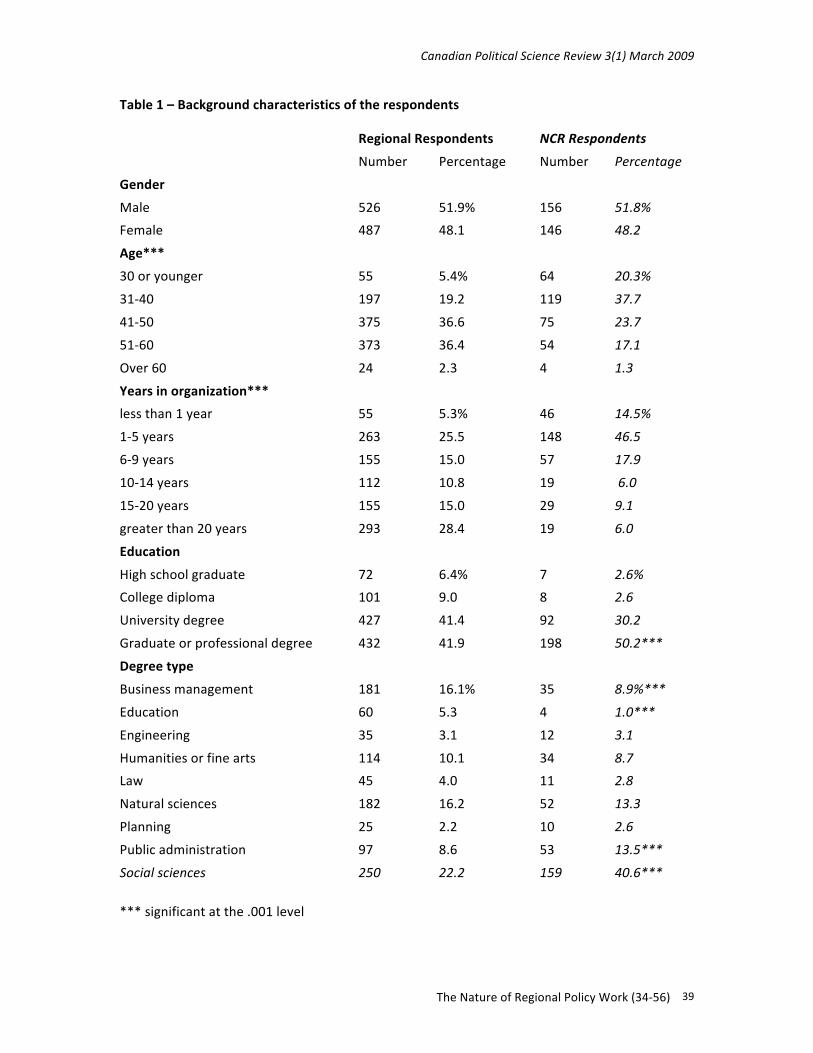
Table1compares themaindemographiccharacteristicsof theregionalandNCRrespondents.Regionalemployeeswereonaverageolderandtendedtohavehadlongertenureswithintheirrespectiveorganization. Althoughbothgroupswerewelleducated, thoseworking in theNCRwere more likely to have graduate level training (50.2% compared to 41.2%, p<.001). Thecontent of this training differed as well, NCR respondents were far more likely to hold auniversity degrees in public administration (13.5% versus to 8.6%, p<.001) and in the socialsciences (40.6% compared to 22.2%, p<.001). In contrast, regional policy people had moredegrees in business management (16.1% versus to 8.8%, p<.001) and in education (5.3%comparedto1.0%,p<.001).
CanadianPoliticalScienceReview3(1)March2009
TheNatureofRegionalPolicyWork(34‐56) 39
Table1–Backgroundcharacteristicsoftherespondents
RegionalRespondents NCRRespondents
Number Percentage Number Percentage
Gender
Male 526 51.9% 156 51.8%
Female 487 48.1 146 48.2
Age***
30oryounger 55 5.4% 64 20.3%
31‐40 197 19.2 119 37.7
41‐50 375 36.6 75 23.7
51‐60 373 36.4 54 17.1
Over60 24 2.3 4 1.3
Yearsinorganization***
lessthan1year 55 5.3% 46 14.5%
1‐5years 263 25.5 148 46.5
6‐9years 155 15.0 57 17.9
10‐14years 112 10.8 19 6.0
15‐20years 155 15.0 29 9.1
greaterthan20years 293 28.4 19 6.0
Education
Highschoolgraduate 72 6.4% 7 2.6%
Collegediploma 101 9.0 8 2.6
Universitydegree 427 41.4 92 30.2
Graduateorprofessionaldegree 432 41.9 198 50.2***
Degreetype
Businessmanagement 181 16.1% 35 8.9%***
Education 60 5.3 4 1.0***
Engineering 35 3.1 12 3.1
Humanitiesorfinearts 114 10.1 34 8.7
Law 45 4.0 11 2.8
Naturalsciences 182 16.2 52 13.3
Planning 25 2.2 10 2.6
Publicadministration 97 8.6 53 13.5***
Socialsciences 250 22.2 159 40.6***
***significantatthe.001level

CanadianPoliticalScienceReview3(1)March2009
TheNatureofRegionalPolicyWork(34‐56) 40
Beforeenteringthefederalcivilservice,theprivatesectorwasthelargestpreviousprofessionalgroup for both regional (38.2%) and NCR (40.6%) respondents, p=NS3. Nearly a third of NCRrespondents (30.4%) indicated that they came from an academic background compared to16.8% (p<.001) in the regions. Theonlyotherdifference inpreviousprofessionalbackgroundwas found in experience working for the provincial government. In this case, the regionsattractedmoreformerprovincialemployees(28%)comparedtoonly17%(p<.001)ofthesamegroupthatwenttoworkintheNCR.ThesurveyaskedrespondentsiftheyhadanyexperienceworkingintheNCR(andforNCRrespondents,theirexperienceintheregions).Wefoundthatthe regions are better connected to theNCR than the reverse. Of the regional respondents,36.6% indicated that they had worked in the NCR compared to17.1% (p<.001) of NCRrespondents hadworked in the region during the course of their federal government career.Another importantaspectofdefiningthedifferencesbetweenregionalandNCRpolicypeoplewastheirOfficialLanguageProficiencyDesignation.Wefoundthatregionalpolicypositionsaredominatedby theFederalgovernment’s “EnglishEssential” classification (62.1%)compared toan evenly mixed designation within the NCR.4 Furthermore, 47.4% from the regions hadundertakensometypeofformallanguagetrainingcomparedto56.0%fromtheNCR(p<.001)
Whatdotheydo?
Respondentswereaskediftheybelongedtoformalandinterdepartmentalpolicygroups(Table2).Welloverthreequarters(78.0%)oftheNCRrespondentsindicatedtheybelongedtoformalpolicy units, compared to only 39% of the regional respondents (p<.001). In the case ofinterdepartmental policy groups, the regional and NCR respondents indicated some level ofmembershipbutwithnostatisticaldifference(53.8%versus53.4%,p=NS).
Table2–Membershipinformalandinterdepartmentalpolicygroups
Regionalrespondents NCRrespondents
Memberofaformalpolicygroup 39.0% 78.0%***
Memberofaninterdepartmentalpolicygroup 53.8% 53.4%
***significantatthe.001level
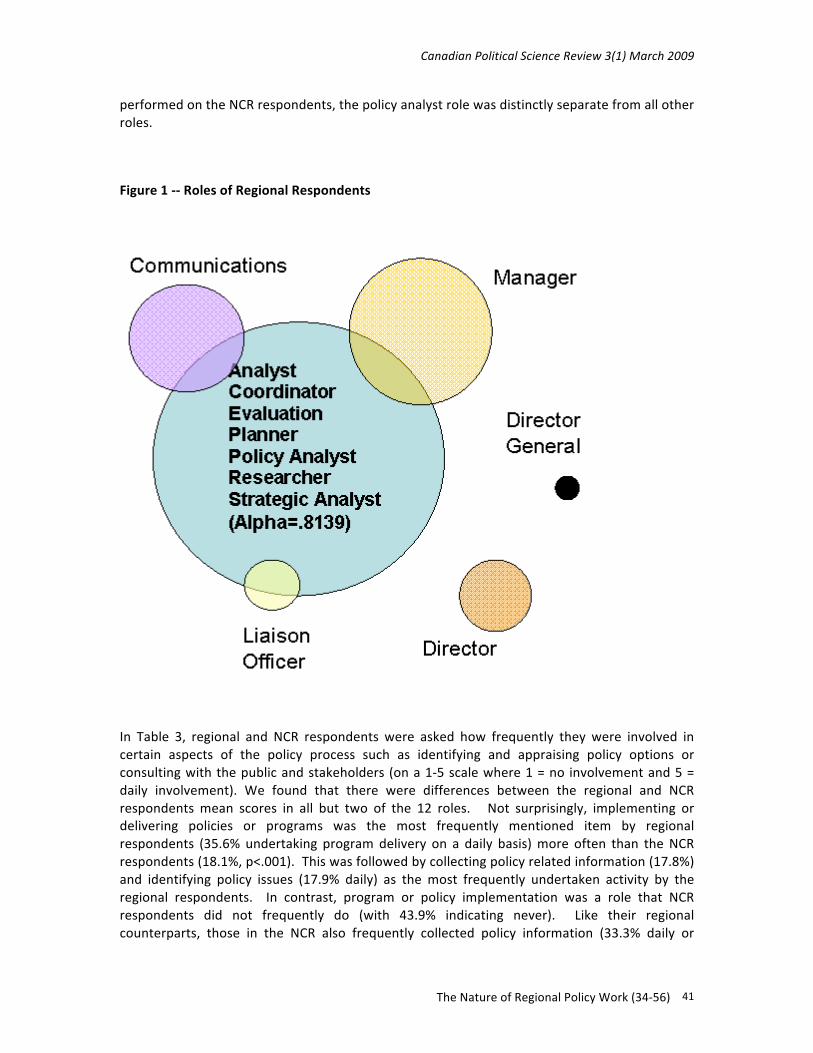
In Figure 1, the self identified roles of the regional respondents are illustrated. A reliabilityanalysis5 found that a majority of the respondents identified with seven roles (analyst,coordinator, evaluation, planner, policy analyst, researcher, strategic analyst). The strongCronbach’s Alpha score (.814) indicates that respondents identified with many differentfunctions and/or undertake multiple functions. In many cases, policy work was only one ofthosefunctions.Managers,communicationspersonnel,andliaisonofficersundertooksomeofthepolicyrelatedfunctionsbutalsoundertookseparateresponsibilities.DirectorsandDirectorGeneralsundertookcompletelyseparatepolicy‐relatedtasks.Whenasimilarreliabilitytestwas
CanadianPoliticalScienceReview3(1)March2009
TheNatureofRegionalPolicyWork(34‐56) 41
performedontheNCRrespondents,thepolicyanalystrolewasdistinctlyseparatefromallotherroles.
Figure1‐‐RolesofRegionalRespondents
In Table 3, regional and NCR respondents were asked how frequently they were involved incertain aspects of the policy process such as identifying and appraising policy options orconsultingwiththepublicandstakeholders(ona1‐5scalewhere1=no involvementand5=daily involvement). We found that there were differences between the regional and NCRrespondents mean scores in all but two of the 12 roles. Not surprisingly, implementing ordelivering policies or programs was the most frequently mentioned item by regionalrespondents (35.6% undertaking programdelivery on a daily basis)more often than theNCRrespondents(18.1%,p<.001).Thiswasfollowedbycollectingpolicyrelatedinformation(17.8%)and identifying policy issues (17.9% daily) as the most frequently undertaken activity by theregional respondents. In contrast, program or policy implementation was a role that NCRrespondents did not frequently do (with 43.9% indicating never). Like their regionalcounterparts, those in the NCR also frequently collected policy information (33.3% daily or

CanadianPoliticalScienceReview3(1)March2009
TheNatureofRegionalPolicyWork(34‐56) 42
weekly) and identified policy issues (30.7% daily or weekly). However, they did so morefrequently(p<.01).Theywerealsomoreinvolvedinotherpolicy‐relatedrolesuchasidentifyingpolicy options (x̄=3.56, 55.0% daily orweekly) (p<.01) and appraising policy options (x̄=3.45,51.3%dailyorweekly)(p<.01).Bothgroupsengagedfairlyinfrequentlywithotherswithinandoutsideofthefederalgovernment.Theregionalrespondentswereslightlymoreengagedonadailyorweeklybasiswiththepublic(12.7%versus9.9%,p<.05)andstakeholders(28.9%versus26.7%, p<.01) than their NCR counterparts. However, NCR respondents negotiated morefrequentlywithfederalgovernmentcentralagencies(e.g.,PrivyCouncil,TreasuryBoard)(14.7%comparedto11.0%,p<.01)
Table3‐‐Self‐identifiedrolesinthepolicymakingprocess
(Basedon1‐5scalewhere1=neverand5=daily)
Regionalrespondents NCRrespondents
Mean(ranking) Mean(ranking)Appraisepolicyoptions 2.78(8) 3.45(4)**Collectpolicy‐relateddata 2.77(9) 3.27(6)**Collectpolicy‐relatedinformation 3.17(3) 3.87(1)**Conductpolicy‐relatedresearch 2.49(10) 3.43(5)**Identifypolicyissues 3.28(2) 3.85(2)**Identifypolicyoptions 2.91(5) 3.56(3)**Implementordeliverpoliciesorprograms 3.42(1) 2.87(8)**Negotiatewithstakeholders 2.79(7) 2.73(9)Negotiatewithcentralagencies 1.99(12) 2.45(11)**Negotiatewithprogrammanagers 2.96(4) 2.88(7)Consultwiththepublic 2.12(11) 2.02(12)*Consultwithstakeholders 2.85(6) 2.65(10)**
**significantatthe.01level*significantatthe.05level
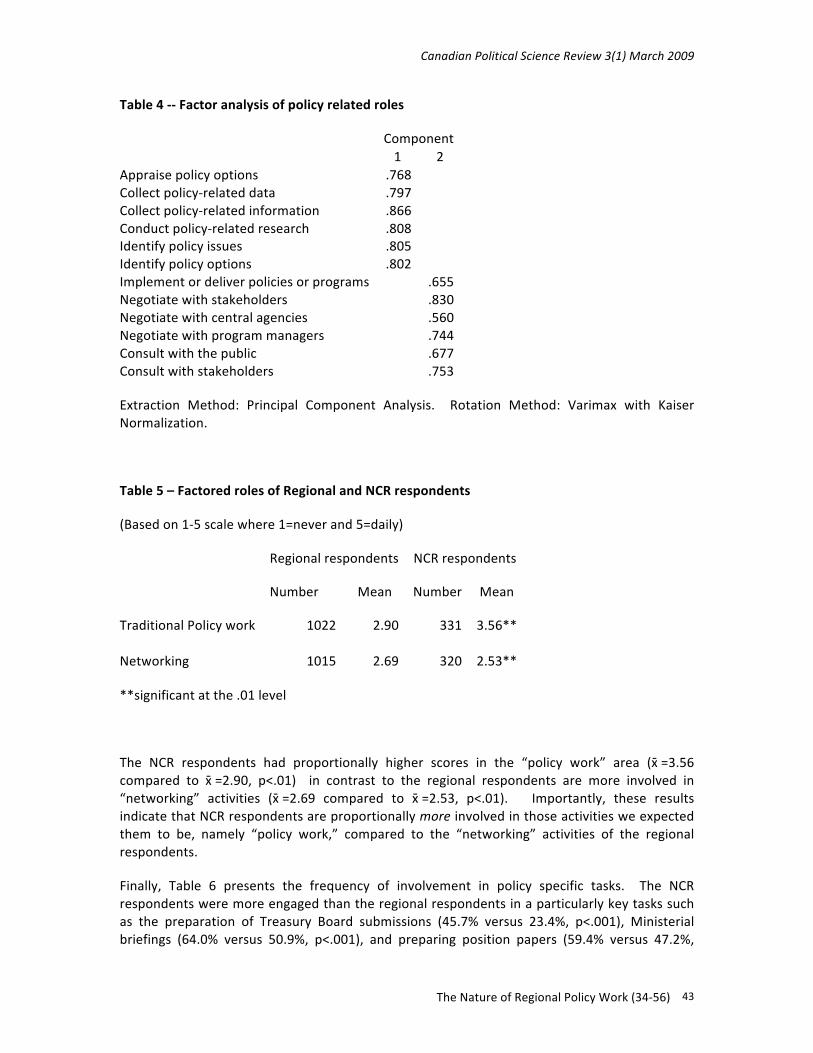
Afactoranalysisofthe12 items inTable3wasconductedand itproducedtwodistinctbroaditems(Table4):“policywork”and“networking” (Table5). Asthelabel implies,“policywork”includedthesixactivitiesassociatedwithpolicyanalysis(e.g.,collectingpolicyrelateddataandinformation, identifying policy issues and options) whereas “networking” involved thoseactivitiesrequiringinteractionwithclients(e.g.,consultingwiththepublicandstakeholders).
CanadianPoliticalScienceReview3(1)March2009
TheNatureofRegionalPolicyWork(34‐56) 43
Table4‐‐Factoranalysisofpolicyrelatedroles
Component1 2
Appraisepolicyoptions .768 Collectpolicy‐relateddata .797 Collectpolicy‐relatedinformation .866 Conductpolicy‐relatedresearch .808 Identifypolicyissues .805 Identifypolicyoptions .802 Implementordeliverpoliciesorprograms .655Negotiatewithstakeholders .830Negotiatewithcentralagencies .560Negotiatewithprogrammanagers .744Consultwiththepublic .677Consultwithstakeholders .753
Extraction Method: Principal Component Analysis. Rotation Method: Varimax with KaiserNormalization.
Table5–FactoredrolesofRegionalandNCRrespondents
(Basedon1‐5scalewhere1=neverand5=daily)
Regionalrespondents NCRrespondents
Number Mean Number Mean
TraditionalPolicywork 1022 2.90 331 3.56**
Networking 1015 2.69 320 2.53**
**significantatthe.01level
The NCR respondents had proportionally higher scores in the “policy work” area (x̄=3.56compared to x̄=2.90, p<.01) in contrast to the regional respondents are more involved in“networking” activities (x̄=2.69 compared to x̄=2.53, p<.01). Importantly, these resultsindicatethatNCRrespondentsareproportionallymoreinvolvedinthoseactivitiesweexpectedthem to be, namely “policy work,” compared to the “networking” activities of the regionalrespondents.
Finally, Table 6 presents the frequency of involvement in policy specific tasks. The NCRrespondentsweremoreengagedthantheregionalrespondentsinaparticularlykeytaskssuchas the preparation of Treasury Board submissions (45.7% versus 23.4%, p<.001), Ministerialbriefings (64.0% versus 50.9%, p<.001), and preparing position papers (59.4% versus 47.2%,
CanadianPoliticalScienceReview3(1)March2009
TheNatureofRegionalPolicyWork(34‐56) 44
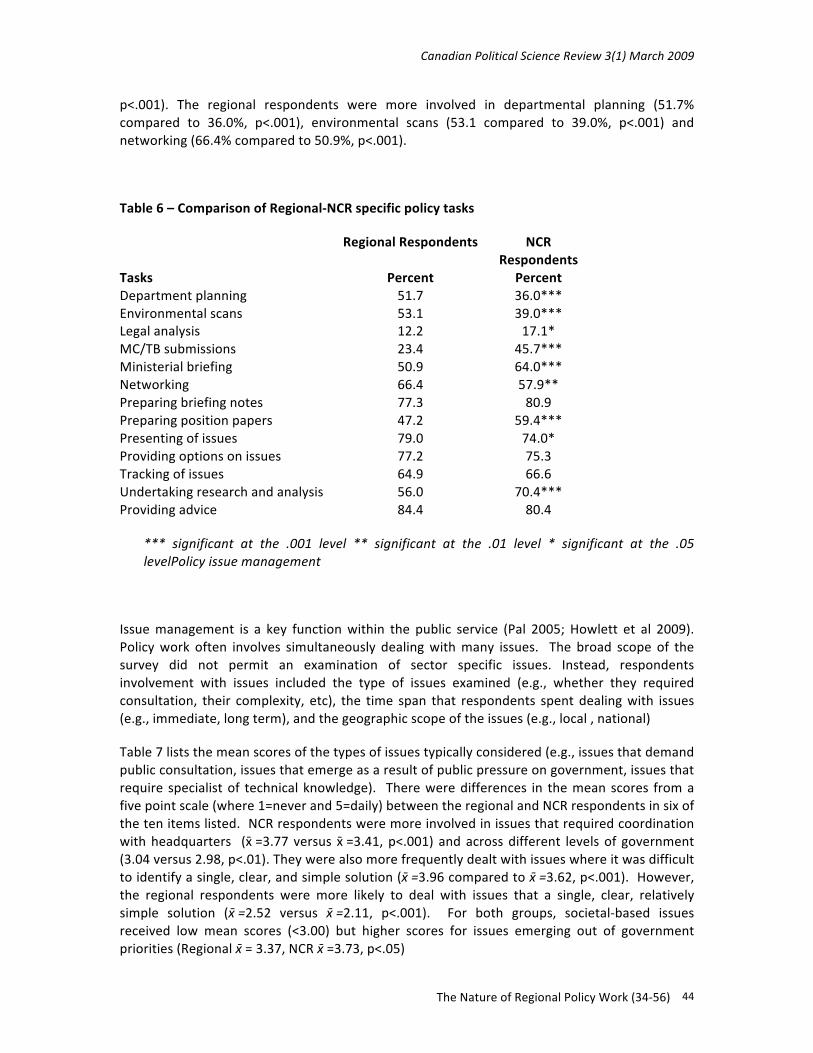
p<.001). The regional respondents were more involved in departmental planning (51.7%compared to 36.0%, p<.001), environmental scans (53.1 compared to 39.0%, p<.001) andnetworking(66.4%comparedto50.9%,p<.001).
Table6–ComparisonofRegional‐NCRspecificpolicytasks
RegionalRespondents NCRRespondents
Tasks Percent PercentDepartmentplanning 51.7 36.0***Environmentalscans 53.1 39.0***Legalanalysis 12.2 17.1*MC/TBsubmissions 23.4 45.7***Ministerialbriefing 50.9 64.0***Networking 66.4 57.9**Preparingbriefingnotes 77.3 80.9Preparingpositionpapers 47.2 59.4***Presentingofissues 79.0 74.0*Providingoptionsonissues 77.2 75.3Trackingofissues 64.9 66.6Undertakingresearchandanalysis 56.0 70.4***Providingadvice 84.4 80.4
*** significant at the .001 level ** significant at the .01 level * significant at the .05levelPolicyissuemanagement
Issuemanagement is a key functionwithin the public service (Pal 2005; Howlett et al 2009).Policywork often involves simultaneously dealingwithmany issues. The broad scope of thesurvey did not permit an examination of sector specific issues. Instead, respondentsinvolvement with issues included the type of issues examined (e.g., whether they requiredconsultation, their complexity, etc), the time span that respondents spent dealingwith issues(e.g.,immediate,longterm),andthegeographicscopeoftheissues(e.g.,local,national)
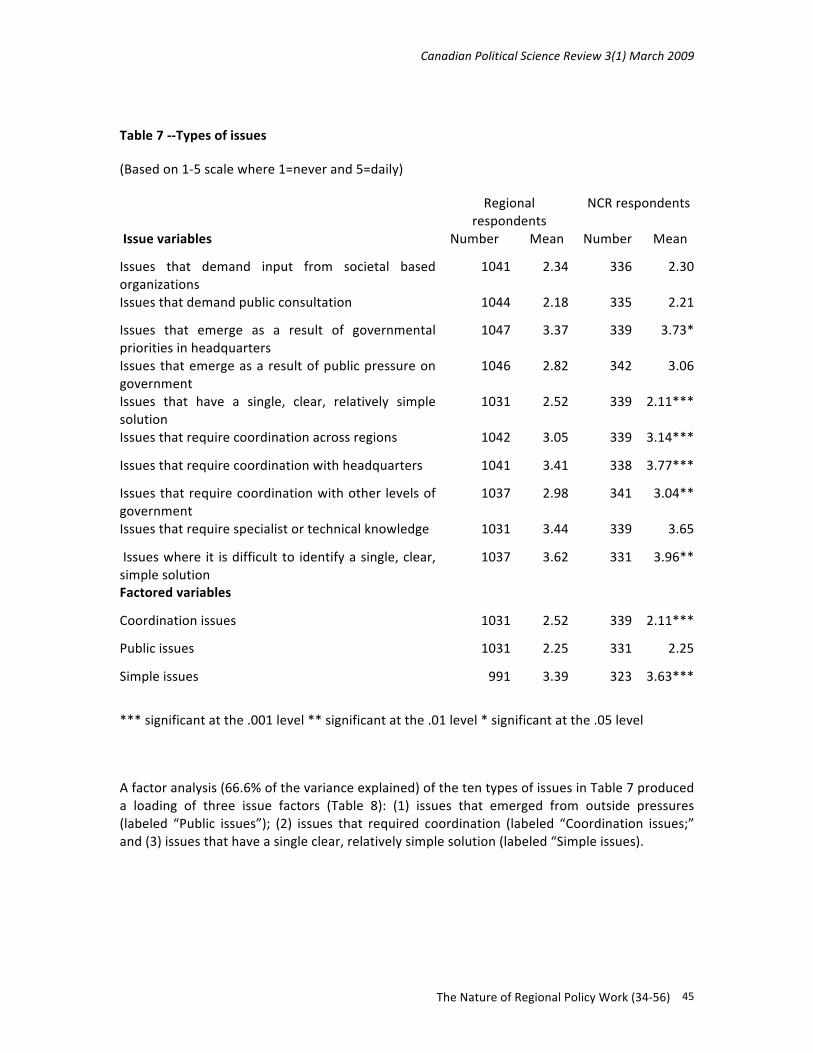
Table7liststhemeanscoresofthetypesofissuestypicallyconsidered(e.g.,issuesthatdemandpublicconsultation,issuesthatemergeasaresultofpublicpressureongovernment,issuesthatrequire specialistof technical knowledge). Thereweredifferences in themeanscores fromafivepointscale(where1=neverand5=daily)betweentheregionalandNCRrespondentsinsixofthetenitemslisted.NCRrespondentsweremoreinvolvedinissuesthatrequiredcoordinationwithheadquarters (x̄=3.77 versus x̄=3.41,p<.001) andacrossdifferent levelsof government(3.04versus2.98,p<.01).Theywerealsomorefrequentlydealtwithissueswhereitwasdifficulttoidentifyasingle,clear,andsimplesolution(x̄=3.96comparedtox̄=3.62,p<.001).However,the regional respondents were more likely to deal with issues that a single, clear, relativelysimple solution (x̄=2.52 versus x̄=2.11, p<.001). For both groups, societal‐based issuesreceived low mean scores (<3.00) but higher scores for issues emerging out of governmentpriorities(Regionalx̄=3.37,NCRx̄=3.73,p<.05)
CanadianPoliticalScienceReview3(1)March2009
TheNatureofRegionalPolicyWork(34‐56) 45
Table7‐‐Typesofissues
(Basedon1‐5scalewhere1=neverand5=daily)
Regionalrespondents
NCRrespondents
Issuevariables Number Mean Number Mean
Issues that demand input from societal basedorganizations
1041 2.34 336 2.30
Issuesthatdemandpublicconsultation 1044 2.18 335 2.21
Issues that emerge as a result of governmentalprioritiesinheadquarters
1047 3.37 339 3.73*
Issuesthatemergeasaresultofpublicpressureongovernment
1046 2.82 342 3.06
Issues that have a single, clear, relatively simplesolution
1031 2.52 339 2.11***
Issuesthatrequirecoordinationacrossregions 1042 3.05 339 3.14***
Issuesthatrequirecoordinationwithheadquarters 1041 3.41 338 3.77***
Issuesthatrequirecoordinationwithother levelsofgovernment
1037 2.98 341 3.04**
Issuesthatrequirespecialistortechnicalknowledge 1031 3.44 339 3.65
Issueswhere it isdifficultto identifyasingle,clear,simplesolution
1037 3.62 331 3.96**
Factoredvariables
Coordinationissues 1031 2.52 339 2.11***
Publicissues 1031 2.25 331 2.25
Simpleissues 991 3.39 323 3.63***
***significantatthe.001level**significantatthe.01level*significantatthe.05level
Afactoranalysis(66.6%ofthevarianceexplained)ofthetentypesofissuesinTable7produceda loading of three issue factors (Table 8): (1) issues that emerged from outside pressures(labeled “Public issues”); (2) issues that required coordination (labeled “Coordination issues;”and(3)issuesthathaveasingleclear,relativelysimplesolution(labeled“Simpleissues).

CanadianPoliticalScienceReview3(1)March2009
TheNatureofRegionalPolicyWork(34‐56) 46
Table8‐‐Structureofissuetypes
Component1 2 3
Issuesthatdemandinputfromsocietalbasedorganizations .837
Issuesthatdemandpublicconsultation .813
Issuesthatemergeasaresultofpublicpressureongovernment .637
Issuesthathaveasingle,clear,relativelysimplesolution .988
Issuesthatrequirecoordinationacrossregions .711
Issuesthatrequirecoordinationwithheadquarters .775
Issuesthatrequirespecialistortechnicalknowledge .741
Issueswhereitisdifficulttoidentifyasingle,clear,simplesolution .741
Extraction Method: Principal Component Analysis. Rotation Method: Varimax with KaiserNormalization.
ThesethreeitemsweresummedandarepresentedinTable8.Theregionalrespondentsspentmore time on simple issues (x̄= 3.63 compared to x̄= 3.39, p<.001) whereas their NCRcounterparts considered themselves to bemore involved in coordinating complex issues thatrequireconsiderablecoordination(x̄=2.52versusx̄=2.11,p<.001).
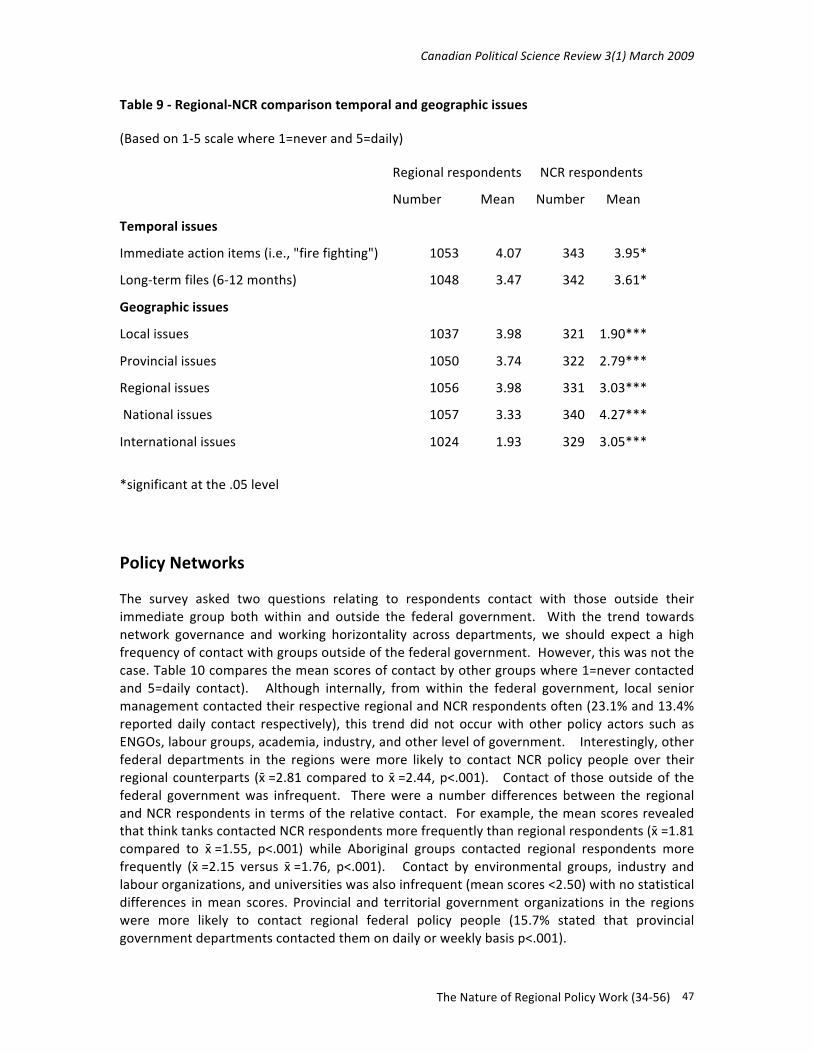
Therewerefewbetweengroupdifferencesindealingwithissuesthatvariedaccordingtotheirtimehorizons(Table9).Regionalrespondentstendedtospendmoretimeonimmediateissuesand long term files. However both groups spend considerable time dealing with immediateactionitemsandongoingfiles.
In contrast, the time spentdealingwith issuesona geographicbasis varied stronglybetweengroups(Table9).Regionalrespondentsspendconsiderablymoretimedealingwithlocal(48.1%compared to6.2%,p<.001), provincial (34.2%compared to9.3%,p<.001), and regional issues(38.7% compared to 10.6%, p<.001) whereas NCR respondents spend far more time withnational(54.1%versus16.7%,p<.001)andinternationalissues(17.6%versus3.3%,p<.001).
CanadianPoliticalScienceReview3(1)March2009
TheNatureofRegionalPolicyWork(34‐56) 47
Table9‐Regional‐NCRcomparisontemporalandgeographicissues
(Basedon1‐5scalewhere1=neverand5=daily)
Regionalrespondents NCRrespondents
Number Mean Number Mean
Temporalissues
Immediateactionitems(i.e.,"firefighting") 1053 4.07 343 3.95*
Long‐termfiles(6‐12months) 1048 3.47 342 3.61*
Geographicissues
Localissues 1037 3.98 321 1.90***
Provincialissues 1050 3.74 322 2.79***
Regionalissues 1056 3.98 331 3.03***
Nationalissues 1057 3.33 340 4.27***
Internationalissues 1024 1.93 329 3.05***
*significantatthe.05level
PolicyNetworks
The survey asked two questions relating to respondents contact with those outside theirimmediate group both within and outside the federal government. With the trend towardsnetwork governance and working horizontality across departments, we should expect a highfrequencyofcontactwithgroupsoutsideofthefederalgovernment.However,thiswasnotthecase.Table10comparesthemeanscoresofcontactbyothergroupswhere1=nevercontactedand 5=daily contact). Although internally, fromwithin the federal government, local seniormanagementcontactedtheirrespectiveregionalandNCRrespondentsoften(23.1%and13.4%reported daily contact respectively), this trend did not occurwith other policy actors such asENGOs,labourgroups,academia,industry,andotherlevelofgovernment.Interestingly,otherfederal departments in the regionsweremore likely to contact NCR policy people over theirregionalcounterparts (x̄=2.81comparedto x̄=2.44,p<.001). Contactof thoseoutsideof thefederal governmentwas infrequent. Therewere a number differences between the regionalandNCRrespondentsintermsoftherelativecontact. Forexample,themeanscoresrevealedthatthinktankscontactedNCRrespondentsmorefrequentlythanregionalrespondents(x̄=1.81compared to x̄=1.55, p<.001) while Aboriginal groups contacted regional respondents morefrequently (x̄=2.15 versus x̄=1.76, p<.001). Contact by environmental groups, industry andlabourorganizations,anduniversitieswasalsoinfrequent(meanscores<2.50)withnostatisticaldifferences inmean scores. Provincial and territorial government organizations in the regionswere more likely to contact regional federal policy people (15.7% stated that provincialgovernmentdepartmentscontactedthemondailyorweeklybasisp<.001).

CanadianPoliticalScienceReview3(1)March2009
TheNatureofRegionalPolicyWork(34‐56) 48
Table10–Frequencyofcontactbyothergroups
(Basedon1‐5scalewhere1=nocontactand5=dailycontact)
RegionalRespondents NCRRespondents
Number Mean Number Mean
Seniorheadquarterbasedmanagement 1016 2.58*** 338 3.67
Otherheadquarterstaff 1016 2.81*** 338 3.72Seniorregionalmanagement 1009 3.32*** 337 2.47Centralagencies 1003 1.74*** 336 2.50Provincialgovernmentdepartments 1010 2.35*** 335 2.04Municipalgovernmentdepartments 1005 1.63*** 330 1.40Federaldepartmentsintheregions 1001 2.44*** 331 2.81Environmental/Conservationbasedgroups 1006 1.52 333 1.57Industryorganizations 1002 1.99 334 2.11Labourorganizations 1003 1.46 327 1.47Thinktanks 998 1.55*** 331 1.81Universities 999 1.73 336 1.80Aboriginalgroups 1003 2.15*** 320 1.76
***significantatthe.001level
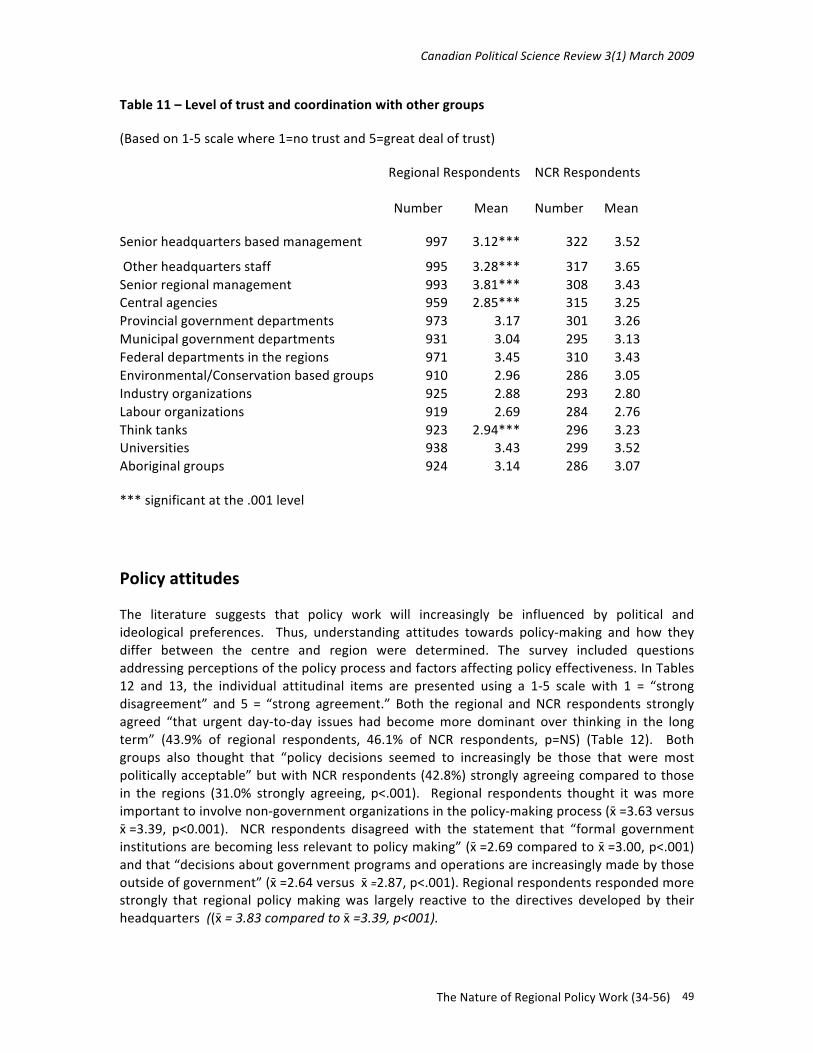
Table10examinesthelevelsoftrustbytherespondentswiththesamelistofgroupsfoundinTable9. Thehighermean scores for thosewithin the federal government suggests a greaterleveloftrustthanforthosegroupsoutsideofthefederalgovernment.Respondentshadagreatdealoftrustintheirlocalseniormanagement(66.4%ofregionalrespondentsand55.6%ofNCRrespondents). NCR respondents placed a greater deal of trust in other headquarter staff (x̄=3.65versusx̄=3.28,p<.001),centralagencies(x̄=3.25versusx̄=2.85,p<.001),andthinktanks(x̄=3.23 versus 2.94, p<.001). There was no difference in the level of trust towards federalgovernment departments in the regions by the regional and NCR respondents (x̄=3.45compared to x̄=3.43, p=NS). In the case of the other organizations outside of the federalgovernment (other levels of government, environmental groups, industry and labour groups,universities, andAboriginal groups) therewas no difference in themean scores between theregional and NCR respondents. The reported results in both Table 10 and Table 11 clearlyillustratethatrespondentswithclosetiestoseniormanagementareverymuchengagedintheinternalfunctioningofthefederalgovernment.Incontrast,theirinteractionwithinlargerpolicycommunitiesislimited.
CanadianPoliticalScienceReview3(1)March2009
TheNatureofRegionalPolicyWork(34‐56) 49
Table11–Leveloftrustandcoordinationwithothergroups
(Basedon1‐5scalewhere1=notrustand5=greatdealoftrust)
RegionalRespondents NCRRespondents
Number Mean Number Mean
Seniorheadquartersbasedmanagement 997 3.12*** 322 3.52
Otherheadquartersstaff 995 3.28*** 317 3.65Seniorregionalmanagement 993 3.81*** 308 3.43Centralagencies 959 2.85*** 315 3.25Provincialgovernmentdepartments 973 3.17 301 3.26Municipalgovernmentdepartments 931 3.04 295 3.13Federaldepartmentsintheregions 971 3.45 310 3.43Environmental/Conservationbasedgroups 910 2.96 286 3.05Industryorganizations 925 2.88 293 2.80Labourorganizations 919 2.69 284 2.76Thinktanks 923 2.94*** 296 3.23Universities 938 3.43 299 3.52Aboriginalgroups 924 3.14 286 3.07
***significantatthe.001level
Policyattitudes
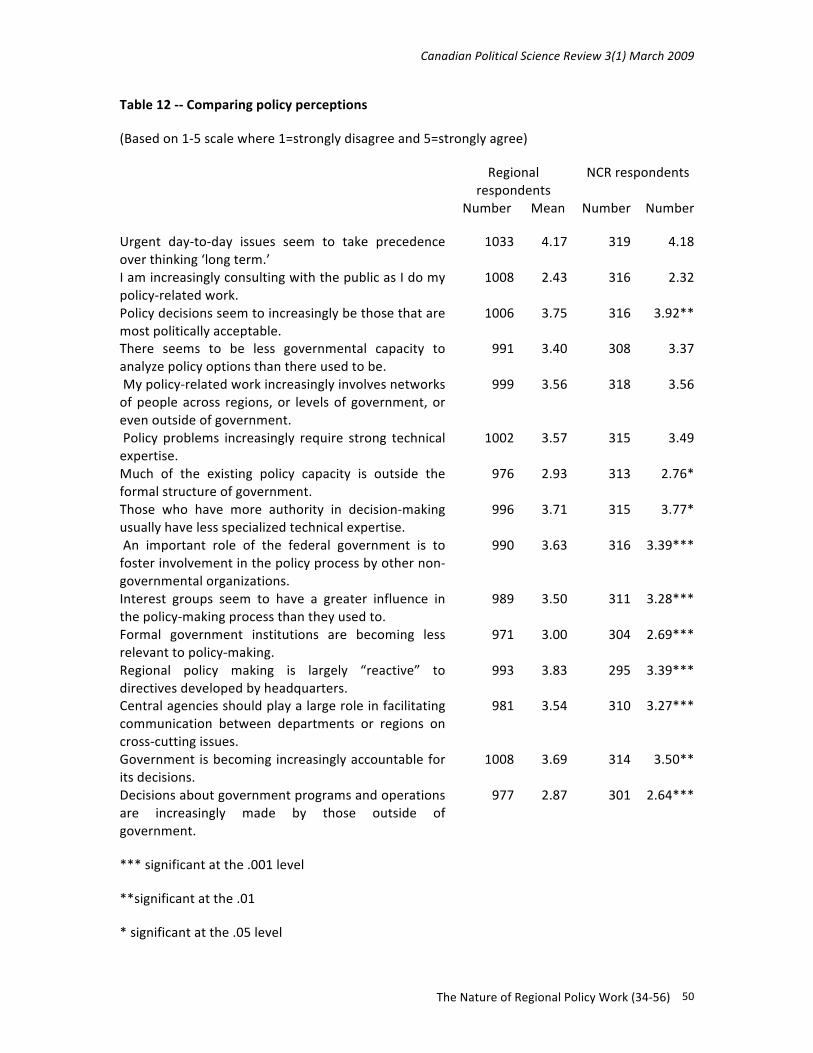
The literature suggests that policy work will increasingly be influenced by political andideological preferences. Thus, understanding attitudes towards policy‐making and how theydiffer between the centre and region were determined. The survey included questionsaddressingperceptionsofthepolicyprocessandfactorsaffectingpolicyeffectiveness.InTables12 and 13, the individual attitudinal items are presented using a 1‐5 scale with 1 = “strongdisagreement” and 5 = “strong agreement.” Both the regional andNCR respondents stronglyagreed “that urgent day‐to‐day issues had becomemore dominant over thinking in the longterm” (43.9% of regional respondents, 46.1% of NCR respondents, p=NS) (Table 12). Bothgroups also thought that “policy decisions seemed to increasingly be those that were mostpoliticallyacceptable”butwithNCRrespondents(42.8%)stronglyagreeingcomparedtothosein the regions (31.0% strongly agreeing, p<.001). Regional respondents thought it wasmoreimportanttoinvolvenon‐governmentorganizationsinthepolicy‐makingprocess(x̄=3.63versusx̄=3.39, p<0.001). NCR respondents disagreed with the statement that “formal governmentinstitutionsarebecominglessrelevanttopolicymaking”(x̄=2.69comparedtox̄=3.00,p<.001)andthat“decisionsaboutgovernmentprogramsandoperationsareincreasinglymadebythoseoutsideofgovernment”(x̄=2.64versusx̄=2.87,p<.001).Regionalrespondentsrespondedmorestrongly that regional policymakingwas largely reactive to the directives developed by theirheadquarters((x̄=3.83comparedtox̄=3.39,p<001).
CanadianPoliticalScienceReview3(1)March2009
TheNatureofRegionalPolicyWork(34‐56) 50
Table12‐‐Comparingpolicyperceptions
(Basedon1‐5scalewhere1=stronglydisagreeand5=stronglyagree)
Regionalrespondents
NCRrespondents
Number Mean Number Number
Urgent day‐to‐day issues seem to take precedenceoverthinking‘longterm.’
1033 4.17 319 4.18
IamincreasinglyconsultingwiththepublicasIdomypolicy‐relatedwork.
1008 2.43 316 2.32
Policydecisionsseemtoincreasinglybethosethataremostpoliticallyacceptable.
1006 3.75 316 3.92**
There seems to be less governmental capacity toanalyzepolicyoptionsthanthereusedtobe.
991 3.40 308 3.37
Mypolicy‐relatedworkincreasinglyinvolvesnetworksofpeopleacross regions,or levelsof government,orevenoutsideofgovernment.
999 3.56 318 3.56
Policy problems increasingly require strong technicalexpertise.
1002 3.57 315 3.49
Much of the existing policy capacity is outside theformalstructureofgovernment.
976 2.93 313 2.76*
Those who have more authority in decision‐makingusuallyhavelessspecializedtechnicalexpertise.
996 3.71 315 3.77*
An important role of the federal government is tofosterinvolvementinthepolicyprocessbyothernon‐governmentalorganizations.
990 3.63 316 3.39***
Interest groups seem to have a greater influence inthepolicy‐makingprocessthantheyusedto.
989 3.50 311 3.28***
Formal government institutions are becoming lessrelevanttopolicy‐making.
971 3.00 304 2.69***
Regional policy making is largely “reactive” todirectivesdevelopedbyheadquarters.
993 3.83 295 3.39***
Centralagenciesshouldplayalargeroleinfacilitatingcommunication between departments or regions oncross‐cuttingissues.
981 3.54 310 3.27***
Government isbecoming increasinglyaccountableforitsdecisions.
1008 3.69 314 3.50**
Decisionsaboutgovernmentprogramsandoperationsare increasingly made by those outside ofgovernment.
977 2.87 301 2.64***
***significantatthe.001level
**significantatthe.01
*significantatthe.05level
CanadianPoliticalScienceReview3(1)March2009
TheNatureofRegionalPolicyWork(34‐56) 51
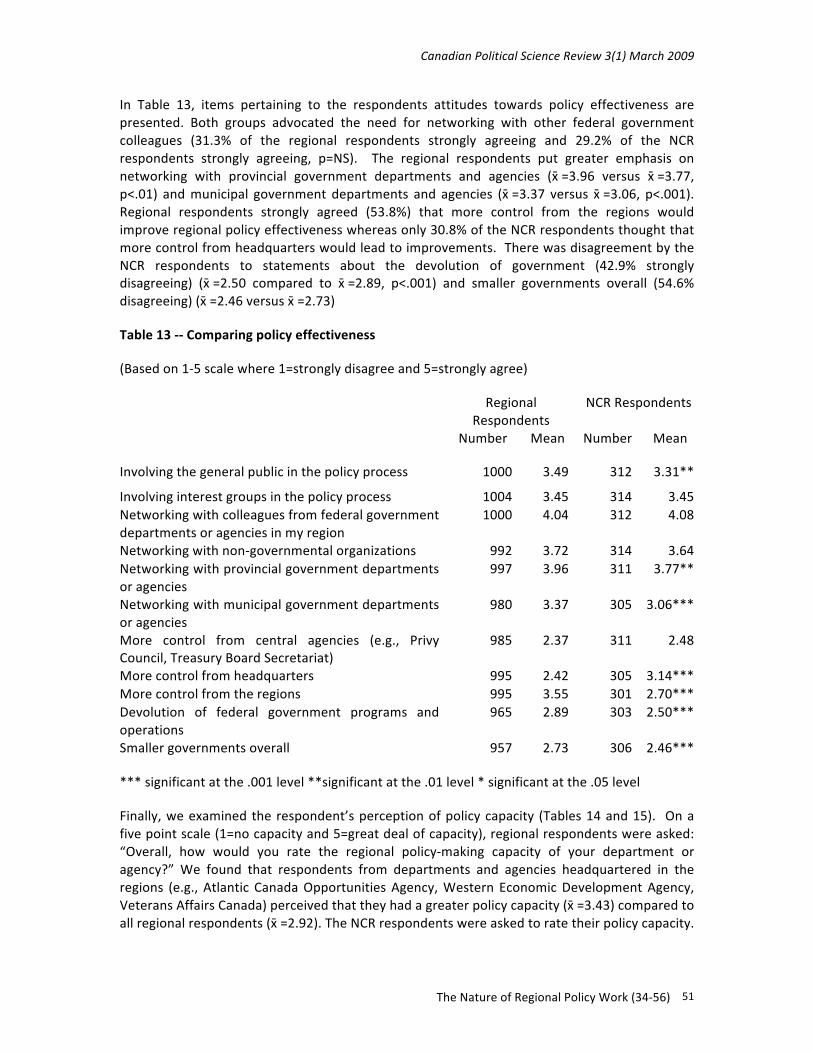
In Table 13, items pertaining to the respondents attitudes towards policy effectiveness arepresented. Both groups advocated the need for networking with other federal governmentcolleagues (31.3% of the regional respondents strongly agreeing and 29.2% of the NCRrespondents strongly agreeing, p=NS). The regional respondents put greater emphasis onnetworking with provincial government departments and agencies (x̄=3.96 versus x̄=3.77,p<.01) andmunicipal government departments and agencies (x̄=3.37 versus x̄=3.06, p<.001).Regional respondents strongly agreed (53.8%) that more control from the regions wouldimproveregionalpolicyeffectivenesswhereasonly30.8%oftheNCRrespondentsthoughtthatmorecontrolfromheadquarterswouldleadtoimprovements.TherewasdisagreementbytheNCR respondents to statements about the devolution of government (42.9% stronglydisagreeing) (x̄=2.50 compared to x̄=2.89, p<.001) and smaller governments overall (54.6%disagreeing)(x̄=2.46versusx̄=2.73)
Table13‐‐Comparingpolicyeffectiveness
(Basedon1‐5scalewhere1=stronglydisagreeand5=stronglyagree)
RegionalRespondents
NCRRespondents
Number Mean Number Mean
Involvingthegeneralpublicinthepolicyprocess 1000 3.49 312 3.31**
Involvinginterestgroupsinthepolicyprocess 1004 3.45 314 3.45Networkingwithcolleaguesfromfederalgovernmentdepartmentsoragenciesinmyregion
1000 4.04 312 4.08
Networkingwithnon‐governmentalorganizations 992 3.72 314 3.64Networkingwithprovincialgovernmentdepartmentsoragencies
997 3.96 311 3.77**
Networkingwithmunicipalgovernmentdepartmentsoragencies
980 3.37 305 3.06***
More control from central agencies (e.g., PrivyCouncil,TreasuryBoardSecretariat)
985 2.37 311 2.48
Morecontrolfromheadquarters 995 2.42 305 3.14***Morecontrolfromtheregions 995 3.55 301 2.70***Devolution of federal government programs andoperations
965 2.89 303 2.50***
Smallergovernmentsoverall 957 2.73 306 2.46***
***significantatthe.001level**significantatthe.01level*significantatthe.05level
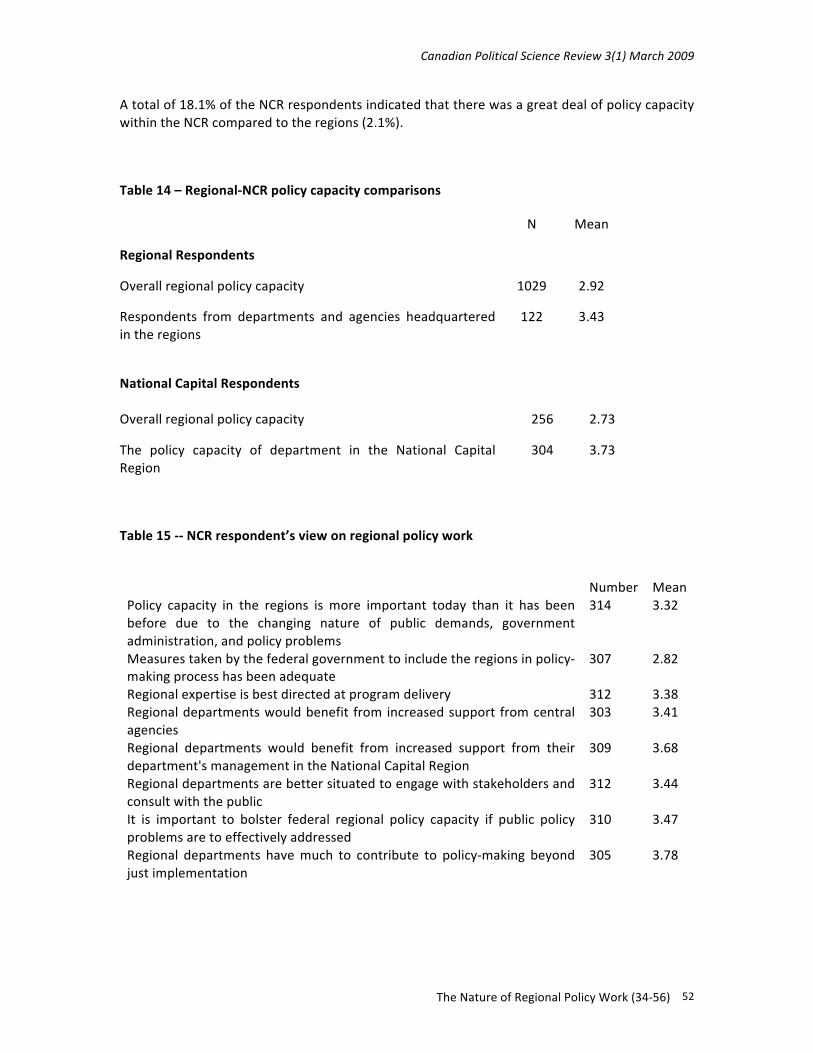
Finally,weexaminedtherespondent’sperceptionofpolicycapacity (Tables14and15). Onafivepointscale(1=nocapacityand5=greatdealofcapacity),regionalrespondentswereasked:“Overall, how would you rate the regional policy‐making capacity of your department oragency?” We found that respondents from departments and agencies headquartered in theregions (e.g., Atlantic CanadaOpportunitiesAgency,Western EconomicDevelopmentAgency,VeteransAffairsCanada)perceivedthattheyhadagreaterpolicycapacity(x̄=3.43)comparedtoallregionalrespondents(x̄=2.92).TheNCRrespondentswereaskedtoratetheirpolicycapacity.
CanadianPoliticalScienceReview3(1)March2009
TheNatureofRegionalPolicyWork(34‐56) 52
Atotalof18.1%oftheNCRrespondentsindicatedthattherewasagreatdealofpolicycapacitywithintheNCRcomparedtotheregions(2.1%).
Table14–Regional‐NCRpolicycapacitycomparisons
N Mean
RegionalRespondents
Overallregionalpolicycapacity 1029 2.92
Respondents from departments and agencies headquarteredintheregions
122 3.43
NationalCapitalRespondents
Overallregionalpolicycapacity 256 2.73
The policy capacity of department in the National CapitalRegion
304 3.73
Table15‐‐NCRrespondent’sviewonregionalpolicywork
Number MeanPolicy capacity in the regions is more important today than it has beenbefore due to the changing nature of public demands, governmentadministration,andpolicyproblems
314 3.32
Measurestakenbythefederalgovernmenttoincludetheregionsinpolicy‐makingprocesshasbeenadequate
307 2.82
Regionalexpertiseisbestdirectedatprogramdelivery 312 3.38Regionaldepartmentswouldbenefit fromincreasedsupport fromcentralagencies
303 3.41
Regional departments would benefit from increased support from theirdepartment'smanagementintheNationalCapitalRegion
309 3.68
Regionaldepartmentsarebettersituatedtoengagewithstakeholdersandconsultwiththepublic
312 3.44
It is important to bolster federal regional policy capacity if public policyproblemsaretoeffectivelyaddressed
310 3.47
Regional departments havemuch to contribute to policy‐making beyondjustimplementation
305 3.78
CanadianPoliticalScienceReview3(1)March2009
TheNatureofRegionalPolicyWork(34‐56) 53
SummaryandConclusion
There is a long standing concern about policy capacity in Canada’s federal government.However, there have been no empirical studies examining the rank‐and‐file civil servantsresponsible forcarryingoutmostof itspolicywork. Andvery littleattention isplacedonthepolicywork performed by regionally based employees. Our study of policy oriented federalgovernment employees in the regions and the National Capital Region (NCR) goes to somelengthaddressingthesegaps.
Our general finding is that regional and NCR based policy employees differed on manysignificantfronts.Thespecificfindingspresentsuchstarkdifferencesthatweconcludethattheconceptofregionalpolicyworkmaybeinfactamisnomer.Intermsoftheirbackground,theNCR respondents were more likely to have policy specific training from a school of publicadministration or they hold a social science degree. Such formal skills are beneficial whenundertakingcomplexpolicywork.However,oneofthefewpositiveaspectsofbeingfromtheregionsmay be the respondent’s older age and, consequently, their longer tenurewith theirrespectiveorganization. This longer institutionalmemory isan important considerationwhenconsidering the collective learning in organizations aimed at meeting organizational goals.However, the challenge is maintaining this rich contextual knowledge within publicorganizationsandincorporatingitintosubstantivepolicywork.
TheNCRrespondentsidentifythemselvesassingularlyoccupyingapolicyrolewhereasthoseintheregionsaresimultaneouslyengagedinapotpourriofrolesthuspossiblyblurringpolicyworkwithcoordination,evaluation,strategicwork,andplanning.ThepolicyworkundertakenintheNCR encompasses all aspects of the policy process especially key roles such as problemidentification, developing and appraising policy options, and undertaking policy research. Incontrast, regional policy staff saw themselves as undertaking themost rudimentary and leastanalytical type of work, namely the collection of information, dealing with simple issues, orengagedinpolicyimplementation.
ThelowlevelofNCRcontactwiththepublicandstakeholderscorrespondstoCôtéetal’s(2007)findingsthatthefederalcivilserviceasawholeisbecomingmoredisengagedfromorbypassedbythepublic. Surprisingly,regionalpolicybasedpeoplewerenearlyasequallyremovedfromkeypolicyactors. Although their involvement inpolicy related roleswas limited, the regionalrespondents’ geographic focus was highly provincial, or local. Thus, we expected that theywouldbeday‐to‐dayparticipantsinregional‐basedpolicynetworkswherebytheycouldprovidevaluable on‐the‐ground insights and information on provincial or local policy developments.Instead, regional policy work is built largely on an internalized network consisting largely ofregionalseniormanagement.Moreover,regionalworkwasspentdealingwithmoreimmediate(“firefighting”)reactiveheadquarterbasedissuescomparedtothe long‐termperspectivethatweexpected.Theregionalrespondent’srelativelylimitedanalyticalfunctionsandlowlevelofexternalnetworkingclassifiesthemwithinMeltsner’s(1976)“pretender”category.EvenwhenMayer et al’s (2004) highly varied conceptual policy typology framework is considered,determining where federal regional policy work fits is difficult to ascertain. For example,regional respondents spend very little time designing and recommending policy, providingstrategicadvice,mediating,orresearchandanalyzing.
CanadianPoliticalScienceReview3(1)March2009
TheNatureofRegionalPolicyWork(34‐56) 54
The long term trend of centralization within Canada’s federal government has been wellchronicled (Savoie 2003). Thus, the centralization of policy advice in Canada’s NCR is notsurprising. Do thee results found in this comparative studyofNCRand regional policy‐basedemployees pose any consequences for the quality of policy advice? Should there be areconsiderationofthemixtureofskillsandexpertiseinregions?BaseduponCanada’schangingpolicymakingenvironment,wearguethat,bothintermsoftotalnumbersandtheirattributes,thatweaknessofregionalpolicycapacitymaymakefederalgovernmentpolicymorevulnerabletoweaker policy responses. In a country as large, diverse, and decentralized as Canada, thefederal government’s policy capacity may be enhanced if more policy work such advice,research,andprogramdesignisbasedinfederalgovernmentregionaloffices. Suchastrategywouldrequirethatmoreresourcesandpolicystaffbedeployed intheregion. Also,wearguethatregionalpolicyworkcanplayacriticalroleinthegrowingandoftenchaoticpolicy‐makingenvironment.Juillet(2000)arguedthatFederalRegionalCouncils(composedofthemostseniorofficialsofallfederaldepartmentsandagenciespresentwithinprovinceorterritory)mighthavethe potential to promote the horizontal coordination of complex issues. Perhaps FederalRegional Councils can play an important intermediately institutional role determining thenecessarysetofpolicytoolsandtechniquesintheregionswhileensuringcompliancewiththeneedsofthecentre.
TheresearchpresentedinthispaperhighlightedthedistinctdifferencesbetweenpolicyworkintheregionsandintheNCR.Ifregionalpolicyworkisindeedanimportantpublicmanagementissue, future research should be considered on two fronts. First, there needs to be a betterunderstanding ofwhat drives federal regional policywork. The above research identified thecritical variables. Further statistical analysis such as ordinary least squares (OLS) linearregression or multivariate regression models may provide a better indication of the relativestrengthofthevariablesidentifiedaboveinordertodeterminetheirinfluenceonbothregionalpolicyworkand regionalpolicy capacity. The secondarea is the roleof federal advice (bothregional and NCR) compared to the growing policy capacity at the provincial and territoriallevels.Policyanalysisatthesub‐nationallevelhasseldombeeninvestigated(McArthur2007).One of the few systematic studies is Howlett’s (2009a) national study of provincial policyanalysis. This study employs a similar survey to the one employed above. The similarity ofvariables found inboth surveyswillpermita timely comparisonof thenatureofnationalandsub‐nationalpolicywork.
Endnotes
1FundingforthisprojectcamefromtheTreasuryBoardSecretariatofCanadaandNaturalResourcesCanada.WethanktheAlbertaandSaskatchewanFederalCouncilsfortheirin‐kindsupportandenthusiasmforthisproject.ResearchassistancewasprovidedbySimaJoshi‐KoopandAndrewRobertshaw.Invaluableinputwithsurveytechniques,pilottesting,questionnairedesign,andtranslationwasprovidedbyDougBorrowman,DianaBoylen,PatriciaCoyle,MichaelHowlett,SandraLaFortune,GeorgeMcDonald,PatPerry,StevePrice,PeggySchmeiser,andDanielSt‐Arnaud.TheauthorswouldliketothankGordonMillerandthetwoanonymousrefereesfortheirconstructivecommentsandsuggestions.

CanadianPoliticalScienceReview3(1)March2009
TheNatureofRegionalPolicyWork(34‐56) 55
2FederalRegionalCouncilsareprovincialandterritorialforumsofseniorfederalgovernmentemployeesrepresentingtheirrespectivedepartmentoragency.3NS=nosignificance4TheCanadianfederalgovernmenthasanumberoflanguageclassifications.Therearetwounilinguallanguageclassifications(EnglishEssentialandFrenchEssential).Thebilingualclassificationsarebaseduponanindividual’scompetenciesinthreeareas:comprehension,verbal,andwritten.ThereisanAtoClevelforeachcompetency.Finally,thereareemployeeswhoarefullybilingualandareconsideredtobeexempt(EEE).InthecaseoftheNCRemployees,wefoundthat29.5%wereEnglishEssential,25.7%wereclassifiedasBBB,10.9%asCBC,and13.0%wereEEE.5Astatisticalprocedureforevaluatingtheinternalconsistencyofmultiple‐itemadditivescales
ReferencesAnderson,G.1996.“Thenewfocuson thepolicycapacityof the federalgovernment.”CanadianPublic
Administration39:4469‐488.Bakvis, H. 2000. “Rebuilding Policy Capacity in the Era of the Fiscal Dividend: A Report from Canada.”
Governance13(1)71‐103.Côté,A,Baird,K.andI.Green.2007.AVitalNationalInstitution:WhataCross‐SectionofCanadiansThink
abouttheProspectsforCanada'sPublicServiceinthe21stCentury.Ottawa:PublicPolicyForum.Cummings, S. and Nørgaard, O. 2004. “Conceptualizing State Capacity: Comparing Kazakhstan and
Kyrgyzstan.”PoliticalStudies52(4):685‐708.Durning,D.andOsuna.W.1994.“PolicyAnalysts'RolesandValueOrientations:AnEmpiricalInvestigation
UsingQMethodology.”JournalofPolicyAnalysisandManagement13(4):629‐657.Fellegi,I.1996.StrengtheningourPolicyCapacity.DeputyMinister’sTaskForce.Ottawa.Goetz,K.H.andWollmann,H.2001.“GovernmentalizingCentralExecutivesinPost‐CommunistEurope:A
Four‐countryComparison.”JournalofEuropeanPublicPolicy8(6):864–887.Hollander, M. and Prince, M. 1993. ”Analytical Units in Federal Governments: Origins, Functions and
SuggestionsforEffectiveness.”CanadianPublicAdministration36(2):190‐224.Honadle, B. 1981. “A Capacity Building Framework: A Search for Concept and Purpose.” Public
AdministrationReview41(5):575‐80.Hoppe,R.andM.Jeliazkova.2006.“HowPolicyWorkersDefineTheirJob:ANetherlandsCaseStudy.”In
TheWorkofPolicy:AnInternationalSurvey.K.Colebatch,ed..NewYork:RowanandLittlefield.Howlett,M.,Perl,A.,andM.Ramesh.2009.StudyingPublicPolicy:PolicyCyclesandPolicySubsystems.
Toronto:OxfordUniversityPress.Howlett,M.2009a. “PolicyAdvice inMulti‐levelGovernance Systems: Sub‐National PolicyAnalysts and
Analysis.”InternationalReviewofPublicAdministration.13:3:1‐16.Howlett,M.2009b.”PolicyAnalyticalCapacityandEvidence‐BasedPolicy‐Making:LessonsfromCanada.”
PaperacceptedforpublicationinCanadianPublicAdministration52(2).Howlett, M. and Lindquist, E. 2007. “Beyond Formal Policy Analysis: Governance Context, Analytical
Styles,andthePolicyAnalysisMovement inCanada.” InPolicyAnalysis inCanada:TheStateoftheArt.L.Dobuzinskis,M.Howlett,andD.Laycock,eds.Toronto:UniversityofTorontoPress,86‐115.
Juillet,L.2002.“FederalRegionalcouncilsandHorizontalGovernance.”Optimum32(2):2‐14.Klijn,E.2008.“ComplexityTheoryandPublicAdministration:What'sNew?

CanadianPoliticalScienceReview3(1)March2009
TheNatureofRegionalPolicyWork(34‐56) 56
Keyconcepts inComplexityTheoryComparedto theirCounterparts inPublicAdministrationResearch.”PublicManagementReview.10(3):299‐317.
Le Goff, P. 2006.Moving public servants to the regions. Library of Parliament. Ottawa: Parliamentaryinformationandresearchservice.
Lindquist, E. and J. Desveaux. 2007. “Policy analysis and bureaucratic capacity: Context, competencies,andstrategies.”InPolicyanalysisinCanada:TheStateoftheArt.L.Dobuzinskis,M.Howlett,andD.Laycock,eds.Toronto:UniversityofTorontoPress.116‐144.
Mayer, I, Bots, P. and E. van Daalen. 2004. “Perspectives on Policy Analysis: A Framework forUnderstandingandDesign.”InternationalJournalofTechnology,PolicyandManagement.4(1):169‐191.
Meltsner,A.J.1976.PolicyAnalystsintheBureaucracy.Berkeley,UniversityofCaliforniaPress.McArthur, D. 2007. “Policy Analysis in Provincial Governments in Canada: Prom PPBS to Network
Management.”InPolicyAnalysisinCanada:TheStateoftheArt.L.Dobuzinskis,M.Howlett,andD.Laycock,eds.Toronto:UniversityofTorontoPress.238‐264.
Painter,M. and Pierre, J. 2005. “Unpacking policy capacity: Issues and themes.” InChallenges to StatePolicyCapacity:GlobalTrendsandComparativePerspectives.M.PainterandJ.Pierre,eds,NewYork,NY:PalgraveMacmillan.1‐18.
Pal,L.2005.BeyondPolicyAnalysis:PublicIssueManagementinTurbulentTimes.3rded.Toronto:Nelson.Parsons,W.2004.“Not JustSteeringbutWeaving:RelevantKnowledgeandtheCraftofBuildingPolicy
CapacityandCoherence.”AustralianJournalofPublicAdministration63(1):43‐57.Peters,G.1995.“ThePublicService,theChangingState,andGovernance.”InGovernanceinaChanging
Environment.G.PetersandD.Savoie,eds.Ottawa:CanadianCentreforManagementDevelopmentSeriesonGovernanceandPublicManagement.288‐323.
Pitkin,H.1967.Theconceptofrepresentation.Berkley:UniversityofCaliforniaPress.Prince,M. 2007. “Soft Craft, Hard Choices, Altered Context: Reflections on Twenty‐Five Years of Policy
AdviceinCanada.”InPolicyAnalysisinCanada:TheStateoftheArt.L.Dobuzinskis,M.Howlett,andD.Laycock,eds.Toronto:UniversityofTorontoPress.219‐237.
Prince,M.1983.PolicyAdviceandOrganizationalSurvival.Aldershot:GowerPress.Prince,M. 1979. “Policy Advisory Groups in Government Departments.” In Public Policy in Canada. B.
DoernandP.Aucoin,eds..Toronto:Macmillian.275‐300.Prince,M.andChenier,J.1980.“TheRiseandFallofPolicyPlanningandResearchUnits.”CanadianPublic
Administration.23(4):519‐41.Rasmussen,K.1999. “PolicyCapacity inSaskatchewan:Strengthening theEquilibrium.”CanadianPublic
Administration42(3):331‐338.Savoie, D. 2003. Strengthening the Policy Capacity of Government. Report to the Panel on the Role of
Government,ResearchPaperSeries,Vol.1,239‐290.Shulock,N.1999.“TheParadoxofPolicyAnalysis:IfItIsNotUsed,WhyDoWeProduceSoMuchofIt?”
JournalofPolicyAnalysisandManagement18:2.226‐244.TreasuryBoardSecretariatofCanada.1996.RegionalParticipationinthePolicyProcess.Ottawa:Treasury
BoardSecretariatofCanada.Voyer,J.2007.“PolicyAnalysisintheFederalGovernment:BuildingtheForward‐lookingPolicyResearch
Capacity.” in Policy Analysis in Canada: The State of the Art. L. Dobuzinskis, M. Howlett, and D.Laycock,eds.Toronto:UniversityofTorontoPress,219‐237.
Weiss,L.1998.TheMythofthePowerlessState.Ithaca.NewYork:CornellUniversityPress.