the nearly neutral and selection theories of molecular evolution under the fisher geometrical...
DESCRIPTION
NearlyTRANSCRIPT

INVESTIGATION
The Nearly Neutral and Selection Theoriesof Molecular Evolution Under the Fisher
Geometrical Framework: Substitution Rate,Population Size, and ComplexityPablo Razeto-Barry,*,†,‡,1 Javier Díaz,* and Rodrigo A. Vásquez*,†
*Instituto de Filosofía y Ciencias de la Complejidad, Santiago, Chile 7780192, †Instituto de Ecología y Biodiversidad, Departamentode Ciencias Ecológicas, Facultad de Ciencias, Universidad de Chile, Santiago, Chile 7800024, and ‡Universidad Diego Portales,
Vicerrectoría Académica, Santiago, Chile 8370179
ABSTRACT The general theories of molecular evolution depend on relatively arbitrary assumptions about the relative distribution andrate of advantageous, deleterious, neutral, and nearly neutral mutations. The Fisher geometrical model (FGM) has been used to makedistributions of mutations biologically interpretable. We explored an FGM-based molecular model to represent molecular evolutionaryprocesses typically studied by nearly neutral and selection models, but in which distributions and relative rates of mutations withdifferent selection coefficients are a consequence of biologically interpretable parameters, such as the average size of the phenotypiceffect of mutations and the number of traits (complexity) of organisms. A variant of the FGM-based model that we called the staticregime (SR) represents evolution as a nearly neutral process in which substitution rates are determined by a dynamic substitutionprocess in which the population’s phenotype remains around a suboptimum equilibrium fitness produced by a balance betweenslightly deleterious and slightly advantageous compensatory substitutions. As in previous nearly neutral models, the SR predictsa negative relationship between molecular evolutionary rate and population size; however, SR does not have the unrealistic propertiesof previous nearly neutral models such as the narrow window of selection strengths in which they work. In addition, the SR suggeststhat compensatory mutations cannot explain the high rate of fixations driven by positive selection currently found in DNA sequences,contrary to what has been previously suggested. We also developed a generalization of SR in which the optimum phenotype canchange stochastically due to environmental or physiological shifts, which we called the variable regime (VR). VR models evolution as aninterplay between adaptive processes and nearly neutral steady-state processes. When strong environmental fluctuations are incor-porated, the process becomes a selection model in which evolutionary rate does not depend on population size, but is criticallydependent on the complexity of organisms and mutation size. For SR as well as VR we found that key parameters of molecularevolution are linked by biological factors, and we showed that they cannot be fixed independently by arbitrary criteria, as has usuallybeen assumed in previous molecular evolutionary models.
THE nearly neutral theory of molecular evolution (Ohtaand Kimura 1971; Ohta 1972, 1973, 1977, 1992, 1996),
as is generally understood, affirms that the vast majority ofamino acid substitutions are slightly deleterious; hence, ithas been called the slightly deleterious mutation theory(Figure 1C) (Ohta and Kimura 1971; Ohta 1972, 1973,1977, 1987, 1996; Kimura 1983; Gillespie 1995, 2004;
Kreitman 1996). In the original exponential “shift” modelof Ohta (1977) selection coefficients are chosen at randomfrom an exponential probability distribution, and the popu-lation mean fitness shifts back when a mutation is fixed (seealso Ohta and Gillespie 1996). This model was modified byKimura (1979), who proposed the gamma shift model, toovercome Ohta’s previous assumptions that imply a rate ofsubstitution that is too low when population size is in-creased above moderate values (see also Nielsen and Yang2003). Later, Ohta and Tachida (1990) and Tachida (1991)developed another kind of nearly neutral model to relaxsome criticized assumptions (see below), but those models
Copyright © 2012 by the Genetics Society of Americadoi: 10.1534/genetics.112.138628Manuscript received January 13, 2012; accepted for publication February 28, 20121Corresponding author: Instituto de Filosofia y Ciencias de la Complejidad, Los Alerces3024, Santiago, Chile, 7780192. E-mail: [email protected]
Genetics, Vol. 191, 523–534 June 2012 523

produced a very different prediction than that of slightlydeleterious mutation models. In fact, Gillespie (1994,1995) uncovered that in these later models, known as thehouse-of-cards or “fixed” models, only half of the substitu-tions are deleterious and the other half are advantageous(see also Tachida 1996, 2000). Thus, these kinds of nearlyneutral models may be subsumed in a different categorythat we will call the balanced mutation theory (Figure1D). Nevertheless, these later models were strongly criti-cized because the rate of substitution becomes 0 startingfrom a small effective population size (specifically, substitu-tion stops when 2Nss . 4, where ss is the standard devia-tion of the selection coefficients, and N is the effectivepopulation size); that is, except for a narrow window of2Nss these models predict even lower rates of substitutionthan those generated by the original exponential shift model(Gillespie 1994, 1995, 1999; Ohta and Gillespie 1996).Thus the nearly neutral theory continued to emphasize thesubstitution of slightly deleterious mutations (Ohta 1992,1996, 2007; Gillespie 1995, 2004; Eyre-Walker et al.2002; Sella and Hirsh 2005; Gu 2007a,b; Harris 2010).On the other hand, selection models (Figure 1A), in whichnatural selection rather than genetic drift is the main forcecausing substitutions, commonly depend on fluctuating en-vironments that are required to continue evolution and mayexplain some of the empirical phenomena found in molec-ular data (Ohta and Gillespie 1996). Nevertheless, it hasbeen recognized that there is a lack of a general model ofmolecular evolution that can account for all major molecularphenomena (Ohta and Gillespie 1996; Kreitman 1996; Niel-sen and Yang 2003). Here we propose that a reinterpretationof recent developments of molecular evolutionary modelsbased on Fisher’s (1930) geometrical framework (Gu
2007a,b; Su et al. 2010; Razeto-Barry et al. 2011; Razeto-Barry and Maldonado 2011) may offer an alternative mod-eling framework that gives a better account of molecularevolutionary phenomena than previous models.
Theoretical studies of molecular evolution assume prede-fined distributions of selection coefficients of mutants (e.g.,Ohta 1973, 1977; Kimura 1979; Ohta and Tachida 1990;Gillespie 1993, 1994). Thus the rate and proportion of dif-ferent types of mutations are dependent only upon the pop-ulation size and some parameters of the distribution of theselection coefficients (typically �s and ss, the mean and thestandard deviation of selection coefficients, respectively).However, in real processes the distribution of mutant selec-tion coefficients is determined by the operation of the evo-lutionary dynamics and therefore it should not be assumeda priori (Sella and Hirsh 2005). Moreover, choosing a spec-ified distribution is somewhat ad hoc because it lacks a clear-cut biological interpretation (Gu 2007b).
The Fisher geometrical model (FGM) has been used tomake distributions of mutations biologically interpretable(Martin and Lenormand 2006a,b, 2008; Gu 2007a,b). Givena distribution of the size of phenotypic effects of mutations(r), in the FGM the distribution of mutant selection coeffi-cients is determined by geometrical relations between thenumber of traits of organisms and the distance to an opti-mum trait combination. In turn, this distance depends onthe phenotypic traits of the population, the environmentalchanges (Orr 1998, 1999, 2000), and the fixed drift load ofthe population (Hartl and Taubes 1998; Poon and Otto2000; Sella and Hirsh 2005; Tenaillon et al. 2007; Sella2009), which allows exploration of relationships betweenparameters that may be linked to biologically interpretablefactors and thus should not be independently specified by
Figure 1 (A) Darwin’s (and neo-Darwinian selection)theory postulated the existence of deleterious (2) andadvantageous (+) changes, but Darwin recognized theexistence of neutral changes (Bernardi 2007). Deleteri-ous mutations are immediately rejected by negative (orpurifying) selection and neutral mutations are neglected.All the substitutions have a positive selection coefficients . 0. (B) The neutral theory (Kimura 1968, 1983) pos-tulated the existence of an important fraction of neutralmutations (N) and a very small fraction of advantageousmutations. Neutral mutations are fixed by random driftand constitute the majority of substitutions. A verysmall minority of substitutions have s . 0. (C) Theslightly deleterious mutation theory (Ohta 1972, 1992;Kimura 1979) is a nearly neutral theory that includedmutations between neutral and advantageous (N+), aswell as between neutral and deleterious (N2). Thesenearly neutral mutations are fixed by random drift too,and constitute, with the neutral, the majority of substi-tutions. The majority of substitutions have s , 0. (D) Thebalanced mutation theory also incorporates slightly del-eterious mutations (N2), but also postulates an impor-tant fraction of advantageous (compensatory) mutationsfixed after the fixations of slightly deleterious mutations.
Compensatory mutations constitute an important fraction of substitutions. 50% of no neutral substitutions have s . 0 and 50% have s , 0(adapted from Ohta 1992; Bromham and Penny 2003; Bernardi 2007).
524 P. Razeto-Barry et al.
arbitrary criteria. For example, Gu (2007a,b) used the FGMto model the slightly deleterious mutation theory under theshift model framework, finding a natural explanation forKimura’s gamma function of selection coefficients, whichwould be related to the number n of phenotypic dimensionsinfluenced by the mutations of a gene (gene pleiotropy).Thus Gu found that the gamma distribution case used byKimura corresponds to n ¼ 1 phenotypic dimensions and theexponential distribution of Ohta corresponds to n ¼ 2 (Gu2007a).
Gu’s work also allows the study of the relationship be-tween molecular evolution and population size in the FGM.However, the assumptions of Gu’s model in the FGM inheritthe problems of the original shift models, which werestrongly criticized because of their biologically unreasonableassumptions (Tachida 1991; Ohta 1992; Gillespie 1995;Ohta and Gillespie 1996; Razeto-Barry et al. 2011). For in-stance, shift models require that all mutations be deleteri-ous. Thus, when a deleterious mutation gets fixed, allsubsequent mutations must be less fit than the fixed muta-tion. Shift models allow simplifying assumptions that wereused in Gu’s work to make the problem analytically tracta-ble. However, more realistic assumptions can be approachedwith computer simulations (as in the house-of-cards model).Here we relaxed the assumptions of Gu’s model in the FGMand developed a model that supports a balanced mutationtheory of molecular evolution, which we call the static re-gime (SR). The steady state in the FGM has been under-stood as a nearly neutral evolutionary process (Hartl andTaubes 1996; Sella and Hirsh 2005; Sella 2009) and it isin some aspects similar to the house-of-cards nearly neutralmodel (Ohta and Tachida 1990; Tachida 1991, 1996). Weexplored the possible interpretations and evolutionary con-sequences of this model through simulations in the Fishergeometrical framework both in a balanced steady state (theSR) and in an interplay between adaptive processes andbalanced steady states in a randomly fluctuating environ-ment, henceforth the variable regime (VR). We found thatwhen molecular evolution, both in a fluctuating environ-ment (VR) and in the steady state (SR), is biologically inter-preted in the FGM it does not need the arbitraryindependent specification of some evolutionarily relevantparameters because they are locked in relationships thatdepend upon biologically interpretable factors. We foundother differences with previous nearly neutral models thatovercome unrealistic properties of these previous models,supporting the SR and VR as potentially good models forrepresenting general processes of molecular evolution.
The Model
Model assumptions
The FGM represents a population as a point in an n-dimen-sional space of states, in which each axis represents a differ-ent organismal phenotypic trait and the origin represents
the optimum state of a population given a specific environ-mental condition (Orr 1998, 2000; Welch and Waxman2003). Mutations are represented as random vectors iso-tropically distributed in this hyperspace (see below). Vectorsthat approach the origin are advantageous and those point-ing away from the optimum are deleterious; the selectioncoefficients of the vectors are determined according toa Gaussian fitness function centered on the optimum(which, without loss of generality, takes a fitness value of1). Environmental fluctuations are represented as optimumshifts (Barton 2001; Gu 2007b; Razeto-Barry et al. 2011). Incontrast to the nearly neutral shift models (see also Gu2007a,b), in our model when a mutation is fixed the phe-notype of individuals in the population is modified, acquir-ing a new fitness value; thus subsequent mutations startfrom the new phenotypic state (Razeto-Barry et al. 2011).
Given that a previously fixed mutation in a populationchanges the phenotypic starting point of each new mutation,the probability distributions of new mutations are shiftingpermanently, wandering in the Cartesian n-dimensionalspace. Because of their difficult analytical tractability, modelsin which population fitness fluctuates as a result of mutantfixations are analyzed by computer simulations (Ohta andTachida 1990; Tachida 1991, 1996, 2000; Gillespie 1995;Razeto-Barry et al. 2011). We simulated asexual populationsunder the assumption of weak mutation (Nu , 1, where u isthe genomic mutation rate); thus the evolutionary process isdepicted as a succession of fixations and neglects the effectsof polymorphisms. We followed the methods of Razeto-Barryet al. (2011) to model molecular evolutionary processes inthe framework of the FGM but with the difference that, incontrast to previous models (Gu 2007a,b; Su et al. 2010;Razeto-Barry et al. 2011; Razeto-Barry and Maldonado2011), the number of dimensions n is not interpreted asthe number of orthogonal traits affected by mutations ina gene, but rather as the number of orthogonal traits affectedby mutations in the entire organismal genome.
The usual FGM-based modeling of evolutionary processesis the analysis of a bout of adaptation after a sudden, recentenvironmental shift of the optimum (Orr 1998, 1999, 2000;Welch and Waxman 2003), but the fate of an adaptive boutis to reach a fitness plateau (Silander et al. 2007), which ischaracterized by a balanced steady state in which molecularevolution does not stop (Hartl and Taubes 1996). Thissteady state has been studied while maintaining a fixed op-timum (Hartl and Taubes 1998; Poon and Otto 2000; Sellaand Hirsh 2005; Tenaillon et al. 2007; Sella 2009). In theVR (distinguished from SR) we modeled temporally fluctu-ating random optimum shifts; thus the evolutionary processwas an alternation between adaptive bouts and balancedsteady states that are determined by the variability of theenvironmental changes. Thus obviously the VR converges tothe SR when environmental variability and amplitude tendto zero.
We studied the rate of molecular evolution as the ratiobetween the substitution and mutation rate (k/u), which is
Molecular Evolution and Nearly Neutral Theories 525
usually measured by the ratio between synonymous andnonsynonymous substitution rates (dN/dS), under the as-sumption that synonymous substitutions are almost neutral.In contrast to Gu (2007a,b) we utilized a top-down ap-proach to isotropic random vector generation (Poon andOtto 2000); that is, we directly specified only the distribu-tion of total mutation length and did not specify the mar-ginal distributions along each axis. Thus a change in thenumber of dimensions does not affect the total length ofthe mutation’s effects, which allows us to distinguishing be-tween the effect of dimensionality and the effect of mutationsize on the molecular evolutionary rate (see Razeto-Barryet al. 2011). We followed Gu’s bottom-up approach for therandom shifts of optimum values, but corrected the ampli-tudes of shifts by requiring that amplitudes be equal fordifferent numbers of dimensions (see Razeto-Barry et al.2011). Following Kimura (1983) and Orr (1998), the distri-bution used for mutation magnitudes was uniform.
Simulations
Simulations were performed with Monte Carlo methods bywhich vectors are generated randomly with a uniformdistribution of vector magnitudes (from 0 to r). The totaleffect of a gene mutation (mutation size rj ¼ jrjj) was mea-sured as the Euclidean distance r2j ¼ Pn
i¼1ðzmuti 2zþi Þ2, where
zmuti is the value of coordinate i of the mutant, zþi is the valueof the present phenotype (wild type), and i =1, . . ., n. As-suming for simplicity that effective and census populationsizes are equal, these changes are fixed with probabilitypðN; sÞ ¼ 12e22s=12e22Ns, where N is the effective popula-tion size and s is the selection coefficient of the mutation(Crow and Kimura 1970).
Fitness values follow the Gaussian function wðzÞ ¼ e2z2=2,where z is the distance to the optimum point. Selectioncoefficients are defined as s ¼ ðwmut2wþÞ=wþ, where wmut
is the fitness of the mutant and w+ is the fitness of the wildtype. We obtained the ratio between substitution rate andmutation rate (k/u) for different conditions, varying popu-lation size (N), complexity (number of dimensions, n), av-erage size of phenotypic effects of mutations (hereaftermutation size, r
�), and (defined below) amplitude (sa) and
variability (t) of optimum shifts.Random optimum shifts were simulated such that
v � f ðv; lÞ ¼ e2llv=v!, where v and l are the number andthe expected number of changes in a time interval, respec-tively. Time intervals between consecutive changes (t) fol-lowed an exponential distribution t � f ðt; tÞ ¼ e2ð1=tÞt,where t ¼ 1/l is the expected time between optimumchanges. Assuming a constant mutation rate per gene perindividual per generation (u), the expected time betweenenvironmental changes is �t ¼ t=uN (Razeto-Barry et al.2011). To compare processes with different effective popu-lation size in environments with equivalent times betweenchanges, we then set t } N. The amplitudes of environmen-tal changes were obtained by aðz1...;znÞ¼
ffiffiffiffiffiffiffiffiffiffiffiffiffiffiffiz21þ...þz2n
p=ffiffin
p , where ziare the coordinates of the new optimum which were inde-
pendently chosen from a Gaussian distribution centered atthe origin of the coordinates, i.e., zi � f ðsaÞ ¼ e2z2i =2s
2a ,
where sa represents the standard deviation of the ampli-tudes of environmental changes. We set aðz1; . . . ; znÞ}1=
ffiffiffin
pto guarantee that any relationship between evolutionaryrate and dimensionality will be due to the effect of dimen-sionality itself and not because of a correlation between di-mensionality and amplitude of environmental changes (seeRazeto-Barry et al. 2011).
Strictly advantageous substitutions are defined as sub-stitutions that comply with s . 1/N, i.e., advantageous sub-stitutions fixed by positive selection; effectively neutralsubstitutions are defined as jsj , 1=N, i.e., substitutionsfixed mainly by random drift; and strictly deleterious sub-stitutions are defined as s , 21/N, i.e., deleterious substi-tutions fixed by drift in spite of the strong negative selectionagainst them. When we denote mutations or substitutionswith s . 0 and s , 0 we simply speak of “advantageous” or“deleterious,” respectively.
Results
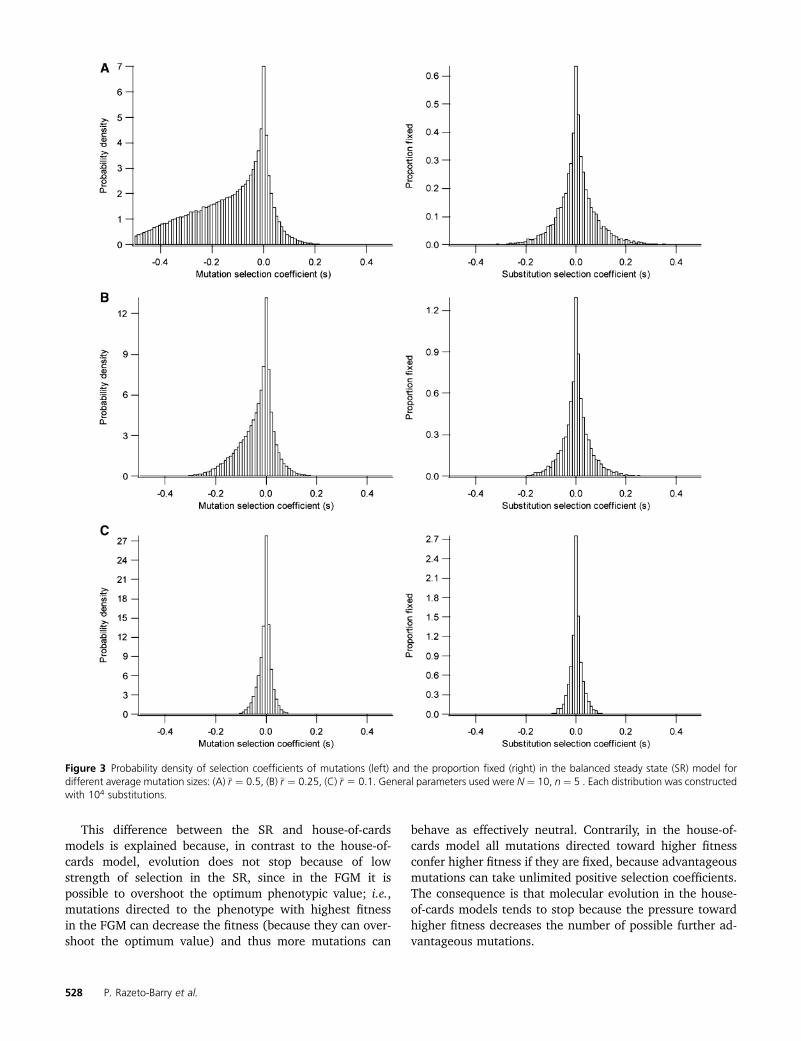
In Figure 2 we show a trial of the substitution process usedfor simulations with random environmental variability (theVR). After a shift of the optimum, the population suffersa burst of adaptive substitutions (Figure 2C) until it achievesa balanced steady state (Figure 2B). In the balanced steadystate, the population remains dynamically around a subopti-mum equilibrium fitness that is lower for smaller populationsizes (Hartl and Taubes 1998; Poon and Otto 2000; Tenail-lon et al. 2007) and in which a fluctuating substitution pro-cess occurs (Figure 2B). In the SR the ratio betweenadvantageous (s . 0) and deleterious (s , 0) mutationsdepends on the size of mutations (Figure 3, left) with a lep-tokurtic distribution skewed toward more negative valuesfor higher mutation sizes. The proportion of advantageousmutations tends to a maximum value of 0.5 for smallermutation sizes (Figure 3C, left). The distribution of selectioncoefficients of substitutions (Figure 3, right) follows a lepto-kurtic but symmetric distribution independently of the mu-tation size. That is, the expected proportion of advantageoussubstitutions is always 0.5. The mean ð�sÞ and standard de-viation (ss) of the selection coefficients of mutations werecalculated according to different mutation sizes, both for thesteady state (SR) and for fluctuating environmental evolu-tionary processes (VR) (Figure 4). The mean selection co-efficient decreases while the standard deviation increaseswith the increase of mutation size under all conditions (Fig-ure 4A). The curves are clearly differentiated for smallerpopulation sizes (N ¼ 10 and N ¼ 100), but they are verysimilar for larger population sizes (N ¼ 100, 1000 and10,000) (Figure 4A), and the absolute magnitude of thecoefficient of variation of the selection coefficients ðss=�sÞapproaches a value of one (Figure 4B). Curves are onlyslightly sensitive to other parameters such as to the numberof dimensions and environmental variability (see Figure 4).
526 P. Razeto-Barry et al.

With no environmental variability (the SR), we founda negative relationship between total and effectively neu-tral, evolutionary rate and population size (Figure 5). Thedecrease is greater for larger mutation sizes (Figure 5).Strictly advantageous and strictly deleterious substitutionrates are similar and decrease with increasing populationsizes for larger mutation sizes (Figure 5, A and B), havea maximum for intermediate sizes (Figure 5C), and in-creased for small mutation sizes (Figure 5D). With environ-mental variability (the VR), the expected rate ofadvantageous substitutions (s . 0) is greater than that ofdeleterious substitutions (s , 0) and the relationship be-tween evolutionary rate and population size is more com-plex (Figure 6). For small population sizes, the totalevolutionary rate decreases with increase of population sizeexcept when mutation size is very small and the number ofdimensions is large (Figure 6D). The decrease in total sub-stitution rate reaches a plateau with smaller population sizeswhen mutation size is greater (Figure 6, A and B). The valueof this plateau, in which the total substitution rate remainsequal for different population sizes, is larger for lower mu-tation sizes and higher number of dimensions. The strictlyadvantageous substitution rate increases with populationsize, and the increase is stronger for smaller mutation size.However, the critical population size where the strictly ad-vantageous rate exceeds the effectively neutral rate is largerfor smaller mutation sizes (Figure 6, A and B).
Discussion
The SR showed similarities to the house-of-cards or “fixed”model of molecular evolution (see Ohta and Tachida 1990;
Tachida 1991), in which evolution is an alternating processwith half of the substitutions being advantageous and theother half deleterious (Figure 3) (Tachida 1991; Gillespie1994, 1995; Sella and Hirsh 2005). Most of these advanta-geous mutations would be compensatory, i.e., intragenic orintergenic mutations that restore the fitness loss due to pre-vious deleterious mutations (Poon and Otto 2000). However,the SR model overcomes some problems of the house-of-cards model. It has been claimed that the house-of-cardsmodel is not a plausible model of molecular evolution be-cause the substitution rate is a rapidly decreasing (typicallyconcave) function of the strength of selection (2Nss), whichstops when 2Nss . 4 (Tachida 1991; Gillespie 1994, 1995;Ohta and Gillespie 1996). That is, it cannot contain enoughmutations that behave effectively as neutral when the popu-lation size is large (Kimura 1979, 1983). By contrast, in theSR the relationship between substitution rate and populationsize (and thus the strength of selection) is convex (as in theshifting models; see Gillespie 1994, 1995) and evolution doesnot stop even for 2Nss � 260 (e.g., in Figure 5A ss � 0.13,and when N ¼ 1000, k/u � 0.05). Tachida (1996) showedthat in the house-of-cards model substitutions continue tooccur even when 2Nss ¼ 20 if the distribution of the selectioncoefficients of mutations is uniform, making this model moreplausible. However, the assumption of a uniform distributionis not realistic according to the current data that show lep-tokurtic selection coefficient distributions (e.g., Keightley1994; Lynch et al. 1999; Orr 2010), as in our SR. Therefore,the SR may be considered to be a plausible nearly neutralmodel of molecular evolution without the apparent deficien-cies of previous models, giving new support to the balancednearly neutral models.
Figure 2 (A) Fitness of the evolutionary process for a sequence of substitutions with a randomly shifting optimum (variable geometric model, VR). Thethick line corresponds to population size of N ¼ 50 (t ¼ 5 · 105), and the thin line corresponds to N ¼ 200 (t ¼ 105). (B) Zoom of the balanced steadystate for N ¼ 200 indicated by a dashed horizontal rectangle in A. (C) Zoom of the adaptive bout for N ¼ 50 indicated by a dashed vertical rectangle inA. Simulation parameters were n ¼ 20 dimensions, mutation size �r 5 0:3, shift amplitude sa ¼ 0.85.
Molecular Evolution and Nearly Neutral Theories 527
This difference between the SR and house-of-cardsmodels is explained because, in contrast to the house-of-cards model, evolution does not stop because of lowstrength of selection in the SR, since in the FGM it ispossible to overshoot the optimum phenotypic value; i.e.,mutations directed to the phenotype with highest fitnessin the FGM can decrease the fitness (because they can over-shoot the optimum value) and thus more mutations can
behave as effectively neutral. Contrarily, in the house-of-cards model all mutations directed toward higher fitnessconfer higher fitness if they are fixed, because advantageousmutations can take unlimited positive selection coefficients.The consequence is that molecular evolution in the house-of-cards models tends to stop because the pressure towardhigher fitness decreases the number of possible further ad-vantageous mutations.
Figure 3 Probability density of selection coefficients of mutations (left) and the proportion fixed (right) in the balanced steady state (SR) model fordifferent average mutation sizes: (A) �r ¼ 0:5, (B) �r ¼ 0:25, (C) �r 5 0:1. General parameters used were N ¼ 10, n ¼ 5 . Each distribution was constructedwith 104 substitutions.
528 P. Razeto-Barry et al.

The evolutionary role of compensatory mutations is notcompletely understood and there are few theoretical modelsin evolutionary biology in which compensatory mutationsare explicitly incorporated (Poon et al. 2005). It has beensuggested that the current evidence for a high rate of ad-vantageous mutations fixed by positive selection, �50% ormore (Fay et al. 2002; Bierne and Eyre-Walker 2004; Eyre-Walker 2006; Bachtrog 2008), could be explained as theeffect of compensatory mutations (Kondrashov et al. 2002;DePristo et al. 2005; Pál et al. 2006; Camps et al. 2007). Thisidea was proposed earlier by Hartl and Taubes (1996) usingthe FGM framework, stating that in the steady state there is“selection without adaptation,” i.e., positive selection butupholding only the status quo in a balance between delete-rious mutations and later advantageous compensatorymutations. In contrast with this assumption, we found thatthe proportion of advantageous (compensatory) mutationsfixed by positive selection (i.e., strictly advantageous muta-tions) is very low in the steady state (much lower than 50%;see Figure 5). The explanation for this result is that com-
pensatory mutations are abundant and thus come after oneor a very small number of deleterious mutations previouslyfixed by drift, and thus both are of the same order of mag-nitude; i.e., both are mainly effectively neutral (see Figure5). In other words, given that in the SR not more than 50%of substitutions are advantageous and the distribution ofselection coefficients of substitutions is leptokurtic (Figure3), necessarily only a small proportion of advantageous sub-stitutions (s . 0) could be strictly advantageous (s . 1/N).Thus, given the small selection coefficients of advantageousmutations, it is difficult to explain the high rate of mutationsfixed by positive selection (Fay et al. 2002; Bierne and Eyre-Walker 2004; Eyre-Walker 2006; Bachtrog 2008). It is pos-sible that if compensatory mutations were very rare, on theaverage several deleterious substitutions could be fixed be-fore an advantageous mutation compensated the previouseffect of the deleterious ones. In this case, a higher propor-tion of compensatory substitutions could be of greater sizeand strictly advantageous. By contrast, our model assumesa high rate of compensatory mutations, which is in agree-ment with current studies (Poon and Otto 2000; Whitlocket al. 2003; Poon et al. 2005). For example, Poon et al.’s(2005) study in viruses, prokaryotes, and eukaryotes revealed
Figure 4 (A) Mean selection coefficient (solid line and right scale) andstandard deviation of selection coefficients (left scale) for different muta-tion sizes (�r). Dotted lines correspond to effective population size N ¼ 10and dashed lines to N ¼ 100; there are also triangles (N ¼ 1000) andcircles (N ¼ 10,000), which are indistinguishable. Lines are superposed fordifferent dimensions (n ¼ 3, n ¼ 30) and different environmental vari-ability and amplitude (fixed and shifting optimum with t ¼ 104, sa ¼0.425). (B) Coefficient of variation of selection coefficients for differentmean step sizes. N ¼ 1000 (dashed line); N ¼ 10 (dotted line).
Figure 5 Ratio between substitution rate and mutation rate in relation topopulation size for different sizes of mutation effects in the SR. (A) Av-erage size �r ¼ 0:5 (�s � 20:13,ss � 0.13). (B) �r ¼ 0:3 (�s � 20:055,ss �0.055), (C) �r ¼ 0:1 (�s � 20:01,ss � 0.13), (D) �r ¼ 0:0025 (�s � 0,ss � 0).Dashed lines correspond to the total substitution rate. The upper contin-uous lines represent to effectively neutral substitutions. The lower con-tinuous lines correspond to strictly advantageous and strictly deleteriousðjNsj.1Þ substitution rates, which are indistinguishable. All plots wereobtained for dimensions n ¼ 2, n ¼ 10, n ¼ 30, but all are perfectlysuperposed and indistinguishable. Each simulation corresponds to 2 · 104
substitutions in the steady state.
Molecular Evolution and Nearly Neutral Theories 529

that on average there are 11.8 compensatory mutations perdeleterious mutation. Our conclusions seem robust in thisscenario.
Both the slightly deleterious mutation and the balancedmutation theories (Figure 1C,D) have been consideredwithin the nearly neutral theory. In turn, the distinctionbetween nearly neutral models and selection models seemsto be somewhat unclear (see Ohta 1996; Kreitman 1996;Ohta and Gillespie 1996). The main difference betweenthe nearly neutral and selection theories is that the formerpredicts a negative relationship between evolution and pop-ulation size whereas the latter predicts the contrary (Ohta1996). The role of population size in population geneticmodels of molecular evolution was examined by Gillespie(1999), who defined three domains according to the rela-tionship between substitution rate and population size. InOhta’s domain, the rate of substitution decreases with in-creasing population size, while in Kimura’s domain, the rateof substitution remains close to the mutation rate, while inDarwin’s domain, the rate of substitution increases with in-
creasing population size. Our SR verified an inverse relation-ship between the substitution rate and population size(Figure 5) (see also Gu 2007a); thus the SR falls underOhta’s domain. Because this inverse relationship is essentialto explaining the protein molecular clock under the nearlyneutral theory (see Ohta 1992), the SR may also be under-stood as a nearly neutral model. However, it is important todistinguish the SR from the slightly deleterious mutationtheory (Figure 1C), which is the model most commonlyassociated with the nearly neutral theory (Gillespie 1995,2004; Ohta 1996). The differences between the slightly del-eterious mutation models and the SR are important in theirpredictions about both mutations and substitutions. Thereare two major differences: (i) the mutation assumptions ofthe SR involve a higher fraction of advantageous (mainlycompensatory) mutations than the slightly deleterious mu-tation models and (ii) the predictions of the SR imply a muchgreater fraction of advantageous substitutions than theslightly deleterious mutation models; thus the SR predicts50% advantageous substitutions (Figure 1D and Figure 3,right; see also Gillespie 1995; Sella and Hirsh 2005).
Furthermore, the SR can relate the evolutionary rate tothe average size of phenotypic effects of mutations (muta-tion size). In the SR the total evolutionary rate is determinedmainly by the effectively neutral mutations and is greater forsmaller mutation sizes (Figure 5), which is consistent withthe decrease of the mean selection coefficients of largermutations (Figure 4A). However, when the rate of strictlyadvantageous and strictly deleterious substitutions are de-scribed separately, we found a complex relationship withpopulation size for different ranges of mutation sizes: a de-crease with population size for larger mutation sizes (Figure5A,B), a maximum for intermediate sizes (Figure 5C), andan increase with population size for smaller mutation sizes(Figure 5D). This trend to increase the rate of strictly ad-vantageous substitutions (with the corresponding balanceby deleterious substitutions) with population size when mu-tation size is low may be explained as follows. As mentionedbefore, the decrease of the evolutionary rate with populationsize is the commonly expected behavior under the nearlyneutral framework, because larger population sizes implystrong selection against deleterious mutations, decreasingthe substitution rate of deleterious mutations and thus alsodecreasing the rate of advantageous compensatory muta-tions. Although we found this pattern for the total molecularrate, we found that for lower mutation sizes the rate ofstrictly advantageous substitutions increases with popula-tion size (Figure 5D, lower curve), which is not typicallypredicted by nearly neutral models. This occurs becausefor small mutation sizes, the SR implies that a high propor-tion of nearly neutral mutations (50%) are advantageous(Figure 3C). In this situation, the distribution of selectioncoefficients of mutations is symmetrical (Figure 3C) andthus the increase of population size has the effect of increas-ing the strength of selection equally for advantageous anddeleterious mutations. Therefore, given that the probability
Figure 6 Ratio between substitution rate and mutation rate vs. popula-tion size for different sizes of mutation effects in the VR. (A) Average size�r ¼ 0:5 (�s � 20:13,ss � 0.13). (B) �r ¼ 0:3 (�s � 20:055,ss � 0.055), (C)�r ¼ 0:1 (�s � 20:01,ss � 0.13), (D) �r ¼ 0:0025 (�s � 0,ss � 0). Dashedlines correspond to the total substitution rate. The upper continuous linescorrespond to neutral substitutions. The lower continuous lines corre-spond to a strictly advantageous (s . 1/N) substitution rate; dotted linescorrespond to a strictly deleterious (s , 21/N) substitution rate. All plotswere obtained for dimensions n ¼ 2 (red), n ¼ 10 (black), n ¼ 30 (blue).Each simulation corresponds to 2 · 104 substitutions. The environmentalvariability parameters were sa ¼ 0.85, t ¼ 500.N, which on the averageresult in a mean fitness w ¼ 0.7 and a mean load L ¼ 0.3. Each curvecorresponds to 140,000 substitutions.
530 P. Razeto-Barry et al.

of fixation is higher for advantageous than deleterious muta-tions, the effect of the increment in the strength of selectionwhen the distribution of mutations is symmetrical is the in-crease of the rate of strictly advantageous mutations (withthe respective balance of strictly deleterious ones) (Figure5D).
As mentioned before, contrary to previous studies of theFGM that have been focused separately on the adaptiveprocess (Orr 1998, 1999, 2006; Welch and Waxman 2003;Griswold and Whitlock 2003) or on the steady state (Hartland Taubes 1998; Poon and Otto 2000; Sella and Hirsh2005; Tenaillon et al. 2007; Sella 2009), the VR is a modelin which there is an interplay between adaptive and bal-anced steady-state processes (Figure 2; see also Razeto-Barry et al. 2011). Generally, selection models of molecularevolution assume environmental changes (Gillespie 1993;Ohta and Gillespie 1996), as for example, in the mutationallandscape model (Gillespie 1984, 1991), NK model (Kauff-man 1993), TIM model (Takahata et al. 1975), and SAS-CFFmodel (Gillespie 1991). The reason is that populations tendto evolve to a point where most mutations are deleteriousthrough the substitution of advantageous mutations. Theidea that permanent advantageous mutation fixation by pos-itive selection could occur without optimum shifts probablycomes from early findings in the vertebrate major histocom-patibility complex and coevolutionary processes of patho-gens that erroneously were taken as a model for thegeneral evolution of proteins (Hughes 2007). Thus, a moregeneral molecular evolutionary model would predict thatwhen all mutationally accessible advantageous alleles areexhausted, the majority of newly arising mutations will bedeleterious (Gillespie 1994) or nearly neutral (Hartl andTaubes 1996). Accordingly, in the VR the evolutionary rateincreases due to temporal environmental fluctuations (Fig-ure 6) compared to the rate without environmental fluctua-tions but with the same mutation sizes (Figure 5) (see alsoRazeto-Barry et al. 2011, Figure 2). Given that in the VRpopulations reach dynamic (i.e., nonstatic) steady state afteradaptive bouts, evolution does not stop without environ-mental fluctuations (contrary to other models; see Ohta1996). Nevertheless, given that compensatory mutationscannot explain the repeated substitutions by positive selec-tion, and because positive selection tends to stop after somesteps (Hughes 2007), the optimum shifts assumption is theonly remaining reasonable hypothesis for maintaining a se-lection model at the molecular level.
The higher evolutionary rate in the VR compared to theSR is evidently due to an increase of strictly advantageoussubstitution rate (Figure 6, lower solid lines). Interestingly,this increase is greater for smaller mutation sizes, attainingvalues k/u . 1 (Figure 6D). Paradoxically, this does notimply that for smaller mutation sizes the evolutionary pro-cess becomes more influenced by natural selection. In fact,the rate of strictly advantageous substitutions exceeded theeffectively neutral rate with larger mutation sizes even forlow population size (Figure 6, A and B), but this did not
occur with smaller mutation sizes (Figure 6D). The increaseof the strictly advantageous substitution rate for smallermutation sizes occurs because the adaptive process needsa larger number of advantageous substitutions to reachthe steady state (see Razeto-Barry and Maldonado 2011).Interestingly, the evolutionary rate attains a plateau thatdoes not depend on population size, but rather on the com-plexity (number of dimensions) of organisms (Figure 6, Aand B). For greater organism complexity, the evolutionaryrate increases, which may be understood as a consequenceof Orr’s (2000) “cost of complexity”; that is, more complexorganisms spend more time in adaptive processes than lesscomplex ones, accumulating on the average a larger numberof mutations with smaller adaptive contribution (seeRazeto-Barry et al. 2011; Razeto-Barry and Maldonado2011). The independence of substitution rate and popula-tion size in the plateau is due to the fact that the increase ofstrictly advantageous substitutions is accurately balanced bythe decrease of effectively neutral substitutions (Figure 6).As the effectively neutral substitution rate decreases mono-tonically, the strictly advantageous rate increases to a pla-teau. This is consistent with recent evidence on the rate ofstrictly advantageous substitution that appears to be inde-pendent of population size (Bachtrog 2008). Bachtrog(2008) found only a slightly higher rate of strictly advanta-geous substitutions in Drosophila melanogaster than in D.miranda, in spite of the latter having an effective populationsize five times smaller than the former. Furthermore, moregenerally this may explain why the estimated proportion ofamino acid variants driven to fixation by positive selectionseems to differ among species with small population sizesbut not much for species with very large effective populationsizes, even though these differ by several orders of magni-tude (Harris 2010, Tables 2 and 3).
As expected, the increase of environmental amplitude hasan effect on the evolutionary rate equivalent to the increaseof environmental variability in increasing the rate ofadvantageous substitution (Razeto-Barry et al. 2011), butbiologically these phenomena are not completely equiva-lent. Indeed, an important assumption of the VR simulationsis that populations do not go to extinction due to environ-mental fluctuations. In fact, populations cannot supporta too-high level of load (i.e., suboptimum fitness value dueto an environmental shift of great amplitude) (Haldane1957). For example, in our simulations the mean load dueto environmental fluctuations is L ¼ 0.3 (i.e., a fitness valueof w ¼ 0.7, for sa ¼ 0.85). That is on the order of the costassumed by Ewens (2004); however, Haldane (1957) as-sumed a load of 0.1 on the basis of human data. This valueis probably conservative and depends on population density(Nunney 2003). Overall, populations with high reproductiveexcess could bear the fitness decrease due to environmentalchanges (Nunney 2003; Ewens 2004). Another assumptionof our model where the strength of the environmentalchange is important is that the fitness surface is Gaussian.This is an assumption usually justified because when
Molecular Evolution and Nearly Neutral Theories 531

a population is close to the optimum, a Gaussian fitnessfunction is a good local approximation for many arbitraryfitness functions (Lande 1980); however, it could be lessaccurate under strong environmental change where the pop-ulation is not so near the optimum (Martin and Lenormand2006a). Finally, models relaxing the assumption of Nu , 1should be developed in the future.
Contrary to the suggestion of Orr (1998) the uniformdistribution we assumed for mutation sizes (see also Kimura1983) is consistent with the majority of current empiricaland theoretical evidence on distributions of the fitnesseffects of mutations. According to the majority of studies,the distributions of deleterious mutations (Keightley 1994;Lynch et al. 1999) and beneficial mutations (Sanjuán et al.2004; Kassen and Bataillon 2006; Orr 2006, 2010) are lep-tokurtic. Note that all these studies (empirical and theoret-ical) dealt with the size of the fitness effects of mutations(selection coefficients), not with the size of the phenotypiceffects of mutations. As is clear in Figure 3 (left), takinga uniform distribution of mutational (phenotypic) effects(r), the distribution of fitness effects (selection coefficients,s) is leptokurtic. In fact, when the average mutational size(r�) is large enough (Figure 3A), the distribution of s among
deleterious mutations is L-shaped rather than exponential,which coincides with the literature (Lynch et al. 1999),while the distribution of s among beneficial mutations isexponential-like, which also coincides with the literature(Sanjuán et al. 2004; Kassen and Bataillon 2006; Orr2006, 2010). Note also that the exponential distribution ofs arises from different mutational distributions of r, includ-ing the uniform (Orr 2006).
In addition to the mentioned relationships among sub-stitution rate, mutation size, population size, and organis-mal complexity, some important parameters were foundlinked in the SR and the VR. For example, for both the SRand the VR, the absolute magnitude of the coefficient ofvariation of selection coefficients (ss=�s) approaches one asthe mean step size increases when N $ 100 (e.g., Figure 4B,upper curve); that is, if the mean of the absolute value of theselection coefficients decreases, the standard deviationincreases nearly in the same proportion. Recently, it hasbeen realized that a benefit of the FGM is that it makes someof the distributions used in molecular evolution biologicallyinterpretable (Sella and Hirsh 2005; Martin and Lenormand2006a,b, 2008; Gu 2007a,b). A priori assumptions of a par-ticular distribution of mutant selection coefficients havebeen considered inappropriate because the distribution de-termined by evolutionary dynamics will differ in importantways from distributions assumed a priori (Sella and Hirsh2005). But another problem is that some parameters as-sumed in the general models (particularly �s and ss) arecrucial by themselves for other biologically relevant issuesand should be determined instead of just being assumed.For example, the proportion of deleterious to advantageousmutations (determined by s
�and ss) is crucial to estimating
the probability of extinction of populations and it is fre-
quently fixed arbitrarily in the models due to the lack ofother theoretical or empirical criteria to determine it (Whit-lock 2000; Whitlock et al. 2003).
Other parameters are also linked in the SR. The ratiobetween advantageous and deleterious mutations is locked;i.e., it cannot take arbitrarily independent values. It yieldsa maximum value of 1 when mutation size tends to zero(Figure 3C, according to Fisher 1930). When mutation sizeis small, the limiting factor for the selection coefficient ofdeleterious and advantageous mutations is the size of muta-tions (Figure 3C), and a large proportion (50%) of nearlyneutral mutations are advantageous. Interestingly, this factwas suggested verbally by Gillespie (1995) as a criticism toOhta’s (1977, 1992) assumptions, based on Fisher’s (1930)classical result.
The results of simulations indicate that at least three ofthe conclusions of this study are well verified in the model.First, compensatory substitutions cannot take arbitraryvalues and necessarily a low proportion of compensatorysubstitutions are strictly advantageous. Second, the pro-portion of advantageous substitutions has a minimum of 0.5(for very low environmental variability), and the proportionof advantageous mutations has a maximum of 0.5 (for verysmall mutation size). Third, the absolute magnitude of thecoefficient of variation of selection coefficients approachesone. Again, these conclusions support the importance ofobtaining values for these parameters by modeling theevolutionary process and not by a priori decisions (Sellaand Hirsh 2005), which in turn, may give independent plau-sibility to some molecular evolutionary models rather thanto others (Figure 1) when there are not enough data tojudge.
Acknowledgments
We thank Associate Editor Lindi Wahl and two anonymousreviewers for their insightful suggestions. We also thank theInstitute of Ecology and Biodiversity ICM-P05-002 and PFB-23-CONICYT, and FONDECYT 1090794 (R.A.V.), and theInstitute of Philosophy and Complexity Science (IFICC).P.R.-B. acknowledges support from Doctoral Scholarship21050901-CONICYT and Supporting Doctoral Thesis Schol-arship 23070216-CONICYT.
Literature Cited
Bachtrog, D., 2008 Similar rates of protein adaptation in Drosoph-ila miranda and D. melanogaster, two species with different cur-rent effective population sizes. BMC Evol. Biol. 8: 334.
Barton, N. H., 2001 The role of hybridization in evolution. Mol.Ecol. 10: 551–568.
Bernardi, G., 2007 The neoselectionist theory of genome evolu-tion. Proc. Natl. Acad. Sci. USA 104(20): 8385–8390.
Bierne, N., and A. Eyre-Walker, 2004 The genomic rate of adap-tive amino acid substitution in Drosophila. Mol. Biol. Evol. 21:1350–1360.
532 P. Razeto-Barry et al.

Bromham, L., and D. Penny, 2003 The modern molecular clock.Nat. Rev. Genet. 4: 216–224.
Camps, M., H. Asael, and A. L. Lawrence, 2007 Genetic con-straints on protein evolution. Crit. Rev. Biochem. Mol. Biol.42: 313–326.
Crow, J. F., and M. Kimura, 1970 An Introduction to PopulationGenetics Theory. Harper & Row, New York.
DePristo, M. A., D. M. Weinreich, and D. L. Hartl, 2005 Missensemeanderings in sequence space: a biophysical view of proteinevolution. Nat. Rev. Genet. 6: 678–687.
Eyre-Walker, A., 2006 The genomic rate of adaptive evolution.Trends Ecol. Evol. 21(10): 569–575.
Eyre-Walker, A., P. D. Keightley, N. G. C. Smith, and D. Gaffney,2002 Quantifying the slightly deleterious mutation model ofmolecular evolution. Mol. Biol. Evol. 19(12): 2142–2149.
Ewens, W. J., 2004 Mathematical Population Genetics. Springer,Philadelphia, PA.
Fay, J. C., G. J. Wyckoff, and C. I. Wu, 2002 Testing the neutraltheory of molecular evolution with genomic data from Drosoph-ila. Nature 415: 1024–1026.
Fisher, R. A., 1930 Genetical Theory of Natural Selection. Claren-don Press, Oxford.
Gillespie, J. H., 1984 Molecular evolution over the mutationallandscape. Evolution 38: 1116–1129.
Gillespie, J. H., 1991 The Causes of Molecular Evolution. OxfordUniversity Press, Oxford.
Gillespie, J. H., 1993 Substitution processes in molecular evolu-tion. I. Uniform and clustered substitutions in a haploid model.Genetics 134: 971–981.
Gillespie, J. H., 1994 Substitution processes in molecular evolu-tion. III. Deleterious alleles. Genetics 138: 943–952.
Gillespie, J. H., 1995 On Ohta’s hypothesis: most amino acid sub-stitutions are deleterious. J. Mol. Evol. 40: 64–69.
Gillespie, J. H., 1999 The role of population size in molecularevolution. Theor. Popul. Biol. 55: 145–156.
Gillespie, J. H., 2004 Population Genetics, Ed. 2. Johns HopkinsUniv. Press, London.
Griswold, C. K., and M. C. Whitlock, 2003 The genetics of adap-tation: the roles of pleiotropy, stabilizing selection and drift inshaping the distribution of bidirectional fixed mutational effects.Genetics 165: 2181–2192.
Gu, X., 2007a Stabilizing selection of protein function and distri-bution of selection coefficient among sites. Genetica 130: 93–97.
Gu, X., 2007b Evolutionary framework for protein sequence evo-lution and gene pleiotropy. Genetics 175: 1813–1822.
Haldane, J. B. S., 1957 The cost of natural selection. J. Genet. 55:511–524.
Harris, E. E., 2010 Nonadaptive processes in primate and humanevolution. Yearb. Phys. Anthropol. 53: 13–45.
Hartl, D., and C. H. Taubes, 1996 Compensatory nearly neutralmutations: selection without adaptation. J. Theor. Biol. 182:303–309.
Hartl, D., and C. H. Taubes, 1998 Towards a theory of evolution-ary adaptation. Genetica 103: 525–533.
Hughes, A. L., 2007 Looking for Darwin in all the wrong places:the misguided quest for positive selection at the nucleotide se-quence level. Heredity 99: 364–373.
Kassen, R., and T. Bataillon, 2006 Distribution of fitness effectsamong beneficial mutations before selection in experimentalpopulations of bacteria. Nat. Genet. 38: 484–488.
Kauffman, S. A., 1993 The Origins of Order. Oxford UniversityPress, Oxford.
Keightley, P. D., 1994 The distribution of mutation effects on vi-ability in Drosophila melanogaster. Genetics 138: 1315–1322.
Kimura, M., 1968 Evolutionary rate at the molecular level. Nature217: 624–626.
Kimura, M., 1979 Model of effectively neutral mutations in whichselective constraint is incorporated. Proc. Natl. Acad. Sci. USA76: 3440–3444.
Kimura, M., 1983 The Neutral Allele Theory of Molecular Evolution.Cambridge University Press, Cambridge.
Kondrashov, A. S., S. Sunyaev, and F. A. Kondrashov,2002 Dobzhansky–Muller incompatibilities in protein evolu-tion. Proc. Natl. Acad. Sci. USA 99: 14878–14883.
Kreitman, M., 1996 The neutral theory is dead: long live theneutral theory. Bioessays 18(8): 678–683.
Lande, R., 1980 The genetic covariance between characters main-tained by pleiotropic mutations. Genetics 94: 203–215.
Lynch, M., J. Blanchard, D. Houle, T. Kibota, S. Schultz et al.,1999 Perspective: spontaneous deleterious mutation. Evolu-tion 53: 645–663.
Martin, G., and T. Lenormand, 2006a A general multivariate ex-tension of Fisher’s geometrical model and the distribution ofmutation fitness effects across species. Evolution 60(5): 893–907.
Martin, G., and T. Lenormand, 2006b The fitness effect of muta-tions across environments: a survey in light of fitness landscapemodels. Evolution 60: 2413–2427.
Martin, G., and T. Lenormand, 2008 The distribution of beneficialand fixed mutation fitness effects close to an optimum. Genetics179: 907–916.
Nielsen, R., and Z. Yang, 2003 Estimating the distribution of se-lection coefficients from phylogenetic data with applications tomitochondrial and viral DNA. Mol. Biol. Evol. 20(8): 1231–1239.
Nunney, L., 2003 The cost of natural selection revisited. Ann.Zool. Fenn. 40: 185–194.
Ohta, T., 1972 Evolutionary rate of cistrons and DNA divergence.J. Mol. Evol. 1: 150–157.
Ohta, T., 1973 Slightly deleterious mutant substitutions in evolu-tion. Nature 246: 96–98.
Ohta, T., 1977 Extension of the neutral mutation drift hypothesis,pp. 148–167 in Molecular Evolution and Polymorphism, editedby M. Kimura. National Institute of Genetics, Mishima, Japan.
Ohta, T., 1987 Very slightly deleterious mutations and the molec-ular clock. J. Mol. Evol. 26: 1–6.
Ohta, T., 1992 The nearly neutral theory of molecular evolution.Annu. Rev. Ecol. Syst. 23: 263–286.
Ohta, T., 1996 The current significance and standing of neutraland nearly neutral theoies. BioEssays 18(8): 673–694.
Ohta, T., 2007 Drift and selection in evolving interacting systems,pp. 285–298 in Structural Approaches to Sequence Evolution,chap. 13, edited by U. Bastolla, M. Porto, H. E. Roman, andM. Vendruscolo. Springer, Berlin/Heidelberg.
Ohta, T., and J. H. Gillespie, 1996 Development of neutral andnearly neutral theories. Theor. Popul. Biol. 49: 128–142.
Ohta, T., and M. Kimura, 1971 On the constancy of the evolution-ary rate of cistrons. J. Mol. Evol. 1: 18–25.
Ohta, T., and H. Tachida, 1990 Theoretical study of near neutral-ity. I. Heterozygosity and rate of mutant substitution. Genetics126: 219–229.
Orr, A. H., 1998 The population genetics of adaptation: the dis-tribution of factors fixed during adaptive evolution. Evolution52(4): 935–949.
Orr, A. H., 1999 The evolutionary genetics of adaptation: a simu-lation study. Genet. Res. Camb. 74: 207–214.
Orr, A. H., 2000 Adaptation and the cost of complexity. Evolution54: 13–20.
Orr, A. H., 2006 The distribution of beneficial fitness effectsamong beneficial mutations in Fisher’s geometric model of ad-aptation. J. Theor. Biol. 238: 279–285.
Orr, A. H., 2010 The population genetics of beneficial Mutations.Phil. Trans. R. Soc. B 365: 1195–1201.
Molecular Evolution and Nearly Neutral Theories 533

Pál, C., B. Papp, and M. J. Lercher, 2006 An integrated view ofprotein evolution. Nat. Rev. Genet. 7: 337–348.
Poon, A., and S. P. Otto, 2000 Compensating for our load ofmutations: freezing the meltdown of small populations. Evolu-tion 54: 1467–1479.
Poon, A., B. H. Davis, and L. Chao, 2005 The coupon collector andthe suppressor mutation: estimating the number of compensa-tory mutations by maximum likelihood. Genetics 170: 1323–1332.
Razeto-Barry, P., and K. Maldonado, 2011 Adaptive cis-regulatorychanges may involve few mutations. Evolution 65(11): 3332–3335.
Razeto-Barry, P., J. Díaz, D. Cotoras, and R. A. Vásquez,2011 Molecular evolution, mutation size and gene pleiotropy:a geometric reexamination. Genetics 187(3): 877–885.
Sanjuán, R., A. Moya, and S. F. Elena, 2004 The distribution offitness effects caused by single-nucleotide substitutions in anRNA virus. Proc. Natl. Acad. Sci. USA 101: 8396–8401.
Sella, G., 2009 An exact steady-state solution of Fisher’s geomet-ric model and other models. Theor. Popul. Biol. 75: 30–34.
Sella, G., and A. E. Hirsh, 2005 The application of statistical phys-ics to evolutionary biology. Proc. Natl. Acad. Sci. USA 102(27):9541–9546.
Silander, O. K., O. Tenaillon, and L. Chao, 2007 Understandingthe evolutionary fate of finite populations: the dynamics of mu-tational effects. PLoS Biol. 5(4): e94.
Su, Z., Y. Zeng, and X. Gu. 2010 A preliminary analysis of genepleiotropy estimated from protein sequences. J. Exp. Zool.314B: 115–122.
Tachida, H., 1991 A study on a nearly neutral mutation model infinite populations. Genetics 128: 183–192.
Tachida, H., 1996 Effects of the shape of distribution of mutanteffect in nearly neutral mutation models. J. Genet. 75(1): 33–48.
Tachida, H., 2000 Molecular evolution in a multisite nearly neu-tral mutation model. J. Mol. Evol. 50: 69–81.
Takahata, N., K. Ishii, and H. Matsuda, 1975 Effect of temporalfluctuation of selection coefficient on gene frequency in a popu-lation. Proc. Natl. Acad. Sci. USA 72: 4541–4545.
Tenaillon, O., O. K. Silander, J. P. Uzan, and L. Chao,2007 Quantifying organismal complexity using a populationgenetic approach. PLoS ONE 2: e217.
Welch, J. J., and D. Waxman, 2003 Modularity and the cost ofcomplexity. Evolution 57(8): 1723–1734.
Whitlock, M. C., 2000 Fixation of new alleles and the extinctionof small populations: drift load, beneficial alleles, and sexualselection. Evolution 54: 1855–1861.
Whitlock, M. C., C. K. Grisworld, and A. D. Peters,2003 Compensating for the meltdown: the critical effectivesize of a population with deleterious and compensatory muta-tions. Ann. Zool. Fenn. 40: 169–183.
Communicating editor: L. M. Wahl
534 P. Razeto-Barry et al.