the need for effective ecdis display management...the implication of getting ecdis display settings...
TRANSCRIPT

Capt Zakirul Bhuiyan MSc, PGCE, FNI, AFRIN
Senior Lecturer
Warsash Maritime Academy
Digital Hydrography on the Maritime Web - Embracing the challenges and opportunities
29-30 October 2013, Southampton
The need for effective ECDIS display management

WYSIWYG
What You See Is What You Get
The appearance and content of the chart
data displayed on ECDIS may change
significantly from different settings

Scanned Copy
of Paper Chart
BA2037

Base Display
Minimum set of information which must always be
displayed and cannot be removed
May be helpful for initial appraisal in the planning
stage and moving the chart display to allow a
faster re-generation of the display.
Base Display cannot be used for navigation
Display Settings on ENC
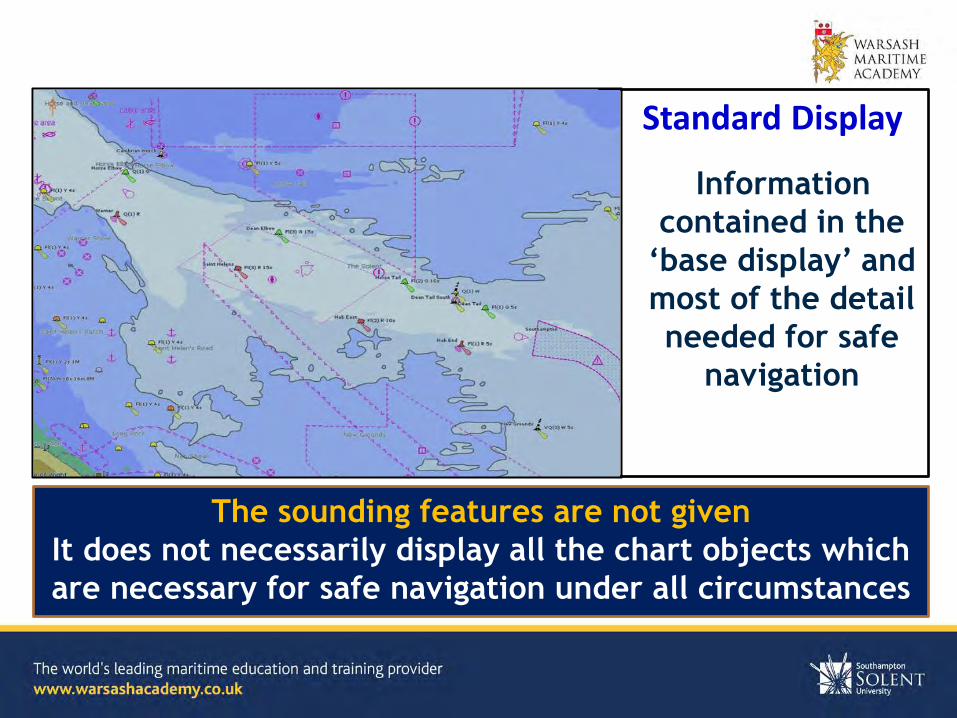
Standard Display
Information
contained in the
‘base display’ and
most of the detail
needed for safe
navigation
The sounding features are not given
It does not necessarily display all the chart objects which
are necessary for safe navigation under all circumstances

All Other Information
It is to be
displayed
individually
on demand
Need to understand the requirement of layer selection
‘Displaying everything, without seamanlike
consideration, should not be an option’

Compilation Scale

Under-scale and Over-scale

SCAMIN
Scale Minimum
Reduces clutter when zoomed out Safety critical information may be removed

Scamin attributes available

1:22 000
1:15 000
What is the difference?
Scamin Filter applied
Scamin Filter applied
So, Always check plans at Compilation Scale before
use

Safety Settings
Shallow Contour highlights the
gradient of the seabed
Deep Contour
indicates the
area where
own ship may
experience
Squat
Safety Contour marks the boundary between safe and unsafe water
Safety depth affects the display of soundings. Here 7m
or less appear in black
7

Dredged area less than safety contour value
Dredged to 9.5m

Dredged area less than safety contour

The depth contours may differ between electronic charts produced by different hydrographic offices.
10.9 m
5.4 m
18.2 m
Example: US Charts

Safety Contour 10m No apparent danger
Failure to manage display layers has resulted in grounding incidents in recent years
Pride of Canterbury
7.8

Isolated danger displayed when Safety Contour is changed to 5m
Pride of Canterbury

Pride of Canterbury
When ‘All Other Information’ Display is used
1.8 m

Accuracy & Reliability
Paper Charts – Source Diagram
Electronic Nav Charts – Catzoc

Catzoc (Zone of Confidence)
A1 area: Very high accuracy survey by British Govt
B area: medium accuracy survey by ABP

‘Pick Report’ is too complex and sometimes difficult to
find out the right information from a chart
‘Pick Report’ function


Mariners are warned that positions showed from Global navigation Satellite Systems, such as GPS,
may be more accurate than the charted detail, due to the age and quality of some of the source
Information. Mariners are therefore advised to exercise particular caution when navigating close
to the shore or in the vicinity of dangers.

Land Features
Fortified Structure Object name:
Horse Sand Fort

A
Virtual
AtoN,
making
Safe
Water

ENC Symbols
The same symbol is being used for the danger and non-danger !!
Magnetic Variation

Where is the Neap Rate?
Tidal
Diamond
Paper Chart

Time varying Objects
Special buoys are only
shown during March to
October
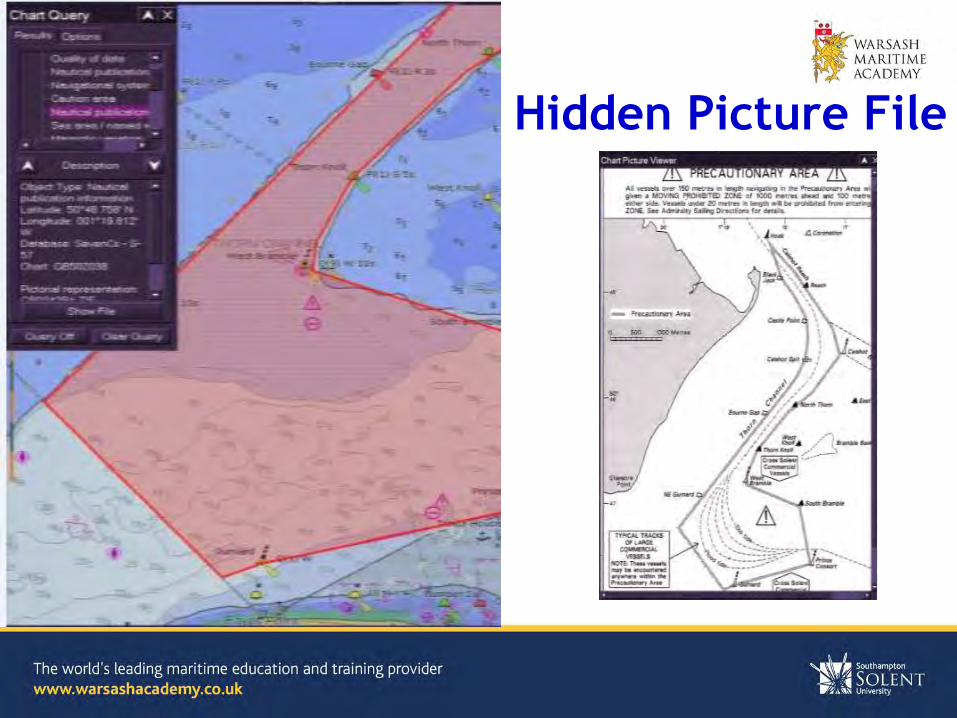
Hidden Picture File

An understanding of the basics, which may not appear on an ECDIS display monitor.
A navigator must cross the TSS on a heading at
right angles to the general direction of traffic flow and he
needs to appreciate the vessel will be set away from the ship’s heading and thus the predicted ground track needs to be on ECDIS, allowing
for set and drift
Ground Track 148 deg
Course to Steer 135 deg
Set: SW’ly Rate: 3.2 Kts
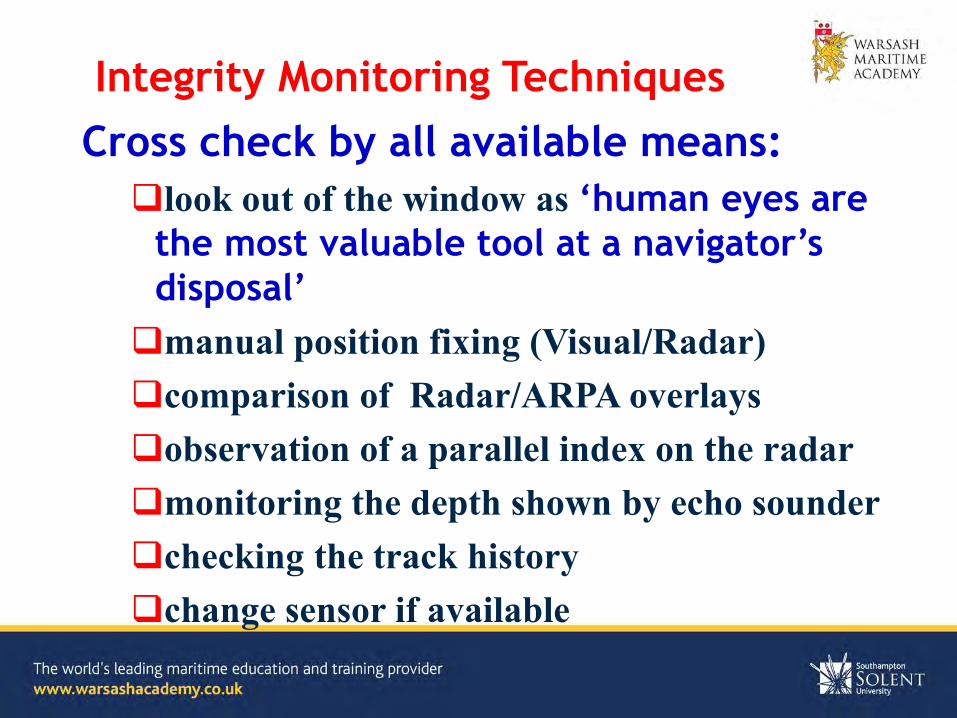
Integrity Monitoring Techniques
Cross check by all available means:
look out of the window as ‘human eyes are
the most valuable tool at a navigator’s
disposal’
manual position fixing (Visual/Radar) comparison of Radar/ARPA overlays observation of a parallel index on the radar monitoring the depth shown by echo sounder checking the track history change sensor if available

No Error

GPS Error

Gyro Error
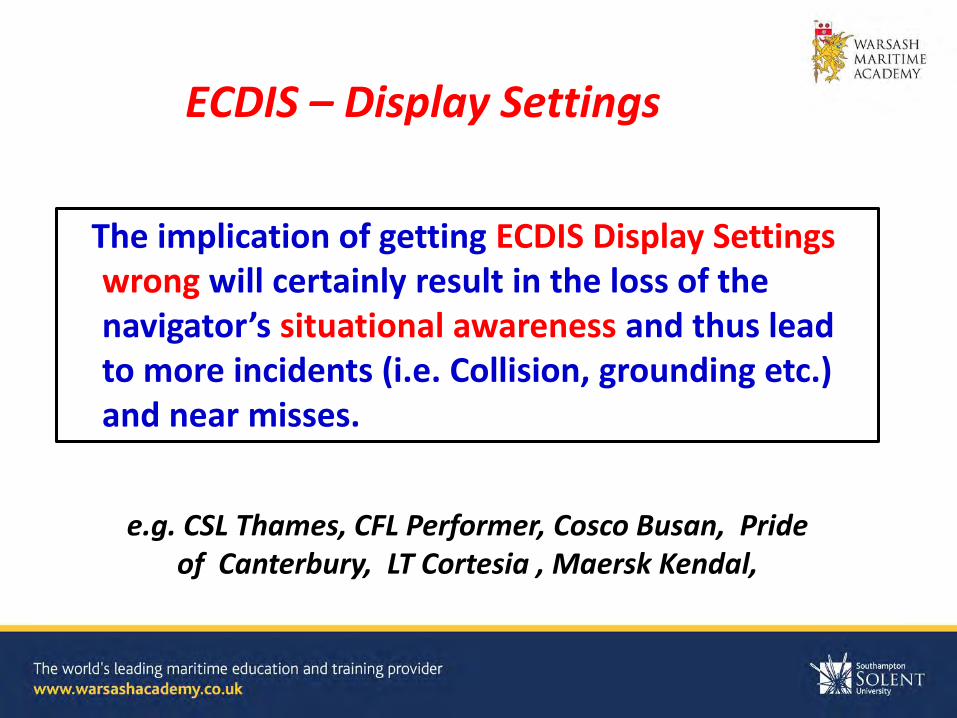
The implication of getting ECDIS Display Settings wrong will certainly result in the loss of the navigator’s situational awareness and thus lead to more incidents (i.e. Collision, grounding etc.) and near misses.
ECDIS – Display Settings
e.g. CSL Thames, CFL Performer, Cosco Busan, Pride of Canterbury, LT Cortesia , Maersk Kendal,

THANK YOU
Any Questions ?