the new earth observation: the added value for smart cities urban areas – an environmental...
TRANSCRIPT
The new Earth Observation: the added value for Smart Cities
Urban Areas – An Environmental Challenge for Earth Observation
Barcelona
13-15 November 2012www.smartcityexpo.com

Some Alternative Future Observations of the Earth from Space at Night
THE DARK SIDE OF THE EARTH
Dr. Paul C. SuttonBarbara Hardy Institute & School of Natural and Built EnvironmentsUniversity of South AustraliaAdelaide, SA Australia

The Dark Side of the Earth 10,000 years ago.Human Population roughly 7 MILLION.
The Dark Side of the Earth Today.Human Population roughly 7 BILLION.
?10,000 years
From now
How Dark will it be?

“Dark Side of the Earth” Observations in 10,000 years:
1) Totally Dark
a) Nuclear Warb) Ecological Collapse of Homo Sapiensc) ? – There are MANY paths that are not sustainable……
2) Bright Spots in Patches
a) Dead Zones (e.g. the movies ‘Children of Men’ & ‘Total Recall II’)b) Some smart cities and some dumb cities?
3) Similar to today with perhaps reduced brightness levels
a) Hopefully because we found a path to sustainability that included ‘Smart Cities’ for everyone.
Note: It is very unlikely there will be 7 Trillion people on the earth 10,000 years from now.
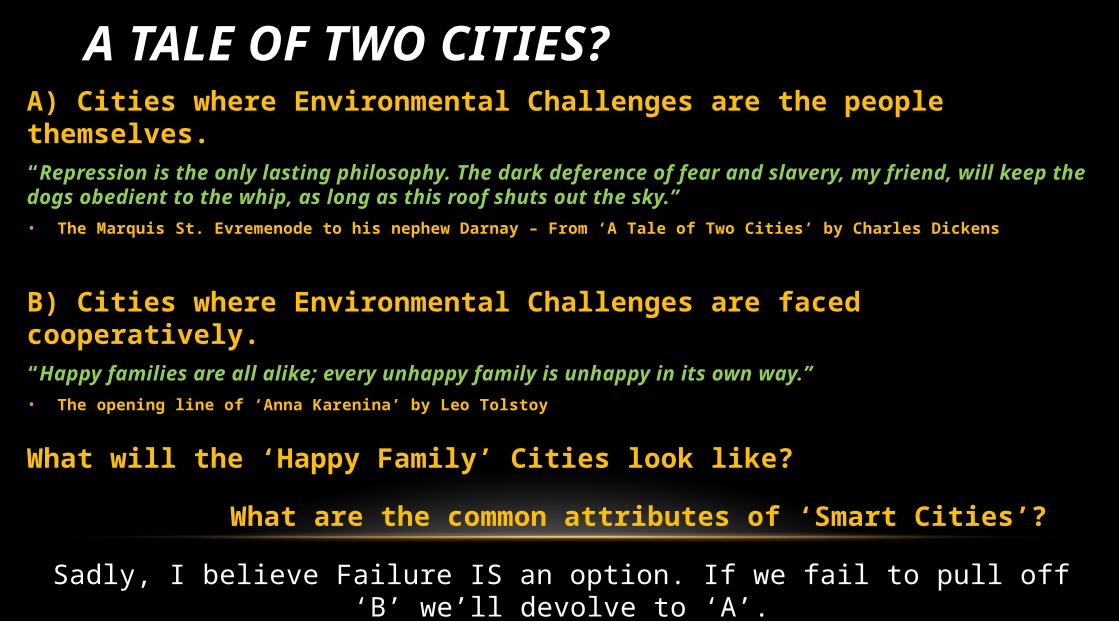
A TALE OF TWO CITIES?A) Cities where Environmental Challenges are the people themselves.“Repression is the only lasting philosophy. The dark deference of fear and slavery, my friend, will keep the dogs obedient to the whip, as long as this roof shuts out the sky.”
• The Marquis St. Evremenode to his nephew Darnay – From ‘A Tale of Two Cities’ by Charles Dickens
B) Cities where Environmental Challenges are faced cooperatively. “Happy families are all alike; every unhappy family is unhappy in its own way.”
• The opening line of ‘Anna Karenina’ by Leo Tolstoy
What will the ‘Happy Family’ Cities look like?
What are the common attributes of ‘Smart Cities’?
Sadly, I believe Failure IS an option. If we fail to pull off ‘B’ we’ll devolve to ‘A’.

WHAT WILL URBAN SPATIAL DATA LOOK LIKE IN 10 YEARS?
Imagery with high spatial &/or spectral &/or temporal resolution, LIDAR derived 3-D representations, Metered Information,Volunteered Geographic Information, Architectural Drawings, Census Data, Transportation Networks, Surveillance cameras,Internet activity and traffic, cell phone data, and much much more .. .. …
Held by who? Used for what? At what cost of acquisition? At what cost of Analysis?
(image from http://www.geodesignsummit.com/ )
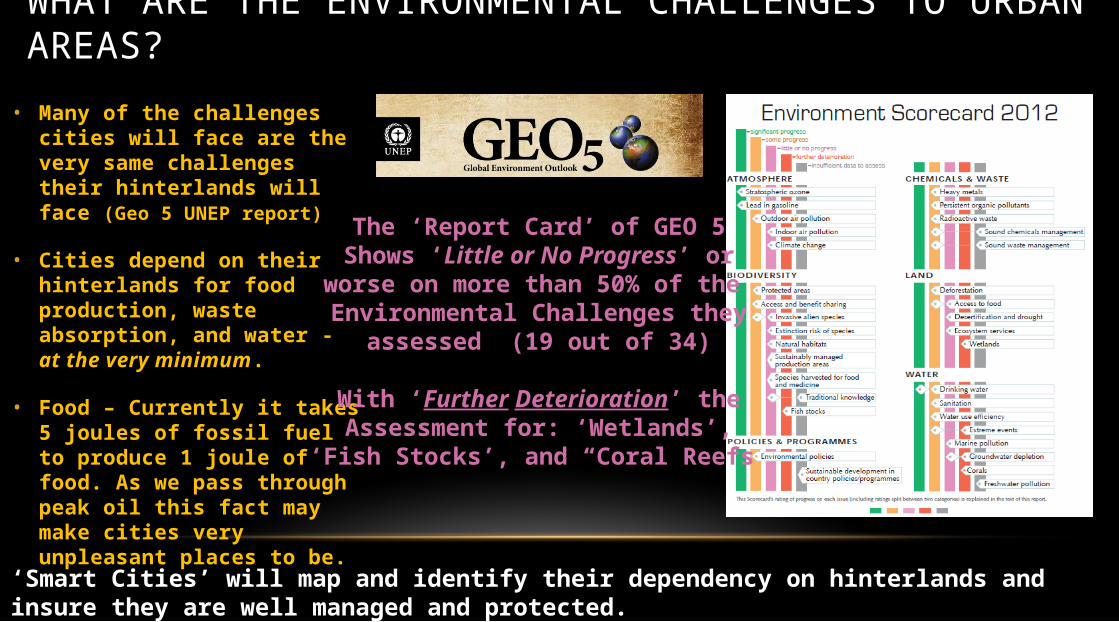
WHAT ARE THE ENVIRONMENTAL CHALLENGES TO URBAN AREAS?
• Many of the challenges cities will face are the very same challenges their hinterlands will face (Geo 5 UNEP report)
• Cities depend on their hinterlands for food production, waste absorption, and water - at the very minimum.
• Food – Currently it takes 5 joules of fossil fuel to produce 1 joule of food. As we pass through peak oil this fact may make cities very unpleasant places to be.
The ‘Report Card’ of GEO 5Shows ‘Little or No Progress’ orworse on more than 50% of the Environmental Challenges they
assessed (19 out of 34)
With ‘Further Deterioration’ theAssessment for: ‘Wetlands’,
‘Fish Stocks’, and “Coral Reefs’
‘Smart Cities’ will map and identify their dependency on hinterlands and insure they are well managed and protected.

REMOTE SENSING OF CITIES – CURRENT QUESTIONS• What is the feedback between urban and environmental systems as the world urbanizes?
• Climate scientists, energy analysts, urban planners, ecologists
• Development of an understanding of an ‘Urban Metabolism’ akin to our understanding of the metabolism of the human body. How do we measure the ‘Health’ of a city?
• What are the measurable analogs of temp, blood pressure, blood sugar, heart rate etc.?
• Energy Flows, Water Flows, Food Flows, Waste Flows, Income Flows, etc.?
• Natural and Human-made Hazards – Planning and Response
• Planning & Design of the built environment for efficiency of all metabolism metrics
• Dynamic capability for assessment and response to fast changes (e.g. earthquakes, heat waves, floods, etc.)
• Monitoring and Enforcement
• “Mutual Coercion Mutually Agreed Upon” – Garrett Hardin
Soe Myint et al. (In Review at Remote Sensing of Environment) Remote Sensing of Urban Areas: State of the Art and Gaps in Knowledge
Kennedy, C.; Pincetl, S.; Bunje, P. (2012) The study of urban metabolism and its applications to urban planning and design Environmental Pollution Volume 167 pp 184-185
Figure below from (Duvigneaud and Denayeyer-De Smet, 1977)

URBAN ECOSYSTEM SERVICES• We already know that there are many ecosystem services
provided in urban environments that are classic market failures in that they are often: 1) Public Goods, 2) Common Property, 3) Are subject to both positive and negative externalities, and 4) Have difficult issues with respect to Property Rights.
• The City of Barcelona recognizes the existence of numerous urban ecosystem services now. See their web site to the right.
• Some well established urban ecosystem services are: Air Filtering, Micro-Climate Regulation, Noise reduction, Rainwater drainage, Sewage treatment, Recreational values.
• Free markets tend to not account for these services and they are often degraded as a result (For example: a 10% increase in tree cover could reduce total energy for heating and cooling by $50-90 per dwelling unit per year).
http://www.bcn.cat/en/ihome.htm
Bolund, Per; Hunhammar, Sven (1999) Ecosystem Services in Urban Areas Ecological Economics 29 pp 293-301
Green Building Design will move from a luxury we cannot afford to a requirement we cannot avoid.

NIGHTTIME IMAGERY OF THE EARTHObservations of the earth from space at night are compelling.
Night-time imagery has been used to make proxy measures of:
1) Population and population density
2) Human settlements and urban & exurban areas
3) Formal and informal economic activity
4) Energy consumption and CO2 emissions
5) Human appropriation of NPP
6) Gas Flaring and Lantern Fishing
7) Ecological Footprints
Despite the demonstrated potential that nocturnal observations of the earth have for making proxy measures of numerous anthropogenic impacts - Very few satellite observation platforms are designed for, or capable of, making nighttime observations of the earth
Paris – ‘The city of light’ at twilight
Proxy measures of these kinds of human activities may be of increasing utility in a world of decreasing resources.Particularly as institutions weaken and public support for things like the American Community Survey wanes.

LIGHT POLLUTION IN URBAN AREASDespite the many useful proxy measures that can be made with nocturnal images of urban areas at night – Light Pollution is a serious problem…
1) Nighttime imagery has detrimental effects on wildlife
2) Light Pollution has negative health impacts (e.g. lower immunity, higher cancer)
3) Light pollution inhibits the breakdown of some toxic chemicals in smog
4) More than half the world’s children have never seen the Milky Way
https://sites.google.com/site/skywalkdownunder/home/adelaide-light-pollution
“Smart Cities” will improve human health, reduce carbon footprints, and save wildlife by sending less light into space
Smart -><- Not Smart

LIVING IN THE SOLUTION• We will not talk about what ‘Dumb Cities’ will do.
• We have enough examples already.
• How will ‘Smart Cities’ behave in order to be around 10,000 years from now?
• Stabilize their populations
• Design and sustain a steady state economy focused on improving human well-being rather than increasing flows of matter and energy.
• Provide transportation, food, energy, and water to their population sustainably.
• Identify, monitor, and leverage ecosystem services to improve well being.
• Consist of active and engaged citizens who balance cooperation, competition, charity, and mutual coercion to achieve collective goals.
• Smart Cities will have to become big ‘Happy Families’ with resource limitations, competing interests, and all the other challenges we are all too familiar with. It is likely these challenges will scale non-linearly with population size.

CONCLUSION
1) Support Proxy measures of myriad phenomena via integration of diverse sources of information
- Cell phone data, VGI, nighttime imagery, LIDAR, hyperspectral imagery
2) Establish and Continuously Measure “Urban Metabolism”
- Energy Flows, Water Flows, Food Flows, Waste Flows, People Flows, temperature, air quality
3) Map and monitor urban hinterlands and identify & characterize dependencies
- Wetlands, agricultural lands, watersheds, etc.
4) Disaster and Hazard Planning and Response
- Built environment planning, damage assessment, early warning systems, smart traffic
5) Monitoring and Enforcement
- e.g. Foreground – background hyperspectral imagery of atmosphere for pollution monitoring
How will imagery support the establishment and maintenance of “Smart Cities”?