the new england experiment: an evaluation of the wholesale
TRANSCRIPT

The New England Experiment: An Evaluation of the Wholesale Electricity Markets
Prepared by: Paul Peterson, David White, Bruce Biewald, and Cliff Chen
Synapse Energy Economics 22 Pearl Street, Cambridge, MA 02139 www.synapse-energy.com 617-661-3248
Provided to: Connecticut Office of Consumer Counsel, Maine Office of the Public Advocate, and New Hampshire Office of Consumer Advocate
June 2003

Synapse Energy Economics
Synapse Energy Economics, Inc. provides research, testimony, reports and regulatory support to consumer advocates, environmental organizations, regulatory commissions, state energy offices, and others. The company was founded in May 1996 to specialize in consulting on electric industry restructuring issues.
We assess the many public policy implications of electricity industry planning, regulation and restructuring, with an emphasis on consumer and environmental protection. Our work covers various inter-related issues pertaining to restructuring, such as market power, stranded costs, performance-based ratemaking, reliability, mergers and acquisitions, divestiture plans, energy efficiency, renewable resources, consumer aggregation, power plant economics, environmental disclosure, and regulation of distribution companies. Our research frequently incorporates economic analyses and computer modeling of electricity generation facilities.
We work for a wide range of clients throughout the US, including Attorneys General, Offices of Consumer Advocates, Public Utility Commissions and their staff, a variety of environmental groups, foundations, the Environmental Protection Agency, the Department of Energy, the Department of Justice, the Federal Trade Commission, the National Association of Regulatory Utility Commissioners, and others.
Additional information about Synapse Energy Economics, its qualifications, staff, clients, projects and reports are available on-line at www.synapse-energy.com.
The Synapse staff members who participated in this evaluation were Paul Peterson, David White, Bruce Biewald, and Cliff Chen.
Note: Although this evaluation was prepared for Synapse’s clients, the comments and conclusions are not necessarily those of the Connecticut Office of Consumer Counsel, the Maine Office of the Public Advocate, or the New Hampshire Office of Consumer Advocate.

Table of Contents
Summary of Conclusions .................................................................................................. 1
A. Introduction................................................................................................................. 2 Overview .................................................................................................................. 2
Background .............................................................................................................. 4
B. Markets, Reliability, Supply Offers, and Loads ....................................................... 7 1. Markets and Reliability........................................................................................ 7
2. ECPs and $1000 Supply Offers........................................................................... 8
3. Annual Loads .................................................................................................... 10
C. Pricing Capacity Resources...................................................................................... 13
1. Peaking unit production costs ............................................................................ 13 2. DCAs, Proxy CTs, and PUSH Reference Levels: A case study....................... 15
3. Market Impacts................................................................................................... 17
D. Policy issues................................................................................................................ 19 Future Market Changes .......................................................................................... 20
References........................................................................................................................ 22

Synapse Energy Economics – Report on NE Electricity Markets Page 1
Summary of Conclusions
The New England wholesale electricity markets are at a crossroads. Even with the implementation of New England Standard Market Design and after four years of bid-based market experience, fundamental issues of market design and price signals remain unresolved. While New England’s wholesale markets do not appear to be susceptible to the catastrophic failure that occurred in the California wholesale markets, there are serious concerns about the overall efficiency and fairness of the current price-setting market mechanisms. This report reaches the following conclusions.
1. New England stakeholders need assurances that new structures, such as RTO status for ISO New England and a Transmission Owners’ Agreement with the new RTO, will provide for adequate accountability to regional interests (see page 2).
2. FERC’s $1,000 cap on supply offers is an arbitrary value that greatly exceeds the marginal production costs of energy from generation units (see pages 10 & 13).
3. Due to the lack of properly designed reserve and capacity markets, the New England wholesale energy market is being over-burdened with the recovery of fixed costs of generation units (see pages 12 & 15).
4. An energy market that provides capacity compensation for peaking units will over-compensate non-peaking units (see pages 14-15).
5. FERC’s Order requiring market rule changes to allow Peaking Unit Safe Harbor Reference Levels to set energy market clearing prices is unlikely to provide price signals that will stimulate new investment and could significantly increase overall costs to consumers (see pages 17-19).
6. As demonstrated by the case study on proxy pricing for peaking units, poor communication between FERC and ISO New England may be an obstacle to market improvements (see pages 19-20).

Synapse Energy Economics – Report on NE Electricity Markets Page 2
A. Introduction
There are currently extensive discussions among New England stakeholders over the structural evolution of ISO-NE and the bulk power transmission system. There is a schedule for an October filing by ISO-NE and the New England transmission owners to establish a more permanent organizational structure for New England, including the possibility of the ISO achieving RTO status and the transmission owners entering into a formal agreement for the management of their transmission assets by the ISO/RTO and the possible creation of an Independent Transmission Company (ITC).
One of the most controversial aspects of this evolving structure is who has the initial obligation to evaluate and propose changes to the existing wholesale market structure and set the terms and conditions of the regional transmission tariff. It is an important component of how the RTO will be accountable to a wide range of sometimes diverse and opposing regional interests. Other accountability mechanisms such as the selection of RTO Board members, the process for reviewing market rule changes, the need for a periodic outside and independent review of the New England markets and RTO procedures, and the overall public interest mission of the RTO are also being intensely scrutinized.
To date, ISO New England has demanded that it have complete independence from regional interests. The ISO also seeks virtual unilateral authority (subject only to complaints at FERC) to develop and implement market design structures and market rules, and then select the market monitoring entity that will evaluate the appropriateness and effectiveness of those market designs and rules.
As these structural issues are debated, recent experience with the development of market designs and market rules suggest that a broad and diverse group of interests must be represented in the process. Neither the FERC, nor the ISO, nor NEPOOL, by itself, can adequately analyze and review the multitude of impacts that even small changes to the rules and market structures can cause. A series of checks and balances on the authority of all stakeholders seems the most appropriate model. While this may not be the fastest way to implement market changes, it significantly increases the likelihood that market changes will result in net improvements to the markets that will accommodate the wide diversity of interests of New England stakeholders and achieve a public benefit for all.
Overview
Are the wholesale electricity markets “workably competitive” as claimed by ISO New England?1 And what does or should “workably competitive” mean? These are two over-arching questions that this paper will address through an examination of current policies.
1 ISO-NE often states that the New England wholesale markets are “workably competitive”; most recently
in a FERC filing made on May 16th. We are not aware of any particular definition that this phrase references.

Synapse Energy Economics – Report on NE Electricity Markets Page 3
After a brief review of the structure and history of the New England markets this paper examines two aspects of the current market design. The first describes the inter-relationship between ISO-NE’s two primary goals of (1) ensuring the reliable delivery of electricity and (2) maintaining a competitive and efficient wholesale market for electricity. It describes the current pricing system in the energy market, including the $1000 cap on supply offers from owners of generation. This section concludes with an analysis of annual loads.
The paper next reviews various options for pricing capacity resources and a case study of the ISO’s recent efforts to establish effective price signals in congested areas through the development of a proxy peaking unit pricing system. The ISO’s efforts were recently superceded by FERC’s requirement to establish unit-specific Peaking Unit Safe Harbor Reference Level prices. This paper concludes with a brief review of some future market design initiatives.
One of the recurring themes throughout this paper is the description of why electric markets demonstrate extreme volatility the benefits and dangers of that volatility. The most common explanations for electric market volatility are that electricity is a unique product/commodity that is normally consumed at the same moment that it is produced; it cannot be stored; it has no substitutes; demand is inelastic; and it faces capital cost and permitting barriers. While it is generally true that electric supply and electric demand are balanced minute to minute, there are ways to store electricity (batteries and pumped water storage), there are substitutes (gas and oil in certain situations), demand can show elasticity (through demand response programs), and capital costs and permitting barriers for distributed generation and demand response are actually quite low. A good analogy for understanding the volatility of electric prices is through another commonly available, large volume product: hot coffee. Like electricity, it is produced to be quickly consumed; it is not easy to store; it has few substitutes; demand is relatively inelastic; and capital costs are high relative to the marginal production cost.
Nonetheless, the volatility in hot coffee prices, like any other large-volume product/commodity, does not remotely approach electricity volatility. Wholesale electricity prices regularly vary (depending on location and time of day) from between $10/MWh and $100/ MWh, a variation of 1,000 percent. At times, wholesale prices reach levels of $1,000/MWh, a 10,000 percent increase. A cup of hot coffee (retail) can vary from $1 to $10 depending on location and time (consider a small-town diner and a big-city five-star restaurant). But does anyone pay $100 for a cup of coffee? And more to the point, can you imagine a requirement that if one cup of hot coffee was sold for $100 that all cups of hot coffee would be priced at $100 for that hour? Yet, that is the current pricing system in the three bid-based markets in the Northeast.2
The analogy between electricity prices and coffee prices fails in one critical respect: hot coffee prices are known before consumption, while wholesale electricity prices usually are not. Any effort to price hot coffee at $100 per cup would probably fail because demand would suddenly become very elastic. This is probably why successful demand 2 ISO New England, New York ISO, and PJM Interconnection are the three Northeast bid-based markets
under FERC oversight.
Synapse Energy Economics – Report on NE Electricity Markets Page 4
response programs being implemented in wholesale markets rely on revealing and paying high spot market electricity prices to demand response program participants in hopes of encouraging demand elasticity.
Background
Bid-based wholesale markets were inaugurated in New England on May 1, 1999. As initially designed, there were seven markets: an energy market, three reserve markets, an automatic generation control market, an hourly operable capacity market, and a monthly capacity reserve market. An independent analysis of the proposed markets, done in the summer of 1998, identified numerous flaws and concerns.3 Some temporary fixes were proposed, but the most significant recommendations were to develop both a congestion management system and a multi-settlement system as quickly as possible. FERC’s Order that approved the implementation of the bid-based markets made those recommendations a requirement.4
During the first three years of operation, substantial and significant changes occurred. Over the first summer, the hourly operable capacity market was eliminated due to structural problems that led to a non-competitive market and manipulative bidding. The reserve markets were modified to allow units that were held out of the market for reliability concerns to receive an energy uplift payment. In the fall, reserve prices were capped so that they could not exceed the energy clearing price. Throughout the first six months of market operations, ISO administered hundreds of price corrections to address technical errors and design flaws in the energy and reserve markets.
In the winter of 2000, ISO-NE determined that supply offers in the monthly capacity reserve market represented an attempt to manipulate that market, and ISO-NE mitigated the bids. In the spring, the ISO filed with FERC to abolish the monthly capacity market. FERC eliminated the auction portion of that market effective August 1, 2000, but continued the requirement to purchase monthly capacity through bilateral contracts and imposed an ISO administered deficiency assessment at the end of each month. The monthly capacity market (ICAP) continues to be an unresolved market design issue despite almost three years of efforts to develop an effective, efficient, and competitive market design.
On May 8, 2000, a supply offer from an external energy transaction from New York set the clearing price in the energy market for four hours at $6,000 MWh (the equivalent of a $600 cup of coffee!). The wholesale costs for energy increased by approximately $80 million over that four-hour period. Although it was later determined that a benchmark price that had been used to evaluate the $6,000 supply offer had been improperly calculated by the NY ISO market software system, the market rules in effect in New
3 Cramton and Wilson, “A Review of ISO-NE’s Proposed Market Rules” (September 9, 1998). 4 85 FERC 61,379 (December 17, 1998).

Synapse Energy Economics – Report on NE Electricity Markets Page 5
England did not provide an opportunity to revise the energy clearing price to reflect the true cost of the supply offer.5
In the summer of 2000, FERC imposed a temporary cap on supply offers in the energy market of $1,000. This temporary cap later became permanent and is also a feature of the market rules in the New York and PJM control areas. FERC has never specified why the $1,000 supply offer cap is the appropriate level to ensure just and reasonable rates in control areas where it has granted market-based rate authority. When FERC initially imposed the $1,000 cap, it merely referenced the existence of such a cap in PJM since 1997.6
During 2001 and 2002, numerous modifications were made to the New England wholesale markets in an attempt to improve their competitiveness and efficiency. Chief among these were electronic dispatch, three-part bidding, the ability to include external (outside of the New England control area) transactions in the wholesale energy market, revisions to the market monitoring and mitigation, and refinements to eligibility rules to set the ECP during times of peak loads. All of these modifications occurred against a background of a comprehensive revision of the entire wholesale market structure to provide for implementation of multi-settlement and congestion management systems (New England standard market design, or NE-SMD).
On March 1, 2003, NE-SMD was implemented. Its key features include a day-ahead financially binding energy market for supply offers and load bids, a real-time spot energy market to account for any variations from the day-ahead commitment, a locational marginal price energy market system that features eight separate load zones with distinct zonal energy rates, and a congestion hedging mechanism that utilizes tradeable financial transmission rights (FTRs). There are no formal markets for reserves7, but a co-optimized reserve market is being developed for implementation in late 2004 or early 2005. There is a generation control market (AGC) and the existing ICAP market has been retained. 8 In a recent Order, FERC directed ISO-NE to develop and file a revised ICAP market by March 1, 2004.9
In addition, regional stakeholders10 have been involved in a series of collaborative discussions to:
• develop a New England RTO filing in response to FERC Order 2000 (January 2000 – January 2001);
5 ISO New England May 8th reports. 6 92 FERC 61,065 (July 26, 2000). 7 There is an uplift payment that is made to entities providing operating reserves. 8 Market Rule 1, July 15, 2002. 9 103 FERC 61,082 (April 25, 2003). 10 The term “regional stakeholders” is intended as a broad term that includes ISO-NE, NEPOOL
Participants, state regulatory agencies, and other interested entities.

Synapse Energy Economics – Report on NE Electricity Markets Page 6
• develop a Northeast RTO (NE, NY, & PJM) in response to a FERC Order in July, 2001 (July – September 2001);
• consider a merger of the NE and NY ISOs pursuant to a joint agreement of the NE and NY ISO Boards (February - November 2002).
Currently, there is a fourth effort along these same lines that is considering a stand-alone RTO-type structure for New England. A FERC filing for such a proposal is being considered for October 2003.

Synapse Energy Economics – Report on NE Electricity Markets Page 7
B. Markets, Reliability, Supply Offers, and Loads
1. Markets and Reliability
The development of bid-based, wholesale electricity markets has presented a dilemma for market designers and policy makers. The goal of creating efficient, competitive market structures must be balanced with the requirement to maintain electric service at all times.11 Due to the real-time nature of electric service and the large disparity in the cost structures of various generating resources, wholesale electricity markets experience enormous price swings between daily peak and non-peak demands, as well as seasonal price volatility usually related to extreme winter or summer weather. Moreover, sudden, unanticipated failures of either generation or transmission facilities can either cause or exacerbate short-term price volatility.
The system operators who monitor and control the minute-by-minute dispatch of the New England bulk power system select units based on the market rules and the real-time power flows over the transmission system. Their overarching objective is to maintain the balance between loads (demand) and generation resources (supply) as part of their overall New England responsibilities to the Eastern interconnection.12 The balancing also requires the maintenance of adequate reserves to meet defined contingency responsibilities; that is, there must be pre-specified amounts of additional generating capacity available within ten minutes and thirty minutes to respond to any sudden disruptions of generation or transmission capabilities. While the system operators normally select generation units based on their bids (lowest bid to highest bid until the load is met), there are numerous circumstances where units are selected outside of their position in the stack of bids to meet either a long-term (usually one day or a series of hours) economic efficiency goal or a short-term (usually a few hours) reliability goal. The market rules anticipate most of these situations and describe the specific parameters by which units are selected “out-of- merit”. The rules also describe the specific compensation that out-of-merit units can receive and, in some circumstances, the compensation that is available to the “in-merit” unit that was not selected.
The system operating rules contain procedures to ensure that electricity is delivered to consumers even during times of scarcity, that is, when existing supplies are not sufficient to meet demand and reserve requirements. The procedures involve a series of steps that allow the system operators to call on certain loads to interrupt or reduce their consumption (based on contractual arrangements or through participation in demand response programs), to request public cooperation in reducing non-essential electricity use, to purchase emergency resources, to reduce system voltage, and to reduce reserve
11 While there have been some suggestions that allowing occasional loss of service might be an appropriate
way to “discipline” the market, the California experience demonstrated that such events are politically unacceptable even if they might be acceptable from the perspective of economic theory.
12 The Eastern interconnection refers to the interconnected utilities of the United States and Canada from the Atlantic coast to the Rocky Mountains.

Synapse Energy Economics – Report on NE Electricity Markets Page 8
requirements for limited periods of time to allow for more energy supply to be available.13
This need to maintain the reliable delivery of electricity at all times and under all conditions creates numerous opportunities for market participants to exercise market power, particularly during times of scarcity. As ISO New England has observed in numerous FERC filings, its markets are not competitive during high peak load periods. Prior to implementing the special procedures of OP 4, the ISO is required by the market rules to accept all supply offers. It is precisely this requirement that essentially forced ISO New England to accept the supply offer of $6,000/MWh in May 2000. Although it appears that the May 2000 event was not an attempt to exercise market power by a market participant, it does reflect the opportunities that arise during periods of scarcity.
One strategy for reducing opportunities to exercise market power during times of scarcity is to provide mechanisms to encourage demand elasticity. If demand is given opportunities to respond to high prices by curtailing consumption, then the interaction of supply and demand under classic economic theory will exert discipline on supply offers: if supply offers rise to extremes, demand will reduce correspondingly so that only “reasonable” supply offers will be in the stack of resources that the ISO dispatches to meet demand.14 The market mechanisms to incorporate demand elasticity are being developed under the general rubric of “demand response programs”. FERC has strongly endorsed the concept of demand response programs and has required system operators, such as ISO –NE, to develop and implement them on a fast track. Unfortunately, many of these programs are still experimental and have only been recently implemented. To date, they have not demonstrated a consistent ability to respond in a timely manner to rapid price increases.
2. ECPs and $1000 Supply Offers One of the key features of all the bid-based market systems that FERC has approved is the use of a single energy clearing price (ECP). The theory that supports this market design element relies on energy offers from generation resources that approximate the marginal cost of the next unit of production (often called the short-run marginal cost or SRMC). This usually is the variable fuel cost to produce the next increment of power, but might also include some marginal operations and maintenance costs (O&M) associated with that additional increment. If all generation suppliers are offering their power at short-run marginal cost, then setting the ECP at the highest of these offers in each hour will ensure that all suppliers are, at a minimum, recovering their marginal production costs. This provides an appropriate price signal of the “price to beat” for a new supplier or a supplier who plans to expand existing production capabilities. Those
13 These procedures are detailed in NEPOOL Operating Procedure 4 (OP 4). 14 This does not mean that wholesale electricity markets will cease to experience volatility. The
“reasonableness” of any supply offer will be determined by the willingness of a consumer (demand) to accept that offer. What it probably means is that supply offers over $200/MWh will seldom be selected (comparable to a $20 cup of coffee).

Synapse Energy Economics – Report on NE Electricity Markets Page 9
suppliers that offer at less than the ECP, but are paid the ECP, will recover something in excess of their short-run marginal costs.15
There are several types of $1,000 supply offers16 in the pre-SMD and current energy markets (disregarding for the moment FERC’s recent requirement to modify the market rules to allow PUSH Reference Level supply offers up to $1,000/MWh). They include:
• Hydro units with pondage submit $1,000 supply offers as a means of ensuring that they are not dispatched during low-demand and low-price hours. Often referred to as “limited energy” units, these hydro facilities, in general, do not have enough water to run 24 hours a day for several days. Some can only produce electricity for a few hours in each day. Their high offers are made for timing purposes to maximize the revenues they receive for the limited energy they can produce.
• Environmentally restricted units often submit $1,000 supply offers because they are limited energy units due to air permit restrictions on the number of hours they can operate and/or the total amount of pollution they can release on an annual basis. These are oil or coal units that are usually older, less efficient units that have been grandfathered under the Clean Air Act. However, there are some newer units that also face operating restrictions.
• Some generation units will offer a “top block” of energy at a very high level because it represents an output level that exceeds the units rated high operating limit (HOL). The owner of the unit does not want to operate at that “excessive” level unless system emergency situations require such operation. In addition, because such high operation levels greatly increase the potential for additional maintenance or repair, the owners want to be compensated at a price that is at or close to $1,000.
• External dispatchable contracts are a particular type of energy resource that are often offered into the energy market at a high level that approaches $1,000. Because most, if not all of these contracts originate in the New York control area, the holders of the contracts have the opportunity to sell the power in New York or in New England. Due to uncertainty as to what the prices in New York might be, the holders want to be assured that they do not offer to sell the contract in New England for less than what they might be able to sell it for in New York.
15 An alternative approach would be to pay each supplier its offer price. Most economists note that this
would create an incentive for the supplier to try and “guess” the ECP in each hour in order to offer as close to that estimated ECP as possible in order to maximize revenues. Such guessing would invariably lead to mistakes, which would mean that in some hours lower cost generation (that offered at a high price) would not be selected to run while higher cost generation that offered at a lower price would. This is inefficient from a societal standpoint. By paying each generation supplier the highest offer in each hour (the hourly ECP), low cost suppliers will offer their power (in theory) at their SRMC.
16 We use the phrase “$1,000 supply offer” to represent high offers in the energy market. In fact, these offers are usually submitted at $999 or $998. Some of these offers may be only $900.

Synapse Energy Economics – Report on NE Electricity Markets Page 10
Therefore, they offer these contracts at or close to the $1,000 offer cap in New England.17
It is somewhat remarkable that none of the $1,000 bids described above reflect the actual production costs of providing energy. The energy limited hydro and environmentally restricted units are using $1,000 bids as a form of economic withholding.18 The units that bid $1,000 for output above their HOL are seeking a risk premium for activities that are probably not in the long-term New England reliability interest and may be hard to justify even for short-term reliability. The external contracts that are offered at $1,000 are reflecting potential “opportunity” costs in the NY market.
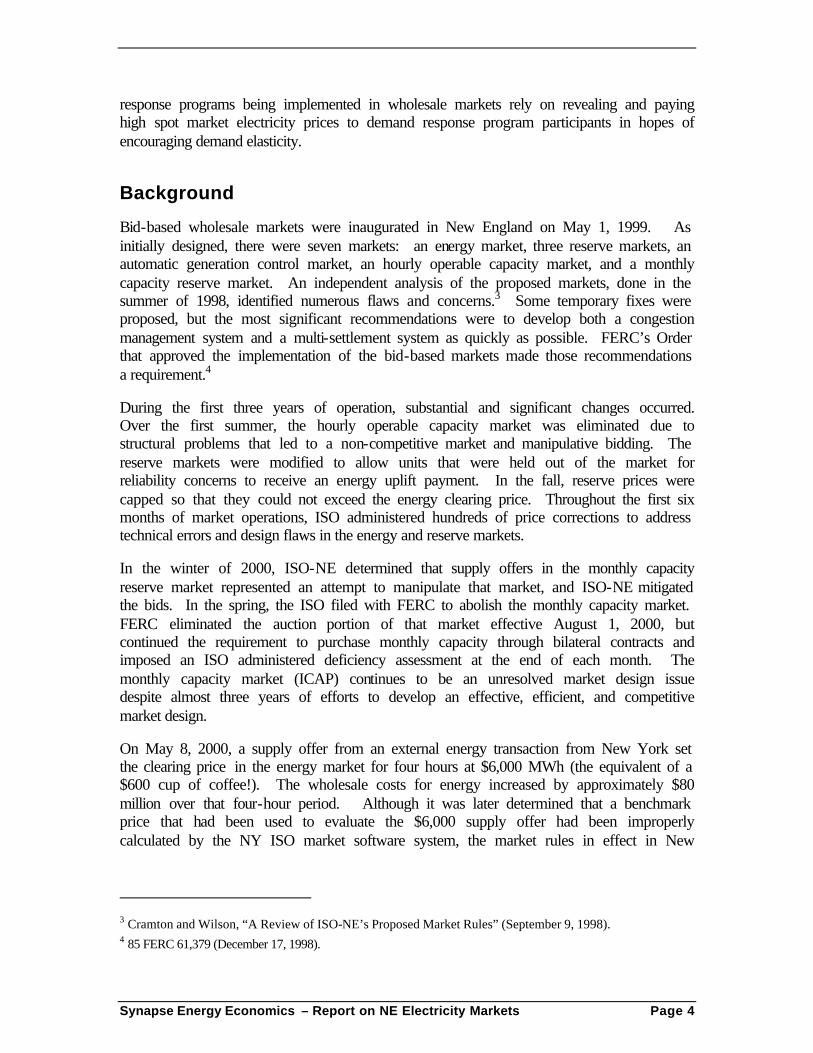
3. Annual Loads New England’s electricity load shows substantial variation over the course of a year (Figures 1 and 2 below). For example, during 2002 the peak load was 25,715 MW with a minimum load of 9,177 MW, for a total range of 16,538 MW. The load distribution is asymmetrical with the high load levels going much further from the average of 14,884 MW than the lowest loads. In Figure 2, which bins the number of hours in various load ranges, this asymmetry is made more obvious as the distribution is greatly extended for the higher load levels.
Figure 1: NE ISO Loads in 2002
NE ISO Load 2002
0
5,000
10,000
15,000
20,000
25,000
30,000
0% 10% 20% 30% 40% 50% 60% 70% 80% 90% 100%
Annual Hours
Ho
url
y L
oad
(M
W)
17 Conversation with ISO-NE Director of Market Monitoring. 18 It is important to emphasize that we are not alleging improper behavior as might be the case when the
phrase “economic withholding” is used. These units are responding in a rational manner to the market system that is in place. The reliability benefits that New England realizes as a result of this behavior are significant.
Synapse Energy Economics – Report on NE Electricity Markets Page 11
Figure 2: NE ISO Hourly Load Distribution
NE ISO 2002 Load Distribution
0
100
200
300
400
500
600
700
800
9,00
0
10,5
00
12,0
00
13,5
00
15,0
00
16,5
00
18,0
00
19,5
00
21,0
00
22,5
00
24,0
00
25,5
00
27,0
00
Load (MW)
Hou
rs
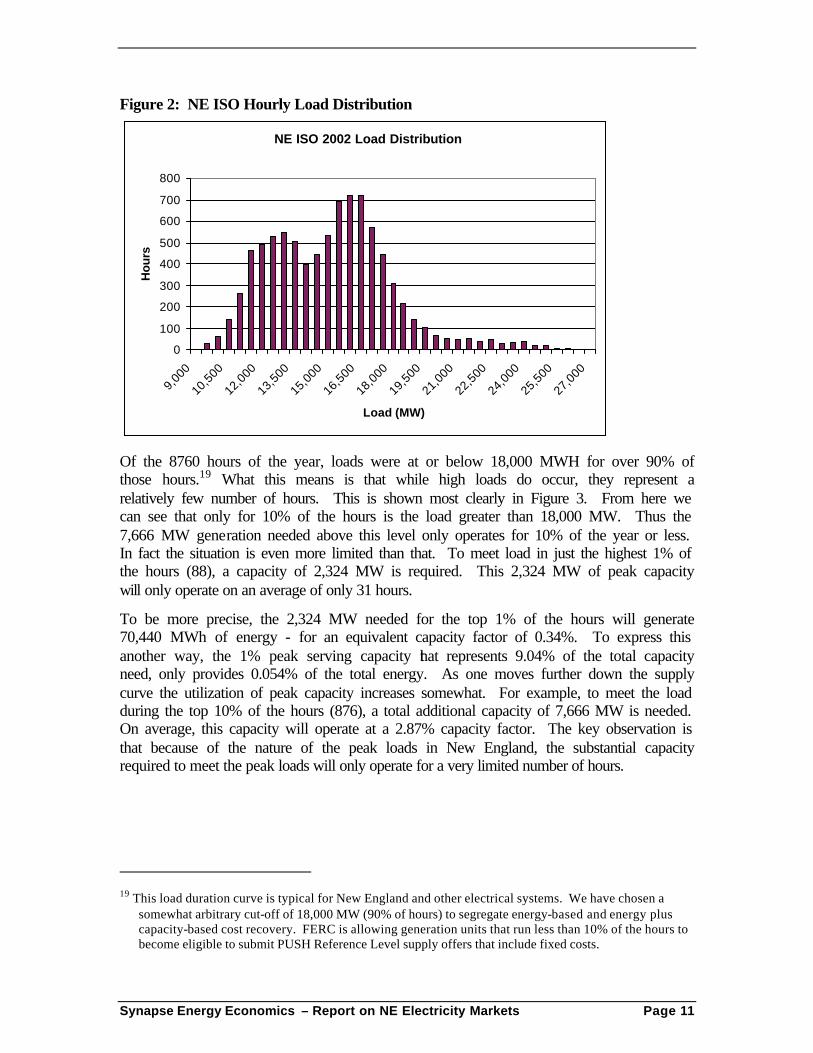
Of the 8760 hours of the year, loads were at or below 18,000 MWH for over 90% of those hours.19 What this means is that while high loads do occur, they represent a relatively few number of hours. This is shown most clearly in Figure 3. From here we can see that only for 10% of the hours is the load greater than 18,000 MW. Thus the 7,666 MW generation needed above this level only operates for 10% of the year or less. In fact the situation is even more limited than that. To meet load in just the highest 1% of the hours (88), a capacity of 2,324 MW is required. This 2,324 MW of peak capacity will only operate on an average of only 31 hours.
To be more precise, the 2,324 MW needed for the top 1% of the hours will generate 70,440 MWh of energy - for an equivalent capacity factor of 0.34%. To express this another way, the 1% peak serving capacity that represents 9.04% of the total capacity need, only provides 0.054% of the total energy. As one moves further down the supply curve the utilization of peak capacity increases somewhat. For example, to meet the load during the top 10% of the hours (876), a total additional capacity of 7,666 MW is needed. On average, this capacity will operate at a 2.87% capacity factor. The key observation is that because of the nature of the peak loads in New England, the substantial capacity required to meet the peak loads will only operate for a very limited number of hours.
19 This load duration curve is typical for New England and other electrical systems. We have chosen a
somewhat arbitrary cut-off of 18,000 MW (90% of hours) to segregate energy-based and energy plus capacity-based cost recovery. FERC is allowing generation units that run less than 10% of the hours to become eligible to submit PUSH Reference Level supply offers that include fixed costs.

Synapse Energy Economics – Report on NE Electricity Markets Page 12
Figure 3: NE ISO Loads – Top 20%
NE ISO Load 2002 - Top 20%
14,000
15,000
16,000
17,000
18,000
19,000
20,000
21,000
22,000
23,000
24,000
25,000
26,000
27,000
0% 2% 4% 6% 8% 10% 12% 14% 16% 18% 20%
Annual Hours
Ho
url
y L
oad
(MW
)
11%
89%
In considering how to pay for this required peak capacity it is useful to compare the relationship between peak capacity and the actual energy it provides. Take for example the top 10% of the hours. The load for the remaining 90% of the hours is at or below 18,048 MW. An additional 7,666 MW of capacity above this is needed to meet the peak load. However this extra capacity will only generate 11% of the total energy required for those top 10% hours. Thus any market mechanism that uses the energy price during those hours to provide adequate compensation for peak capacity costs, will direct 89% of that revenue to non-peak resources.
As discussed in subsequent sections of this white paper, the market design challenge is to devise a compensation mechanism or several mechanisms that can provide adequate compensation to the different types of resources that are needed. One approach that seems to have obvious merit is to segment the recovery of costs associated with different types of resources to separate markets.

Synapse Energy Economics – Report on NE Electricity Markets Page 13
C. Pricing Capacity Resources
1. Peaking unit production costs What then is the cost for peaking capacity and how could appropriate compensation be provided though market mechanisms?
In March 2001, FERC established a proxy peaking unit price as a bid cap for the California markets. It looked at the past operation of actual peaking units in California and made some assumptions about fuel costs and air emissions costs. The value FERC derived was $273/MWH as a proxy market clearing price.20
In a letter to ISO-NE’s Board of Directors in August of 2001, two owners of numerous generation units expressed their concern that the New England market rules, as interpreted by ISO-NE staff, were improperly depressing the ECP during peak load periods. They stated that their peaking units, in order to recover their annual fixed costs in a handful of hours, would typically bid at $300-500 per MWH.21 They further stated that peaking units should be allowed to set the ECP in order to provide appropriate price signals to the market place. Given that these owners may have been overstating their case to a certain extent, the values that they are suggesting are significantly below the $1000 supply offer cap, and remarkably close to FERC’s value of $273/ MWH.
In December of 2001, ISO New England published a study on peaking unit costs that it had commissioned from e-Acumen. Based on the e-Acumen study, a natural gas combustion turbine operating at a 5% capacity factor (438 hours/year) would need an average energy price of over $200 MWh to cover its total costs.22 A unit with a lower capacity factor would require proportionally higher prices.
There are three possible revenue streams to compensate providers of needed new peaking capacity: capacity payments, ancillary services (principally reserves), and energy.
Capacity payments are the most direct approach and have the further benefit of paying only for what is needed. However, once the resource exists it may also qualify for other revenue sources as well, and the capacity payments should not be set so high as to cause over-building.
A resource once in place may also provide ancillary services and receive compensation for them. The specific options depend on how the market is designed and how the system is operated. As mentioned above, New England’s SMD does not include reserve markets at this time.
Energy sales could provide a substantial revenue stream. The key factor here is how many hours during the year does the unit operate and what price does it receive. For a
20 94 FERC 61,245 (March 9, 2001). 21 Letter to ISO Board, August 16, 2001, from Sithe New England and FPL Energy. 22 e-Acumen Final Report, December 10, 2001.

Synapse Energy Economics – Report on NE Electricity Markets Page 14
natural gas CT the variable operating costs are in the range of 40-50 $/MWh. Thus only energy prices above this base level can provide some contribution to fixed costs (including compensation for the capital investment).
In New England in 2002 the average energy price for the top 5% of the hours (438) was about $81 MWh. At this energy price, a generic peaking unit with a 5% capacity factor would receive less than half of its needed total annual revenues ($200 MWh) from the energy market.
The policy question then is whether to provide for the remainder of the levelized cost with some form of capacity payment, or to more than double peak energy prices. Keep in mind that the vast majority of the increased energy revenues will not go to the peaking resources.
The following graph shows the interrelationship between compensation as capacity payments or as energy revenues. As one would expect the higher the level of capacity payments, the lower the level of energy prices that are needed. That is, a resource that receives a $20/kW capacity payment would need an average energy payment of about $300/MWh for 200 hours of operation. A resource that receives a $40/kW capacity payment would need an average energy payment of about $200/MWH for the same 200 hours of operation. A $60/kW payment translates to $100/MWh.
Figure 4: Energy Revenue Requirements for a CT Peaker at Various Capacity Compensation Levels
Peak Capacity Cost Compensation
0
100
200
300
400
500
600
700
800
900
1,000
0 100 200 300 400 500
Hours of Operation per Year
Ene
rgy
Rev
enue
Req
uire
d ($
/MW
h)
$0/kW
$20/kW
$40/kW
$60/kW
Capacity Price

Synapse Energy Economics – Report on NE Electricity Markets Page 15
An interesting observation comes out of this analysis:
No matter what capacity factor level is used to set the revenue prices, that level will over-compensate some peak capacity providers and under-compensate others.
This can be illustrated with an example: Consider that there are a number of similar CT resources available and that capacity compensation is set at $30/kW-year. Then suppose an average CT capacity factor of 3% is used to determine the energy prices for the top 3% of the hours. From our table that would be an average of $235/MWh for the top 263 hours. But not all CT resources will operate at a 3% capacity factor; to match the actual loads, some will run more and some will run less. Consider a CT unit with a 5% capacity factor. That unit will be fully compensated for its fixed costs in the top 3% of the hours, and then receive additional compensation beyond that for the next 2% of the peak hours. If the energy prices were set lower to just adequately compensate the 5% unit, then the 3% unit would be under-compensated.
Thus, there is no mathematical way to construct an energy price curve that properly compensates peak units running at different capacity factors for their fixed costs. However, the data demonstrate quite convincingly that the greater the reliance on energy prices to compensate for fixed costs, the greater the discrepancy, and the greater the over-compensation for the majority of units. This reliance on energy prices is the method that FERC has chosen in its Order establishing PUSH Reference Levels and supports a conclusion that New England’s markets are inefficient during peak load conditions.
One of the options under consideration for future implementation is a bid-based capacity market. In such a market, the owners of each peak resource could establish their own capacity offer price based on their expectations of other revenues from the energy and ancillary services markets. In our judgment, this will produce greater market efficiency.
2. DCAs, Proxy CTs, and PUSH Reference Levels: A case study
The joint NEPOOL and ISO filing in July 2002 for authority to implement a standard market design for New England included a proposal to establish “designated congestion areas” as a construct to allow better price signals in chronically congested areas that had few competitors. The underlying rationale of the filing was to provide an appropriate, elevated energy price over a fairly large number of hours. This would encourage new peaking units, or demand response resources, to become available in these constrained areas to take advantage of the (relatively) higher prices. The July filing stated that ISO-NE and NEPOOL would continue to develop the DCA proposal in preparation for SMD implementation in late 2002 or early 2003.23
In a September Order approving most of the new Market Rule 1 for Standard Market Design, FERC included conditional approval for the DCA concept. However, FERC stated that the proxy congestion price could only be bid during times of scarcity (shortage
23 Market Rule 1, July 15, 2002.

Synapse Energy Economics – Report on NE Electricity Markets Page 16
situations). In a request for clarification/rehearing, ISO New England stated that the purpose behind its DCA proposal was to allow the clearing prices in these zones to reflect the cost of a proxy peaking unit. ISO-NE argued that limiting the proxy prices to times of scarcity would not provide an appropriate market signal.24
In a December Order FERC agreed with ISO New England’s October filing. FERC indicated that DCAs could be implemented as proposed by ISO-NE subject to a filing prior to implementation that identified the specific DCAs and the proxy prices that ISO-NE was proposing.25 In January 2003, ISO-NE made its implementation filing with FERC. In that filing, ISO-NE proposed three DCAs: Southwest CT (SW CT), the rest of the state of CT (CT), and the Northeast MA/ Boston area (NEMA/Boston). In rough terms, ISO-NE proposed that bids in the DCAs could be at $85/ MWh for up to 2,000 hours in each DCA. ISO-NE requested a FERC response no later than February 28th in order to allow full implementation of the DCA proxy CT bid proposal by April 1, 2003.26
Despite ISO-NE’s request for prompt FERC action, February and March passed without any comment from FERC on the January filing. At the end of April, in a separate docket reviewing proposed reliability must run, or cost-of service contracts, FERC reversed field. In an unanticipated Order, FERC stated that it was rejecting most elements of the RMR contracts and substituting a requirement that ISO-NE modify Market Rule 1 to allow peaking units in the currently defined DCAs to bid their marginal and fixed costs and to set the ECP when their bids are selected. The CT proxy bids proposed by ISO-NE in its January filing were to be replaced with these “peaking unit safe harbor” reference levels (PUSH Reference Levels. All generation units that operated with less than a 10 percent capacity factor in 2002 would be eligible to request PUSH Reference Level authority. FERC directed ISO-NE to file the Market Rule 1 changes by May 30, 2003, with an effective date of June 1,2003.27
FERC’s Order on April 25th (the “Devon Order’) gave ISO-NE thirty-five days to design and file Market Rule changes to establish PUSH Reference Levels to become effective on June 1, 2003. Given this demanding schedule, the normal consultative process with NEPOOL was rendered moot. The tight time schedule also effectively prohibited any software changes to ISO-NE’s market systems. On May 30, 2003, ISO-NE submitted its compliance filing which consisted of changes to the words in Market Rule 1 and a methodology for calculating PUSH bids based on cost and other data supplied by the owners of generation units that operated at capacity factors of less than 10 percent in the Connecticut or NEMA/Boston zones.
At two NEPOOL Markets Committee meetings on May 12th and May 23rd, ISO New England discussed the compliance filing it eventually made on May 30th. One of the controversial aspects of the filing is that it preserves the $1,000 supply offer cap for PUSH Reference Levels, despite FERC’s statements in the Order of April 25th that PUSH
24 100 FERC 61, 245 (September 20, 2002). 25 101 FERC 61, 344 (December 20, 2002). 26 ISO and NEPOOL joint filing, ER02-2330-000, January 28, 2003. 27 103 FERC 61,082 (April 25, 2003).

Synapse Energy Economics – Report on NE Electricity Markets Page 17
Reference Levels should reflect the costs of the eligible generation units and that those bids should set the energy clearing price for the applicable zone(s) when selected. ISO-NE observed that it was not comfortable eliminating the $1,000 offer cap that FERC established in July 2000 without an explicit statement from FERC that the offer cap should be removed. ISO-NE anticipates that qualifying PUSH Reference Levels from some units (based on the magnitude of their fixed costs) are likely to reach the $1,000 offer cap, and, if allowed to, would exceed that cap.
3. Market Impacts
There is great uncertainty over how often FERC ordered PUSH Reference Levels will set the ECP in a particular zone or on a New England wide basis. There was similar uncertainty regarding the CT proxy bids proposed by ISO New England. The chart below shows ranges of potential market impacts based on certain assumptions. We have used ECP’s of $45 for the Baseline, $85 for the CT Proxy, and $500 for the PUSH bids. For the impact ranges we consider variations in hours of operation. For the Baseline and CT Proxy, the low represents 500 hours, the mid represents 1500 hours and the high 2000 hours. For the PUSH bids, the hours used are 100, 300 and 500. A further consideration is the size of the real-time market, which in recent months has averaged about 1000 MW, but is likely to be greater in the peak summer periods.
Figure 5: Illustrative Market Impacts
Comparative Costs of Various Compensation Plans
$0
$200
$400
$600
$800
$1,000
$1,200
Ba
selin
e
CT
Pro
xy
PU
SH
Ba
selin
e
CT
Pro
xy
PU
SH
Ba
selin
e
CT
Pro
xy
PU
SH
Ba
selin
e
CT
Pro
xy
PU
SH
1000 MW 2000 MW 3000 MW 4000 MW
RT Market Size
Ann
ual R
T M
arke
t Cos
t (M
$)
High
Mid
Low
We caution anyone from drawing conclusions from this graph. The graph shows a range of possible impacts based on assumptions about how often peaking units will set the real-

Synapse Energy Economics – Report on NE Electricity Markets Page 18
time ECP, what the ECP value will be, and the quantity of energy being traded in the real-time market. The assumptions we used are based on experience of past summers and three months of real-time market data from the New England SMD implemented on March 1, 2003. The range of impacts show that, in general, the PUSH Reference Levels are likely to provide the greatest total amount of additional compensation in the energy market. In the extreme High case, the PUSH Reference Levels will provide more than $600 million of additional energy market compensation to the generation units that clear in the real-time market. In the extreme Low case, the additional compensation would be over $100 million. ISO-NE’s CT proxy proposal would provide over $250 million of additional compensation in the extreme High case and over $80 million in the extreme Low case. The compensation will be similar for all three pricing options only in a highly improbable scenario where there are virtually no hot summer days with peak load hours.

Synapse Energy Economics – Report on NE Electricity Markets Page 19
D. Policy issues
In addition to the uncertainty regarding market impacts, there is a great deal of uncertainty and concern over the policy issues raised by DCAs, CT proxy bids and PUSH bids. The fundamental concern is “who, if anyone, is in charge”?
The DCA and CT proxy proposal was developed by ISO-NE through a year-long process designed to address areas of persistent congestion with few competitors. ISO-NE frequently consulted with New England stakeholders primarily through the NEPOOL Markets Committee process. As part of the overall New England Standard Market Design (SMD) filed with FERC in July 2002, the proposal was supported by a majority of NEPOOL stakeholders.
ISO-NE planned to continue work on the DCAs and proxy CT pricing proposal through the fall of 2002 for an original implementation date of December 2002. Two events in September altered that plan. First, the implementation date for New England SMD was extended from December 2002 to March 2003. Second, the FERC Order September 20th on NE SMD demonstrated that FERC either did not understand the DCA proposal or fundamentally disagreed with it. In the request for reconsideration/clarification filed in October, ISO-NE stated that it would not implement DCAs and CT proxy pricing if FERC limited the proxy prices to times of actual energy shortages.
While waiting for a FERC response, ISO-NE continued to develop its proposal, including a methodology for establishing “congested areas” and setting a CT proxy price. When FERC “clarified” in December that ISO-NE could implement CT proxy pricing in DCAs during non-energy shortage conditions, ISO-NE published its proposed DCAs (SW CT, CT, and NEMA/Boston) and the proposed CT proxy prices for each DCA (approximately $85 MWh on average). It was at this point that many NEPOOL participants began questioning the appropriateness of letting CT proxy prices establish the ECPs for almost 50% of New England’s summer peak load. Despite the potential for revenues from the auction of financial transmission rights (FTRs) to partially off-set the impact of $85 clearing prices in DCAs, the uncertainty of the financial exposure led many to question whether a more targeted program (i.e., paying peaking unit capacity costs through an alternative market mechanism rather than the ECP) might be a more efficient way to encourage new peaking units, or demand resources, to locate in the DCAs. No one disputed the need for new, additional resources.
ISO-NE was unable to gain NEPOOL support for its proposal and filed under its emergency authority at the end of January with a proposed effective date of April 1, 2003. As noted earlier, FERC provided no response for almost three months. The Devon Order created an entirely new approach, PUSH Reference Levels, which the ISO was ordered to implement in 35 days. Moreover, the PUSH Reference Level approach is only a temporary method for this summer; FERC also ordered ISO-NE to file a locational capacity-based approach by March 1, 2004, that could be implemented prior to summer 2004. It is difficult to understand how a price signal that will only be in effect for three summer months will be an effective incentive for new generation or transmission construction.

Synapse Energy Economics – Report on NE Electricity Markets Page 20
There is a great deal of confusion among New England stakeholders on how policy and rules for wholesale electric markets are established. ISO-NE continues to struggle to develop market rules that will encourage competitive and efficient markets, withstand the rigors of the NEPOOL stakeholder committee process with its competing interests, and satisfy FERC’s review procedures. As the case study above demonstrates, the ISO has been ineffective at communicating its proposals to the FERC. Faced with lack of clarity from the ISO and conflicting claims advanced by various market participants, the FERC ends up acting in a unilateral manner that may produce a less efficient and effective market structure than those proposed by the regional stakeholders.
At the same time that major market changes such as SMD are being implemented in New England, there is a concurrent effort to modify the structural relationships between ISO-NE, NEPOOL, transmission owners, NECPUC and other regional stakeholders to satisfy FERC standards for regional independent transmission providers and market administrators.
Market participants on the wholesale and retail levels in New England are seeking stable, transparent, and understandable market rules and rule-making procedures. Stability and predictability are more likely to be effective incentive mechanisms for new generation or transmission construction that must satisfy credit approval processes from skeptical capital markets.
ISO’s claim that the New England markets are “workably competitive” is difficult to understand when the ISO’s preferred CT proxy pricing proposal is premised on the lack of effective competition during 2000 hours of the year for 50% of New England’s peak loads.
Future Market Changes In addition to the PUSH Reference Level modifications to the New England wholesale markets, ISO-NE is proposing several other significant design changes. They include:
• A Forward Reserve Market that will use a competitive bid process to identify and designate resources to provide Operating Reserves for future delivery. Generation units, or demand resources, whose bids are selected will be required to provide specific amounts of operating reserves when called upon. This option could be implemented in the fall of 2003.
• A Locational Capacity Market that will establish different values for capacity resources in the different LMP zones. NY has a locational capacity market that ISO-NE may use as a model. FERC has ordered ISO-NE to develop and file a locational (or a deliverable) capacity proposal by March 1, 2004.
• A Co-optimized Reserves market that will provide a mechanism for suppliers, or demand response, to offer ten-minute spinning reserves, ten-minute non-spinning reserves, and thirty-minute operating reserves in a coordinated, simultaneously clearing manner. ISO-NE anticipates developing such a market design by late 2004 or early 2005.

Synapse Energy Economics – Report on NE Electricity Markets Page 21
• A Locational Reserves market that, like a locational capacity market, will establish different values for reserves in the different LMP zones. This might be included in the development of the co-optimized reserves market, but is more likely to be a further enhancement to that market at a later date.
• A system that provides nodal pricing for load to complement the current nodal pricing system for generators. NE currently has a zonal pricing system for load due, in part, to the absence of sufficient discrete metering sites to accommodate nodal load pricing. FERC has directed ISO-NE to promptly implement nodal load pricing in zones where it is feasible to do so.
• An inter-regional coordinated capacity market that will allow trading of capacity resources between PJM, NY and NE. A three-region working group has been established to develop such a market design.
ISO New England has stated its intention to implement all of the above changes. Regional stakeholders have questioned whether some of these changes may be over lapping, that is, provide redundant compensation for a single service. They have asked the ISO to conduct a comprehensive review of how all the proposed changes might interact. In addition, FERC recently issued a white paper on its proposed national rule on Standard market Design that reiterated its suggestion that Regional State Committees be formed that would have some responsibility for developing regional resource adequacy requirements. Such a process is underway in New England under the auspices of the New England Governors’ Conference.
As discussed in the introduction to this evaluation, there is a great deal of uncertainty and concern among New England stakeholders as to the future structure of the markets, what entity or entities will have the authority to make changes, and how that entity or entities will be accountable to the many regional interests. This uncertainty contributes to a market “paralysis” that inhibits load-serving entities from entering into long-term contracts and prevents developers of generation supply from entering into long-term sale commitments. Synapse will continue to monitor the New England markets over the summer to evaluate the impact of FERC’s PUSH Reference Levels. We will also continue to monitor the discussions regarding future market developments and the future organizational structure for overseeing the New England wholesale markets. Periodically, we will provide updated reports on this “New England experiment” with wholesale electricity markets.

Synapse Energy Economics – Report on NE Electricity Markets Page 22
References
Beckman, Ken, Reliability and Standard Market Design, May 2003.
Cramton and Wilson, Review of ISO New England’s Proposed Market Rules, September 9, 1998.
eAcumen Advisory Services, Peaking Resource Final Report, December 10, 2001.
FERC Orders:
85 FERC 61, 379 (December 17, 1998)
92 FERC 61,065 (July 26, 2000)
94 FERC 61,245 (March 9, 2001)
100 FERC 61,245 (September 20, 2002)
101 FERC 61, 344 (December 20, 2002)
103 FERC 61,082 (April 25, 2003)
ISO New England, Events of May 8-9, 2000, June 1, 2000.
ISO New England, Supplemental Report on May 8, July 28, 2000.
ISO New England, Annual Market Reports, May 1999 - April 2000.
ISO New England, Annual Market Reports, May 2000 - April 2001.
ISO New England, Annual Market Reports, May 2001 - April 2002.
ISO New England, Quarterly Market Reports, May 1999 - July 1999 and August 1999 - October 1999.
ISO New England, Quarterly Market Reports, November 1999 - January 2000 and February 2000 – April 2000.
ISO New England, EL00-62 (May 8, 2000)
ISO New England, ER00-2811 (June 12, 2000)
ISO New England and NEPOOL, Market Rule 1, July 15, 2002.
ISO New England and NEPOOL, ER02-2330, January 28, 2003.
Sithe New England and FPL Energy, Letter to ISO-NE Board of Directors, August 16, 2001.