the new face of welfare: from income transfers to social
TRANSCRIPT
Devolution | 3
The new face of welfare:From income transfers to social assistance?Thomas Corbett
Thomas Corbett is Emeritus Professor of Social Work atthe University of Wisconsin–Madison and an IRP affili-ate.
TANF reauthorization—the conventionalstory
In one telling, the contemporary welfare reform narrativeabout poor families with children is straightforward. Pas-sage of the Family Support Act (FSA) by Congress in1988 challenged states to strengthen policies requiringwelfare recipients to work or prepare for work. At thestate level, a plethora of waiver-based reform activitiessubsequently pushed the work agenda much further thanFSA required and, in addition, envisioned unanticipateddirections for reform.1 The confidence engendered inmany states by their introduction of increasingly ambi-tious initiatives paved the way for structural reform ofthe national social safety net. In 1996, passage of thePersonal Responsibility and Work Opportunity Recon-ciliation Act (PRWORA) substantially altered the waywe think about welfare in the United States.
PRWORA made important changes to the SupplementalSecurity Income (SSI) program for children, FoodStamps, the child support enforcement and child caresystems, and child nutrition programs. Other changeswere directed at policy domains that intersected existingprograms and policies, for example, assistance to immi-grants and reduction in nonmarital births.2 Most policyand public attention, however, has focused on the Tem-porary Assistance for Needy Families (TANF) program,which has replaced Aid to Families with Dependent Chil-dren (AFDC), the primary cash income support systemfor poor families with children that was established aspart of the Social Security Act in 1935.3
TANF established a different federal-state relationshipbased on a funding mechanism rather than a new pro-gram, and articulated a somewhat broader set of programgoals than existed under AFDC. These are:
1. Providing assistance to needy families so that chil-dren may be cared for in their own homes or in thehomes of relatives;
2. Ending the dependence of needy families on govern-ment benefits by promoting job preparation, work,and marriage;
3. Preventing and reducing the incidence of out-of-wed-lock pregnancies and establishing annual numericalgoals for both purposes; and
4. Encouraging the formation and maintenance of two-parent families.4
TANF eliminated cash welfare as an individual entitle-ment and created a state entitlement to an annual fixedamount of dollars—a block grant.5 It also placed a 60-month lifetime limit on the receipt of federal benefits andmandated that states require recipients to engage in workor work-related activities within two years after theyhave begun receiving benefits.
TANF further expects states to achieve mandatory workparticipation rates for recipients of cash assistance. Halfof all single adult recipients and 90 percent of all two-adult families are to be engaged in work or work-relatedactivities by 2002. In contrast, the FSA had requiredmothers with children three years and older (younger atstate option) to participate in welfare-to-work activitiesand had defined such activities rather broadly to includeeducation and training activities as well as work. TANFapplies the participation requirement to mothers withyounger children and defines permissible work activitiesmore narrowly.
Most critically, however, TANF sends new signals to thestate and local agencies that now exercise substantialauthority over welfare programs. TANF implicitly recog-nizes that individual and collective behaviors are as im-portant to being disadvantaged as is any income deficitand that states must exercise ingenuity and entrepreneur-ship in addressing the complex needs of low-incomefamilies.
But the story of welfare reform did not end with thestructural reform enacted in 1996. Rather, reform re-mains a work in progress, in part because we do not yetknow how it will play out in the radically changed eco-nomic landscape the United States now inhabits, and inpart because we do not yet have definitive answers tosome of the serious questions raised when PRWORA wasenacted. We explore dimensions of this continuingdrama in this issue of Focus.
Apocalypse revisited
When it was implemented, TANF was hailed by some asa watershed in the way that the United States would
Focus Vol. 22, No. 1, Special Issue, 2002
4 | Reauthorizing TANF
design and deliver social assistance to its most vulner-able families. Other observers assailed the enabling leg-islation as a disaster for the poor and a betrayal of solemnpledges made sixty years earlier when AFDC was estab-lished. When President Clinton signed PRWORA intolaw, three members of his administration resigned inprotest; this was the only policy decision of his adminis-tration to prompt such a reaction. Among other things,critics feared a “race to the bottom” in which stateswould vie with one another to introduce harsh measuresdesigned to lower caseloads and save money.
Such contention is to be expected, since cash welfare forfamilies, although accounting for a tiny proportion offederal outlays, touches upon our most sensitive publicissues: work, family, sex, abortion, personal responsibil-ity, and community integrity.6 Welfare has served as aproxy for fundamental questions about the quality of lifein society and about how to allocate personal and publicresponsibilities.
We are uncertain as a society whether assuring economicsecurity for children is more important than signalingclear consequences for parents who fail to play by gener-ally accepted rules. We have argued—and still argue—whether individual dispositions or societal barriers are atthe root of welfare dependency. We have debated theefficacy of available interventions and technologies: Caneconomic sanctions and incentives effect changes in fun-damental behaviors—work, fertility, marriage? Can thehuman capital of low-wage workers be raised to competi-tive levels? Would even the most disadvantaged respondif work were really a rational economic alternative? Andwe have debated the ends of reform—to save money or tosave people, to reduce poverty or minimize dependency,to get people into a job or help them secure a career.
Amidst the clamor, it appears that the vision of apoca-lypse for poor families feared by many critics ofPRWORA has not materialized. Indeed, much of theavailable evidence to date has been encouraging.
Caseloads have plummeted. The number of families re-ceiving cash welfare from AFDC or TANF fell by 57percent from January 1994 to January 2001. From 1996to early 2001, the caseload fell from 4.6 million familiesto 2.1 million.7 The caseload decline has been sharperamong younger mothers (ages 18–24) and mothers withyounger children.8
More low-income mothers are working. From studies ofwomen leaving welfare we know that about two-thirdswork at any given time after they leave, and 80 percentgive evidence of some attachment to the labor force.9
Overall, the labor force participation of single mothersjumped from 63.6 percent in 1994 to 71.5 percent in1999. Significantly, the proportion of never-marriedmothers who were working increased from slightly lessthan 50 percent to almost 65 percent.10
Incomes of disadvantaged mothers are up. Those leavingwelfare, on average, secure low-paying jobs, typicallyearning between $6.50 and $7.00 per hour, and experi-ence only modest increases in wages over time. Still,many of them, especially among the very poor, havegained. The poorest fifth of women with children sawtheir average incomes increase from $7,920 in 1996 to$8,867 in 2000. The proportion of their income frompersonal earnings jumped from 26 percent to 36 percent,the proportion from welfare fell from 53 percent to 37percent.11
Poverty is down. All the relevant measures of povertyhave been headed in the right direction. The poverty ratefor female-headed families fell from 36.5 percent in 1996to 30.4 percent in 1999 and child poverty declined fromover 20 percent to less than 17 percent. Moreover, theproportion of children in deep poverty, those in familieswith incomes below half of the federal poverty threshold,also fell from about 9 percent to less than 7 percent.12
Other indicators of family well-being show promise. Thenonmarital birth rate flattened out in the 1990s, afterrising from 1 in 20 births in 1960 to 1 in 3 births by theearly 1990s. There has been a slight increase in the pro-portion of black children living with both parents inrecent years. At the same time, the teen birth rate hasdeclined from 62.1 births per 1,000 in 1991 to 48.7 in2000.13
Evidence, however, seldom resolves fundamental publicpolicy issues. Not surprisingly, welfare debates neverreally end; they are merely recast. The evidence so far isencouraging, but the full consequences of reform are notknown. What will happen to those who have exited therolls, or to those pushed off assistance by sanctions ortime limits as different economic cycles play themselvesout? What is happening to those poor who no longerapply for help because the new signals discourage them?How are states exercising their new discretion and au-thority? Are TANF agencies focusing on the right ends?Will adequate federal and state fiscal support be main-tained into the future? Will poverty take center stageagain as a policy concern, and how will it be conceptual-ized? Will other ends—marriage or community revital-ization or investments in children—become the futurelitmus tests for reform? The issues are numerous.
Conventional TANF issues
The reauthorization dialogue, now well underway, en-compasses a broad set of very complex issues. At the riskof oversimplifying this discussion, I attempt to summa-rize the more important issues in a discrete number ofcategories—purposes, money, social engineering, vo-cabulary, and control:
Purposes. Should the four original purposes of TANF berevisited?14 Observers correctly note that purposes reflect

Devolution | 5
federal signals to the states about what is important.15
These signals are more powerful when accompanied bypositive and negative fiscal incentives, even thoughstates often view existing federal incentive awards asmore like winning a lottery prize than reflecting theirastute management practices.
The early debate seems to be coalescing along ideologi-cal fault lines. Those of a liberal persuasion argue thatthe reduction of poverty, and particularly of child pov-erty, should be made an explicit national purpose. Themost common response to this suggestion is cautionary:that TANF is a small engine to address such a lofty goal,and failure to achieve unrealistic standards might reflectbadly on the program or on those responsible for theprogram.
Conservatives, on the other hand, wish to strengthen thesocial agenda introduced by TANF, particularly to en-courage marriage and reduce nonmarital births. A com-mon response is that we have little rigorous evidenceregarding effective strategies for achieving these ends,nor has a societal consensus emerged around the mar-riage goal.
The center, insofar as it converges on any commonagenda, pushes the development of work retention andadvancement policies for the newly employed poor and,in a larger sense, for the legitimization of expandingservices to at-risk families and children. One cautionaryresponse is that this might create a new target populationand raise expectations that will stretch available re-sources.
Money matters. The TANF block grant itself is the focusof intense discussion. What should be its size, given thatdramatic reductions in conventional cases have been off-set by an expanding array of new initiatives? How shouldthe block grant be distributed in the future, given that theinitial distribution was based more on existing state ef-forts to assist the poor than on any reasonable measure ofneed? How much of the block grant should be segregatedfor a variety of special purposes—contingency funds,incentive funds, and set-asides to ensure that states pur-sue identified national goals?16 And what kinds of finan-cial investments should be required of the states to matchfederal commitments?
Other money issues are likely to persist: How to structurea fixed block grant that can respond to dynamics overtime such as migration patterns or economic cycles andhow to handle the inevitable erosion in the value of theblock grant—by the time TANF is reauthorized, inflationwill have lowered its real value by as much as one-quarter.
Social engineering. TANF is not a pure block grant. Aprescriptive federal vision of what reform should be ex-ists in uneasy conjunction with the vision of states as
inventive laboratories of innovation. For example, thePRWORA legislation restricts federal funding forlonger-term recipients and for younger teen mothers liv-ing in unapproved settings. Federal work expectationsfor recipients of aid nudge states to adopt stiff penaltiesfor those who do not comply with the rules.17 The issue iscentered on which vision will prevail—the one in whicha residual federal prescription for social engineering re-mains or the vision of a more radical devolution wherepolicy authority truly is allocated to the states.
There is also a widespread professional belief, not fullydocumented by the empirical evidence, that many whoremain part of the shrunken caseload are women whosepersonal circumstances categorize them as “harder toserve”—women for whom finding and maintaining workwill be very much more difficult, for a variety of reasons.Should authority to exercise some of the “tough love”provisions in TANF be delegated to the states as a conse-quence? Should time limits perhaps be waived for fami-lies playing by the rules—for example, those workinghalf time and also pursuing additional vocational skills?Such delegation of responsibility would enable states toadopt a more aggressive program to support the workingpoor through income supplements and career advance-ment initiatives. The larger question, discussed below, iswhose social agenda will be engineered when the agen-das of state governments, who see themselves as closer topeople’s circumstances, differ from that of the federalgovernment, which pays most of the bills?
Vocabulary and concepts. The world of welfare haschanged dramatically, as a traditional income supportprogram evolves into a multidimensional network of so-cial assistance. This is reflected in changed spendingpriorities. Between 1996 and 2000, the proportion ofstate welfare expenditures going to cash assistance inseven Midwestern states fell from 72 to 30 percent. InWisconsin, for example, only two-thirds to three-quar-ters of the official welfare caseload, cases actually openunder the states’ Wisconsin Works (W-2) program, re-ceived cash assistance; the remainder are helped onlythough social services. Moreover, uncounted others inWisconsin receive help through one-stop job centers orcommunity programs at least partially supported byTANF dollars. The “invisible case” phenomenon is agrowing issue in many states; yet the federal definition ofassistance is tied to the old technology of welfare—issuing a check. This definition surely needs revisiting.18
The old vocabulary, current since the late 1960s at least,drew on the traditional language of economics and ac-counting and assumed that welfare was indistinguishablefrom an income-transfer-based core technology. Weheard words like accounting period, guarantee, break-even point, marginal tax rates, income and substitutioneffects, and so forth. But if the core functions of welfareare evolving, we need to refresh our vocabulary if wewish to avoid confusion. We need terms and concepts
6 | Reauthorizing TANF
that reflect the transition toward direct investments in,and interventions with, children and families and com-munities in need of help.
Control and accountability. Finally, reauthorizationmust address core issues of responsibility and account-ability. States may well argue that they were prudentstewards of the new flexibility afforded them in TANFand that a true block grant concept should be included inthe next version of TANF. In such a rigorous vision ofdevolution, the former emphasis on process as a means ofensuring accountability would be replaced with an em-phasis on a set of outcomes. The federal governmentwould no longer specify countable work activities indetail, but might identify some outcomes to promoteequity across states, leaving others to be locally deter-mined so as to reflect variation in circumstances andpreferences.
Many, of course, remain uneasy with the wide variationin effort and ingenuity across and within states. Theytend to argue that federal oversight should, if anything,be strengthened and are skeptical that the country canreach any consensus on meaningful outcome measuresthat would replace process guarantees. But althoughmany of the difficulties confronting any transition toperformance-based accountability are technical in na-ture, and thus solvable, they nevertheless remain daunt-ing. We do not at present have the data-gathering infra-structure to collect the meaningful, population-baseddata necessary to implement such an intergovernmentalmanagement strategy. Technical difficulties, moreover,are usually susceptible to technical solutions only if thereis a willingness to invest political will and fiscal re-sources.
The faces of welfare
What we do in the future depends, in large measure, onhow we conceptualize welfare in the first place. We arein some ways quite unsure about the essential characterof assistance as it transitions from a narrow income trans-fer function to a broader notion of social assistance,creating what might be called a new “face” of welfare.19
This transformation is encapsulated in Table 1.
The old face of welfare
In essence, traditional welfare programs were publictransfers with two distinguishing characteristics: (1) thebenefits can be received in the absence of work and(2) benefits paid to welfare recipients are reduced whenthey begin to earn, and the rate of reduction substantiallyexceeds any tax rate we would dare impose on othermembers of society.
Consider the second point. Today, few would considerraising the highest federal income tax rate to 50 per-
cent—essentially the rate that existed prior to the lastmajor overhaul of the tax system in 1986. Rates of 70percent, which existed in the 1960s, and over 90 percent,in effect after World War II, seem confiscatory today.Yet a working AFDC client in the pre-TANF era couldeasily lose one dollar in benefits for each dollar earned,effectively facing a 100 percent tax rate.
By 1996, decades of experience and research had made itclear that the core principles of cash welfare programs asthey then existed were deeply flawed as an antipovertystrategy. Welfare created an array of perverse outcomes,unintentional consequences of policies enacted with thebest of intentions. Ironically, these adverse outcomescame from trying to achieve desirable public policy prin-ciples—target efficiency, horizontal equity, and manage-ment accountability.
Target efficiency. When resources are scarce, it seemssensible to target benefits on certain categories of indi-viduals (e.g., single-parent families) and income classes(the asset- and income-poor) that are most in need. Be-cause benefits were targeted on one-parent families, cre-ating at least the appearance that welfare encouragedcounterproductive fertility and marriage choices, AFDCcame to be seen as a deterrent to stable family formation.Because families developing assets were thrown off therolls, the program discouraged savings and long-rangethinking.
Horizontal equity. This is sometimes referred to as the“trap of equality.”20 The desire to minimize perceivedabuses associated with individualized treatment of fami-lies led to routinized policies and invariant administra-tion. All families that appeared similar, at least within thesame state, were to be treated the same. In distributivejustice terms, the search for a rough sense of equalitysacrificed any true equity that took into account realdifferences among families.
Management accountability. For two decades, the domi-nant administrative goals focused on getting benefits out
Table 1
OLD WELFARE NEW WELFARE
Problem Amelioration Investment-Prevention
Benefits BehaviorServices SolutionsAdult recipient Whole familyStatic concept (PIT) Longitudinal (PIP)Bureaucratic orientation Professional modelAutonomous worker Collaborative workerAutonomous agency Transparent boundariesRisk aversive Risk takingProcess Products

Devolution | 7
accurately (no agency error or client abuse) and effi-ciently (lowest possible administrative cost). In strivingto meet these twin management goals the welfare systemsubordinated the needs of its clients and became moreconsumed with processing data than with helping chal-lenged families. This led to perverse practices. BecauseAFDC cases involving working adults were complex anderror-prone, for example, hard-pressed welfare workerswere not enthusiastic about encouraging clients to work.
In the end, we wound up with an income transfer systemthat failed to lift dependent children out of poverty whilegenerally ignoring the root causes of their difficulties.
The new face of social assistance
Achieving the expectations set under TANF, most statesquickly realized, meant more than merely adding a fewconditions—work requirements and time limits, for in-stance—to the traditional welfare function of getting acheck out the door. It meant transforming basic programpurposes and organizational cultures.
This transformation is reflected in four common featuresof the various innovations unleashed by the 1996 act, andpresaged by earlier waiver-based initiatives. First, thebasic mission of programs came to be seen as transform-ing individual, family, and community behaviors, notissuing checks. Second, the locus of real program author-ity shifted first to the states, then to local county or stateagencies, and then to the front lines. Third, programs thatattempt to transform behavior have their own technologi-cal imperative—they are less rule-driven and demandmore autonomy and judgment on the part of front-lineworkers. Given these transformations, the last feature isinevitable. Because it has become very difficult to moni-tor rule conformance under a highly devolved and behav-ior-focused system, we will most likely look to perfor-mance, what is accomplished, and not to process, what isdone.
Reform has become more of an evolutionary process andless a periodic, distinct event. Over the past severalyears, state and local officials have been quite successfulin moving low-income adults into the labor market. Butthis was recognized as only a first step in the reformagenda. New entrants must be kept in the labor marketthrough a variety of work supports, functioning two-parent families need to be nurtured and promoted, andthe communities in which low-income families residemust be strengthened.
Early on, the more farsighted policymakers recognizedthat the ultimate purpose of reform was to prevent dys-function and dependence in the first instance, by promot-ing independence and through prudent investments inchildren, families, and communities. Today’s reformlandscape has moved closer to this early vision. Forexample, in seven upper Midwest states, proportional
spending on what has been termed family stability issuesincreased threefold between fiscal year 1996 and fiscalyear 2000. Many of these dollars are directed towardinvestments in children and youth or in efforts to stabi-lize families.21
The new face encompasses varied and multiple goals(work, marriage, wiser fertility decisions, and betterparenting), and encompasses multiple targets (adult re-cipients, children, nonrecipients, families, fathers, andcommunities). Moreover, the new face relies upon com-plex, behavior-focused programs that tend to be dynamicand longitudinal—seeking fundamental change overtime in those served. Interventions tend to be multidi-mensional—addressing several issues simultaneously asthey seek to encourage positive behaviors and discouragethose that are counterproductive. If welfare workers inthe emerging era are to be effective, they must eschewbureaucratic rules and adopt professional norms.
As this happens, the organizations within which workersfunction will become structurally flatter and less hierar-chical. Agency boundaries themselves will become po-rous as interagency agreements and one-stop modelsemerge. Malleable and plastic institutional forms that canrespond quickly to new challenges, that are more entre-preneurial in their approaches, will supplant traditionallystatic and risk-averse welfare systems. Distinct programand funding streams, the “silo” approach to social policy,will be merged into networks of social assistance. Withinagencies, horizontal patterns of communication, dia-logue among peers, will become more prominent, anddiscretion at the operational level will replace traditionalcommand-and-control organizational strategies.
The new culture of social assistance may well require adifferent kind of worker. Agency workers are less likelyto be detail-oriented functionaries executing policies,more likely to be professionals working in teams to setpolicies and solve difficult social problems in creativeand flexible ways. And rather than ignoring the mostdifficult cases, the most troubled families, they will try toengage them. Finally, the new face of social assistancewill focus on products, meaningful outcomes, rather thanprocess, e.g., activity counts or management efficiencyand accuracy measures.
The new face of social assistance and TANFreauthorization
This new world of welfare generates a fundamental ten-sion in the dialogue about TANF. We can approach reau-thorization as a debate about an income transfer programthat has been enhanced by “tough love” provisions and amodest shift of control to the states. Arguably, however,the opportunities for change—and the stakes at risk—may be greater. Before considering the future we might
8 | Reauthorizing TANF
first rethink the nature and character of welfare as tradi-tionally viewed by key stakeholders during the entitle-ment era of welfare, a period roughly running from thelate 1960s through the early 1990s.
The seduction of economic efficacy (first the economists).Somewhere in the 1960s we came to equate social assis-tance with the mere transfer of economic resources topoor families, the first foundation of welfare during thisperiod. The economic paradigm emerged and, not sur-prisingly, economists began to dominate poverty andwelfare policy. The policy challenge was to remedy im-mediate income shortfalls; the dominant response in-volved income transfers. With the exception of humancapital theory, most policy efforts involved some attemptto transform behavior by altering economic outcomes.For example, we tried to promote work by reducing ben-efit reduction rates or marginal tax rates, thus attemptingto improve vertical equity so that those who worked moreearned more.
The seduction of the equality trap (and then the lawyers).A second foundation of the modern welfare state is thenotion of horizontal equity—treating like families alike.But taken to the extreme, this led to a uniformity in thetreatment of clients that resulted in less equity. Easilyobservable characteristics such as family size predomi-nated over real and fundamental differences, e.g., humancapital levels or family functioning measures, in deter-mining what help families actually received. Everyonegot the same flat grant despite wide variation in circum-stances and capabilities. It was feared that the applicationof professional judgment or discretion was likely to in-vite claims that due process had been violated and alsoraise the specter of agency or worker abuse.
The seduction of accountability (and the public manage-ment gurus). A third foundation is the long-standing ef-fort to introduce accountability into the management ofwelfare. But this has meant an obsession with processmeasures: Are the checks accurate? At the same time,there emerged a concerted focus on efficiency: Is thecore technology of welfare agencies being executed withlow overhead costs? The focus on process and efficiencydrove the “culture” of welfare offices in predictable di-rections. Applicants and recipients were reduced to in-formation inputs and agencies evolved into isolated andindependent information-processing systems.
The seduction of the silver bullet (and the evaluators). Afourth foundation of the welfare state, a more recentdevelopment, has been the use of rigorous analysis toidentify policies and programs that “work.” These effortsare laudable and much has been learned. At the sametime, there is a conservative dimension to evaluativeefforts. They seek to isolate and estimate the independenteffects of particular policies and strategies. The searchwas for the policy or program that would solve the wel-
fare problem, as if there were such a magic potion. Thisscientific imperative, along with surprisingly high levelsof control-group contamination, resulted in studies mea-suring modest impacts at best and in a sobering sentimentthat nothing works really well. Consequently, we were inno way prepared for the outcomes emanating from dra-matic changes in institutional cultures tried under TANFin some areas, since such results defied the best estimatesof science. Perhaps it was a good thing that somepolicymakers ignored the evidence and went with theirinstinct.
The seduction of program and funding silos (and thepoliticians). There is a fifth foundation in the politicalimperative that seems to push lawmakers toward creatingnew programs and funding streams. These are typicallycategorical in character, organized about specific targetgroups, service technologies, or purposes of the moment.At the operational level, it is obvious to welfare officialsthat challenged families need coordinated and individu-alized attention, not a specific intervention that is infavor or that happens to be available. This creates atension between those who wish to ensure accountabilityby narrowly defining who is to be served and in whatmanner and those who wish to expose troubled familiesto whatever it takes to turn their fortunes around irre-spective of the particular program category into whichthey might fall.
The seduction of ideological certitude (finally the socialworkers). Nowhere is the problem of rigid thinking moreevident than in the helping professions. Those develop-ing the new model of welfare talk openly of the need fora new kind of professional as we work directly withfamilies to help them function better and participatemore fully in society. All too often, social workers andother helping professionals have chosen to criticize wel-fare reform from the sidelines rather than engage in con-structive efforts to make these more ambitious effortswork.
Taking the longer perspective means thinking outsideexisting boundaries. It means eschewing marginalchanges in favor of creating an environment where entre-preneurship and risk-taking can flourish. States and theirlocal partners have shown imagination and flair in devel-oping new institutional arrangements and interventionstrategies to help struggling families, though mistakesclearly have been made and significant challenges re-main. But this era of experimentation may be short-livedif resources are constrained or the economy deteriorates.
Final thoughts
If we are to have a really meaningful discussion aboutreauthorization, we need to get back to some fundamen-tal questions. For example:
Devolution | 9
What are the purposes of “assistance?” State and localofficials already have developed new purposes forTANF. They have moved aggressively into programs forthe working poor, have committed to strengthening fami-lies and communities, and have initiated a broad range ofprevention strategies.
What do we mean by “assistance?” Assistance no longermeans cash support. But what are the boundaries thatconstrain where a TANF agency can spend money? If weinvest in parenting programs for broad segments of thelow-income community, is that acceptable? Or if weinvest in transportation systems to get people to jobs, isthat appropriate? One person’s ingenious program initia-tive is another’s fiscal waste, and officials often worrythat decisions will be questioned retroactively.
What is a welfare agency? Some of the most excitinginnovations occur when services are blended and institu-tional boundaries blurred. In these one-stop environ-ments, seamless services that are transparent to the cus-tomer are possible. Agency workers can be locatedoutside the agency in schools or community centers, orwith large employers. Networks of public, nonprofit, andfor-profit providers can be intertwined in complex work-ing relationships. But as these different institutionalforms emerge, officials again fear that someone will sec-ond guess the decisions made.22
Who are the clients? It used to be clear that clients,recipients in the “old welfare” days, were the ones get-ting the checks. Today, that may not be the case at all.But even if we add case-management-only families tocash assistance cases, we have barely begun to includethose reached by the new welfare. There are at least fivetarget groups touched by emerging initiatives: (1) cashrecipients; (2) former cash recipients who might be get-ting help to retain or advance in employment or to func-tion better in society; (3) potential recipients who mightget help to prepare for life, work, parenting, marriage,etc.; (4) broader segments of the community where po-tential problems might be addressed before intensive in-tervention is needed; and (5) those parts of the commu-nity infrastructure that influence the well-being of thedisadvantaged.23 The truth is we cannot count all thoseaffected by TANF initiatives. How do we count, forexample, those reached by a public awareness campaignto dissuade teens from engaging in at-risk behaviors?
What is success? How do we move to outcome-basedaccountability systems? Given a focused and productivepublic debate, we might well agree on a set of nationaland locally driven outcomes of interest. Agreement onmeasuring the likely range of outcomes important at thelocal level is another matter entirely. Absent an adequateinvestment in a data infrastructure that will give ustimely, locally grounded information, our accountabilitymechanisms will inevitably be constrained to what it is
feasible to measure, not what we care about. No otherarea of welfare is so clearly a federal responsibility.24
One irony of the TANF era welfare debate has been itspredictability. The dialogue often has a conventional feelabout it, as if the new face of welfare were little morethan a warmed-over AFDC program touched up withtime limits and a few additional behavioral requirementsimposed on recipients. In reality, TANF reauthorizationoffers an opportunity to rethink the nature of social assis-tance in the United States. The dominant question is notwhether TANF succeeded or failed, but rather whatTANF is and what potentials might be encouraged ifproperly nurtured. The last few years have shown thatgiven resources and opportunity many local officials willexplore innovative policies, programs, and institutionalstrategies. They also suggest just how well disadvan-taged families and the systems of support designed towork with them can be engaged and energized. At thesame time, these new experiments might well not surviveresource constraints or contradictory federal signals.
The irony is that we have had a very difficult time mov-ing beyond the concepts and vocabulary of a welfaresystem that almost everyone despised and that manystates and local communities consciously eschewed asthey explored the frontiers of reform. The way it hasalways been done, or so it seems, is not the way it mustalways be. Perhaps what we need is an invigorated, opendialogue where stakeholders move beyond their conven-tional positions. Ideally, the dialogue would be premisednot on the face of welfare that we are replacing but ratheron a vision of social assistance that, when properly imag-ined and articulated, can take us into the twenty-firstcentury. �
1The Ohio LEAP program and the Wisconsin Learnfare program wereamong the first to use fiscal incentives within welfare as “socialengineering” to achieve desired behaviors beyond the adult recipiententering the workforce. On Learnfare, see T. Corbett, J. Deloya, W.Manning, and E. Uhr, “Learnfare: The Wisconsin Experience,” Focus12, no. 2 (1989): 1–10.
2See the appendix to R. Haskins, I. Sawhill, and K. Weaver, WelfareReform: An Overview of Effects, Welfare Reform and Beyond PolicyBrief 1, Brookings Institution, Washington, DC, 2001, for a succinctsummary of major provisions.
3AFDC was known as Aid to Dependent Children (ADC) when firstestablished. Title I of PRWORA, Public Law 104-193 (1996) alsoreplaced the Jobs Opportunities and Basic Skills Training (JOBS)program and the Emergency Assistance program.
4See PRWORA, Sec. 401(a).
5PRWORA also created contingency funds for states experiencingeconomic downturns or excessive population growth; these were to beallocated on a competitive basis.
6Even at its height, federal spending on AFDC was less than 1 percentof federal outlays.
7From data routinely published by the Administration for Children andFamilies of the U.S. Department of Health and Human Services.

10 | Reauthorizing TANF
8The proportion of younger mothers getting assistance fell from over50 percent in 1993 to less than 30 percent in 1999. In 1994, 62 percentof all children received help from AFDC; the proportion had declinedby one-third by 1998.
9See G. Acs and P. Loprest, “Studies of Welfare Leavers: Methods,Findings, and Contributions to the Policy Process,” in Studies ofWelfare Populations: Data Collection and Research Issues, ed. C.Citro, R. Moffitt, and M. Ver Ploeg. Panel on Data and Methods forMeasuring the Effects of Changes in Social Welfare Programs, Com-mittee on National Statistics (Washington, DC: National AcademyPress, 2001).
10Haskins, Sawhill, and Weaver, Welfare Reform.
11Federal spending on TANF is fixed, and thus declining in real terms,and TANF spending on cash assistance has fallen dramatically. Butspending on some other programs for low-income families and chil-dren has increased. For example, spending on the Earned Income TaxCredit jumped from $15.5 billion in 1992, the peak year of AFDCspending, to $31.9 billion in 1999. Spending on WIC, Head Start, andSchool nutrition programs is also up. See J. Scholz and K. Levine,“The Evolution of Income Support Policy in Recent Decades,” Focus21, no. 2 (Fall 2000): 9–15, for an overview of spending trends.
12For a summary of this issue, see R. Haskins and W. Primus, WelfareReform and Poverty, Welfare Reform and Beyond Policy Brief 4,Brookings Institution, Washington, DC, 2001.
13Child Trends, Facts at a Glance, August 2001, Washington, DC, onthe Child Trends World Wide Web site at< http://www.childtrends.org/PDF/FAAG2001.pdf >.
14The first proposal to alter the purposes of TANF was introduced inOctober 2001 by Rep. Patsy Mink (D-Hawaii) as H.R. 3113. Amongother things, it would make the reduction of child and family poverty anational goal.
15For example, see M. Greenberg, “Welfare Reform and Devolution:Looking Back and Forward,” Brookings Review 19, no. 3 (Summer2001): 20–24.
16Recently, some 17 states received supplemental grants to account forpopulation growth and disproportionately higher need.
17Some 35 states adopted full family sanctions, under which the totalgrant was lost, though substantial variation exists in the extent of useand the circumstances in which they were applied.
18The U.S. General Accounting Office (GAO), responding to a re-quest by Rep. Benjamin Cardin, is currently attempting to assess theextent to which nonassistance cases are being served. See also thearticle in this Focus by Swartz.
19Much of the following analysis emerged from the discussions overthe past several years of the Welfare Peer Assistance Network(WELPAN).
20This characterization was suggested by Joel Rabb, a TANF officialfrom the state of Ohio and a member of WELPAN.
21The seven states participating in WELPAN are Indiana, Illinois,Iowa, Michigan, Minnesota, Ohio, and Wisconsin. The state of Ohio,for example, has spent almost $700 million dollars on its Prevention,Retention, and Contingency initiative over the past several years. Thisis seen by state officials as a “new system” that is “proactive, lookingforward to prevent and strategically intervene when the investmentcan forestall long-term dependency.” In the 2000–2001 biennium,Ohio invested $92 million of TANF dollars into child welfare andprotection, $89 million in youth educational support services (birth to18), $41 million in early childhood development and parenting ser-vices, $34 million in community development initiatives, $11 millionin pregnancy prevention, and $7 million to reduce domestic violence.These are just a few examples of direct investments in children andfamilies. See Reinvesting in Ohio’s Communities, a report prepared bythe Ohio Department of Job and Family Services (Spring 2001).
22Eugene Bardach has estimated that about half of the innovationswhich rise to the finalist level in the Ford Foundation/HarvardKennedy School of Government (Ford/KSG) Innovation in AmericanGovernment competition require people in different agencies to workcooperatively. E. Bardach, “Implementing Innovation across AgencyLines,” Working Paper 42, Richard and Rhoda Goldman School ofPublic Policy, University of California, Berkeley, 2001.
23This might include child care providers, the transportation system, orthe housing system, or advocates, or any other group or system thatsystematically addresses the quality of life in the community.
24R. Moffitt and M. Ver Ploeg, eds., Evaluating Welfare Reform in anEra of Transition (Washington, DC: National Academy Press, 2001).
FOCUS is a Newsletter put out three times a year by the
Institute for Research on Poverty1180 Observatory Drive3412 Social Science BuildingUniversity of WisconsinMadison, Wisconsin 53706(608) 262-6358Fax (608) 265-3119
The Institute is a nonprofit, nonpartisan, university-based research center. As such it takes no stand on publicpolicy issues. Any opinions expressed in its publicationsare those of the authors and not of the Institute.
The purpose of Focus is to provide coverage of poverty-related research, events, and issues, and to acquaint alarge audience with the work of the Institute by means ofshort essays on selected pieces of research. A subscrip-tion form with rates for our Discussion Papers and Re-prints is on the back inside cover.
Focus is free of charge, although contributions to theU.W. Foundation–IRP Fund sent to the above address insupport of Focus are encouraged.
Edited by Jan Blakeslee.
Copyright © 2002 by the Regents of the University ofWisconsin System on behalf of the Institute for Researchon Poverty. All rights reserved.

Devolution | 11
Welfare then, welfare now: Expenditures in somemidwestern states
would, they believed, capture the broader missions beingencompassed in reform. These rules are briefly outlinedin the box on p. 14.
Dramatic shifts in expenditure patterns over time, thenetwork assumed, would reflect changing policy priori-ties and service technologies that were not always con-sciously embodied in program mission statements andperformance measures. The most meaningful changeswithin the new world of welfare no longer always tookthe form of directives from Washington or even statecapitols, but came from those closest to the families andcommunities being served. Thus, substantive change
Members of the WELPAN Network
The purposes of social assistance have shifted dramati-cally over the past decade, and particularly since theenactment of national reform in 1996. The Personal Re-sponsibility and Work Opportunity Reconciliation Act(PRWORA) sought a new vision for helping families.First, the underlying goal of social assistance shiftedfrom partially remedying income shortfalls to addressingbehavioral change at the individual, family, agency, andcommunity levels. And second, contemporary reform en-courages the reallocation of programs and policy author-ity to levels closer to where families are actually helped.Members of WELPAN have conceptualized thesechanges as an emerging set of policy agendas—newerpurposes made possible by success in meeting the earlychallenges of welfare reform.
Briefly, the first generation of contemporary reform sawwork-first job placement programs replace the traditionalincome support function. State and local welfare agencyofficials soon acknowledged the necessity for a morecomplete concept of reform encompassing work supportgoals, job retention, and career advancement. Ascaseloads fell, policy attention then turned to strategicinvestments in challenged families and communities.More visionary reformers correctly noted that preventingproblems, rather than responding to them, would returnsocial assistance to its earliest foundations—seeking thebest strategy for raising healthy and productive children.
In late 2000, WELPAN members decided to examinechanges in where they were spending their resources.They surmised that they should be able to document thisperceived transformation in the character of social assis-tance by “following the money.” After much discussion,the members agreed upon a number of decision rules foraggregating expenditures under Temporary Assistancefor Needy Families (TANF) into general categories that
���� ������ ��� ���� ����� ������� ��������������� �� �� ������ � � ������ ��� ���� � ������ �������� ��� ��� ��� ������ ����� !������"� !������"!���"���������"��������"�#���"������������$���������������������������%&&'"��(�������� ��������)���� ���� ����������� � � ��������*� ������� ������*� +������� ����+�$� ���� ������� ������*���������� �� ��� ����,����� ������������"� ����������������"����������������������������������"���)����� �������� ���� ������� �����"� �� ��� ����������� ����������������� ���������*$�+���������� ����)�����������������-�������"�������������.���������� ��� ��� ������ ����� ��-� �� /� ��011���$�$���$���1���1������1����$���2
Figure 1. Average distribution of welfare expenditures for a groupof upper midwestern states, 1996 and 2000. Included are Illinois,Indiana, Iowa, Michigan, Minnesota, Ohio, and Wisconsin.
Source: Data provided by member states of the Welfare Peer Assis-tance Network.
1996Total Spending = $4.6 billion
Workforce Development8%
Family Formation
6%
Child Care14%
Cash Assistance72%
and Stability
2000Total Spending = $4.8 billion
Workforce Development12%
Child Care38%
Cash Assistance30%
Low Income
2%
Family Formation
18%and Stability
Tax Supports
Focus Vol. 22, No. 1, Special Issue, 2002

12 | Reauthorizing TANF
could happen before most of us were aware that thewelfare world was quite different.
Figure 1 shows that, between 1996 and 2000, spendingon the traditional welfare function—handing out welfarechecks—collapsed from almost three-fourths of allspending under the old Aid to Families with DependentChildren (AFDC) program to less than one-third of allspending under TANF. Clearly, there has been a qualita-tive transformation in welfare functions.
But if welfare is no longer a matter of handing outchecks, what has it become? Table 1 gives us a portrait ofwelfare’s new face in the seven WELPAN states. Justfour years after the enactment of national welfare reform,child care emerged as the biggest expenditure item,jumping from 14 percent to 38 percent. Proportionalspending on an array of policy and program initiativeslabeled family formation and stability tripled in fouryears, accounting for almost one in five dollars by the2000 calendar year. Activities organized underworkforce development showed a modest increase overthis period. Finally, some of the WELPAN states beganusing TANF resources to provide support to workingpoor families through the tax system. None of these ex-penditure categories includes administrative costs.
These general categories of spending are not particularlytransparent, so we provide some brief definitions. First,there are the big three that account for four-fifths of allspending: child care, cash assistance, and family forma-tion and stability.
Child Care includes direct payments for child care ser-vices as well as the costs of developing slots, improvingthe quality of child care, helping parents find appropriatechild care, etc. Much of the increase is attributable toexpansion of the population eligible for a subsidy andinvestments to eliminate waiting lists and improve qual-ity. It is not unusual for families up to 185 percent of thefederal poverty line to get some help, as states attempt to
decouple child care assistance from receipt of cash wel-fare.
Cash Assistance consists of traditional income supportpayments, including payments to vendors for shelter andutility services on behalf of customers. It also includescash payments to meet short-term economic emergen-cies.
Family Formation and Stability encompasses a growingnumber of efforts to help form stronger families, promotea positive environment within the family, invest in thedevelopment of children and youth, and address counter-productive behaviors. The list of specific initiatives fall-ing under this label continues to grow: efforts to reducenonmarital births and teen pregnancies (e.g., Illinois’sTeen REACH program); programs to reattach fathers totheir children; early childhood investments, includinghome visits for newborns and good parenting invest-ments; domestic violence prevention and treatment; fam-ily preservation services; adoption support programs;adolescent and youth investment programs; intensivefamily development services (e.g., the Iowa Family De-velopment and Self-Sufficiency program); family plan-ning services; child welfare services (e.g., family fostercare, protective day care, adolescent monitoring andtracking, wrap-around services, child abuse preventionhelp); housing and homeless init iatives (e.g. ,Minnesota’s Bruce Vento Affordable Housing Program);life skills programs; treatment of alcohol and substanceabuse; and so forth.
Growing steadily in prominence, though still relativelysmall, are two other sorts of initiatives: workforce devel-opment and low-income tax supports.
Workforce Development includes a host of expendituressupporting activities designed to prepare recipients foremployment, assist them into the labor market, and sus-tain their attachment to the world of work. This includesall education and training initiatives, work subsidies,
Table 1Component Expenditure Trends
Workforce Family Formation Low-IncomeCash Assistance Development _ Child Care _ and Stability _ Tax Supports_1996 2000 1996 2000 1996 2000 1996 2000 1996 2000
Seven WELPAN states 72% 30% 8% 12% 14% 38% 6% 18% 0% 2%
Illinois 66 27 5 4 13 38 16 31 0 0
Indiana 65 28 8 6 22 44 4 18 0 4
Iowa 66 35 7 12 13 35 14 18 0 0
Michigan 78 29 11 15 9 40 2 15 0 2
Minnesota 74 44 5 10 13 36 8 11 0 0
Ohio 74 37 8 16 17 36 1 11 0 0
Wisconsin 74 12 8 20 16 45 2 13 0 10

Devolution | 13
transportation help, labor market attachment assistance,and even short-term job access loans.
Low-Income Tax Supports provide cash assistancethrough work-based tax payments. The federal EarnedIncome Tax Credit now dwarfs welfare assistance as amechanism for distributing income assistance to low-income families. Two of the WELPAN states now useTANF dollars to help finance state EITC programs.
The expenditure patterns across the seven states makingup WELPAN exhibit remarkable consistency, consider-ing how diverse the states are in so many ways.
The WELPAN states: Diversity andconvergence
The Midwest has been at the forefront of welfare reformsince the late 1980s. The seven states of WELPAN havebeen particularly active. Still, these states represent verydifferent socioeconomic situations (see Table 2). Inpopulation, they vary from small, mostly rural states(Iowa) to larger states with significant urban populations(Michigan, Illinois, and Ohio). They vary in rates ofpopulation growth, from 3 percent in Iowa to 9 percent inMinnesota, and in the proportion of the population that is
Table 2Socioeconomic Data
Population, in Population Growth Nonwhite Share Per Capita UnemploymentState Millions (1999) (1990–99) of Population (1999) Income (1999) Rate (1999)
Illinois 12.1 6.1% 18.9% $31,278 4.3%
Indiana 5.9 7.2 9.6 26,092 3.0
Iowa 2.9 3.3 3.6 25,727 2.5
Michigan 9.8 6.1 16.6 27,844 3.8
Minnesota 4.8 9.1 7.1 30,622 2.8
Ohio 11.3 3.8 13.0 27,081 4.3
Wisconsin 5.2 7.3 8.1 27,412 3.0
Table 3TANF Caseload Changes
January 1994 January 1996 January 2001
Illinois 238,946 233,664 65,132
Indiana 74,169 52,254 39,413
Iowa 39,623 33,559 20,027
Michigan 225,671 180,790 70,468
Minnesota 63,552 58,510 38,087
Ohio 251,037 209,830 86,483
Wisconsin 78,507 65,386 17,012
U.S. Total 5,052,854 4,627,941 2,143,031
nonwhite, from 4 percent in Iowa to 19 percent in Illi-nois. All had relatively low unemployment rates until therecent downturn, but per capita income varies, from$26,000 (Indiana and Iowa) to over $31,000 (Illinois).
The states also vary in civic traditions, political orientation,and systems of social assistance. Some have long-standingreputations for activist social policies, whereas others typi-cally have been more conservative in this arena. Wisconsinhas integrated its TANF system with its workforce develop-ment system. Michigan and Minnesota have aggressivelyused TANF benefits to supplement earnings, but Wisconsincounts all earned income in determining cash benefitamounts. Illinois, Indiana, Iowa, and Michigan operate wel-fare through state employees; Minnesota, Ohio, and Wis-consin rely heavily on county governments.
Despite variation in environments, policy choices, andorganizational arrangements, all the member states haveseen steep declines in their cash assistance caseloads (seeTable 3). In the seven WELPAN states, 834,000 familieswere receiving cash assistance in January 1996; the num-ber had fallen to 337,000 by January 2001. In short, thecaseload was more than halved in a little over four years.
Other programs have also been affected by the policychanges ushered in by the Personal Responsibility andWork Opportunity Reconciliation Act (PRWORA) in1996, as well as by the vigorous economy. For example,the population of food stamp recipients fell over time(see Table 4), although some evidence suggests that thisdecline has stopped, even turned around. In Wisconsin,for instance, the food stamp caseload has increased byone-third in the past two years. The reasons, as usual, areprobably complex. Some states market food stamps as anearning support program for the working poor. More-over, the economy has softened. But the fact that the foodstamp decline has not been so deep as the decline in cashassistance cases may suggest that there is still consider-able need in these states.
Along with declines in caseloads have been declines inaggregate poverty. TANF was never intended as a solutionto poverty, yet increases in poverty during this era of reform

14 | Reauthorizing TANF
������������� ���������������������������� ���
������������������������
����������-�����������������������������)�-�������������������� �������������(����������� ������ -�� �������-��� ����� ���� ���� ������$������������������������-������������������� �����������������������(������������� ������-�����������������������$�����������������)����*� ������� ����� 3��� ��*���"� 3����� 3���"+����*� +�������� ���� 4�-���*"����� �����5������)���"��������)!��������(�4�����$
������������������������-*�����������0
%$ ���� ������-����������� ��� ������� �����*����6777�������+"������������� �� ��� ��#��� ���"����3�����3���$�+���%&&'"���*����������!8)�����������!8)+�� ����4������4�����*��������3�����3���$
6$ �(��������� ���� �������� ��� ��� *���� ��*� �����(������"�������*���������������*������������������������$
9$ ��������������� ���"����������� ����������������+"3����� 3���� ���� 5���������� :����� ;���"� 3����3��������5����������+���"���� �����������-���������$
<$ ������������������������-����������$
would have been a reason for concern. What we see isencouraging: poverty rates in the WELPAN member statesare below the national rate (see Table 5) and virtually allstates have seen declines since the inception of reform.
Is the reform revolution over?
For some observers, these numbers might suggest thatthe reform revolution is over, that the need for resourcesand continued attention is an issue of the past. Bothpoverty and caseloads, even if crudely measured, aredown. But the members of WELPAN believe it would bea great mistake to look at official caseloads and assumethat resources can be cut back.
The reform revolution of the past several years has notbeen directed toward reducing investments in disadvan-taged families. Notably, aggregate spending among theseven states increased (see Table 6) from $4.6 to $4.8billion as caseloads fell by more than half. Rather, it hassought to invest in such families in ways that make bettersense to both families and agencies, and that promise toaddress the fundamental causes of individual and familydysfunction rather than merely remedying immediate in-come shortfalls.
Table 4Food Stamp Receipt (in thousands)
January 1994 January 1996 January 2001
Illinois 1,189 1,105 779
Indiana 521 390 300
Iowa 196 177 123
Michigan 1,031 935 603
Minnesota 316 295 196
Ohio 1,245 1,045 610
Wisconsin 330 283 193
U.S. Total 27,468 25,542 17,158
Table 5Poverty Rates (two-year average)
1993–1994 1996–1997 1999–2000
Illinois 13.0 11.6 10.8
Indiana 13.0 8.2 7.6
Iowa 10.5 9.6 7.3
Michigan 14.8 10.7 9.9
Minnesota 11.7 9.7 6.6
Ohio 13.6 11.8 11.1
Wisconsin 10.8 8.5 8.9
United States 14.8 13.5 11.5
Table 6TANF Expenditure Trends (in millions)
1996 2000
Illinois 1,196 1,031
Indiana 235 330
Iowa 198 227
Michigan 1,076 1,165
Minnesota 450 462
Ohio 1,027 1,071
Wisconsin 413 486
All $4.6 billion $4.8 billion
The TANF spending shifts reflect emerging purposesdeemed important by the WELPAN members. Despitewide differences among the member states, they hold aremarkably similar vision of what is fundamental to thefuture of reform. Simply helping the jobless to get a jobis not the end of the story. As a nation, they believe, wemust invest in the working poor, with work supports andchild care. We must invest in families, since strong fami-lies lead to productive workers and productive workersare a precondition to strong families. And we need toinvest in the future, to support prevention-oriented initia-tives, for there is nothing more important than raisinghealthy children capable of being involved, productiveadults. �

Devolution | 15
������������� �����
�������������� ������ ������� ������������������
������������ ���������������������� ���������� ����������� ���� �������� ����� !!!�� ������� "�#���� �� ���� �� ���� ��� ������� �������� �� ������������� ���� ������ ��� �������� � �� ������� � ������� ��� ������� � ��� �������������� ���� ���� ��� ������ �������� � � ���$ ����� ������ � �� ��� ������� ��� �������� ������� ��� ��� ����������� ������������������������� ��%�������� �����
��� �� ���� ��� ���� &�� ���� ��� ������ ��� ��� ' �������� ���� �������� � � (������� � �� ��� )������ ��� *������ ���������� ����(�� � �� � ����������� "�$����������� ����������� � ������ ���������� ���* ������+����,�� ����� "� ��� ,���� ,�� ����� "� ��� �������� ���� ,�� ����� "� � �� ��� +������ ������� ����� ,�� ����� ���������������� ����� �� ��
������
����������������� ��������������������������������������
-�����.����"���� �"�� ��+��������� ����(������������������� ��� ������������ ��
�� +� ���� � � ,������ ��������/� '��������� �� ���(�������� ����������(�������� ������ ���� �����������
0��������� �������.�������1� �����������
2����������"� (������� ��"� � �� ���+� ��3�� ������(�����������+����� /�+����� ��*�����)��������������������
4��$���(�������� ���+����%5���� ���+� ��6�� ������������ �������� �������� �������������
����������������������������������������
7������������� ����' ������������(������� ����� �������� ����!�������"�����!�����# �
8��#�������(������ � ���� ����� /������� � �� ����%�����+� ����������(����+����� �,������������+����� � ������'������ ����������$�#��
9��������(���������������5� ��������(��� ����������� �������������%�&
:�� ' ����� �� � � ��� ,�����/� ������ �� (���������������� �+�������' ������ �������!����
�������� ����������!���������"� ������
-!������� ���������� ���� �� �������� ����� ����%����� ����+���������(������ ����' ���
--�������������������������(������/�����������;�����*��������� ��� �������� � ��������� ����)���������#��(�������&
- ��+���� ����������������� "� <���"�� �� ���#���%=�� ��������' ��%+����(�������������������
�#��"�������� ����� ��
-0��(�������"�����"�� ��(��������������������������
-2�� (������� �������� � �� * ���������� (������ ����������� ������������������ ��# �����)��� �
-4����������� �(�������� ��* ����������(������� ���%��&��
��������$ ���������(����"�8:�;���� ������"�+��������"��*�! -09��487��������*����� !! �+���������� /�>44�!!�?�@08�:4�?��70�0!�A� �������������BC������������ �> 2�:4�?�@-7�:4�?�� 9�8!�A� �������������B�

16 | Reauthorizing TANF
Redefining a case in the postreform era:Reconciling caseload with workloadRebecca Swartz
Rebecca Swartz is a Research Fellow of the HudsonInstitute and the Director of the Institute’s office inMadison, Wisconsin.
Since passage of the 1996 welfare legislation that createdthe Temporary Assistance for Needy Families (TANF)block grant, cash welfare cases have dropped 54 percent.Yet spending has remained high in most states. Duringthe upcoming debate on TANF reauthorization, these twoseemingly contradictory facts will cause many membersof Congress to ask how states are spending their money.Answering this question, however, will be difficult, be-cause the tool most policymakers use to gauge theprogress of welfare reform—the cash assistancecaseload—does not reflect the workload involved inimplementing a successful TANF program.
The workload is not captured in the caseload becausestates are now providing more intensive services to thoseon cash assistance and a new, broad range of noncashservices to low-income families. Although the federalgovernment collects extensive data on cash assistancecases, it collects very little on the noncash services thathave become a major part of most state TANF programs.A comparison of expenditures in seven midwestern statesfound that the states continued to invest in low-incomefamilies but reallocated their funding from cash assis-tance to a range of other, noncash activities—workforcedevelopment, child care, tax transfers, and family stabil-ity (see p. 11).
To fully comprehend the outcomes and impacts ofTANF, one must first understand the role noncash ser-vices play in state programs as well as the change inworkload associated with a work-based system. This ar-ticle examines that changing workload and providessome suggestions for more effectively capturing it in anew vision of caseload. But first it is necessary to under-stand what data the federal government collects on fami-lies receiving services funded through TANF.
Defining a case
In an era of devolution, definitions take on heightenedimportance. The definition of the welfare caseload, forexample, determines the type of data the U.S. Depart-ment of Health and Human Services (HHS) collects on
the services states provide under the TANF block grant.The level of data, in turn, determines policymakers’ abil-ity to understand the various aspects of the TANF blockgrant. The next few pages examine the definition ofcaseload in greater detail.
The current definition of the welfare caseload is a hold-over from the former welfare entitlement program, Aid toFamilies with Dependent Children (AFDC). The goal ofAFDC, a pure income-transfer program, was to providecash grants accurately and efficiently; little attention andless funding were devoted to employment preparationand case management. These cash grants were often theticket to other supportive services such as food stampsand Medicaid, child care and transportation assistance,and education and training. Although families were notalways required to receive AFDC first, supportive ser-vices were focused on serving those on cash welfare. Asa result, the AFDC case count was a good proxy for thenumber of families receiving a wide range of services.
Life is not so simple under TANF. In fact, TANF is betterthought of as a funding stream than as a program.Whereas AFDC funding was provided as a matchinggrant, in which the federal dollar matched state spending,TANF is a block grant that provides states with a setamount as long as they maintain their own funding forservices to needy families at 75–80 percent of their his-torical spending on AFDC (this is known as “mainte-nance of effort,” MOE).1 Unlike AFDC, which set strictrules and regulations, states now have wide latitude tofund a range of programs and services within the frame-work of the four purposes of TANF—(1) providing assis-tance to families with children, (2) ending dependencyon welfare through increased work, (3) reducing out-of-wedlock pregnancies, and (4) encouraging the formationof two-parent families (see p. 3).
The first two purposes of TANF are the most reminiscentof AFDC. Both lay the groundwork for state cash assis-tance programs focused on work and family stability andboth refer to “needy families,” a term that is left to statesto define but is generally considered to be families withincomes under 200 percent of the federal poverty level.The third and fourth purposes, however, are fairly broadstatements giving states extensive latitude to spendTANF funds on a range of services potentially targeted tothe broader public.
Despite these wider goals, the federal definition of aTANF case, on which most data reporting requirementsare based, is primarily limited to cases receiving cashgrants. HHS makes two primary distinctions in determin-ing the official TANF caseload: whether a case receives
Focus Vol. 22, No. 1, Special Issue, 2002
Devolution | 17
“assistance” or “nonassistance” and whether the servicesprovided to those cases are funded with TANF funds orwith MOE funds through a separate state program.
Assistance families are those that receive benefits tomeet their basic needs (i.e., for food, clothing, shelter,utilities, household goods, and general incidental ex-penses) most often in the form of cash assistance; theyalso include those that receive supportive services suchas transportation and child care while unemployed.2 Mostassistance cases look like AFDC cases did before 1996;they are one-parent, two-parent, and child-only caseswho receive a continuing monthly cash grant.
Assistance cases funded with the TANF block grant aresubject to federal eligibility restrictions, time limits,work and participation requirements, child support as-signment requirements, and TANF data collection re-quirements. As under AFDC, states must report disaggre-gated data on a quarterly basis for each case, adult, andchild receiving TANF-funded assistance, as well as foreach case, adult, and child transitioning off or applyingfor such assistance.
In most instances, states must also report disaggregateddata on assistance cases funded with state MOE funds.States can use MOE funds in three different ways: com-mingled with federal TANF funds, segregated, or in aseparate state program entirely. Commingled funds havethe same eligibility, work, and data reporting require-ments as pure TANF funds. Segregated funds allowstates to exempt portions of their assistance cases fromTANF requirements. In October 1999, 15 states wereproviding assistance to some families with segregatedstate funds.3 Assistance cases funded with both com-mingled and segregated funds are included in the TANFassistance caseload and work participation rate calcula-tion, and are subject to TANF data reporting require-ments.
States may set up separate state programs (SSP) to avoidTANF eligibility and participation requirements such asthe high work participation rates for two-parent families.States with SSPs have two data reporting options. Underoption one, the state can choose to provide disaggregateddata similar to the data provided for TANF assistancecases, but in a separate caseload report. All of the 23states with SSPs have chosen this option because provid-ing such data qualifies the state for federal TANF perfor-mance bonuses and caseload reduction credits. The sec-ond option allows states to provide only the limitedaggregate data required of all services provided withMOE funds.
HHS requires states to report some information on allservices provided with MOE funds, both assistance andnonassistance. The catchall phrase for any service thatdoes not fall into the assistance category is“nonassistance,” an unfortunate term which implies that
services not provided as cash do not assist the familiesreceiving them. For this reason, I use the term “noncash”services. Such services can range from child care subsi-dies for working families to postemployment case man-agement to home visiting for first-time parents to a bill-board campaign to reduce teenage pregnancy.
The MOE data provided by states are very basic. Statesmust provide total expenditures, the total amount ofMOE claimed, and the estimated total number of familiesserved; no disaggregated data are required. No suchcaseload data, however, are currently collected for non-cash services provided under the TANF block grant; forthese, the federal government requires only fiscal data.These TANF funds are likely to provide the bulk offunding for the third and fourth TANF purposes, thoserelating to out-of-wedlock pregnancy and two-parentfamilies, because MOE funds are restricted to familiesand individuals who are financially needy.
To better understand the complexities of these data, thebox on pp. 18–19 examines caseload counts in threestates—Florida, Minnesota, and Wisconsin.
The caseload doesn’t match the workload
Although the definition of caseload has not changedmuch since the implementation of TANF, state practiceshave changed considerably. States are providing moreintensive services to those on cash assistance and areproviding a range of noncash services to low-incomefamilies. This section explores these new developmentsby drawing on the experiences in Florida, Minnesota, andWisconsin.
Intensive services to those on cash assistance
Although the cash assistance caseload has declined 54percent since 1996, there has been no correspondingdecline in the workload of state welfare agencies becauseTANF has changed the way states address their cashcases. Under AFDC, successful states had very low ad-ministrative costs, for two reasons. First, processing ap-plications was efficient, because the process was basedalmost exclusively on financial criteria and because ap-plications for multiple programs, such as food stampsand Medicaid, could be taken at one time. Second, cli-ents, once eligible, had minimal contact with their case-workers apart from the six-month eligibility review. Un-der TANF, caseworkers play a widely expanded role withincreased authority and significant discretion. With thesenew duties comes more work. The workload is higherthan under AFDC for three main reasons: work require-ments, earned income, and churning.
Work requirements. Roughly half of all AFDC clientsnationwide were exempt from that program’s work com-ponent, the Jobs Opportunity and Basic Skills Training
18 | Reauthorizing TANF
Program (JOBS). Moreover, many nonexempt clientswere ultimately not required to participate because therewas not enough funding. As a result, just 16 percent ofthe AFDC caseload participated in JOBS in 1995.4
By 2000, the number of TANF cases participating inwork and training activities had increased to 42 percent.The increase is due in part to the 60-month time limit andthe work participation rate requirements, which are tiedto receipt of TANF block grants and rise incrementallyover time.5 In addition, TANF’s funding and flexibilityallows states to provide the more intensive services andcase management that goes with increased work require-ments.
Wisconsin’s work and participation rate of 87 percent ismore than twice the national average, in large part be-cause Wisconsin subscribes to the philosophy of fullengagement. The first ingredient of full engagement is
�������������� ����������
����������� ������ ������� ��3�� ��������������� ������ ���� ������������"�����6��� ���������������� ������������",������"��� �����"�� ��#���� �� ��,����-::7���� !!-"��������� ���� ����������������� ���42������ �"�������������������������� �,�������� ��#���� �� ������ �������������84������ �"�� ��� ��� �����������������������04����� ���D����������������*5,������������ ����������������������E��� ����� ���� �����������������"����������������������� �#���� �� ��' �������� "����� ��������������� ����� ����� ���� �� ��� � � ������� ���������������������� ������� ������������ �� ��������������������������������������"�������������� �������6����������������� �� ��� �F������� ��G�� ����H"�� �F � ������� ��G�� �����"�� ������������������������ ������������ ������
$��������������%�� �����������A>0!0���������������������B����������H%��������������"���29%�� �� ��������� �����"�� �� 2%����07%�� ��������%�� �� ����� ������� � ��������������� ����,������������������������� ��������������3���H��"�����������������E���� ��������� ���� ��������������������������> !!������� ���� ������ ��4!������ ������������� ��������#��H�� �;�� ���� ��������%������� ���A#*;�B������������������ �������*5,�������� ���������������������������������������� ������)���� ����������������������������������� �������������� ��������������������6������*5,��� ���������������� � ��������������+���������� ��"
������"���H������� ���04������ �������������E������������� �� ����������������������� � � ���������������H����������"� ���H� ����������"� �������� ��������"� � �� �6�� ���� ��������� ��� ���������� ����� ���������� ��������� ���� ���� ��� ������������������ �� � ����������������������������� ������������� ���
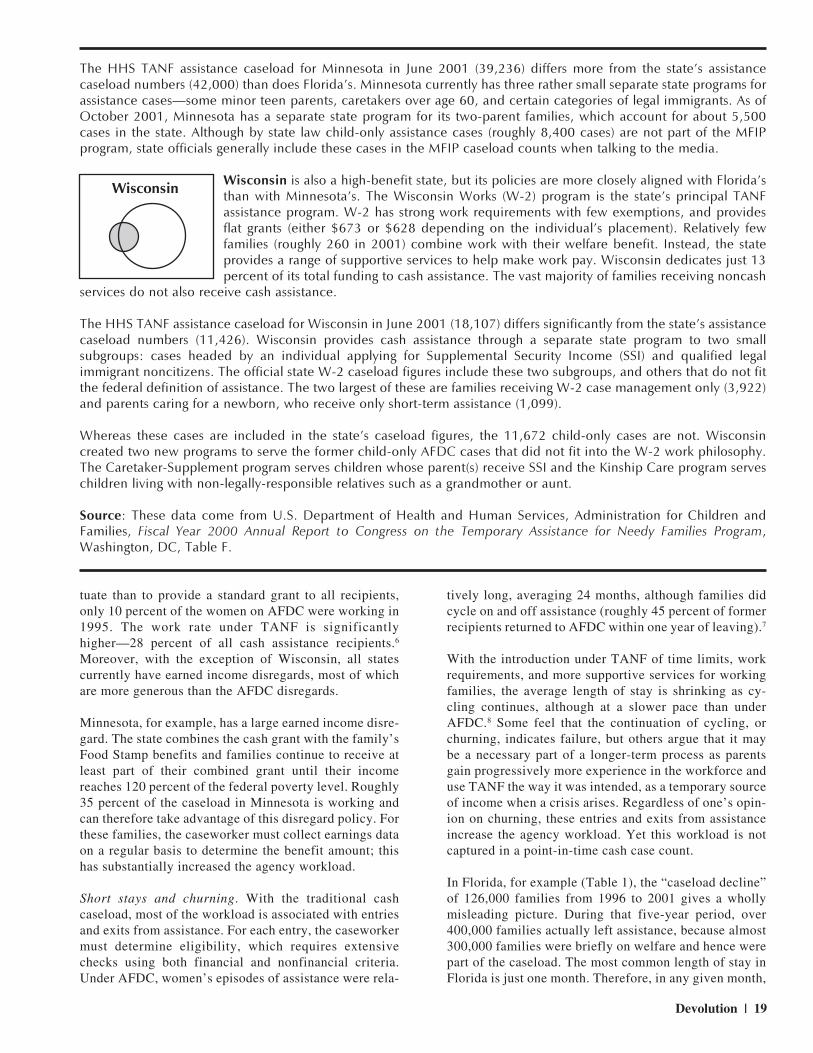
������ �*5,� ������� ��� ��������� ���� ,������� � � <� �� !!-� A47"!8:B� �������� ����� ��� �����E�� ������� ��� �������� ������� A48"-7:B� � � �������� �������,����"�,������������ �� ������� �� �������� ����� ���� ������������� ��������� ������� �����������������*5,���������������*,�+"�� �������������������� ����� �����*5,�������� ������������ ������������� ��������������#*;�������������� �"�����*5,���������������� ��������������� �������������%����%� ��� ������ � ����� ������� �� ��� ������H� ��� ����"� ,���������� �� ��������� �������������� ���� ���� ���%���� ����������������� ��������� ������������������������ ������������� " !!�������
�������� ��� ����%�� ����� ������ A>40 � ���� �� ���������� ����B�� ��� �������� ����� �����,������' ������ ��(�������A�,'(B"���������E����� �������*5,�������� ����������"��������������������������������� �������������������,'(���������������������� �� ���������� ���� ������ ���� ����� � ����� ������� - !� ����� �� ��� ��������� =������� ��� �� ������ ��� ��� � ��������������"����������� ��� ������������ ������������ ����� ������ ������������������� ��������������� ����������������������4!������ ������*5,�� ���)���� �� ������������� ��������� ��������������������������� ������������ ��� ��������� ������� ��F � ������� ��G� ������������
������������ ������������� ������ �����E������ � ���������������������������������� �������������� �������� �������������������������������
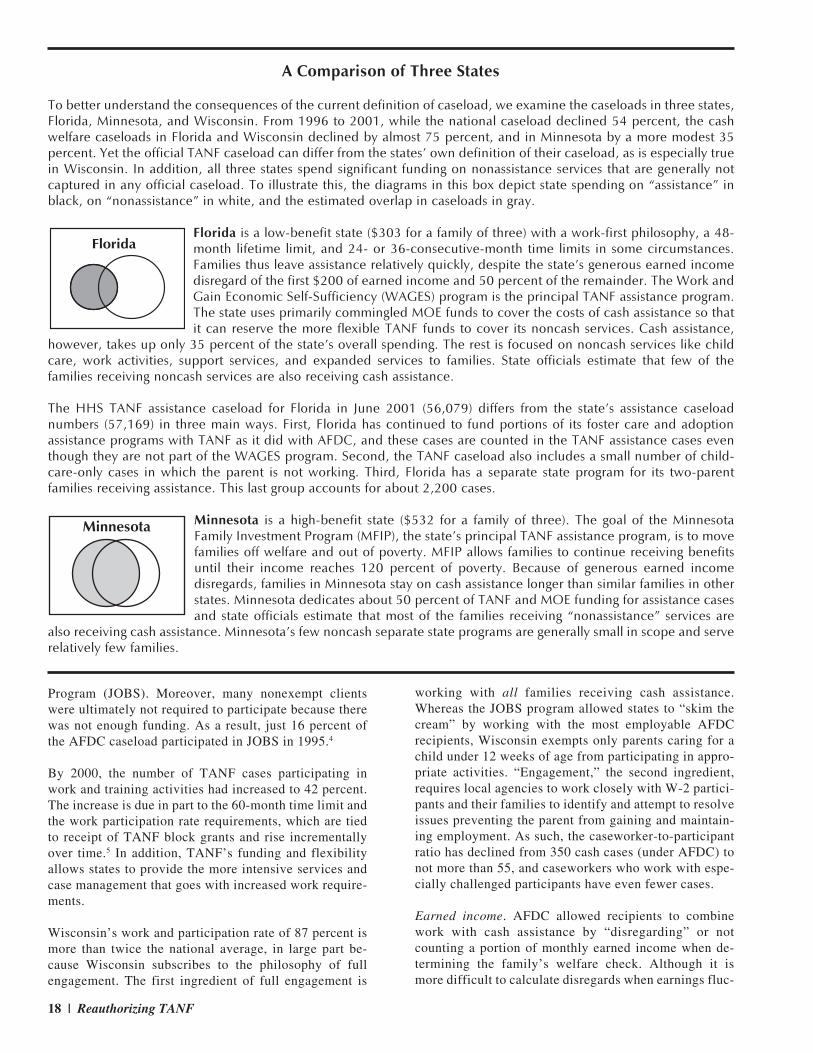
Florida
Minnesota
working with all families receiving cash assistance.Whereas the JOBS program allowed states to “skim thecream” by working with the most employable AFDCrecipients, Wisconsin exempts only parents caring for achild under 12 weeks of age from participating in appro-priate activities. “Engagement,” the second ingredient,requires local agencies to work closely with W-2 partici-pants and their families to identify and attempt to resolveissues preventing the parent from gaining and maintain-ing employment. As such, the caseworker-to-participantratio has declined from 350 cash cases (under AFDC) tonot more than 55, and caseworkers who work with espe-cially challenged participants have even fewer cases.
Earned income. AFDC allowed recipients to combinework with cash assistance by “disregarding” or notcounting a portion of monthly earned income when de-termining the family’s welfare check. Although it ismore difficult to calculate disregards when earnings fluc-
Devolution | 19
tuate than to provide a standard grant to all recipients,only 10 percent of the women on AFDC were working in1995. The work rate under TANF is significantlyhigher—28 percent of all cash assistance recipients.6
Moreover, with the exception of Wisconsin, all statescurrently have earned income disregards, most of whichare more generous than the AFDC disregards.
Minnesota, for example, has a large earned income disre-gard. The state combines the cash grant with the family’sFood Stamp benefits and families continue to receive atleast part of their combined grant until their incomereaches 120 percent of the federal poverty level. Roughly35 percent of the caseload in Minnesota is working andcan therefore take advantage of this disregard policy. Forthese families, the caseworker must collect earnings dataon a regular basis to determine the benefit amount; thishas substantially increased the agency workload.
Short stays and churning. With the traditional cashcaseload, most of the workload is associated with entriesand exits from assistance. For each entry, the caseworkermust determine eligibility, which requires extensivechecks using both financial and nonfinancial criteria.Under AFDC, women’s episodes of assistance were rela-
tively long, averaging 24 months, although families didcycle on and off assistance (roughly 45 percent of formerrecipients returned to AFDC within one year of leaving).7
With the introduction under TANF of time limits, workrequirements, and more supportive services for workingfamilies, the average length of stay is shrinking as cy-cling continues, although at a slower pace than underAFDC.8 Some feel that the continuation of cycling, orchurning, indicates failure, but others argue that it maybe a necessary part of a longer-term process as parentsgain progressively more experience in the workforce anduse TANF the way it was intended, as a temporary sourceof income when a crisis arises. Regardless of one’s opin-ion on churning, these entries and exits from assistanceincrease the agency workload. Yet this workload is notcaptured in a point-in-time cash case count.
In Florida, for example (Table 1), the “caseload decline”of 126,000 families from 1996 to 2001 gives a whollymisleading picture. During that five-year period, over400,000 families actually left assistance, because almost300,000 families were briefly on welfare and hence werepart of the caseload. The most common length of stay inFlorida is just one month. Therefore, in any given month,
������ �*5,� ������� ��� ��������� ������ ������ � � <� �� !!-� A0:" 07B� ������������� ����� ��� �����E�� ������� ����������� �������A2 "!!!B��� ������,������E����� ����������� ���������������������������������������������������������� ��������I������� ������ ����� ��"�������H�������������7!"�� �������� ���������������������������� ����*����)������� !!-"��� �������������������������������������� ���� ���%���� �� ��������"���������� �� ����������4"4!!������ � � ����������*��������������� ��������%� ���������� ��������� A�������9"2!!������B����� ����������� ����,'(�������"������������������� �������� ������������������ �����,'(������������� ����� ����H� ��������������
%�������������������%�� ����������"��������������������������������������� �������,������E��� ������� �����E��� ���#���� �� �#��H�� A#% B��������� ��� ��� �����E�� ��� ������ �*5,������� ������������#% �������� �����H���3������ ������������6������ �"�� ��������������� ��� ��� A������ >780� ��� >7 9����� �� �� � � ��� � ��������E�� ������� �B�� ����������� ������������ A������� 7!� � � !!-B������ �����H����� ��������������� ������ ' �����"� ��� ������������������ �����������������������������������H�����H������#���� �� �����������&����-0����� ����������������� �� ���������������� ��������������&������������������������� �� � ���
������������ ��������������������������� ���
�������*5,�������� ����������������#���� �� �� �<� �� !!-�A-9"-!8B������������ ����� �����������������E��������� ����������� ������� A--"2 7B�� #���� �� � ��������� ���� ������� ��� ������ �� ��������� ������ �������� ��� ���� ��������������/� ������ ������ ��� � � � ��������� ������ �� ���� ������� ���� �������� ' ����� A'B� � �� 3��������� ������������ �� � ������ ���������������������#% ������������������� ������������������������"�� ��������������� ��������������������� ���� ����������� ����������������������������������������������� ��#% �������� ����� ��� ���A0": B� ������ ������� �������� ����� "������������� �������%������������ ���A-"!::B�
#������ ����� ������ ���� � ������� � � ��� �����E�� ��������� �������"� ��� --"78 � ����%� ��� ������ ���� ����#���� �� ������������ �����������������������������������%� ���*,�+��������������� �������� ������#% ����H�������������+�����H��%������� ����������������������� ���������� �A�B���������'�� �����J� ����+������������������������ ����� ������ � %�������%����� ���������������������������� ������������ ��
&�����/� ���������� ����� �����$����������� ����������� � ������ ��������"�*��� �������� � ����+����� �� �,�������"� � ���� '��� *+++� ,����� �-���� ��� �������� ��� ��� ��-������ ,�� ������ &��� (��� ��� �� $������"#��� ��� "��+"�������,�
Wisconsin
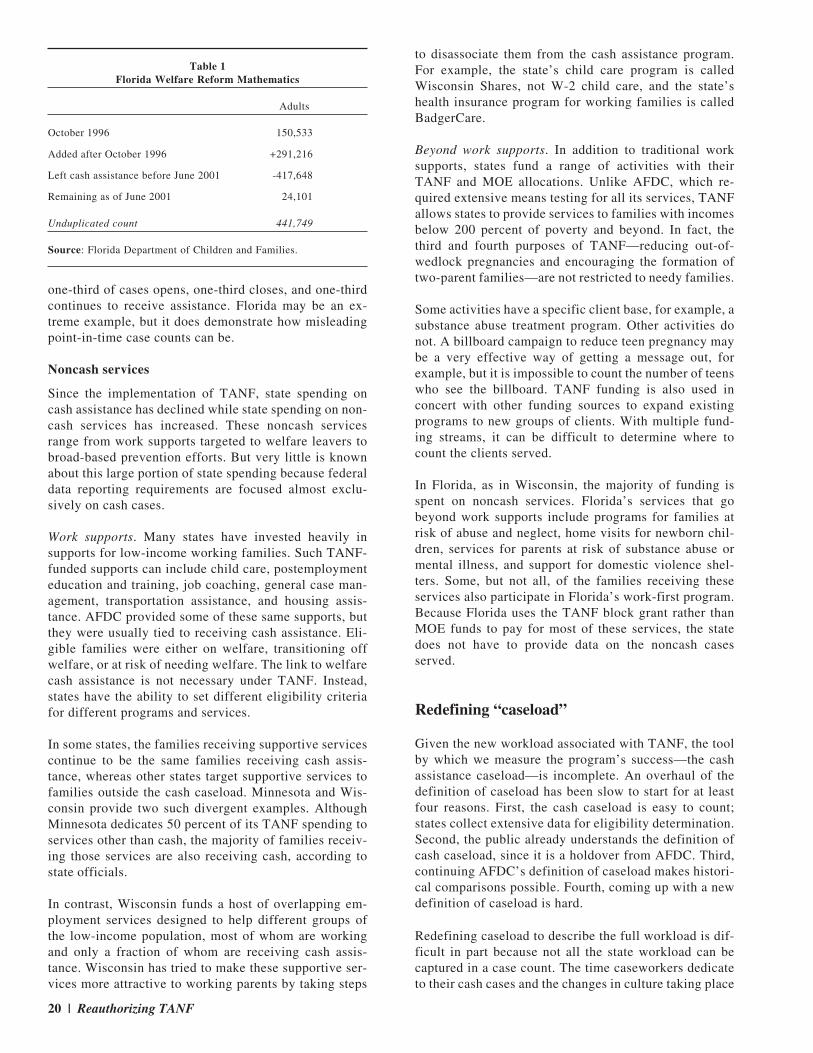
20 | Reauthorizing TANF
one-third of cases opens, one-third closes, and one-thirdcontinues to receive assistance. Florida may be an ex-treme example, but it does demonstrate how misleadingpoint-in-time case counts can be.
Noncash services
Since the implementation of TANF, state spending oncash assistance has declined while state spending on non-cash services has increased. These noncash servicesrange from work supports targeted to welfare leavers tobroad-based prevention efforts. But very little is knownabout this large portion of state spending because federaldata reporting requirements are focused almost exclu-sively on cash cases.
Work supports. Many states have invested heavily insupports for low-income working families. Such TANF-funded supports can include child care, postemploymenteducation and training, job coaching, general case man-agement, transportation assistance, and housing assis-tance. AFDC provided some of these same supports, butthey were usually tied to receiving cash assistance. Eli-gible families were either on welfare, transitioning offwelfare, or at risk of needing welfare. The link to welfarecash assistance is not necessary under TANF. Instead,states have the ability to set different eligibility criteriafor different programs and services.
In some states, the families receiving supportive servicescontinue to be the same families receiving cash assis-tance, whereas other states target supportive services tofamilies outside the cash caseload. Minnesota and Wis-consin provide two such divergent examples. AlthoughMinnesota dedicates 50 percent of its TANF spending toservices other than cash, the majority of families receiv-ing those services are also receiving cash, according tostate officials.
In contrast, Wisconsin funds a host of overlapping em-ployment services designed to help different groups ofthe low-income population, most of whom are workingand only a fraction of whom are receiving cash assis-tance. Wisconsin has tried to make these supportive ser-vices more attractive to working parents by taking steps
to disassociate them from the cash assistance program.For example, the state’s child care program is calledWisconsin Shares, not W-2 child care, and the state’shealth insurance program for working families is calledBadgerCare.
Beyond work supports. In addition to traditional worksupports, states fund a range of activities with theirTANF and MOE allocations. Unlike AFDC, which re-quired extensive means testing for all its services, TANFallows states to provide services to families with incomesbelow 200 percent of poverty and beyond. In fact, thethird and fourth purposes of TANF—reducing out-of-wedlock pregnancies and encouraging the formation oftwo-parent families—are not restricted to needy families.
Some activities have a specific client base, for example, asubstance abuse treatment program. Other activities donot. A billboard campaign to reduce teen pregnancy maybe a very effective way of getting a message out, forexample, but it is impossible to count the number of teenswho see the billboard. TANF funding is also used inconcert with other funding sources to expand existingprograms to new groups of clients. With multiple fund-ing streams, it can be difficult to determine where tocount the clients served.
In Florida, as in Wisconsin, the majority of funding isspent on noncash services. Florida’s services that gobeyond work supports include programs for families atrisk of abuse and neglect, home visits for newborn chil-dren, services for parents at risk of substance abuse ormental illness, and support for domestic violence shel-ters. Some, but not all, of the families receiving theseservices also participate in Florida’s work-first program.Because Florida uses the TANF block grant rather thanMOE funds to pay for most of these services, the statedoes not have to provide data on the noncash casesserved.
Redefining “caseload”
Given the new workload associated with TANF, the toolby which we measure the program’s success—the cashassistance caseload—is incomplete. An overhaul of thedefinition of caseload has been slow to start for at leastfour reasons. First, the cash caseload is easy to count;states collect extensive data for eligibility determination.Second, the public already understands the definition ofcash caseload, since it is a holdover from AFDC. Third,continuing AFDC’s definition of caseload makes histori-cal comparisons possible. Fourth, coming up with a newdefinition of caseload is hard.
Redefining caseload to describe the full workload is dif-ficult in part because not all the state workload can becaptured in a case count. The time caseworkers dedicateto their cash cases and the changes in culture taking place
Table 1Florida Welfare Reform Mathematics
Adults
October 1996 150,533
Added after October 1996 +291,216
Left cash assistance before June 2001 -417,648
Remaining as of June 2001 24,101
Unduplicated count 441,749
Source: Florida Department of Children and Families.

Devolution | 21
in welfare offices across the country are not easily quan-tified.
Many of the work supports and other noncash servicescan be captured in a caseload count. The challenge here,however, is determining how to get enough information,particularly for short-term services, without becomingoverintrusive or creating an undue burden on states andtheir subcontractors. Many of the noncash services areprovided by small community-based groups, like domes-tic violence shelters, or by faith-based organizations,agencies that may lack the size or skill to undertakeextensive data reporting. The most important consider-ation, though, is that low-income families are not over-burdened by information requirements that discouragethose in need from using the available services.
Extending the current data requirement for MOE spend-ing to TANF seems like a reasonable start to redefiningthe caseload. Although some of these families would beduplicated with the assistance caseload, estimates of thenumber of families served would be a useful first steptoward understanding the new workload. In the future,unduplicated counts may be available for ongoing worksupports such as child care, postemployment educationand training, and general case management. States arelikely to keep data on these services already, especiallychild care. For noncash services without strict financialeligibility, such as a community literacy program, aggre-gate information about the number of families servedmay be enough. In fact, HHS could attach different datareporting requirements to different types of cases.
The first step in redefining caseload is eliminating theterm “nonassistance.” In many states, nonassistance cov-ers services essential to keeping parents in the workforceyet, as already implied, it is hard to rally support for anincrease in “nonassistance.” Dividing services into cashassistance and noncash services seems more appropriate.
Conclusion
In part because researchers, both in government and out,have held tight to the old definition of a “case” despitethe expanded the scope of welfare created by TANF in1996, we are missing the larger story of the 1996 welfarereform legislation.
One of the most powerful lessons of welfare reform is theimportance of signals. Continuing to judge the success ofa broad program by a small sliver of those served signalsthat the expanded role states have embraced is unimpor-tant. It also sends a potentially dangerous message tothose holding the purse strings—that the decline in cashassistance cases means a decline in workload, and there-fore a decline in funding needs. After six years, it is timeto stop referencing TANF as the program that replaced
AFDC and start referring to AFDC as the program priorto TANF. �
1To receive federal block grant funds, states are required to maintainfunding for qualified program expenditures at a level equivalent to atleast 80 percent of the state share of AFDC expenditures in federalFiscal Year 1994. If the state meets the work participation rate re-quirements, the MOE requirement drops to 75 percent. In the first fouryears of operation, all states met their MOE requirements.
2Financial help is not considered assistance if it lasts for less than fourmonths; is received in the form of a work subsidy to the employer; is arefundable earned income tax credit; or is an Individual DevelopmentAccount.
3Illinois, for example, uses segregated state funds to “stop the clock”for working parents receiving cash assistance. Under this policy,single-parent TANF families working 30 hours per week and two-parent families working 35 hours per week receive a cash grant with-out losing a month of TANF eligibility on their 60-month federallifetime limit. See State Policy Documentation Project World WideWeb site at http://www.spdp.org/tanf/separate_state_programs/ssp_findings.htm October 19, 2001.
4S. Bell and T. Douglas, Making Sure of Where We Started: StateEmployment and Training Systems for Welfare Recipients on the Eveof Federal Reform, Occasional Paper 37, Urban Institute, Washington,DC, April 2000.
5U.S. Department of Health and Human Services, Fiscal Year 2000Annual Report to Congress on the Temporary Assistance for NeedyFamilies Program, Administration for Children and Families, Wash-ington, DC.
6U.S. Department of Health and Human Services, Fiscal Year 1996Annual Report to Congress on the Aid to Families with DependentChildren Program, Administration for Children and Families, Wash-ington, DC. < http://www.acf.dhhs.gov/programs/ofa/cfc_fy96.htm >;Fiscal Year 2000 Annual Report.
7U.S. House of Representatives, Committee on Ways and Means, 2000Green Book, Washington, DC, p. 448.
8The rate of TANF cash assistance cycling varies by state. Accordingto an HHS report which looked at survey data from only four states,the proportion that ever returned for at least one month over the first12 months after exit ranged from 23 to 35 percent; J. Isaacs and M.Lyon, “Cross-State Examination of Families Leaving Welfare: Find-ings from the ASPE-Funded Leavers Studies,” Office of the AssistantSecretary for Planning and Evaluation, Department of Health andHuman Services, Washington, DC, November 6, 2000. An UrbanInstitute report found that 21.9 percent of those who left welfarebetween 1997 and 1999 returned, as did 29.1 percent of those who leftwelfare between 1995 and 1997; P. Loprest, How Are Families ThatLeft Welfare Doing? A Comparison of Early and Recent WelfareLeavers, New Federalism: National Survey of America’s Families,Report B-36, Urban Institute, Washington, DC, 2001.

22 | Reauthorizing TANF
Welfare reform and recession: Can the stateshandle both?Howard Chernick and Andrew Reschovsky
Howard Chernick is Professor of Economics, HunterCollege and the Graduate Center, City University of NewYork, and Andrew Reschovsky is Professor of Agricul-tural and Applied Economics and Public Affairs at theUniversity of Wisconsin–Madison. Both are IRP affili-ates.
The Personal Responsibility and Work Opportunity Rec-onciliation Act (PRWORA) of 1996 marked a fundamen-tal change in the role state governments play in the finan-cial support of their low-income residents. Under the oldwelfare system, Aid to Families with Dependent Chil-dren (AFDC), all families meeting certain eligibility cri-teria were entitled to cash payments that were jointlyfinanced by the states and the federal governmentsthrough a system of matching grants. Thus a portion ofevery dollar that a state government paid to a low-incomefamily came directly from the federal government. Thenew welfare system, Temporary Assistance for NeedyFamilies (TANF), ended federal entitlement to welfarepayments, shifted the responsibility for ensuring thewell-being of low-income families to state governments,and limited the role of the federal government to provid-ing each state with a fixed amount of money in the formof a block grant and imposing certain restrictions oneligibility for cash transfers.
The dramatic reduction in state public assistancecaseloads since their peak in 1994 (nationally, by 57percent) reflects both a strong economy and changes inincentives and state policies.1 Because the amount ofeach state’s TANF block grant allocation has remainedlargely unchanged since 1996, the falling caseloads havefreed up funds for other programs, some designed toassist low-income families, such as child care, housingassistance, and job training, and others less targeted tothe needy.
But in much the same way as the federal budgetary situa-tion has shifted very rapidly from large surpluses toprojected deficits, state governments’ fiscal outlookshave also changed dramatically for the worse during2001. Revenue collections are lower that anticipated in44 states.2 Unlike the federal government, state govern-ments are required to operate with balanced budgets. Theslowing economy throughout 2001 and especially sinceSeptember 11 has forced nearly all states to reduce their
revenue forecasts and to begin considering steps to pre-vent budget deficits during the current fiscal year.
This article addresses two questions. First, in periods ofrecession or slow economic growth, will state govern-ments be able to meet the needs of their low-incomeresidents for public assistance? Recessions lead to joblosses and make it increasingly difficult for those withoutjobs, especially those with little experience and educa-tion, to find new jobs. Thus, a slowing economy not onlyreduces state tax revenue, but also increases the need forfiscal assistance for low-income state residents.
Second, will states be willing to devote adequate re-sources to programs that provide either cash assistance orsocial services to their needy populations? In periods offiscal stress, can we predict whether state governmentswill place a high priority on preventing holes in their“social safety nets” or will choose instead to satisfy otherclaims on state resources?
The economic slowdown and state fiscal health
Predicting the impact of recessions on state tax revenuesis notoriously difficult. Simple rules which suggest thattax revenues are more sensitive to economic performancein states that rely more heavily on personal and corporateincome taxes than on sales and excise taxes often lead toincorrect predictions. In a state that excludes most neces-sities from its sales tax base, the sales tax may be highlysensitive to economic fluctuations, whereas in a statewith a flat-rate income tax that excludes capital gains,income tax revenue may be fairly stable during an eco-nomic downturn.
Predicting the magnitude of budget deficits in individualstates is also complicated by factors affecting singlestates or regions of the country. Despite the promise ofsubstantial amounts of federal aid, New York State’sfiscal situation will be deeply affected by the terroristattacks on the World Trade Center. California may face abudget deficit of nearly $10 billion next year if agree-ment cannot be reached on the long-run financing ofenergy purchases during the state’s electrical energy cri-sis.
In past recessions we have observed a great deal of varia-tion in the fiscal responses of state governments.3 Ingeneral, state governments tend to respond to mild eco-nomic slowdowns by cutting state government spending;currently, political leaders in many states are pointing tospending cuts, not tax increases, as a solution.4 Only
Focus Vol. 22, No. 1, Special Issue, 2002

Devolution | 23
when revenue declines become more severe do statesconsider tax increases.
Two important factors in predicting whether the currenteconomic slowdown will result in cuts in spending onsocial welfare programs are the existence of state “rainyday” or stabilization funds, and substantial balances ofunobligated TANF funds.
Rainy day funds
Although 45 states have budget stabilization funds, forover three-quarters of the states these funds would beinadequate to prevent significant cuts in state programsor substantial tax increases if the United States were toface a recession like the mild recession of the early1990s.5
The aggregate amount of money in state budget stabiliza-tion funds declined from $28.8 billion in fiscal year (FY)2000 to $22.6 billion in FY 2002. This amount is onlyabout 3 percent of the $750 billion in revenue that statesare estimated to raise in FY 2002.6 In FY 2001, theaverage stabilization fund per capita was $95, but therewere large differences across the states; 7 states had fundbalances under $2 per capita and 13 states had balancesthat exceeded $100 per capita.7
Unobligated TANF funds
The 1996 welfare reform legislation included a provisionthat the unspent portion of each state’s annual TANFallocation would be held by the federal government in aspecial fund that each state could access in future years.One way in which state governments can ensure that theyhave more TANF funds to spend if an economic down-turn significantly increases the need is to treat unspentTANF funds as a “rainy day” fund; the actual fundsremain with the federal treasury until they are needed. Atthe end of the first half of federal FY 2001, there were$8.3 billion dollars of unspent TANF funds for all 50states plus the District of Columbia, equal to 11 percentof total TANF grants from the beginning of the program,and 48 percent of the FY 2001 TANF allocation.8
One measure of the ability of states to continue to pro-vide fiscal assistance and services to their low-incomepopulations in an economic downturn is the sum of theirgeneral purpose budget stabilization fund and their un-spent TANF balances. On the whole, states with largeunspent TANF balances also tend to have large stabiliza-tion fund balances. In fiscal year 2001, the per capitavalue of the sum of the two funds ranged from $2.40 inOregon to $279 in Massachusetts.9 Among the sevenstates with the largest number of TANF recipients (55percent of the nationwide total), Texas and Illinois havetotal per capita balances in the two funds of under $20,New York has a below-average balance of $104, andCalifornia, Ohio, Pennsylvania, and Michigan haveabove-average per capita balances.
Will demand for assistance rise?
There seems little doubt that a recession will limit theemployment opportunities available to recent welfare re-cipients, although we do not know how much employ-ment will decline.10 The fiscal impact of rising unem-ployment rates and falling incomes depends in part onhow many newly unemployed workers will qualify forunemployment insurance (UI), and the extent to whichunemployment benefits replace lost wages.
During past recessions, insufficient work experience,low levels of earnings, and unavailability for full-timework because of family responsibilities disqualified mostlow-income workers from eligibility for UI. During thenext (or current) recession, eligibility for UI among low-income workers should be higher than in the past, but itappears unlikely that more than 40 percent of all unem-ployed former welfare recipients will receive unemploy-ment compensation.11 Moreover, the UI replacement ratefor lost wages is now quite low, averaging only 33.1percent in 1999.12
TANF funds have been used by many states for childcare, child welfare services, job training, health care,transportation, and housing for the working poor. Al-though estimates are hard to make, it is likely that thefinancial costs of serving the existing population of eli-gibles will rise unless these programs are eliminated orcurtailed, because lower incomes will increase the re-quired state contribution. The overall fiscal effect, how-ever, also depends on the change in the number of indi-viduals eligible for noncash assistance. For example, ifeligibility for subsidized child care is linked to employ-ment, the loss of jobs may actually reduce eligibility anddemand for child care.
How are state governments likely to respond to theseincreased demands?
State government fiscal responses to increasedneeds
One of the major advantages of the pre-1996 system ofmatching grants for AFDC was that federal payments tothe states automatically increased if more people becameeligible for cash assistance. Matching grants also re-duced the tax price of welfare spending relative to otherforms of state spending. Thus one dollar of increasedspending on a state university generally cost state tax-payers a full dollar, whereas one dollar of increasedspending on welfare cost less than one dollar of state taxrevenues.
The conversion of federal spending on cash assistanceinto block grants requires that state governments bear amuch greater share of the incremental costs of maintain-ing an economic and social safety net for their citizens.
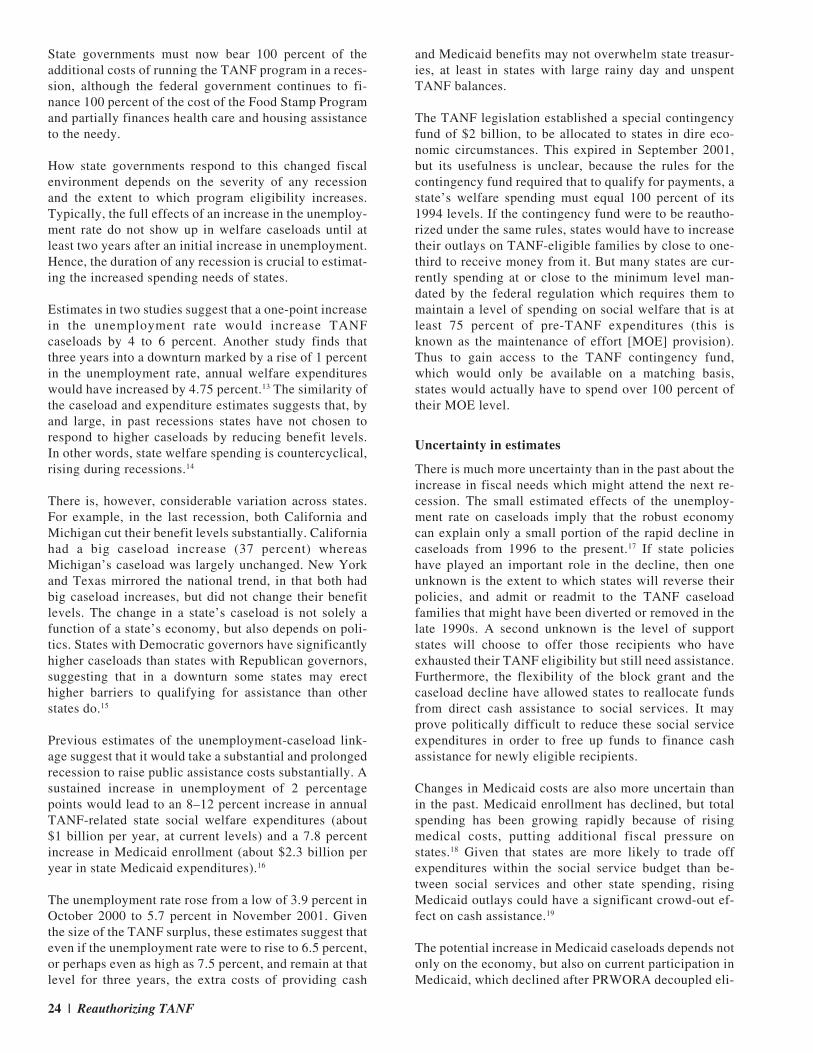
24 | Reauthorizing TANF
State governments must now bear 100 percent of theadditional costs of running the TANF program in a reces-sion, although the federal government continues to fi-nance 100 percent of the cost of the Food Stamp Programand partially finances health care and housing assistanceto the needy.
How state governments respond to this changed fiscalenvironment depends on the severity of any recessionand the extent to which program eligibility increases.Typically, the full effects of an increase in the unemploy-ment rate do not show up in welfare caseloads until atleast two years after an initial increase in unemployment.Hence, the duration of any recession is crucial to estimat-ing the increased spending needs of states.
Estimates in two studies suggest that a one-point increasein the unemployment rate would increase TANFcaseloads by 4 to 6 percent. Another study finds thatthree years into a downturn marked by a rise of 1 percentin the unemployment rate, annual welfare expenditureswould have increased by 4.75 percent.13 The similarity ofthe caseload and expenditure estimates suggests that, byand large, in past recessions states have not chosen torespond to higher caseloads by reducing benefit levels.In other words, state welfare spending is countercyclical,rising during recessions.14
There is, however, considerable variation across states.For example, in the last recession, both California andMichigan cut their benefit levels substantially. Californiahad a big caseload increase (37 percent) whereasMichigan’s caseload was largely unchanged. New Yorkand Texas mirrored the national trend, in that both hadbig caseload increases, but did not change their benefitlevels. The change in a state’s caseload is not solely afunction of a state’s economy, but also depends on poli-tics. States with Democratic governors have significantlyhigher caseloads than states with Republican governors,suggesting that in a downturn some states may erecthigher barriers to qualifying for assistance than otherstates do.15
Previous estimates of the unemployment-caseload link-age suggest that it would take a substantial and prolongedrecession to raise public assistance costs substantially. Asustained increase in unemployment of 2 percentagepoints would lead to an 8–12 percent increase in annualTANF-related state social welfare expenditures (about$1 billion per year, at current levels) and a 7.8 percentincrease in Medicaid enrollment (about $2.3 billion peryear in state Medicaid expenditures).16
The unemployment rate rose from a low of 3.9 percent inOctober 2000 to 5.7 percent in November 2001. Giventhe size of the TANF surplus, these estimates suggest thateven if the unemployment rate were to rise to 6.5 percent,or perhaps even as high as 7.5 percent, and remain at thatlevel for three years, the extra costs of providing cash
and Medicaid benefits may not overwhelm state treasur-ies, at least in states with large rainy day and unspentTANF balances.
The TANF legislation established a special contingencyfund of $2 billion, to be allocated to states in dire eco-nomic circumstances. This expired in September 2001,but its usefulness is unclear, because the rules for thecontingency fund required that to qualify for payments, astate’s welfare spending must equal 100 percent of its1994 levels. If the contingency fund were to be reautho-rized under the same rules, states would have to increasetheir outlays on TANF-eligible families by close to one-third to receive money from it. But many states are cur-rently spending at or close to the minimum level man-dated by the federal regulation which requires them tomaintain a level of spending on social welfare that is atleast 75 percent of pre-TANF expenditures (this isknown as the maintenance of effort [MOE] provision).Thus to gain access to the TANF contingency fund,which would only be available on a matching basis,states would actually have to spend over 100 percent oftheir MOE level.
Uncertainty in estimates
There is much more uncertainty than in the past about theincrease in fiscal needs which might attend the next re-cession. The small estimated effects of the unemploy-ment rate on caseloads imply that the robust economycan explain only a small portion of the rapid decline incaseloads from 1996 to the present.17 If state policieshave played an important role in the decline, then oneunknown is the extent to which states will reverse theirpolicies, and admit or readmit to the TANF caseloadfamilies that might have been diverted or removed in thelate 1990s. A second unknown is the level of supportstates will choose to offer those recipients who haveexhausted their TANF eligibility but still need assistance.Furthermore, the flexibility of the block grant and thecaseload decline have allowed states to reallocate fundsfrom direct cash assistance to social services. It mayprove politically difficult to reduce these social serviceexpenditures in order to free up funds to finance cashassistance for newly eligible recipients.
Changes in Medicaid costs are also more uncertain thanin the past. Medicaid enrollment has declined, but totalspending has been growing rapidly because of risingmedical costs, putting additional fiscal pressure onstates.18 Given that states are more likely to trade offexpenditures within the social service budget than be-tween social services and other state spending, risingMedicaid outlays could have a significant crowd-out ef-fect on cash assistance.19
The potential increase in Medicaid caseloads depends notonly on the economy, but also on current participation inMedicaid, which declined after PRWORA decoupled eli-

Devolution | 25
gibility for cash assistance and Medicaid. If an increasein welfare receipt brings with it an increase in Medicaidparticipation, than the growth in overall state Medicaidcosts is likely to be greater than previously estimated.20
State fiscal incentives
Under AFDC, the state share of the total cost of assis-tance varied from 13 to 50 percent; in the average state itwas 40 percent. With the enactment of TANF and thereplacement of matching aid with a block grant, this cost(call it the “marginal price of assistance”) increased froman average of 40 cents to a full dollar.
What effect will this increase in the marginal price ofcash assistance have on state willingness to provide ben-efits to those newly eligible? Economic theory predictsthat a block grant of equal magnitude to the grant that astate receives under a matching regime should lead thestate to reduce spending on cash assistance. The size ofthe cuts has, however, been the subject of some debate.The latest studies suggest that states will be unwilling tocut benefits very much, even if faced with a substantialincrease in caseloads. But we would also expect that anybenefit cut that does occur is most likely to happen dur-ing a recession, when fiscal pressures are heightened.21
Another way of examining this issue is to consider theper capita cost to a state of raising benefits by one dollarfor all welfare recipients; we might call this the “mar-ginal cost of benefits.” Our estimates suggest that in1996 an increase of $100 in the cash benefit for eachwelfare recipient would have required, on average, a$3.07 per capita increase in state welfare funding. Butafter 1996, the marginal cost of increasing welfare ben-efits by $100 per recipient rose by $1.84 per capita, a 60percent increase.22
The increase in the marginal cost of welfare benefitsleads one to expect that state governments would respondby reducing benefit levels. In fact, between 1996 and2000, 20 states increased and 3 states decreased theirmaximum TANF benefit levels; in the remaining states,benefit levels remained unchanged.23 Thus, although thevalue of benefits in many states has been eroded byinflation, the sharp drop in benefit levels (known as the“race to the bottom”) that some predicted has not oc-curred. However, the real test of whether states will resistthe incentive to lower benefit levels will come if andwhen there is a significant increase in welfare caseloads.
Maintenance of Effort (MOE) requirements
The federal MOE requirements are but one example ofthe many and complicated incentives built into the TANFlaw. If states fail to meet these requirements, they loseTANF funds dollar-for-dollar, and must make up for thespending deficit by the next fiscal year. If state spendingis increasing over time because of rising population andincome, then the MOE becomes a smaller and smaller
percentage of what states would have spent anyway, andit has a diminishing effect on state budgeting decisions.
Because of the sharp and continuous drop in caseloadsfrom 1996 to 2001, however, the MOE requirement hasbecome increasingly important. If states had kept theirbenefit levels per recipient the same as they were from1992 to 1994, and paid the same share of benefits as theydid under the AFDC matching rate regime, they wouldnow be spending only 38 percent of what they spent in1994—at least 37 percent below the MOE requirement.
How have states responded to this increasingly tight con-straint on their fiscal decisions? An initial response wasto spend state dollars first, “banking” unused TANFfunds for future spending without penalty. This, coupledwith the uncertainty over what actually constituted al-lowed TANF expenditures, explains why initially manystates built up large TANF balances. The latest data indi-cate that most states are now fully obligating their annualTANF allocation, and that a few states have begun todraw down past balances.24
In FY 2000, 22 states spent just enough to satisfy theMOE requirement, and many other states were only a fewpercentage points above.25 Since states determine TANFeligibility through their choice of the need and paymentstandards, state policy actually helps to determinewhether state spending can count toward the MOE re-quirement. If states tighten their TANF eligibility stan-dards too severely, causing the caseload to decline veryrapidly, then they must put more and more funds intosocial services to meet the MOE requirement.
The MOE requirement was included to limit the opportu-nity for fiscal substitution by the states. Substitutioncould happen in a couple of ways. If states were to cuttheir benefit levels, or not raise them as fast as theywould have under the matching grant, federal fundswould gradually wind up providing a higher share oftotal cash assistance than under the AFDC program.States could also use TANF funds for other social ser-vices and allow their own contributions to these servicesto erode.
New York state provides an example of both kinds offiscal substitution. In fiscal year 1998, the state used$200 million of TANF funds to replace state funds forcash assistance.26 New York also chose to put a portion ofits TANF funds into child care and the state EarnedIncome Tax Credit, and at least some of these fundsprobably substituted for the state’s own spending onthese programs.
It is clear that states have reallocated substantial amountsof funds from cash assistance to services to recipientsand the working poor. This shift clearly reflects the gen-eral reorientation of the welfare system toward work, andthe provision of services to support work, as well as the

26 | Reauthorizing TANF
constraints of the MOE requirements. In some states, theallocation of surplus block grant funds from cash toservices has become part of the baseline of funding forthese services. In general, states have become quite de-pendent on the TANF surplus to fund the increase insocial services.
Should the surplus diminish as caseloads increase, stateswill face an unpleasant fiscal choice between cash assis-tance and social services. States that have allocated sub-stantial portions of their own funds to social services forTANF-eligible recipients may find it difficult to with-draw those funds in order to provide cash benefits tonewly eligible TANF recipients.
Conclusions and recommendations forreauthorization
In this article, we have explored the question of whetherstate governments, when facing an economic slowdown,will be willing and able to meet the rising needs of theirlow-income residents for cash public assistance and forvarious social services. It is difficult to predict the mag-nitude of the increase in costs that states will face inorder to maintain services for their low-income popula-tions. In large part, predictions depend on answers tofour questions:
� What impact will an economic slowdown have on theunemployment rate of low-income, low-skill work-ers—will a large number of former welfare clientsface unemployment?
� What proportion of the newly unemployed workerswill be covered by unemployment compensation, forhow long, and what share of their after-tax wages willbe covered?
� By how much will rising unemployment and fallingincomes increase Medicaid eligibility and state gov-ernment costs?
� To what extent will falling incomes lead to increasesin state government costs for subsidized social ser-vices, such as child care?
Our tentative conclusion is that, on average, states shouldbe able to weather the expected decline in state tax rev-enues and increases in costs without having substantiallyto reduce the access of their low-income residents topublic assistance. This conclusion is based in part on theexistence in many states of relatively large balances ofunspent TANF funds, and in some cases, general-pur-pose rainy day funds. We emphasize, however, that theeffects of an economic recession will vary substantiallyacross states. Some states have small rainy day fundbalances and are likely to face large increases in thedemand for cash assistance and social services.
There is certainly no guarantee that even states in rela-tively strong fiscal health will choose to meet the risingdemands of their low-income populations. The behaviorof states during recessions in the 1980s and early 1990sprovides little help in predicting how states will behavein future recessions, because the 1996 welfare reform hasso fundamentally changed the “rules of the game.” Like-wise, the welfare-related decisions states have madesince 1996 provide us with limited information abouthow they will behave during a recession. The combina-tion of a fixed block grant, a very strong economy, largedrops in welfare caseloads, and quite stringent MOEprovisions made it possible for most states to expandprograms directed toward their low-income populations,but they may not choose to maintain existing levels offiscal support in the absence of rapid economic growth.
In light of our discussion, we offer the following sugges-tions to be considered in the reauthorization debate.
Capacity to build TANF rainy day balances
The interaction of four unrelated events has created alarge, unanticipated fiscal cushion of unspent TANF bal-ances that should forestall large cuts in public assistanceto the neediest state residents:
• To gain sufficient political support for the passage ofPRWORA, the block grants to states were set at levelsequal to federal AFDC allocations in the early 1990s,a period with relatively high caseloads.
• The rapid economic growth that lasted throughout thesecond half of the 1990s contributed to rapidly fallingwelfare caseloads.
• The falling caseloads combined with the stringentMOE provisions in the welfare legislation forcedstates to increase the amount of state money theydevoted to each welfare recipient.
• The long time period before issuance of federal regu-lations for spending TANF dollars led to state uncer-tainty and delay in the spending of federal TANFfunds.
The lesson we draw from this piece of history is thatCongress, in reauthorizing welfare legislation, shouldexplicitly authorize sufficient funds so that in periods ofeconomic growth, state governments will have the re-sources to build up balances of unspent TANF dollarsthat they can hold for use in periods when the economyslows and demand for welfare increases.
Retention of the MOE provision
Without this provision, state governments would almostcertainly have shifted more resources out of poverty-related activities, and would have been much less likelyto “bank” some of their TANF grant allocations for fu-ture use.
Devolution | 27
Thus, in reauthorizing TANF, state governments shouldbe given a strong incentive to maintain their existingspending on programs that benefit their low-incomepopulations. The creation of an effective “work-basedsystem” that will, over time, lift former welfare clientsout of dependence and poverty requires a substantialinvestment in ancillary services such as child care, trans-portation, and skills training. These programs are un-likely to receive state fiscal support, especially in timesof sluggish economic growth, unless federal welfare leg-islation prevents state governments from shifting fundsto other uses.
Establishment of an adequate contingency fund
The original TANF legislation established a relativelysmall contingency fund that was, in our opinion, seri-ously flawed. The TANF legislation made access to con-tingency funds extremely difficult, making it unlikelythat any state would have chosen to avail itself of thefund.
In reauthorizing the welfare legislation, the Congressshould recognize that state governments will need addi-tional funds when recessions occur. Congress should re-new the contingency fund, but with a rule that access tothe fund is triggered by some indicator of economicactivity, such as a specified increase in the state unem-ployment rate, that is independent of state governmentactivity.
More ample fiscal reporting requirements
One goal in designing reporting requirements for a reau-thorized welfare bill should be to allow the federal gov-ernment to trace as clearly as possible the impact ofwelfare reform on state spending for low-income per-sons. It is important to be able to gather data that allowsone to determine the extent to which states are able tosubstitute TANF funds for their own spending on cashassistance. We would like to have data that will let usknow whether TANF funds have contributed to staterainy day funds, or whether states cut taxes more thanthey otherwise would have because of the availability ofthe TANF surplus.
To be able to better track TANF spending, funding shifts,and fiscal substitution, we need consistent data across allstates on total state spending on the various categories ofsocial services. The U.S. Census Bureau should considerrefining the broad category of spending called “socialwelfare” with the goal of providing uniform definitionsfor spending on specific services such as child care andchild welfare services. �
1The data on TANF caseloads are from the Department of Health andHuman Services, Administration for Children and Families Web site,< http://www.acf.dhhs.gov/news/stats/caseload.htm >.
2National Conference of State Legislatures, State Fiscal Outlook forFY 2002; October Update, Fiscal Affairs Program, NCSL, Denver,CO, October 31, 2001.
3H. Chernick and A. Reschovsky, “The Distributional Politics of Fis-cal Adjustment: A Case Study of Four Northeastern States,” PublicBudgeting & Finance 10 (Fall 1990): 6–23.
4Nelson A. Rockefeller Institute of Government, “Fiscal Trouble Up-date,” unpublished paper, Albany, October 4, 2001.
5I. Lav and A. Berube, When It Rains It Pours; A Look at the Adequacyof State Rainy Day Funds and Budget Reserves, Center on Budget andPolicy Priorities, Washington, DC, March 1999.
6National Association of State Budget Officers, The Fiscal Survey ofthe States: June 2001, National Governors Association and the Na-tional Association of State Budget Officers, Washington, DC, 2001.Available at<http://www.nasbo.org/Publications?PDFs/FSJUN2001.pdf >.
7The average fund balance per capita was $85 if we exclude Alaska.J. Holahan and B. Garrett, “Rising Unemployment and Medicaid,”Health Policy Online, No. 1, Urban Institute, Washington, DC, Octo-ber 16, 2001. Available at< http://www.urban.org/authors/garrett.html >.
8Z. Neuberger and E. Lazere, Analysis of TANF Spending Through theMiddle of Federal Fiscal Year 2001, Center on Budget and PolicyPriorities, Washington, DC, September 2001. Available at < http://www.cbpp.org/9-28-01wel.htm >
9We exclude Alaska; because of its oil revenues it has a stabilizationfund balance of over $4,500 per capita, an amount that exceeds thesize of its general fund budget.
10H. Holzer, Unemployment Insurance and Welfare Recipients: WhatHappens When the Recession Comes? New Federalism: Issues andOptions for States, No. A-46, Urban Institute, Washington, DC, De-cember 2000.
11Holzer, Unemployment Insurance.
12Economic Policy Institute, “Unemployment Insurance Benefits Stateby State,” press release of October 3, 2001. In New York and Califor-nia, the two states with the largest welfare caseload, the replacementrate is even less than the average.
13G. Wallace and R. Blank, “What Goes Up Must Come Down,” D.Figlio and J. Ziliak, “Welfare Reform, the Business Cycle, and theDecline in AFDC Caseloads,” and P. Levine, “Cyclical Welfare Costsin the Post-Reform Era,” all in Economic Conditions and WelfareReform, ed. S. Danziger (Kalamazoo, MI: W.E. Upjohn Institute forEmployment Research, 1999), pp. 49–90, 17–48, 249–74 respectively.
14R. Dye and T. McGuire, “State Fiscal Systems and Business Cycles:Implications for State Welfare Spending When the Next RecessionOccurs,” Discussion Paper 99-04, Urban Institute, Washington, DC,June 1999.
15Wallace and Blank, “What Goes Up.”
16Holahan and Garrett, “Rising Unemployment.”
17Rebecca Blank concludes that “the economy seems to have matteredless in the post-1996 period, and welfare policy has mattered more inreducing caseloads than it did in the earlier period.” See “DecliningCaseloads/Increased Work: What Can We Conclude about the Effectsof Welfare Reform?” in Conference Proceedings: Welfare ReformFour Years Later: Progress and Prospects, Federal Reserve Bank ofNew York Economic Policy Review 7 (September 2001): 25–36.
18The federal government pays a share of all Medicaid spending, withthe federal share ranging from 50 percent in the nation’s 10 richeststates to 76 percent in the poorest state. See the Federal Register,November 17, 2002. Available at < http://frwebgate.access.gpo.gov/cgi-bin/getdoc.cgi?dbname=2000_register&docid=00-29112-filed >.

28 | Reauthorizing TANF
19K. Baicker, “Government Decision-Making and the Incidence ofFederal Mandates,” Journal of Public Economics 82 (November2001): 147–94.
20L. Ku and B. Garrett, How Welfare Reform and Economic FactorsAffected Medicaid Participation: 1984–96, Assessing the New Feder-alism, Discussion Paper 00-01, Urban Institute, Washington, DC, Feb-ruary 2000; B. Garrett and J. Holahan, Welfare Leavers, MedicaidCoverage, and Private Health Insurance, New Federalism: NationalSurvey of America’s Families, No. B-13, Urban Institute, Washington,DC, March 2000. Some contrary evidence from New York and Wis-consin suggests that many of those no longer on public assistance havein fact retained their Medicaid coverage. In a recent study of multipleprogram receipt in New York City, Chernick and Cordelia Reimersfind that between 1994–95 and 1997–99, among households most atrisk of needing public assistance, the rate of Medicaid receipt has notdeclined, even though receipt of cash assistance is substantially lower.A similar result has been found by Cancian and colleagues for formerwelfare recipients in Wisconsin. However, this result may not apply asstrongly in other states. See H. Chernick and C. Reimers, “WelfareReform and New York’s Low Income Population,” in ConferenceProceedings: Welfare Reform Four Years Later: Progress and Pros-pects, Federal Reserve Bank of New York Economic Policy Review 7
Order forms for Focus and
other Institute publications are
at the back.
Subscribe now to our Discussion Paper
Series and Reprint Series.
Please let us know if you change
your address so we can continue to
send you Focus.
(September 2001): 83–97; M. Cancian, D. Meyer, and C-F. Wu, “Pro-gram Participation of Mothers on W-2,” in Child Support Demonstra-tion Evaluation, Phase 1, Final Report, ed. D. Meyer and M. Cancian,Institute for Research on Poverty, University of Wisconsin–Madison,2001.
21H. Chernick, “Federal Grants and Social Welfare Spending: Do StateResponses Matter?” National Tax Journal 53 (March 2000): 143–52.
22If caseloads had not declined dramatically in the period followingthe enactment of TANF, our calculations suggest the increase wouldhave been 150 percent.
23G. Rowe and T. Roberts, Welfare Rules Databook: State TANFPolicies as of July 2000, Urban Institute, Washington, DC, November2001.
24Neuberger and Lazere, Analysis of TANF Spending.
25E. Lazere, Unspent TANF Funds at the End of Federal Fiscal Year2000, Center on Budget and Policy Priorities, Washington, DC, Febru-ary 23, 2001.
26New York City Independent Budget Office, “New York’s IncreasingDependence on the Welfare Surplus,” Fiscal Brief, August 2001.

Devolution | 29
Social policy and the macroeconomy:What drives welfare caseloads?
attributed to both the longest economic expansion in U.S.history and radical changes in social policy. Among thepolicy changes two stand out: expansions in the EarnedIncome Tax Credit (EITC), which made work more at-tractive, and welfare reform, implemented through state-level waivers from federal rules in the early 1990s andthrough federal legislation in 1996. Harmony of opinionceases, however, when discussion turns toward deter-mining how much to credit the economy and how muchto credit policy for the rapid and far-reaching changes.
The research community has offered policymakers twocompeting explanations for the relative roles of theeconomy and of policy in accounting for caseload de-clines. In the first group are studies which conclude thatthe economy was the leading contributor to caseloaddeclines, and that the aggregate impact of welfare reform(excluding the EITC expansions) was minimal, espe-cially during the waiver period. For example, DavidFiglio, Elizabeth Davis, Laura Connolly, and I estimatethat about two-thirds of the caseload decline during thewaiver period (1993–96) can be attributed to theeconomy and very little to the overall impact of welfarewaivers, which were in place in about 35 states by theend of 1996. However, we find that the impact of thewelfare waivers varied widely across states. Some waiv-ers, such as time limits and responsibility measures, ledto caseload declines and others, such as higher earningsdisregards and asset limits, led to caseload increases. Inthe aggregate, these effects canceled each other out.When we extended our earlier study through 1998, wel-fare policy appeared modestly to reduce caseloads, butthe aggregate effect of welfare reform was still small inrelation to the impact of the economy.3
In the second group are studies concluding that theeconomy mattered, but that, in the aggregate, welfarereform also contributed to caseload declines (modestly insome cases, substantially in others). Representative ofthis group is the widely publicized study by thePresident’s Council of Economic Advisers (CEA), whichfound that from 1993 to 1996 the macroeconomy ac-counted for 44 percent and welfare waivers for 31 per-cent of the decline in AFDC caseloads. Updating thestudy two years later, the CEA found that welfare reformaccounted for 36 percent of the decline in caseloadsbetween 1996 and 1998.4
Caseloads are a dynamic process
Why the discrepancy? David Figlio and I addressed thisquestion head-on by conducting a step-by-step reconcili-
James P. Ziliak
James P. Ziliak is Associate Professor of Economics,University of Oregon, and an IRP affiliate.
In astonishment, welfare commentators, policymakers,and researchers witnessed welfare caseloads first soarand then decline over the past decade.1 Between 1990and 1994 the number of families receiving assistancefrom Aid to Families with Dependent Children (AFDC)exploded by 27 percent; between 1994 and 1999 thenumber plunged by nearly 50 percent. Changes in FoodStamp Program caseloads were equally dramatic, in-creasing by 42 percent in the early 1990s and then fallingover 30 percent in the last half of the decade. Observersof welfare are very far from agreeing about the reasonsunderlying the caseload changes. Yet if we are to craft amore informed fiscal policy, we must gain greater insightinto the determinants of welfare caseloads. This is themore urgent because Congress will soon begin deliberat-ing the reauthorization of Temporary Assistance forNeedy Families (TANF), the cash assistance programintegral to the 1996 welfare reforms, and of the FoodStamp Program.
If, for example, the recent caseload declines are largelythe result of strong macroeconomic performance, thenstates that failed to save for a “rainy day” may facedifficult fiscal constraints as the economy takes a signifi-cant recessionary turn. If, in contrast, caseload declinesare the result of social policy and respond only weakly tomacroeconomic conditions, then the surpluses in manystate welfare budgets are likely to persist even into thecurrent economic slowdown. In particular, should Con-gress decide to tie state block grants to the current levelof caseloads, rather than to the record levels of 1992–95as current policy dictates, then any surplus would be“taxed” away during the reauthorization debate. Indeed,state surpluses could rapidly turn into deficits if Con-gress were to cut block grants during the present eco-nomic downturn because, as detailed below, welfarecaseloads are highly cyclically sensitive.
What drives caseload declines?
The remarkable developments in welfare caseloads in the1990s have prompted a flurry of research, with primaryemphasis on the declines after 1993.2 Researchers gener-ally agree that the bulk of the caseload decline can be
Focus Vol. 22, No. 1, Special Issue, 2002
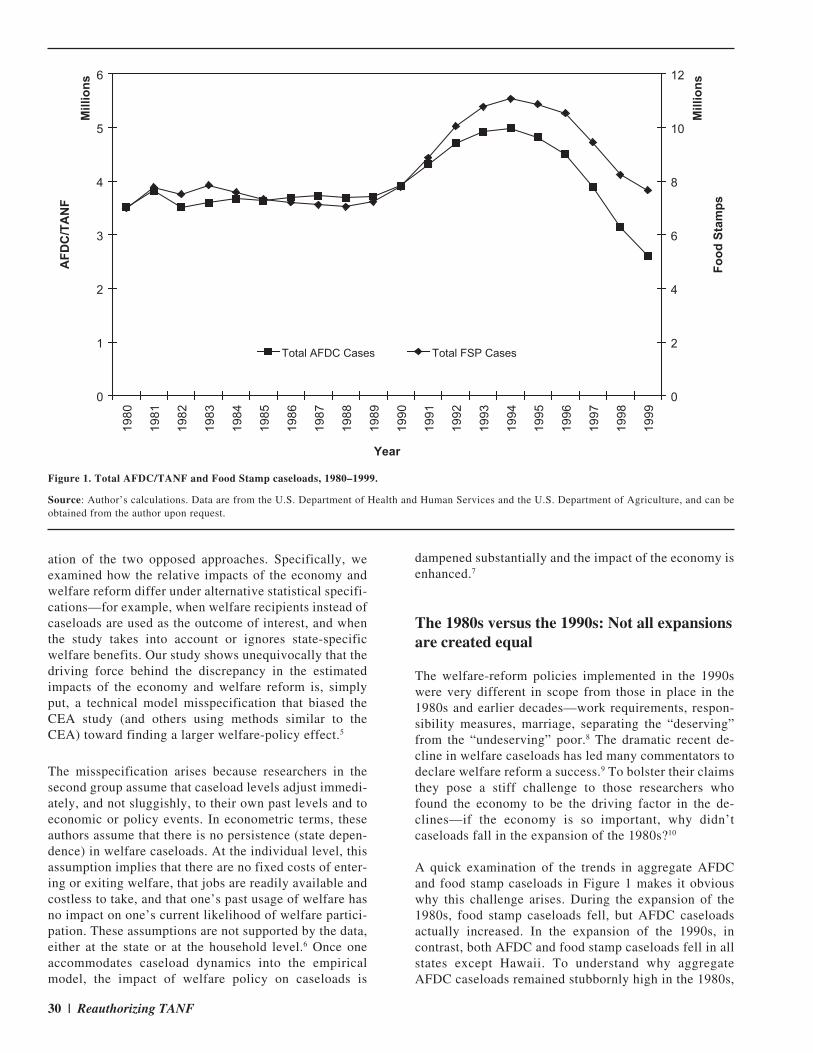
30 | Reauthorizing TANF
ation of the two opposed approaches. Specifically, weexamined how the relative impacts of the economy andwelfare reform differ under alternative statistical specifi-cations—for example, when welfare recipients instead ofcaseloads are used as the outcome of interest, and whenthe study takes into account or ignores state-specificwelfare benefits. Our study shows unequivocally that thedriving force behind the discrepancy in the estimatedimpacts of the economy and welfare reform is, simplyput, a technical model misspecification that biased theCEA study (and others using methods similar to theCEA) toward finding a larger welfare-policy effect.5
The misspecification arises because researchers in thesecond group assume that caseload levels adjust immedi-ately, and not sluggishly, to their own past levels and toeconomic or policy events. In econometric terms, theseauthors assume that there is no persistence (state depen-dence) in welfare caseloads. At the individual level, thisassumption implies that there are no fixed costs of enter-ing or exiting welfare, that jobs are readily available andcostless to take, and that one’s past usage of welfare hasno impact on one’s current likelihood of welfare partici-pation. These assumptions are not supported by the data,either at the state or at the household level.6 Once oneaccommodates caseload dynamics into the empiricalmodel, the impact of welfare policy on caseloads is
dampened substantially and the impact of the economy isenhanced.7
The 1980s versus the 1990s: Not all expansionsare created equal
The welfare-reform policies implemented in the 1990swere very different in scope from those in place in the1980s and earlier decades—work requirements, respon-sibility measures, marriage, separating the “deserving”from the “undeserving” poor.8 The dramatic recent de-cline in welfare caseloads has led many commentators todeclare welfare reform a success.9 To bolster their claimsthey pose a stiff challenge to those researchers whofound the economy to be the driving factor in the de-clines—if the economy is so important, why didn’tcaseloads fall in the expansion of the 1980s?10
A quick examination of the trends in aggregate AFDCand food stamp caseloads in Figure 1 makes it obviouswhy this challenge arises. During the expansion of the1980s, food stamp caseloads fell, but AFDC caseloadsactually increased. In the expansion of the 1990s, incontrast, both AFDC and food stamp caseloads fell in allstates except Hawaii. To understand why aggregateAFDC caseloads remained stubbornly high in the 1980s,
0
1
2
3
4
5
6
19
80
19
81
19
82
19
83
19
84
19
85
19
86
19
87
19
88
19
89
19
90
19
91
19
92
19
93
19
94
19
95
19
96
19
97
19
98
19
99
Mil
lio
ns
Year
AF
DC
/TA
NF
0
2
4
6
8
10
12
Mil
lio
ns
Fo
od
Sta
mp
s
Total AFDC Cases Total FSP Cases
Figure 1. Total AFDC/TANF and Food Stamp caseloads, 1980–1999.
Source: Author’s calculations. Data are from the U.S. Department of Health and Human Services and the U.S. Department of Agriculture, and can beobtained from the author upon request.
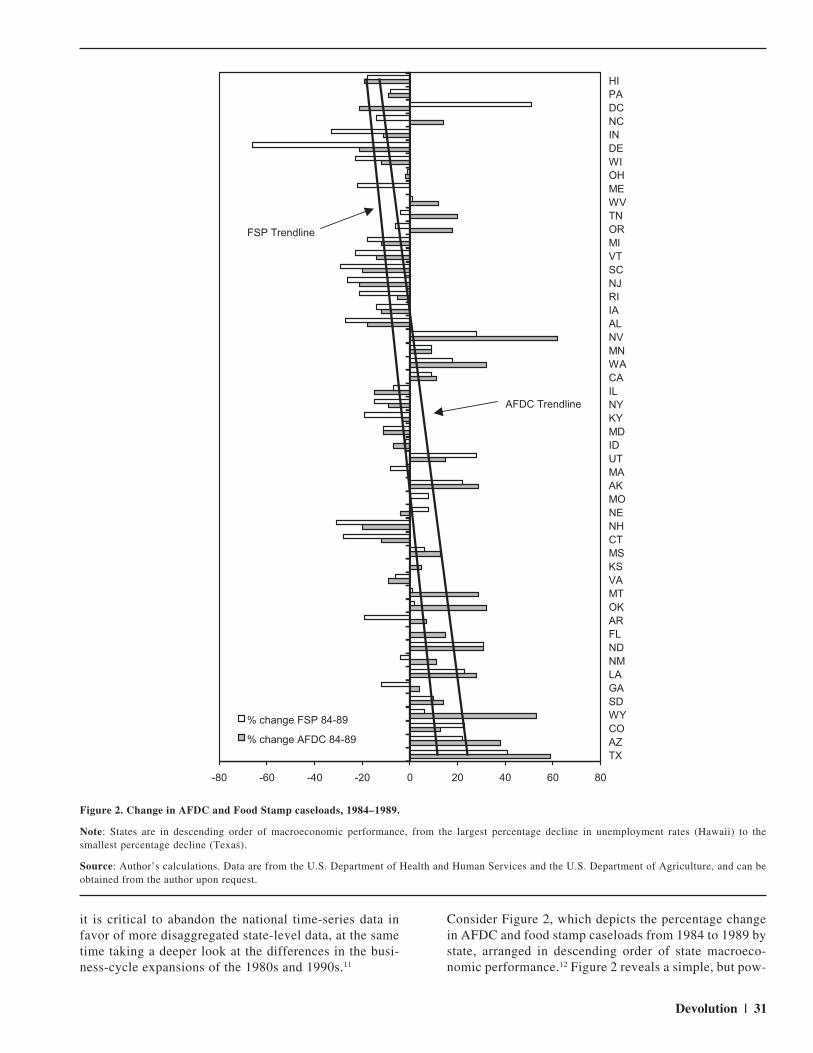
Devolution | 31
it is critical to abandon the national time-series data infavor of more disaggregated state-level data, at the sametime taking a deeper look at the differences in the busi-ness-cycle expansions of the 1980s and 1990s.11
Consider Figure 2, which depicts the percentage changein AFDC and food stamp caseloads from 1984 to 1989 bystate, arranged in descending order of state macroeco-nomic performance.12 Figure 2 reveals a simple, but pow-
-80 -60 -40 -20 0 20 40 60 80
TX
AZ
CO
WY
SD
GA
LA
NM
ND
FL
AR
OK
MT
VA
KS
MS
CT
NH
NE
MO
AK
MA
UT
ID
MD
KY
NY
IL
CA
WA
MN
NV
AL
IA
RI
NJ
SC
VT
MI
OR
TN
WV
ME
OH
WI
DE
IN
NC
DC
PA
HI
% change FSP 84-89
% change AFDC 84-89
FSP Trendline
AFDC Trendline
Figure 2. Change in AFDC and Food Stamp caseloads, 1984–1989.
Note: States are in descending order of macroeconomic performance, from the largest percentage decline in unemployment rates (Hawaii) to thesmallest percentage decline (Texas).
Source: Author’s calculations. Data are from the U.S. Department of Health and Human Services and the U.S. Department of Agriculture, and can beobtained from the author upon request.
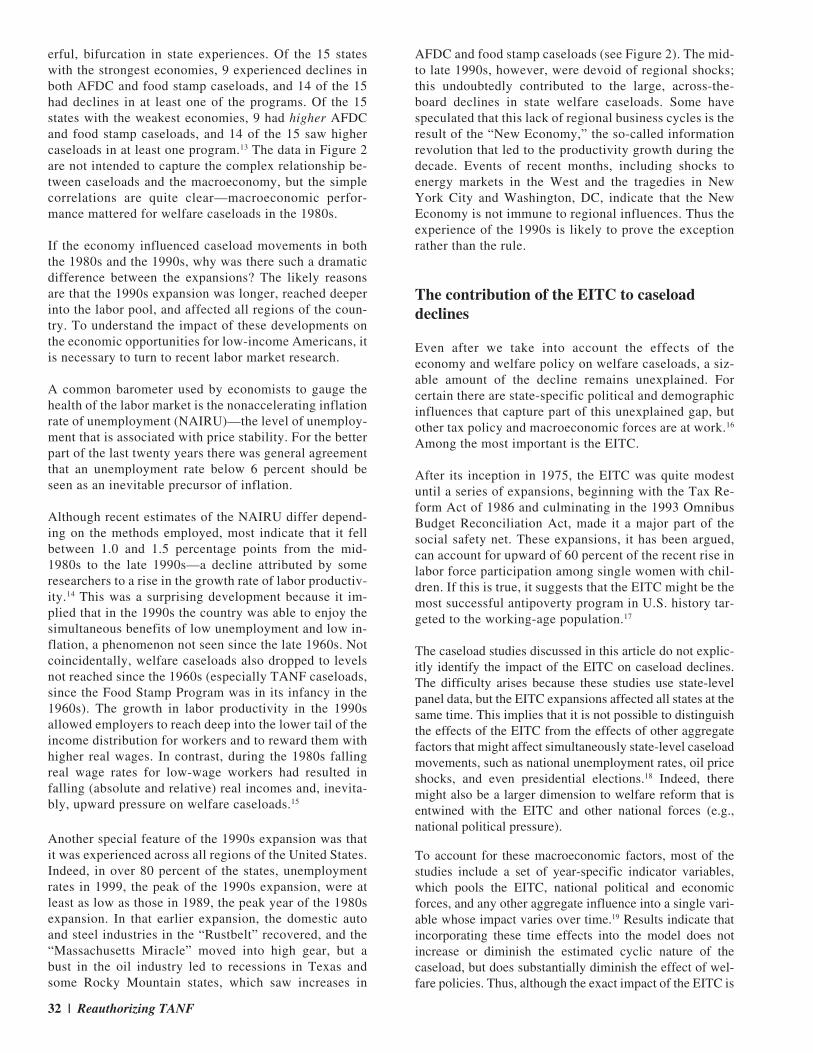
32 | Reauthorizing TANF
erful, bifurcation in state experiences. Of the 15 stateswith the strongest economies, 9 experienced declines inboth AFDC and food stamp caseloads, and 14 of the 15had declines in at least one of the programs. Of the 15states with the weakest economies, 9 had higher AFDCand food stamp caseloads, and 14 of the 15 saw highercaseloads in at least one program.13 The data in Figure 2are not intended to capture the complex relationship be-tween caseloads and the macroeconomy, but the simplecorrelations are quite clear—macroeconomic perfor-mance mattered for welfare caseloads in the 1980s.
If the economy influenced caseload movements in boththe 1980s and the 1990s, why was there such a dramaticdifference between the expansions? The likely reasonsare that the 1990s expansion was longer, reached deeperinto the labor pool, and affected all regions of the coun-try. To understand the impact of these developments onthe economic opportunities for low-income Americans, itis necessary to turn to recent labor market research.
A common barometer used by economists to gauge thehealth of the labor market is the nonaccelerating inflationrate of unemployment (NAIRU)—the level of unemploy-ment that is associated with price stability. For the betterpart of the last twenty years there was general agreementthat an unemployment rate below 6 percent should beseen as an inevitable precursor of inflation.
Although recent estimates of the NAIRU differ depend-ing on the methods employed, most indicate that it fellbetween 1.0 and 1.5 percentage points from the mid-1980s to the late 1990s—a decline attributed by someresearchers to a rise in the growth rate of labor productiv-ity.14 This was a surprising development because it im-plied that in the 1990s the country was able to enjoy thesimultaneous benefits of low unemployment and low in-flation, a phenomenon not seen since the late 1960s. Notcoincidentally, welfare caseloads also dropped to levelsnot reached since the 1960s (especially TANF caseloads,since the Food Stamp Program was in its infancy in the1960s). The growth in labor productivity in the 1990sallowed employers to reach deep into the lower tail of theincome distribution for workers and to reward them withhigher real wages. In contrast, during the 1980s fallingreal wage rates for low-wage workers had resulted infalling (absolute and relative) real incomes and, inevita-bly, upward pressure on welfare caseloads.15
Another special feature of the 1990s expansion was thatit was experienced across all regions of the United States.Indeed, in over 80 percent of the states, unemploymentrates in 1999, the peak of the 1990s expansion, were atleast as low as those in 1989, the peak year of the 1980sexpansion. In that earlier expansion, the domestic autoand steel industries in the “Rustbelt” recovered, and the“Massachusetts Miracle” moved into high gear, but abust in the oil industry led to recessions in Texas andsome Rocky Mountain states, which saw increases in
AFDC and food stamp caseloads (see Figure 2). The mid-to late 1990s, however, were devoid of regional shocks;this undoubtedly contributed to the large, across-the-board declines in state welfare caseloads. Some havespeculated that this lack of regional business cycles is theresult of the “New Economy,” the so-called informationrevolution that led to the productivity growth during thedecade. Events of recent months, including shocks toenergy markets in the West and the tragedies in NewYork City and Washington, DC, indicate that the NewEconomy is not immune to regional influences. Thus theexperience of the 1990s is likely to prove the exceptionrather than the rule.
The contribution of the EITC to caseloaddeclines
Even after we take into account the effects of theeconomy and welfare policy on welfare caseloads, a siz-able amount of the decline remains unexplained. Forcertain there are state-specific political and demographicinfluences that capture part of this unexplained gap, butother tax policy and macroeconomic forces are at work.16
Among the most important is the EITC.
After its inception in 1975, the EITC was quite modestuntil a series of expansions, beginning with the Tax Re-form Act of 1986 and culminating in the 1993 OmnibusBudget Reconciliation Act, made it a major part of thesocial safety net. These expansions, it has been argued,can account for upward of 60 percent of the recent rise inlabor force participation among single women with chil-dren. If this is true, it suggests that the EITC might be themost successful antipoverty program in U.S. history tar-geted to the working-age population.17
The caseload studies discussed in this article do not explic-itly identify the impact of the EITC on caseload declines.The difficulty arises because these studies use state-levelpanel data, but the EITC expansions affected all states at thesame time. This implies that it is not possible to distinguishthe effects of the EITC from the effects of other aggregatefactors that might affect simultaneously state-level caseloadmovements, such as national unemployment rates, oil priceshocks, and even presidential elections.18 Indeed, theremight also be a larger dimension to welfare reform that isentwined with the EITC and other national forces (e.g.,national political pressure).
To account for these macroeconomic factors, most of thestudies include a set of year-specific indicator variables,which pools the EITC, national political and economicforces, and any other aggregate influence into a single vari-able whose impact varies over time.19 Results indicate thatincorporating these time effects into the model does notincrease or diminish the estimated cyclic nature of thecaseload, but does substantially diminish the effect of wel-fare policies. Thus, although the exact impact of the EITC is
Devolution | 33
unknown, it clearly played a role in the recent caseloaddeclines, and failure to control for aggregate forces such asthe EITC overstates the influence of welfare policychanges.
Economy or policy? A summation
It should go without saying that social policy matters forour understanding of changes in TANF and food stampcaseloads; indeed, we can all envision a set of policiesthat drives caseloads to zero. The task at hand, however,is to understand the magnitude and direction of the set ofpolicies enacted as part of the 1990s welfare reforms—policies that were first begun by individual states andthen enacted by Congress. An empirical model thatserves as a framework to identify the impact of welfarepolicy reforms must admit dynamic feedback, in the formof lagged economic conditions and lagged values ofcaseloads.20 In addition, the model must permit aggregateforces that vary over time, such as the EITC, to influencestate- or household-level caseload movements.
Once dynamic and aggregate factors are brought into theanalysis, the overall impact of welfare-waiver policies onAFDC/TANF and food stamp caseloads in the periodleading up to the 1996 reforms appears to have beenminimal. This is not because policy didn’t matter, butbecause policies enacted in some of the states led tomodest caseload increases whereas policies in otherstates led to modest caseload decreases, yielding an ag-gregate effect near zero. Since passage of PRWORA in1996, caseload-reducing policies have moved to the fore-front, so that the aggregate effect of welfare reform,albeit still small in relation to the economy, has resultedin lower assistance caseloads.
The high-pressure U.S. economy of the mid- and late1990s, not the recent welfare policies, was the drivingforce behind the caseload declines. The expansion of-fered low-income Americans the most favorable labor-market conditions in three decades, and they respondedby entering the labor force, increasing hours of work, andreceiving the first real wage gains in 20 years.
Because welfare caseloads are strongly countercyclical,caseloads will likely increase as the economy movesfurther into the current slowdown. This is indeed happen-ing in many states at the time of this writing. But there isconsiderable inertia in the welfare caseload, and some ofthe effects of welfare reform and the economic expansionhave yet to manifest themselves in the caseload. Thisinertia will continue to exert downward pressure on thecaseload for some time to come.
How much, then, will caseloads rise in response to theslowdown? That is an open question and is clearly afunction of the depth and length of the downturn. In U.S.recessions of the decades after World War II, unemploy-
ment rates typically rose 2 to 4 percentage points, sug-gesting that TANF and food stamp caseloads could rise 5to 10 percent in the first year of a recession.21 Still un-known, however, is the interaction of welfare reform anda sour economy. Before PRWORA, AFDC was an en-titlement, available to all who were eligible for as long asthey met the criteria. Thus it was one of many “automaticstabilizers” in the economy (food stamps remain an en-titlement). To what extent will AFDC’s replacement,TANF, which operates under much stricter eligibilityrules and time limits, still fulfill the automatic insurancerole? The answer to this question must await the comple-tion of a full business cycle. �
1I wish to thank David Figlio, Craig Gundersen, and Steven Haider formany insightful comments. All opinions and errors are my own.
2See, for example, J. Ziliak, D. Figlio, E. Davis, and L. Connolly,“Accounting for the Decline in AFDC Caseloads: Welfare Reform orthe Economy?” Journal of Human Resources 35(2000): 570–86; R.Blank, “What Causes Public Assistance Caseloads to Grow?” Journalof Human Resources 36(2001): 85–118. S. Bell, “Why Are WelfareCaseloads Falling?” Discussion Paper 01-02, Urban Institute, Wash-ington, DC, 2001, critically reviews the literature and provides furtherreferences.
3See, e.g., D. Figlio and J. Ziliak, “Welfare Reform, the BusinessCycle, and the Decline in AFDC Caseloads,” in Economic Conditionsand Welfare Reform, ed. S. Danziger (Kalamazoo, MI: W. E. UpjohnInstitute for Employment Research, 1999): 17–48. Ziliak et al. “Ac-counting for the Decline,” found evidence that it took time for thewelfare-waiver policies to be implemented and transmitted to thewelfare caseload. Hence, one would expect to capture a larger policyeffect with the additional two years of post-PRWORA data in thesample.
4Council of Economic Advisers, Technical Report: Explaining theDecline in Welfare Receipt, 1993–1996, Executive Office of the Presi-dent, Washington, DC, 1997, and Technical Report: The Effects ofWelfare Policy and the Economic Expansion on Welfare Caseloads:An Update, Executive Office of the President, Washington, DC, 1999.For this perspective, see also Blank, “What Causes Public AssistanceCaseloads to Grow?” and J. O’Neill and M. Hill, Gaining Ground?Measuring the Impact of Welfare Reform on Welfare and Work, CivicReport No. 17, Manhattan Institute, New York, NY, 2001.
5Figlio and Ziliak, “Welfare Reform.” We used data from Aid toFamilies with Dependent Children (AFDC), the forerunner to TANF.Specifically, we compared the work reported in Ziliak and others,“Accounting for the Decline,” with the 1997 CEA technical report,Explaining the Decline in Welfare Receipt. Among other differencesin technical specifications that we explored were (1) using year dum-mies in lieu of a cubic trend to control for macroeconomic factors; (2)using weights in the regression model versus no weights; (3) using thefirst difference of caseloads instead of the level of caseloads as thedependent variable; and lastly (4) using a dynamic framework thatincludes lagged caseloads and economic conditions instead of a staticframework that omits these factors, particularly lagged caseloads.
6For expositions of these econometric issues, see, e.g., J. Klerman andS. Haider, “A Stock-Flow Analysis of the Welfare Caseload: Insightsfrom California Economic Conditions,” unpublished paper, Rand Cor-poration, Santa Monica, CA, 2000; H. Hoynes, “Local Labor Marketsand Welfare Spells: Do Demand Conditions Matter?” Review of Eco-nomics and Statistics 82 (2000): 351–68; M. Bane and D. Ellwood,“Slipping Into and Out of Poverty: The Dynamics of Spells,” Journalof Human Resources 21(1986): 1–23; R. Blank and P. Ruggles, “WhenDo Women Use Aid to Families with Dependent Children and FoodStamps? The Dynamics of Eligibility versus Participation,” Journal of

34 | Reauthorizing TANF
Human Resources 31(1996): 57–89. An advantage of static models liesin the fact that the coefficients offer ease of interpretation compared tocoefficients from dynamic models, because the latter require that atime horizon (e.g., short-run versus long-run) be specified. Althoughthis feature of static models should not be easily dismissed, the evi-dence shows clearly that dynamic models, though demanding extracare, more accurately characterize welfare-caseload movements.
7Indeed, Klerman and Haider, “A Stock-Flow Analysis,” show that theestimated impact of the economy on caseloads in the first group ofstudies is, if anything, conservative.
8Interestingly, though, the policies of the 1990s share many featureswith those policies in place in 19th century public relief programs. See,for example, S. Ziliak, “Kicking the Malthusian Vice: Lessons fromthe Abolition of ‘Welfare’ in the Late Nineteenth Century,” QuarterlyReview of Economics and Finance 37(1997): 449–68, and M. Katz, Inthe Shadow of the Poorhouse: A Social History of Welfare in America(New York: Basic Books, 1986).
9See, for example, C. Murray, “What Government Must Do: MakeWelfare Unappealing or Reform Will Fail,” American Enterprise9(1998): 72–73; R. Haskins, “Giving is Not Enough: Work and WorkSupports Are Reducing Poverty,” Brookings Review 19(2001): 13–15.
10This criticism is not expressed only by conservative commentators,as two former members of the Clinton Administration echo the chal-lenge; see R. Blank and D. Ellwood, “The Clinton Legacy forAmerica’s Poor,” Working Paper W8437, National Bureau of Eco-nomic Research, 2001.
11A similar puzzle arose over aggregate poverty rates, which barelybudged in the 1980s expansion, although they should have declinedjudging by experience in previous expansions. There is a large litera-ture on this topic; see R. Blank and D. Card, “Poverty, Income Distri-bution, and Growth: Are They Still Connected?” Brookings Papers onEconomic Activity 2(1993): 285–339, and C. Gundersen and J. Ziliak,“Poverty and Macroeconomic Performance: A View from the States inthe Welfare Reform Era,” unpublished paper, University of Oregon,2001, for comprehensive examinations based on regional and state-level data, respectively.
12For these purposes, macroeconomic performance is defined by thepercentage change in unemployment rates; states are ranked from thelargest percentage decline in unemployment rates (Hawaii) to thesmallest percentage decline (Texas).
13Unemployment rates actually rose between 1984 and 1989 in Ari-zona, Colorado, and Texas.
14See, for example, L. Ball and R. Moffitt, “Productivity Growth andthe Phillips Curve,” unpublished paper, Johns Hopkins University,2001; L. Katz and A. Krueger, “The High Pressure US Labor Marketof the 1990s,” Brookings Papers on Economic Activity 1 (1999): 1–65.
15For discussion of these issues, see D. Cutler and L. Katz, “Macroeco-nomic Performance and the Disadvantaged,” Brookings Papers onEconomic Activity 1(1991): 1–74; L. Karoly, “The Trend in Inequalityamong Families, Individuals, and Workers in the United States: ATwenty-Five Year Perspective,” in Uneven Tides: Rising Inequality inAmerica, ed. S. Danziger and P. Gottschalk (New York: Russell SageFoundation, 1993): 19–97.
16Blank, “What Causes Public Assistance Caseloads to Grow?”; J.Ziliak, C. Gundersen, and D. Figlio, “Welfare Reform and Food StampCaseload Dynamics,” Discussion Paper 1215-00, Institute for Re-search on Poverty, University of Wisconsin–Madison, 2000.
17See V. J. Hotz and J. K. Scholz, “The Earned Income Tax Credit,” inMeans-Tested Transfer Programs in the United States, ed. R. Moffitt(Cambridge, MA: National Bureau of Economic Research, forthcom-ing). On the size of its effect, see B. Meyer and D. Rosenbaum,“Welfare, the Earned Income Tax Credit, and the Labor Supply ofSingle Mothers,” Quarterly Journal of Economics 109 (2001): 1063–14.
18Meyer and Rosenbaum, “Welfare, the Earned Income Tax Credit,and the Labor Supply of Single Mothers,” achieve identification of theEITC using microlevel data from the CPS and a difference-in-differ-ence strategy, i.e., they exploit the fact that the EITC policy changesaffected single women without children differently from single womenwith children.
19A notable exception is the article by G. Wallace and R. Blank, “WhatGoes Up Must Come Down? Explaining Recent Changes in PublicAssistance Caseloads,” in Danziger, ed., Economic Conditions andWelfare Reform, pp. 48–89. Wallace and Blank eschew the use ofaggregate time controls on the ground that it “overadjusts the data andmisestimates the actual effects of program changes over time” (p. 83).However, they note that by including the time effects “the long-runeffect of unemployment remains virtually unchanged while the long-run effect of waiver implementation decreases by over half” (p. 83).
20Klerman and Haider, “A Stock-Flow Analysis,” also argue for thepossibility of interactions between the lagged dependent variable andlagged economic conditions.
21Figlio and Ziliak, “Welfare Reform”; Ziliak, Gundersen, and Figlio,“Welfare Reform and Food Stamp Caseload Dynamics.”