the new four stages of contribution research - korn...
TRANSCRIPT

1
The New Four Stages™ of Contribution ResearchToday’s Workforce: Demographic Differences, Behavioral Contributions, and Who is Really Doing WhatBy Paul Terry, Alan Graden, and Ed Haltrecht

The New Four Stages™ of Contribution Research
Table of Contents
The Four Stages of Contribution Model 1Participant Characteristics and Research Methodology 3Overall Stage of Contribution 5Manager and Self-rater Gap 5 Ratings Gap by Gender 7 Ratings Gap by Generation 7 Ratings Gap by Ethnicity 8A Closer Look at the Contribution Ratings ofPeople Managers 9 Overall Manager Distribution by Stage 9 Overall Manager Distribution by Tenure 10 Overall Manager Distribution by Time in Position 10 Overall Manager Distribution by Gender 11 Proportion of Managers and Non-Managers within Each Stage 12 Overall Manager Distribution by Generation 14 Overall Manager Distribution by Ethnicity 14Overall Gender Findings 15Overall Generational Findings 16Overall Ethnicity Findings 17

Overall Tenure and Time in Position 19Overall Contribution Rankings by Stage 20 Average Age by Stage 21 Competencies that are Predictive Indicators of Stage 21Summary 23Appendix A: Four Stages of Contribution Assessment 25Appendix B: Four Stages of Contribution AssessmentDemographic Questions 30Appendix C: Research Focus Groups 35Appendix D: Analysis Explanation 36Appendix E: Survey Participants 38Appendix F: Research Partners 39
Table of Contents, cont.

1
The Four Stages of Contribution Model
The Four Stages of Contribution model is based on the research of Drs. Gene Dalton and Paul Thompson and provides a framework for increasing one’s organizational impact and influence over time. According to Dalton and Thompson’s research, there is a direct correlation between a person’s “career stage” and his/her contribution to the organization. Over the course of their careers, employees can move through as many as four stages, as outlined in Figure 1.0 (page 2), although organizational needs and employee goals can affect movement between and within the stages.
Organizations need employees who are continually learning and willingly accept supervision (Stage 1) as much as they need employees able to mentor and coach (Stage 3). However, behaving in ways associated with latter stages means impacting a larger cross-section of the organization. Therefore, highperforming organizations must ensure that people contributing within each stage are also developing behaviors associated with the next stage. This stretching and growing prepares employees to, over time, have greater influence in the organization, see Figure 1.1 (page 2).
By Paul Terry, Alan Graden, and Ed Haltrecht
What distinguishes today’s workforce? How does it differ demographically and behaviorally from workforces in the past? These are questions Global Novations set out to answer in its Four Stages® of Contribution research. Before we get into specific research findings, we will first provide background on the Four Stages model and why we chose it as the foundation for our research. Then, we’ll outline the research participant characteristics and methodology. And finally, we’ll summarize the basic areas of research.
The New Four StagesTM of Contribution ResearchToday’s Workforce: Demographic Differences, Behavioral Contributions, and Who is Really Doing WhatBy Paul Terry, Alan Graden, and Ed Haltrecht

2
As employees develop their individual capacity, organizations also increase their overall capacity. Over the years, we’ve learned that title does not always represent how people are actually contributing, and that people may be contributing across multiple stages at any given time. However, an employee’s behavior is usually predominately associated with one stage. As we review the comparisons below, we have used the dominant stage rating as defined by the manager of the employee and some cases as determined by the employee him/herself.
Stage 1
Contributing Dependently
Stage 2
Contributing Independently
Stage 3
Contributing Through Others
Stage 4
Contributing Strategically
Perfo
rman
ce
Expe
ctat
ion Build credibility,
learnEstablish and apply expertise
Guide, coordinate, develop others
Shape organizational direction
Prim
ary
Role
Helper, learner Individual contributor, specialist
Coach, mentor, idea leader, internal consultant, project leader
Sponsor, innovator, business leader
Maj
or S
tage
Tr
ansi
tion
Issu
e
Recognize need for dependence
Accept independence
Accept responsibility (formal or informal) for others’ efforts
Holistic view of business, making tough choices
Perfo
rman
ce
Leve
rage
Support others, build credibility
Individual capability, subject matter expertise
Relationships, networks, and technical breadth
Establish organizational priorities, broad impact and influence
Figure 1.0 - The Four Stages of Contribution Model
Stage 1
Contributing Dependently
Stage 2
Contributing Independently
Stage 3
Contributing Through Others
Stage 4
Contributing Strategically
• Willingly accepts supervision
• Demonstrates success on a portion of larger project or task
• Masters basic and routine tasks
• Shows “directed” creativity and initiative
• Performs well under time and budget pressure
• Learns how “we” do things
• Assumes responsibility for definable projects
• Relies less on supervision; works independently and produces significant results
• Increases technical expertise and ability
• Develops credibility and reputation
• Builds a strong internal network of relationships
• Increases technical breadth
• Develops broad business perspective
• Stimulates others through ideas and knowledge
• Involved as a manager, mentor, or idea leader in developing others
• Represents the organization effectively to clients and external groups
• Expands strong internal and external networks
• Provides direction to the organization
• Defines/drives critical business opportunities and needs
• Exercises power responsibly
• Sponsors promising individuals to prepare them for leadership roles
• Represents the organization on critical strategic issues
Figure 1.1 - The Four Stages of Contribution Model Stage Behaviors
3
Participant Characteristics and Research Methodology
From 2007 – 2009, Global Novations partnered with several leading organizations in the US, Brazil, and the UK to study employee development and contribution in today’s business world. The overall resulting data set includes information on the contribution and development of over 1,500 respondents. In 2010, in partnership with Right Management, we conducted similar research in Asia and analyzed responses from over 390 individuals in mainland China, Hong Kong, and Singapore. The core survey questions about contribution were the same in all locations. Eighteen organizations participated in the current (2007–2010) research. Industries represented in the data set include financial services, pharmaceuticals, insurance, and consumer goods. The organizations were diverse in size and location. Because of its ability to provide insight on the behavioral contributions of employees, the Four Stages of Contribution model was used as the foundation for the current research. Additionally, we conducted a number of focus groups, see Appendix C for details.
By completing a behavioral and competency-based survey about each direct report, managers assessed how their direct reports contribute to their organizations. The direct reports were asked to complete the same survey, providing a self-assessment of their contribution. (See Appendix A for a complete listing of survey items.) The current research is unique in two ways. First, the data was collected purely for the purpose of research and, therefore, was in no way tied to performance appraisals or 360 surveys. Second, as would be expected in today’s modern workforce, participants were highly diverse in a number of demographic categories. (Note: each demographic question had an opt-out choice of “Prefer not to respond.”) Numbers below indicate those who both received a score and answered the demographic questions. Except where noted, the following statistics are for the overall data set:
• Direct reports were 40.5% male and 59.5% female.
• The race/ethnicity breakdown of participants was as follows: 79.3% Caucasian, 9.0% Black/African American, 4.1% Spanish/Hispanic/Latino, 5.5% Asian, and 2.1% Other. (Note: “Other” includes the categories of American Indian or Alaska Native, Samoan, and Other. Of the overall group, 899 participants provided their ethnicity and received ratings from their manager.)
• The presence of four generations in the workplace makes this demographic category one of particular interest. Participants reported their current age, which was converted to generational affiliation as:

4
• 15% Generation Y (born 1981–1994)
• 54% Generation X (born 1966–1980)
• 30% Boomers (born 1945–1965)
• 1% Matures (born before 1945)
Managers, which represented 446 of the respondents, were asked to rate direct reports from their perspective as a manager in their organizations. Each manager rated one or more direct reports and therefore was responsible for more than one data point.
Managers were:
• 86.7% Caucasian, 2.5% black/African American, 2.5% Spanish/Hispanic/Latino, 3.2% Asian, and 5.1% Other (Ethnicity numbers represent 315 managers in the US.)
• 56% male and 44% female (a notable difference from the female majority within the population of the direct reports)
• 1.2% Generation Y, 43.1% Generation X, 55.9% Boomers, and 1.0% Matures
Participating managers were asked to rank their direct reports compared with one another relative to their overall contribution to the organization. They were also asked to rank their direct reports in terms of performance. Following the rankings, the managers completed a 20-item competencybased survey about each direct report’s type of contribution. The direct reports were asked to complete the same 20-item survey, assessing their own contributions. (See Appendix A for a complete listing of survey items.)
Overall data points totaled 1,925, each representing an individual receiving a stage rating. Of these, 470 indicated they have people management responsibilities in their organization. All respondents had the choice to decline responding to each question. Therefore, the number of data points included in each analysis varies depending on the number of participants who chose to respond to a particular item.
Research Participants Total West Asia
Individuals Providing Ratings Overall 446 329 117
Individuals Receiving Ratings
Overall 1925 1534 391
People Managers 470 305 165
5
Overall Stage of Contribution
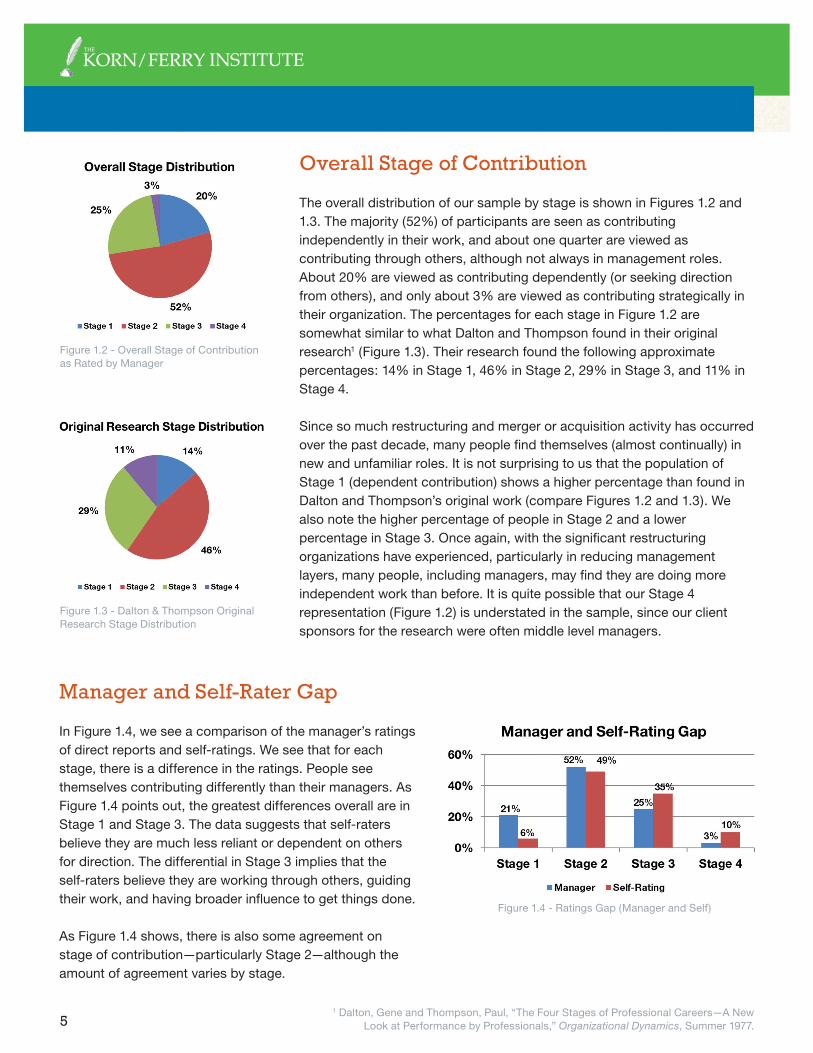
The overall distribution of our sample by stage is shown in Figures 1.2 and 1.3. The majority (52%) of participants are seen as contributing independently in their work, and about one quarter are viewed as contributing through others, although not always in management roles. About 20% are viewed as contributing dependently (or seeking direction from others), and only about 3% are viewed as contributing strategically in their organization. The percentages for each stage in Figure 1.2 are somewhat similar to what Dalton and Thompson found in their original research1 (Figure 1.3). Their research found the following approximate percentages: 14% in Stage 1, 46% in Stage 2, 29% in Stage 3, and 11% in Stage 4.
Since so much restructuring and merger or acquisition activity has occurred over the past decade, many people find themselves (almost continually) in new and unfamiliar roles. It is not surprising to us that the population of Stage 1 (dependent contribution) shows a higher percentage than found in Dalton and Thompson’s original work (compare Figures 1.2 and 1.3). We also note the higher percentage of people in Stage 2 and a lower percentage in Stage 3. Once again, with the significant restructuring organizations have experienced, particularly in reducing management layers, many people, including managers, may find they are doing more independent work than before. It is quite possible that our Stage 4 representation (Figure 1.2) is understated in the sample, since our client sponsors for the research were often middle level managers.
Figure 1.2 - Overall Stage of Contribution as Rated by Manager
Figure 1.3 - Dalton & Thompson Original Research Stage Distribution
Manager and Self-Rater Gap
In Figure 1.4, we see a comparison of the manager’s ratings of direct reports and self-ratings. We see that for each stage, there is a difference in the ratings. People see themselves contributing differently than their managers. As Figure 1.4 points out, the greatest differences overall are in Stage 1 and Stage 3. The data suggests that self-raters believe they are much less reliant or dependent on others for direction. The differential in Stage 3 implies that the self-raters believe they are working through others, guiding their work, and having broader influence to get things done.
As Figure 1.4 shows, there is also some agreement on stage of contribution—particularly Stage 2—although the amount of agreement varies by stage.
Figure 1.4 - Ratings Gap (Manager and Self)
1 Dalton, Gene and Thompson, Paul, “The Four Stages of Professional Careers—A New Look at Performance by Professionals,” Organizational Dynamics, Summer 1977.
6
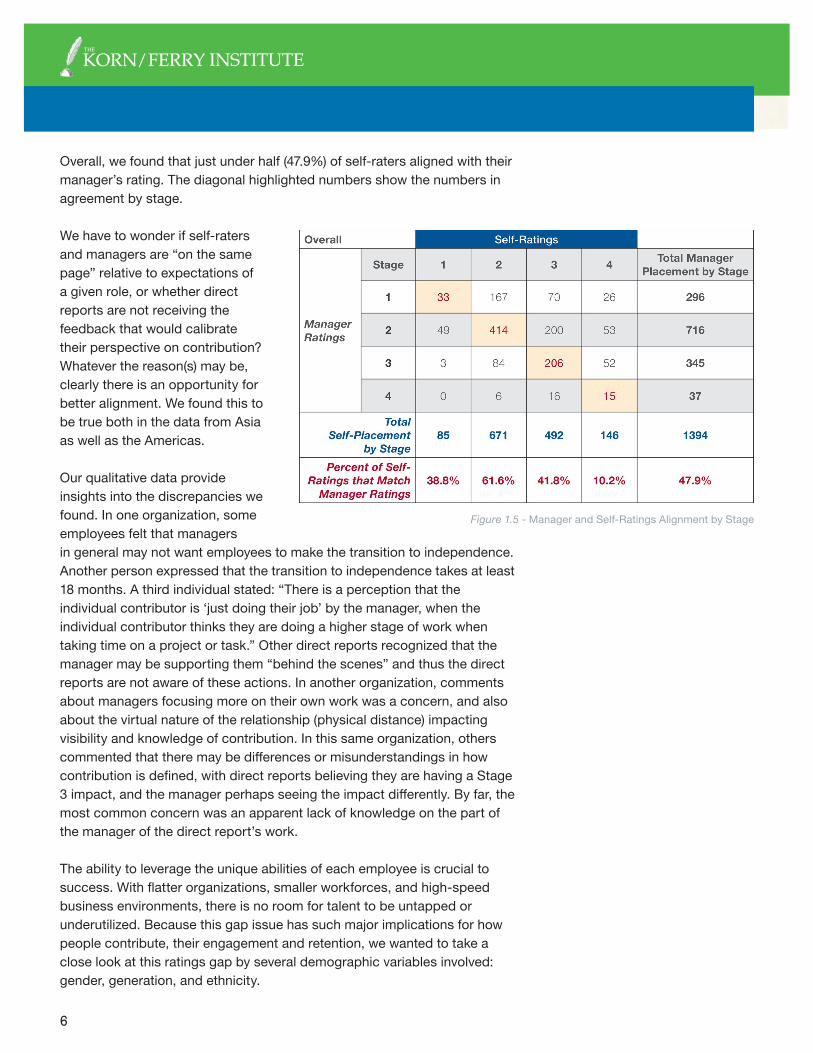
Overall, we found that just under half (47.9%) of self-raters aligned with their manager’s rating. The diagonal highlighted numbers show the numbers in agreement by stage.
We have to wonder if self-raters and managers are “on the same page” relative to expectations of a given role, or whether direct reports are not receiving the feedback that would calibrate their perspective on contribution? Whatever the reason(s) may be, clearly there is an opportunity for better alignment. We found this to be true both in the data from Asia as well as the Americas.
Our qualitative data provide insights into the discrepancies we found. In one organization, some employees felt that managers in general may not want employees to make the transition to independence. Another person expressed that the transition to independence takes at least 18 months. A third individual stated: “There is a perception that the individual contributor is ‘just doing their job’ by the manager, when the individual contributor thinks they are doing a higher stage of work when taking time on a project or task.” Other direct reports recognized that the manager may be supporting them “behind the scenes” and thus the direct reports are not aware of these actions. In another organization, comments about managers focusing more on their own work was a concern, and also about the virtual nature of the relationship (physical distance) impacting visibility and knowledge of contribution. In this same organization, others commented that there may be differences or misunderstandings in how contribution is defined, with direct reports believing they are having a Stage 3 impact, and the manager perhaps seeing the impact differently. By far, the most common concern was an apparent lack of knowledge on the part of the manager of the direct report’s work.
The ability to leverage the unique abilities of each employee is crucial to success. With flatter organizations, smaller workforces, and high-speed business environments, there is no room for talent to be untapped or underutilized. Because this gap issue has such major implications for how people contribute, their engagement and retention, we wanted to take a close look at this ratings gap by several demographic variables involved: gender, generation, and ethnicity.
Figure 1.5 - Manager and Self-Ratings Alignment by Stage

7
Ratings Gap by Gender
As seen in Figure 1.6, although there is a rating gap between managers and self-raters for both genders, there is more of a gap between male self-raters and their managers than female self-raters and their managers. The largest gaps are in Stages 1 and 3, although gaps exist for men across all four stages. It was interesting that female self-raters in Stage 2 are almost exactly in line with their manager’s view on their contribution. Why is it that men have such a different opinion of their own contribution than their female counterparts? Other research that confirms that men tend to rate themselves more highly.
A 1998 study of 360 survey feedback by Envisia found that men rated themselves significantly higher in proficiency than their female counterparts in several leadership competencies such as: oral presentation, delegation, conflict management, team building, problem solving, and decisiveness/judgment. Interestingly, women were rated higher by other raters than men in the areas of leadership/influence, team development, interpersonal sensitivity, conflict management, coaching/talent development, and employee involvement.2
2 Nowack, Kenneth, The Neurobiology of Leadership: Why Women Lead Differently Than Men, Envisia Learning Inc., 1998.
Figure 1.6 - Manager and Self-Rating Gap by Gender
Ratings Gap by Generation
We did a similar analysis for generational ratings gaps. As shown in Figure 1.7, the largest difference is for Gen Y selfraters; the difference in view on Stage 1 contribution was about 23 percentage points. Managers believe Gen Y is much more dependent on others in their contribution than Gen Y’ers see themselves. The difference in Stage 2 was 16 percentage points, with Gen Y self-raters believing they are much more independent in their contribution. With the exception of Stage 2 contribution, the trend for Gen X and Baby Boomers is similar, but the gap is not as wide as for Gen Y.
Figure 1.7 - Manager and Self-Rating Gap by Generation
8
Ratings Gap by Ethnicity
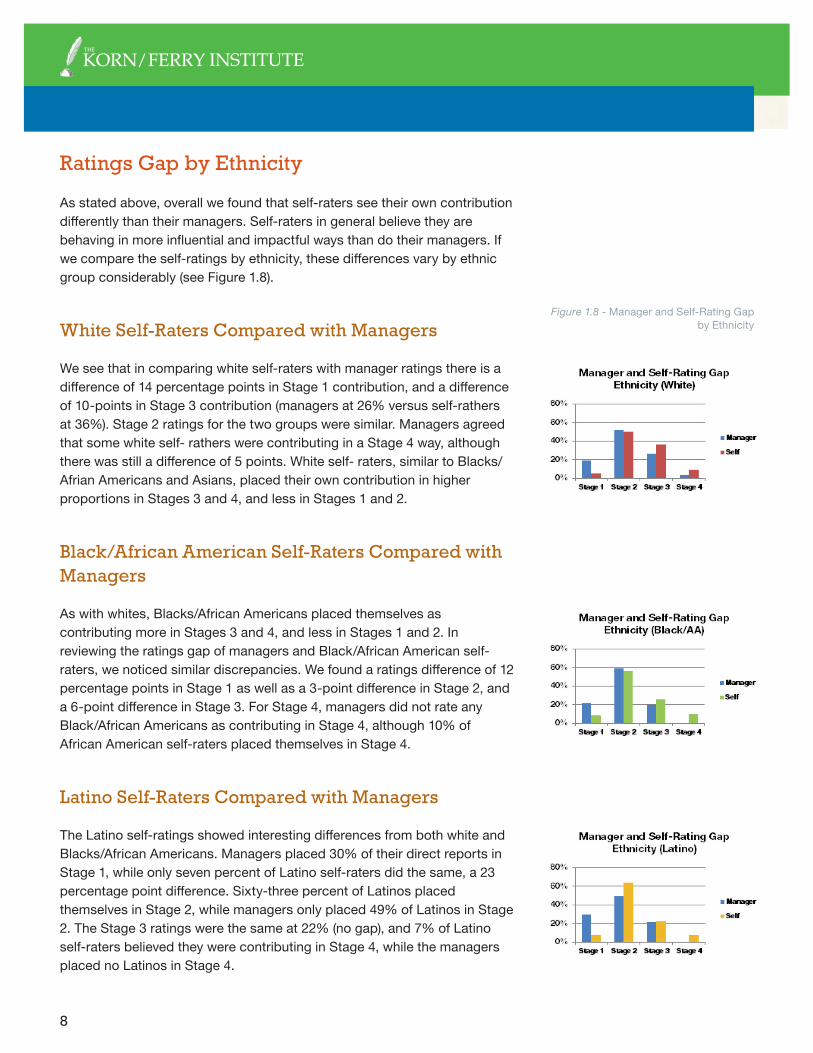
As stated above, overall we found that self-raters see their own contribution differently than their managers. Self-raters in general believe they are behaving in more influential and impactful ways than do their managers. If we compare the self-ratings by ethnicity, these differences vary by ethnic group considerably (see Figure 1.8).
White Self-Raters Compared with Managers
We see that in comparing white self-raters with manager ratings there is a difference of 14 percentage points in Stage 1 contribution, and a difference of 10-points in Stage 3 contribution (managers at 26% versus self-rathers at 36%). Stage 2 ratings for the two groups were similar. Managers agreed that some white self- rathers were contributing in a Stage 4 way, although there was still a difference of 5 points. White self- raters, similar to Blacks/Afrian Americans and Asians, placed their own contribution in higher proportions in Stages 3 and 4, and less in Stages 1 and 2.
Black/African American Self-Raters Compared with Managers
As with whites, Blacks/African Americans placed themselves as contributing more in Stages 3 and 4, and less in Stages 1 and 2. In reviewing the ratings gap of managers and Black/African American self-raters, we noticed similar discrepancies. We found a ratings difference of 12 percentage points in Stage 1 as well as a 3-point difference in Stage 2, and a 6-point difference in Stage 3. For Stage 4, managers did not rate any Black/African Americans as contributing in Stage 4, although 10% of African American self-raters placed themselves in Stage 4.
Latino Self-Raters Compared with Managers
The Latino self-ratings showed interesting differences from both white and Blacks/African Americans. Managers placed 30% of their direct reports in Stage 1, while only seven percent of Latino self-raters did the same, a 23 percentage point difference. Sixty-three percent of Latinos placed themselves in Stage 2, while managers only placed 49% of Latinos in Stage 2. The Stage 3 ratings were the same at 22% (no gap), and 7% of Latino self-raters believed they were contributing in Stage 4, while the managers placed no Latinos in Stage 4.
Figure 1.8 - Manager and Self-Rating Gap by Ethnicity
9
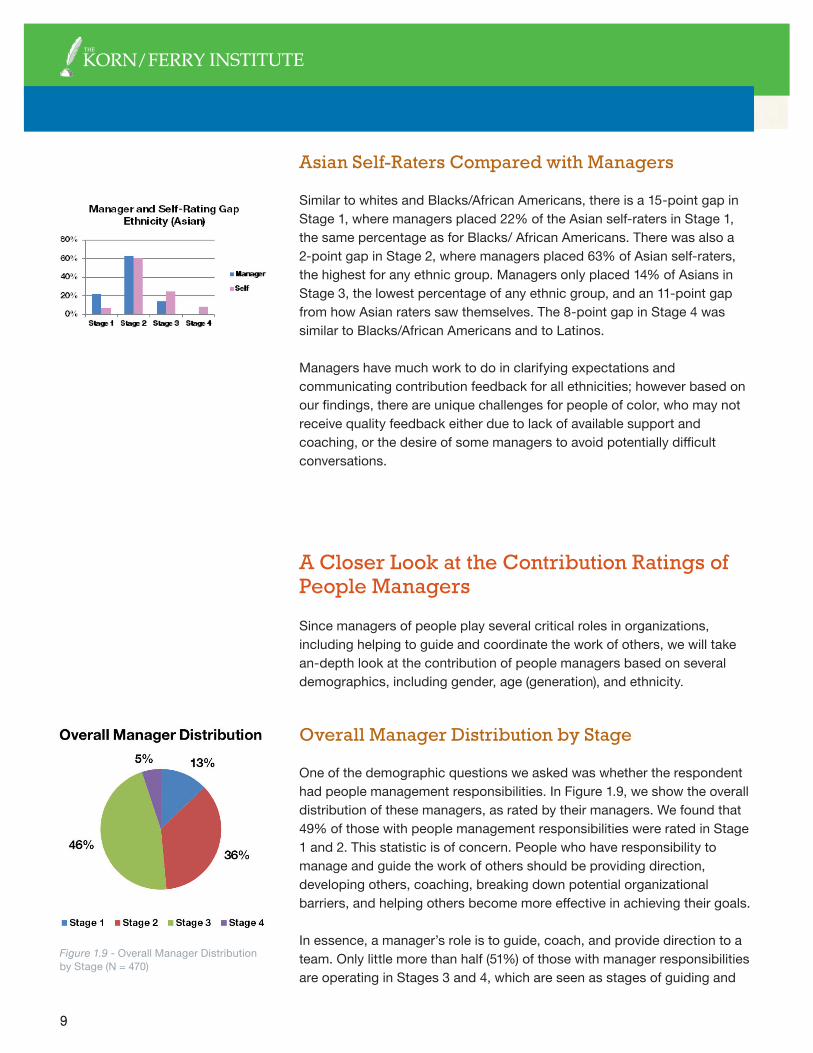
Asian Self-Raters Compared with Managers
Similar to whites and Blacks/African Americans, there is a 15-point gap in Stage 1, where managers placed 22% of the Asian self-raters in Stage 1, the same percentage as for Blacks/ African Americans. There was also a 2-point gap in Stage 2, where managers placed 63% of Asian self-raters, the highest for any ethnic group. Managers only placed 14% of Asians in Stage 3, the lowest percentage of any ethnic group, and an 11-point gap from how Asian raters saw themselves. The 8-point gap in Stage 4 was similar to Blacks/African Americans and to Latinos.
Managers have much work to do in clarifying expectations and communicating contribution feedback for all ethnicities; however based on our findings, there are unique challenges for people of color, who may not receive quality feedback either due to lack of available support and coaching, or the desire of some managers to avoid potentially difficult conversations.
A Closer Look at the Contribution Ratings of People Managers
Since managers of people play several critical roles in organizations, including helping to guide and coordinate the work of others, we will take an-depth look at the contribution of people managers based on several demographics, including gender, age (generation), and ethnicity.
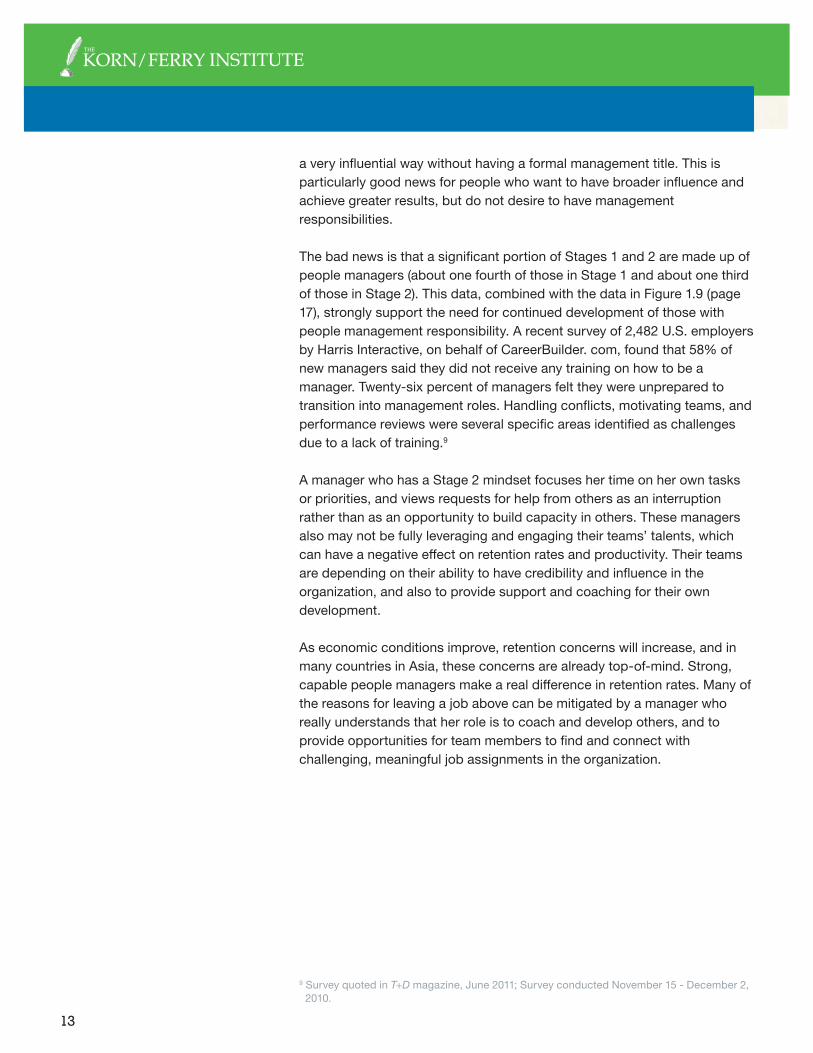
Overall Manager Distribution by Stage
One of the demographic questions we asked was whether the respondent had people management responsibilities. In Figure 1.9, we show the overall distribution of these managers, as rated by their managers. We found that 49% of those with people management responsibilities were rated in Stage 1 and 2. This statistic is of concern. People who have responsibility to manage and guide the work of others should be providing direction, developing others, coaching, breaking down potential organizational barriers, and helping others become more effective in achieving their goals.
In essence, a manager’s role is to guide, coach, and provide direction to a team. Only little more than half (51%) of those with manager responsibilities are operating in Stages 3 and 4, which are seen as stages of guiding and
Figure 1.9 - Overall Manager Distribution by Stage (N = 470)

10
shaping the work of others. Given the high percentage of managers in Stages 1 and 2, there is clearly a need for continued leadership development, and possibly a change in what behaviors are rewarded by organizations. People who are promoted into management roles may continue to exhibit the independent behaviors that brought them initial success, even though those behaviors may not be what are required at the management level.
Overall Manager Distribution by Tenure
We wondered what impact tenure might have the distribution of managers. In other words, were the managers in Stage 1 new to the organization? In Figure 1.10, we show the distribution of managers by tenure. About 38% of those in Stage 1 had been with their organizations two years or less, and 24% of those managers in Stage 2 had two years or less of service. While we might expect that managers with less tenure to be found more in Stage 1 and 2, we would not expect those with more experience to be in Stage 1 and 2, and yet we find the majority (about 62% of those in Stage 1 and 76% of those in Stage 2) have three or more years of service with their current organizations.
Overall Manager Distribution by Time in Position
We also wondered what impact time in position might have the distribution of managers. Perhaps those managers in Stage 1 are new to their roles and therefore seen as learning and more dependent? In Figure 1.11, we show the distribution of managers by time in position. About 65% of those in Stage 1 have been in their roles two years or less and about 57% of those in Stage 2 have been in their roles less than two years. These
Figure 1.10 - Overall Manager Distribution by Tenure
Figure 1.11 - Overall Manager Distribution by Time in Position

11
statistics might provide some explanation for the stage ratings; however, when we look at the breakdown of those in Stage 3, we find that 59% are also relatively new in their role—less than two years. What are those in Stage 3 doing differently than the others? We don’t have a definitive answer, but expect that tenure might be a factor. In Figure 1.11, only about 3% of those in Stage 3 had less than one year of tenure with their organization, whereas 15% of those in Stage 1 had less than one year of tenure with their employer.
Overall Manager Distribution by Gender
We wanted to see what, if any, impact gender had on the distribution of the manager population. Men make up 44% of the overall management sample. The results show that there is little difference by gender, which points to the progress that women have made overall in gaining access to leadership positions. As shown in Figure 1.12, the distribution of male managers is very similar to the overall totals, with just a slight increase in Stage 4 representation (6% vs overall 5%).
Women, who make up 56% of the management sample, have a slightly higher Stage 3 representation (48%) and slightly lower (4%) representation in Stage 4 (see Figure 1.13).
This finding is consistent with many other studies on women in senior leadership, which note that while women have made great strides into middle management positions, they still are underrepresented in senior leadership positions. In Closing the Leadership Gap: Why Women Can and Must Help Lead the World, author Marie Wilson reports “Women are nearly half of the workforce, yet we make up only 9.4%of top executives and 15.6% of corporate officers.”3
In a 2009 Harvard Business Review article, authors Herminia Ibarra and Otilia Obodaru discuss the challenges that women face, especially in senior leadership roles, in perceptions of being visionary and demonstrating willingness to test that vision.4 More recently, there has been discussion around the fact that women receive lots of mentorship but less sponsorship than men.5 Sponsorship in this context meaning someone who proactively provides access to key visible positions in the organization.6
Figure 1.12 - Distribution of Male Managers by Stage (N = 204)
Figure 1.13 - Distribution of Female Managers by Stage (N = 259; only 463 managers reported gender)
3 Wilson, Marie. Closing the Leadership Gap: Why Women Can and Must Help Lead the World (2004).
4 Ibarra, Herminia and Otilia Obudaru. “Women and the Vision Thing.” Harvard Business Review, January 2009.
5 Ibarra, Herminia, Nancy M. Carter, and Christine Silva. “Why men Still Get More Promotions than Women.” Harvard Business Review, September 2010.
6 Hewlett, Sylvia Ann, and Kerrie Peraino, Laura Sherbin, and Karen Sumberg. “The Sponsor Effect: Breaking Through the Last Glass Ceiling,” HBR Research Report, December 2010.

12
Since our study included participants in Asia, the following statement about the progress of women in management in mainland China is illustrative, “Nevertheless, the adoption of such [rational] procedures [meaning government policies]...had led to more women at management level, although they remain disadvantaged where social capital is influential (emphasis added), as organisational status and roles are intrinsically linked to status and roles in society.”7
Stage 4, strategic contribution, is very much linked to high levels of influence, and women may lack the necessary support to have the influence skills needed at the Stage 4 contribution level.
Also noted in Hong Kong (part of our Eastern sample) by Dr. Chris Rowley, “although changes have taken place, gender inequalities also persist...what had not greatly changed was the common view that women were primarily responsible for children and families. Many women of child-bearing age either left the labour force or held themselves back from higher-level positions if they remained. Long working hours and overtime exacerbated this work-family conflict.”8
These conflicts may mean that some women are leaving the workforce before the opportunities for Stage 4 contribution present themselves.
Proportion of Managers and Non-Managers within Each Stage
Next we examined the proportion of managers/non- managers in each stage, wanting to know the percentage of each in a given stage. The results confirm what we have long suspected, and present a “good news” and “bad news” story, shown in Figure 1.14.
The good news is that about one third of those viewed as contributing in Stage 3 and about one fourth of those viewed contributing in Stage 4 are not people managers, but rather individual contributors, confirming that it is not only possible, but quite common for people to contribute in
7/8 Rowley, Chris and Vilmolwan Yukongdi. The Changing Face of Women Managers in China and Hong Kong. Centre from Research on Asian Management, City University UK and School of Management and Marketing, University of Southern Queensland, Australia, 2009.
Figure 1.14 - Percent of People Managers and Non-Managers/ Individual Contributors in each Stage, as rated by Managers
13
a very influential way without having a formal management title. This is particularly good news for people who want to have broader influence and achieve greater results, but do not desire to have management responsibilities.
The bad news is that a significant portion of Stages 1 and 2 are made up of people managers (about one fourth of those in Stage 1 and about one third of those in Stage 2). This data, combined with the data in Figure 1.9 (page 17), strongly support the need for continued development of those with people management responsibility. A recent survey of 2,482 U.S. employers by Harris Interactive, on behalf of CareerBuilder. com, found that 58% of new managers said they did not receive any training on how to be a manager. Twenty-six percent of managers felt they were unprepared to transition into management roles. Handling conflicts, motivating teams, and performance reviews were several specific areas identified as challenges due to a lack of training.9
A manager who has a Stage 2 mindset focuses her time on her own tasks or priorities, and views requests for help from others as an interruption rather than as an opportunity to build capacity in others. These managers also may not be fully leveraging and engaging their teams’ talents, which can have a negative effect on retention rates and productivity. Their teams are depending on their ability to have credibility and influence in the organization, and also to provide support and coaching for their own development.
As economic conditions improve, retention concerns will increase, and in many countries in Asia, these concerns are already top-of-mind. Strong, capable people managers make a real difference in retention rates. Many of the reasons for leaving a job above can be mitigated by a manager who really understands that her role is to coach and develop others, and to provide opportunities for team members to find and connect with challenging, meaningful job assignments in the organization.
9 Survey quoted in T+D magazine, June 2011; Survey conducted November 15 - December 2, 2010.

14
Overall Manager Distribution by Generation
If we look at the manager population by generation, we note that Baby Boomers make up the highest percentage of Stage 3 (and Stage 4) managers, giving some weight to the idea that experience makes a difference. Generation Y makes up the largest percentage of Stage 2, which is not surprising given that members of this generation are still early in their careers. However, we found that about 40% of our overall sample of Gen Y is contributing in Stage 3, showing they are making progress in being recognized as having greater impact, gaining influence and working through others, whether in formal managerial positions or not.
Overall Manager Distribution by Ethnicity
The data in Figure 1.15 is from the U.S. only, since ethnicity categories across the globe are not directly comparable, and the U.S. made up the largest portion of our sample. As shown in Figure 1.16 below, two key things stand out: managers of Asian ethnicity make up the largest portion of Stage 2, and are less represented in Stage 3. Asian managers may tend to stay closer to their technical roots, and view their success (and value) coming more from their technical knowledge. Although the data in Figure 1.16 is US data only, we also saw a similar result in our data set from Asia; Asian managers overall were rated more in Stage 2 than their U.S. counterparts.10 For Black/ African American managers, their representation in Stage 3 is similar to whites; however, their representation in Stage 4 is absent. Again, our sample of Stage 4 contribution was small. The Hispanic/Latino representation in Stage 3 was higher than for the other ethnicities. Although our sample may not be completely representative of the workforce, it does point out the need for continued support and emphasis to help people of color achieve Stage 4 (Strategic) contribution.
Figure 1.15 - Overall Distribution of Managers by Generation
Figure 1.16 - Overall Distribution of Managers by Ethnicity (US data only)
10 See The Four Stages of Contribution Research 2011 Eastern- Western Comparison Report, available at www.globalnovations.com.
15
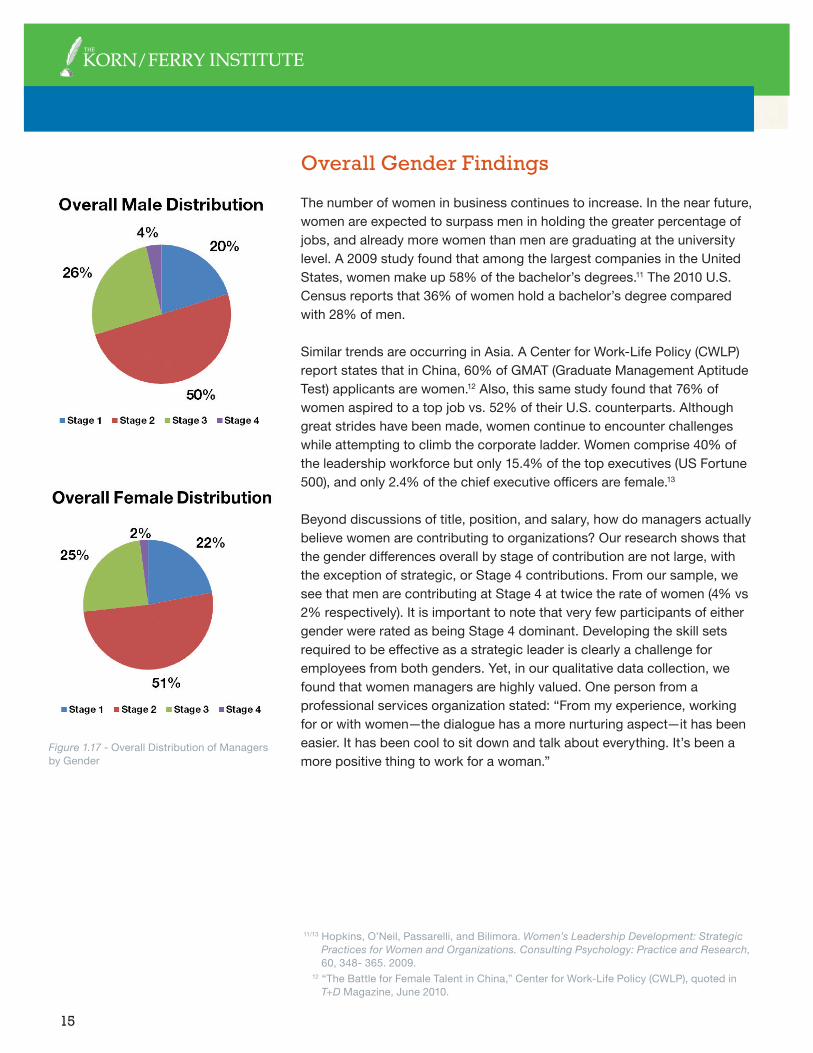
Overall Gender Findings
The number of women in business continues to increase. In the near future, women are expected to surpass men in holding the greater percentage of jobs, and already more women than men are graduating at the university level. A 2009 study found that among the largest companies in the United States, women make up 58% of the bachelor’s degrees.11 The 2010 U.S. Census reports that 36% of women hold a bachelor’s degree compared with 28% of men.
Similar trends are occurring in Asia. A Center for Work-Life Policy (CWLP) report states that in China, 60% of GMAT (Graduate Management Aptitude Test) applicants are women.12 Also, this same study found that 76% of women aspired to a top job vs. 52% of their U.S. counterparts. Although great strides have been made, women continue to encounter challenges while attempting to climb the corporate ladder. Women comprise 40% of the leadership workforce but only 15.4% of the top executives (US Fortune 500), and only 2.4% of the chief executive officers are female.13
Beyond discussions of title, position, and salary, how do managers actually believe women are contributing to organizations? Our research shows that the gender differences overall by stage of contribution are not large, with the exception of strategic, or Stage 4 contributions. From our sample, we see that men are contributing at Stage 4 at twice the rate of women (4% vs 2% respectively). It is important to note that very few participants of either gender were rated as being Stage 4 dominant. Developing the skill sets required to be effective as a strategic leader is clearly a challenge for employees from both genders. Yet, in our qualitative data collection, we found that women managers are highly valued. One person from a professional services organization stated: “From my experience, working for or with women—the dialogue has a more nurturing aspect—it has been easier. It has been cool to sit down and talk about everything. It’s been a more positive thing to work for a woman.”
Figure 1.17 - Overall Distribution of Managers by Gender
11/13 Hopkins, O’Neil, Passarelli, and Bilimora. Women’s Leadership Development: Strategic Practices for Women and Organizations. Consulting Psychology: Practice and Research, 60, 348- 365. 2009.
12 “The Battle for Female Talent in China,” Center for Work-Life Policy (CWLP), quoted in T+D Magazine, June 2010.

16
Overall Generational Findings
For purposes of this research, we used the following age brackets to correspond to approximate generational categories. The generational categories below are widely accepted in the US and understood in other locations; although we recognize that generational differences vary widely by geographic region.
• Generation Y (born 1981–1994)
• Generation X (born 1965–1980)
• Baby Boomer (born 1946–1964)
• Mature (born 1928–1945)
As many as four distinct generations are included in today’s workforce, the first time in history that such an age range has existed among employees. However, the numbers of Matures in our sample and the workforce overall was small, and declining, so we have excluded them from this analysis. While much has been written about the characteristics of each generation, the current research aims to consider generational differences through the lens of behavioral contribution. Research participants were asked to report their age and generational categories in the above four categories.
The data in Figure 1.18 suggests that Generation X and Baby Boomers are contributing similarly, in all stages. We would expect that Baby Boomers, given their greater level of experience, would be found in larger numbers in Stage 3— working through others to share their experience, in formal and informal leadership positions. The contribution profile of Gen Y is a little different, which was proportionately higher in Stage 1 and less in Stage 3, which might be expected since this generation is newer to the workforce. There is a need for continued development efforts for all generations, although the exact nature of that development may look different—for Gen Y, it may be about gaining visibility, seeking mentors and skill development, for Gen X, it may be more about networking with senior leaders and finding opportunities to broaden their skills, and for Baby Boomers it may be more focused on mentoring younger employees
Figure 1.18 - Overall Generational Findings (Note: Due to small sample size, “Matures” were excluded from this figure.)

17
and sharing their expertise in a more visible fashion. Reverse mentoring is gaining a lot of attention these days as a way, for example, for younger workers to share their knowledge of technology with older workers. These relationships can have long-term beneficial value for all by providing a way to share knowledge, and recognizing that the younger generation can add great value.
Our qualitative data suggest that age may be a factor in determining stage of contribution. One person stated, “People look at someone’s age and wonder if she/he can do that [task]...I think that being young is a factor in being able to move into management, especially.” Another person stated, “Some [people] are reluctant or scared to share information with new hires, and those who might be new to a role, since that is their value.” Fear of becoming less valued is a particular concern for Baby Boomers as they become the “older generation” and may be seen as less current in their skills, or less able to learn new technology.
Overall Ethnicity Findings
For our analysis in this section, we used only U.S. data, which was the largest segment of our sample. The reason for the focus on the US is the difference globally in how ethnicity is defined. On an overall basis, the distribution of the different ethnic groups is quite similar.
In Figure 1.19, we see that Asians make up a larger percentage of Stage 2 and a lower percentage of Stage 3. A study entitled Asians in America: Unleashing the Potential of the “Model Minority” revealed some interesting points about Asian American perceptions and challenges; the study found that Asian women in particular are less likely to share new ideas or to challenge a consensus in group meetings.14 Also, high value on technical expertise plays a key role—Asians may be reluctant to
Figure 1.19 - Overall Distribution by Ethnicity (Note: 899 individuals from U.S. data set who received ratings from their manager and provided ethnicity.)
14 Hewlett, Sylvia Ann, Ripa Rashid, Diana Forster, and Claire Ho. “Asians in America: Unleashing the Potential of the ‘Model Minority,’” Center for Work-Life Policy, 2011.

18
positions—because Asian families and culture place much more value on technical expertise. Access to resources may play a role too; only 46% of Asians say they have a mentor in their professional life, compared to more than 60% of Caucasians.
The Hispanic/Latino results in Figure 1.19 are in a sharp contrast to the
were seen as more likely to be contributing in Stage 3 than other ethnic
viewed at a higher rate than other ethnic groups in Stage 1, and somewhat less in Stage 2 than Asians of Blacks/African Americans. Could education be a factor? According to the 2010 US Census, 14% of the Hispanic/Latino population in the U.S. holds a Bachelor’s Degree, compared with 52% of Asians, 33% non-Hispanic whites, and 20% of Black/African Americans.
Blacks/African Americans and Asians were viewed as contributing more in Stage 1 than other ethnic groups. Asians, followed by Blacks/African Americans, were less represented in Stage 3. (“Other” represents multi-ethnic backgrounds and ethnic groups with small representation in our sample.) Whites were the only portion of the sample in Stage 4. As with women, many ethnic groups may be lacking true sponsorship when seeking development for senior level positions. Mentoring with successful minority senior leaders may also be lacking. While our data suggests that overall contribution does not vary widely on ethnicity, ensuring that development initiatives are in place for all ethnic groups in developing strategic skills required for Stage 4 contribution is a challenge that must be addressed.
When we asked our focus groups about the impact of race and ethnicity on their contribution or opportunities, we heard mixed results. In some cases, people felt they had not witnessed race, gender, or background having any
barrier was the employees themselves and what they wanted to pursue. In another organization, there was a belief that race (and age) had held the person back from some development opportunities.
We now look at overall tenure and time in position.

19
Overall Tenure and Time in Position
Although much has been made of the job-hopping trend, 24% of participants in the current data set report being with their current organizations for 11 years or more. Additionally, within this group of long-tenured employees, 140 reported over 20 years of employment with their current organizations. Are these long-tenured employees more often contributing in Stage 3 and 4 capacities, suggesting that as
tenure increases contribution increases? Our data suggests this is not necessarily the case. As seen in Figure 1.20, 42% of those in Stage 1 have two years or less tenure, but also we found 13% of those in Stage 1 had more than 10 years of service. Although our Stage 4 sample was small, it is interesting to note the dichotomy in tenure—32.5% of those in Stage 4 had two years or less tenure and 35% had more than 10 years tenure.
In looking at time in position (Figure 1.21) we note that within each Stage, over 50% have been in their jobs two years or less, which shows how fluid today’s organizations are—changes in organizational structures, mergers, acquisitions, internal movement and external hiring all impact time in position.
From our focus groups, we heard mixed reactions to tenure. In one case, there was a feeling that longer tenure did allow more independence of contribution. In another case, there was a concern that if a person stayed too long in one position, others may begin to question why there has not been a change—long tenure is not always seen as positive.
Figure 1.20 - Overall Distribution by Tenure
Figure 1.21 - Overall Distribution by Time in Position

20
Overall Contribution Rankings by Stage
Do stage of contribution ratings make a difference in how a person is perceived in the organization in terms of overall value, relative to others? To help answer this question, we asked managers about the overall relative contribution of their direct reports. This was done separately from the Four Stages assessment, which determined actual stage placement. We then compared the results of the two analyses. On the vertical axis we placed the percentile rankings of overall contribution—how people were viewed compared with one another—and on the horizontal axis we put the actual stage placement for the same persons. The data indicate that the answer to the above question is “yes.” It appears that stage of contribution as defined by certain key behaviors (see the stage assessment in Appendix A) does differentiate how one is viewed overall relative to others in the organization. This should not be understood to mean that everyone needs to be in Stage 4, but rather that increasing one’s level of contribution will likely result in being perceived as more valuable to the organization.
In Figure 1.22, we compare the original Dalton & Thompson research and our current research, and see that the results are quite similar. The overall values of Stage 1 and 2 in the current research are slightly higher than Dalton and Thompson’s findings, Stage 3 is almost exactly the same, and the value of Stage 4 is lower. The reason for the lower value for Stage 4 contribution may simply be the smaller data sample for this stage in the current research.
Figure 1.22 - Overall Contribution Rankings and Stage Placement
21
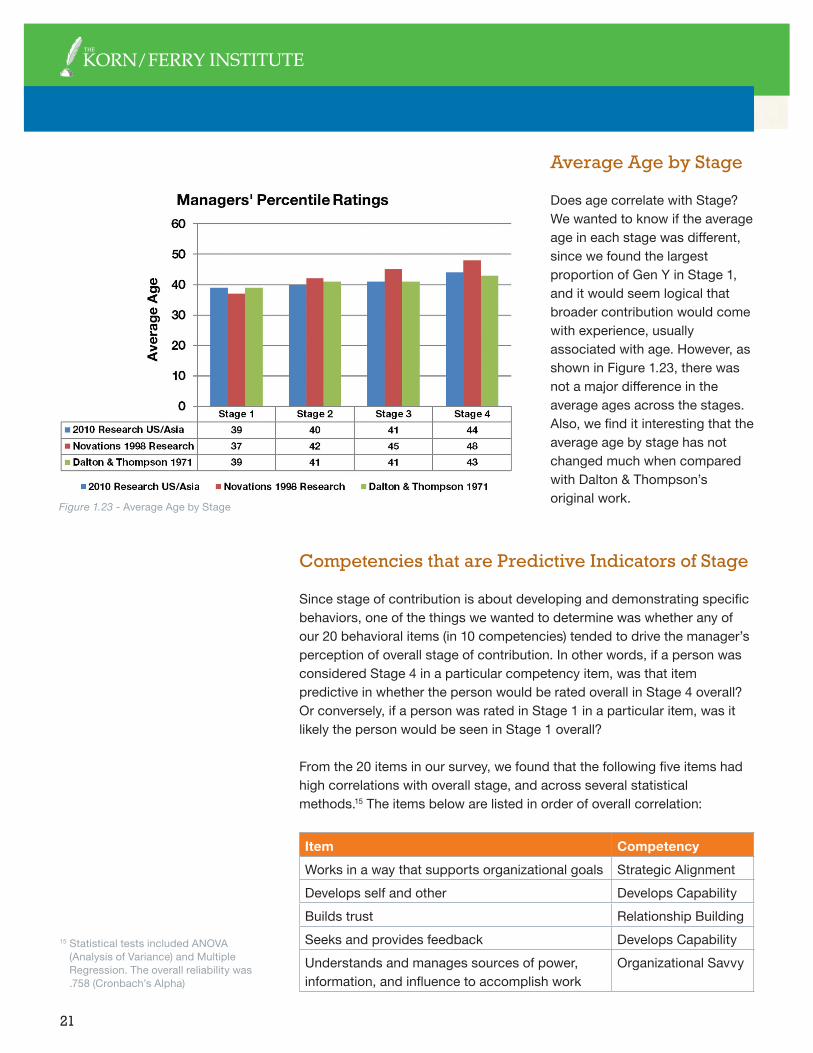
Average Age by Stage
Does age correlate with Stage? We wanted to know if the average age in each stage was different, since we found the largest proportion of Gen Y in Stage 1, and it would seem logical that broader contribution would come with experience, usually associated with age. However, as shown in Figure 1.23, there was not a major difference in the average ages across the stages. Also, we find it interesting that the average age by stage has not changed much when compared with Dalton & Thompson’s original work.
Figure 1.23 - Average Age by Stage
Competencies that are Predictive Indicators of Stage
Since stage of contribution is about developing and demonstrating specific behaviors, one of the things we wanted to determine was whether any of our 20 behavioral items (in 10 competencies) tended to drive the manager’s perception of overall stage of contribution. In other words, if a person was considered Stage 4 in a particular competency item, was that item predictive in whether the person would be rated overall in Stage 4 overall? Or conversely, if a person was rated in Stage 1 in a particular item, was it likely the person would be seen in Stage 1 overall?
From the 20 items in our survey, we found that the following five items had high correlations with overall stage, and across several statistical methods.15 The items below are listed in order of overall correlation:
Item CompetencyWorks in a way that supports organizational goals Strategic AlignmentDevelops self and other Develops CapabilityBuilds trust Relationship BuildingSeeks and provides feedback Develops CapabilityUnderstands and manages sources of power, information, and influence to accomplish work
Organizational Savvy
15 Statistical tests included ANOVA (Analysis of Variance) and Multiple Regression. The overall reliability was .758 (Cronbach’s Alpha)

22
From our analysis, it appears that working to ensure alignment of individual work and the team’s overall contributions with organizational goals is critical in how others view individual contribution. Next, managers’ ratings of their direct reports’ behavior in the competency of Developing Capability was highly predictive. Note that this competency includes personal development, helping others develop their capabilities, as well as proactively seeking and providing feedback to others. Additionally, one’s ability to develop trust with others is also predictive of how one’s overall influence and impact is viewed. Finally, one’s ability to understand and effectively work with sources of organizational power is predictive of overall contribution.
This is not to say that other behaviors cannot also be indicative of one’s level of contribution (overall stage). In looking at items with slightly lower correlations we found that Planning and Organizing can also be a reasonable indicator of overall stage. The two items within the Planning and Organizing competency both show moderately high correlations:
Item CompetencyManages time and resources efficiently Planning and OrganizingPrioritizes Planning and Organizing

23
Summary
The preceding article covers the most significant aspects of our research findings. While our participation was mainly from the U.S., we did have some participation from other countries as well, providing us with additional perspective on contribution. Although we have covered many key points, the following six statements summarize our research findings:
1. The Four Stages of Contribution continue to define high value. As with Dalton and Thompson’s original research, the Four Stages continue to define high value contribution to organizations. Helping people understand that their value is not limited by job title or job description is a major benefit of the Four Stages research.
2. Gaps exist between direct reports and managers on assessment of contribution. Our research continues to point to the need for better dialogue between managers and direct reports on contribution expectations, development goals, and feedback.
3. Too many people managers are contributing independently rather than working through others. The psychological transition from independent to interdependent contribution is challenging, and many managers struggle with this transition, even those with significant tenure and time in position. Organizations must prepare new people managers to handle the responsibility of supporting others in their work.
4. One does not have to be a manager to be viewed as contributing in Stages 3 or 4. Nearly anyone can increase their contribution and value to their organization through demonstrating the behaviors of Stage 3. Our research shows that one third of those in Stage 3 (as determined by their manager) are not people managers, but rather individual contributors. One quarter of those viewed as operating in Stage 4 are also individual contributors. These findings open up non-traditional career paths to those desiring to increase their value but not move into people management.
5. More work is needed to help women and people of color contribute in higher stages, especially Stage 4. Our research shows that progress has been made in helping diverse candidates become successful in Stage 3, although there is still room to improve in this area. What remains elusive for women and people of color is strategic contribution that defines Stage 4. This is a difficult transition for anyone, but especially for those who may not have many role models and sponsors to provide the support required.

24
6. Generation X and Baby Boomers need to step up into Stage 3 and 4 contributions. These generations are now either in mid or late career, and have tremendous experience and knowledge that can benefit Gen Y and even the upcoming “Gen Z.” Our research shows that too many of these generations are in Stage 1 or 2. Coaching and helping to develop the younger generations is an opportunity to share knowledge and to increase the engagement and value of these more senior employees.
Each of the challenges identified here can be addressed with purposeful development on the part of individuals, managers, and organizations. Increased (meaningful) contribution across every stage is a requirement for any organization that predicates its growth on employee performance. If you would like to discuss how these findings apply to your organization, contact us via our website, www.globalnovations.com, or phone, 888.652.9975.

25
Appendix A
Four Stages of Contribution Assessment
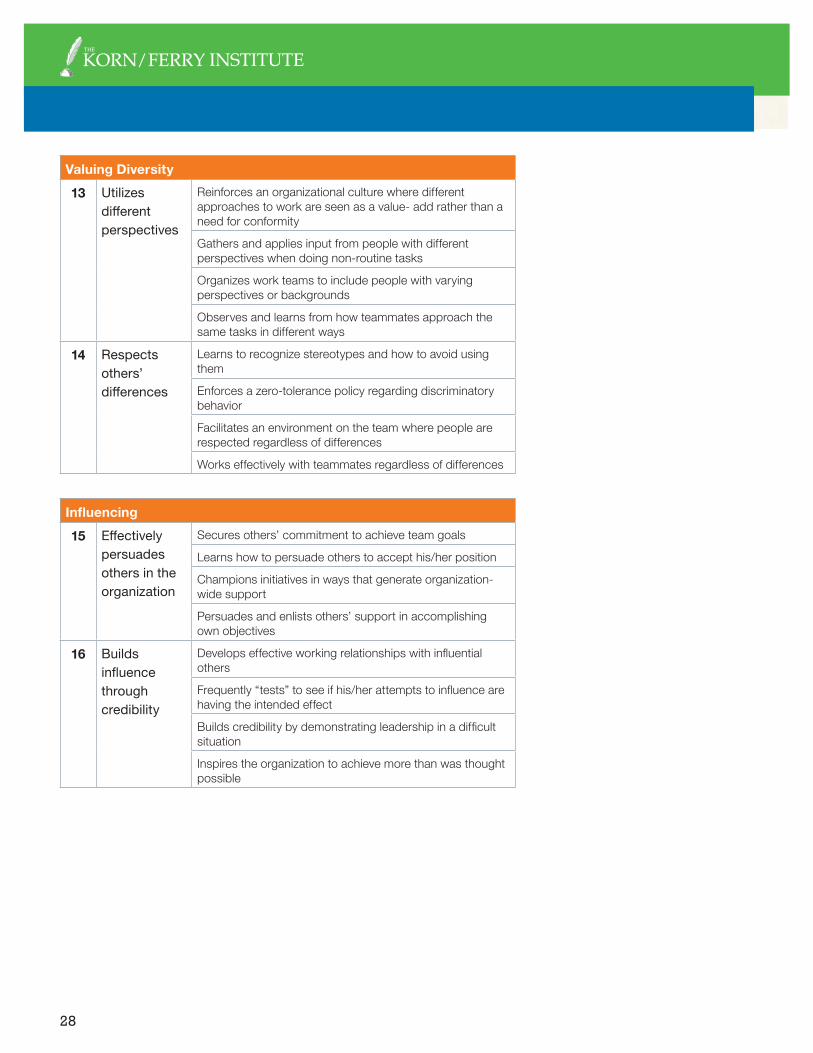
The following 20 items were surveyed. All items provided a “choose not to respond” option.
Learning Predisposition1 Learns from
ExperienceShares own learning experiences and facilitates learning from others within the group
Demonstrates a learning orientation through asking questions of others
Learns from own successes and mistakes
Fosters an organizational environment that encourages and rewards learning
2 Values and pursues on-the-job learning activities
Willingly accepts assignments that present relevant learning opportunities
Reinforces the value of active learning and communicates its organizational impact
Connects the value of learning with team objectives and business goals
Pursues individual learning opportunities, even if they are outside his/her comfort zone
Organizational Savvy3 Works within
organizational culture
Ensures that the organizational culture supports business objectives
Acts in accordance with written and unwritten cultural norms, rules, etc.
Helps others understand how to navigate the organizational culture
Seeks to understand unwritten rules and work practices
4 Understands and manages sources of power, information, and influence to accomplish work
Uses an awareness of formal and informal decision making channels to get things done
Advises others on how formal and informal organizational structures affect business decisions
Gains a basic understanding of how to get things done in the organization
Champions complex organizational initiatives that have strategic value

26
Technical/Functional Expertise5 Demonstrates
technical knowledge
Demonstrates a breadth of technical/functional knowledge outside of core specialty
Has industry-wide perspective and broad knowledge of the disciplines most important to the organization
Applies basic technical/ functional knowledge to complete work
Demonstrates mastery of the technical/functional skills necessary for performing own job
6 Learns/grows in technical areas
Actively seeks additional experience and knowledge in technical/functional areas in order to gain expertise
Is considered an expert in his/her field
Embraces and encourages the technical competence of others as a way to achieve results
Stays abreast of relevant technology advances that can significantly impact organizational performance
Planning and Organizing7 Prioritizes Establishes strategic priorities to help people understand
which initiatives are most important
Does not waste time on tasks that yield low value
Learns to prioritize and work on the most important assignments
Helps people in the workgroup to prioritize their work and manage their time effectively
8 Manages time and resources efficiently
Uses resources efficiently and accurately estimates time and effort required to accomplish work
Ensures that organization has people skills and resources to meet business goals
Coaches others in effective planning and time management techniques
Keeps manager informed of delays or potential problems

27
Strategic Alignment9 Works in a
way that supports organizational goals
Seeks to understand how his/her work contributes to the business
Keeps team focused on objectives that drive company performance and competitive advantage
Holds others accountable for meeting the needs of the total business rather than those of the local business unit
Aligns own work objectives with the organization’s strategic plan or objectives
10 Views work from a “big picture” perspective
Ensures that the organization has broad strategies and plans focused on market needs and competitive advantage
Thinks beyond the “day-to-day” to take a longer- term view of the business
Acts with an understanding of how the marketplace drives the business
Learns how team’s work relates to overall business strategy
Develops Capability11 Seeks and
provides feedback
Seeks developmental feedback and focuses on developing relevant capabilities
Seeks specific feedback about own work and takes appropriate action
Coaches others in order to help improve their contribution
Ensures that organizational systems are in place to give every employee feedback and tools to implement development plans
12 Develops self and others
Provides development opportunities to others
Develops self as directed by others
Focuses on developing self in important ways
Champions organizational efforts that support development of all employees
28
Valuing Diversity13 Utilizes
different perspectives
Reinforces an organizational culture where different approaches to work are seen as a value- add rather than a need for conformity
Gathers and applies input from people with different perspectives when doing non-routine tasks
Organizes work teams to include people with varying perspectives or backgrounds
Observes and learns from how teammates approach the same tasks in different ways
14 Respects others’ differences
Learns to recognize stereotypes and how to avoid using them
Enforces a zero-tolerance policy regarding discriminatory behavior
Facilitates an environment on the team where people are respected regardless of differences
Works effectively with teammates regardless of differences
Influencing15 Effectively
persuades others in the organization
Secures others’ commitment to achieve team goals
Learns how to persuade others to accept his/her position
Champions initiatives in ways that generate organization-wide support
Persuades and enlists others’ support in accomplishing own objectives
16 Builds influence through credibility
Develops effective working relationships with influential others
Frequently “tests” to see if his/her attempts to influence are having the intended effect
Builds credibility by demonstrating leadership in a difficult situation
Inspires the organization to achieve more than was thought possible

29
Relationship Building17 Networking
capabilitiesMaintains a broad network of effective internal working relationships
Utilizes technical and business contacts to meet job responsibilities
Develops and utilizes professional relationships outside the company that help generate resources or information
Seeks guidance in establishing technical and business contacts inside the organization
18 Builds trust Works to earn others’ trust
Fosters an organizational environment where trust is considered a key factor in building long- term relationships
Facilitates a climate of trust and respect between team members
Builds trust with others by acting consistently with group/organizational values and expectations
Business Acument19 Understands
organization’s value proposition
Consistently delivers on the organization’s value proposition to customers
Supports and invests in opportunities for long- term organizational value
Ensures that the work group delivers services in a way that brings out the organization’s value and competitive advantage
Actively tries to learn why customers choose this organization over competitors
20 Keeps up with relevant developments
Continually educates team on important developments within the organization
Learns where to get information about new developments and emerging trends
Continually monitors trends, competitors, etc., relevant to own work
Continually shares own knowledge of trends, competitors, etc., that affect the organization
30
Appendix B
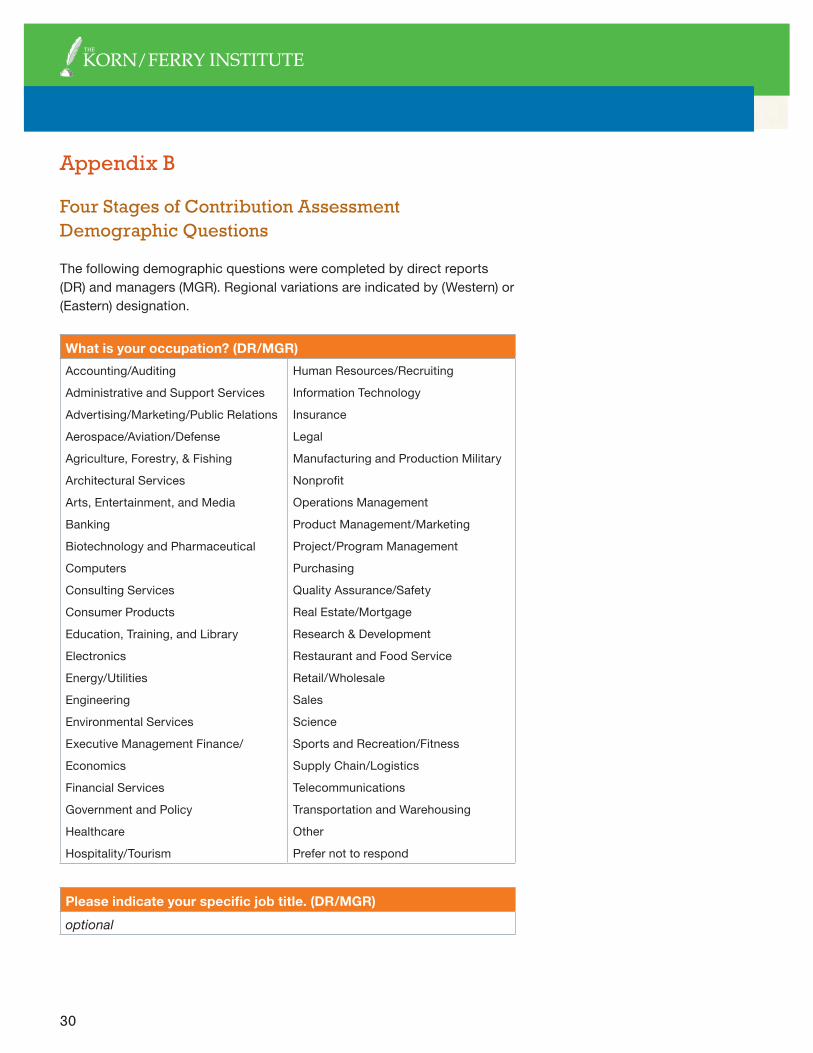
Four Stages of Contribution Assessment Demographic Questions
The following demographic questions were completed by direct reports (DR) and managers (MGR). Regional variations are indicated by (Western) or (Eastern) designation.
What is your occupation? (DR/MGR)Accounting/Auditing
Administrative and Support Services
Advertising/Marketing/Public Relations
Aerospace/Aviation/Defense
Agriculture, Forestry, & Fishing
Architectural Services
Arts, Entertainment, and Media
Banking
Biotechnology and Pharmaceutical
Computers
Consulting Services
Consumer Products
Education, Training, and Library
Electronics
Energy/Utilities
Engineering
Environmental Services
Executive Management Finance/
Economics
Financial Services
Government and Policy
Healthcare
Hospitality/Tourism
Human Resources/Recruiting
Information Technology
Insurance
Legal
Manufacturing and Production Military
Nonprofit
Operations Management
Product Management/Marketing
Project/Program Management
Purchasing
Quality Assurance/Safety
Real Estate/Mortgage
Research & Development
Restaurant and Food Service
Retail/Wholesale
Sales
Science
Sports and Recreation/Fitness
Supply Chain/Logistics
Telecommunications
Transportation and Warehousing
Other
Prefer not to respond
Please indicate your specific job title. (DR/MGR)optional

31
In what industry is your organization? (DR/MGR)Accommodations and Food Services
Agriculture, Forestry, Fishing, and Hunting
Arts, Entertainment, and Recreation
Banking
Construction
Education, Primary and Secondary
Education, Higher (colleges and universities)
Engineering
Finance
Government, State (Province) or Local
Government, Federal (National)
Health Care and Social Assistance
Information/Media
Insurance
Investments
IT hardware/software/services
Management, Administrative and Support
Manufacturing
Mining
Professional, Scientific, and Technical Services
Public Administration and Active Duty Military
Real Estate
Retail
Scientific and Technical Services
Telecommunications
Transportation and Warehousing
Utilities
Wholesale
Other
Prefer not to respond
How many different positions, both within this organization and, if applicable, within other organizations, have you held in the last three years? (DR/MGR)
¨ 1
¨ 2
¨ 3
¨ 4
¨ 5 or more
¨ Prefer not to respond
How long have you been employed at this organization? (DR/MGR)
¨ Less than one year
¨ 1-2 years
¨ 3-5 years
¨ 6-10 years
¨ 11-15 years
¨ 16-20 years
¨ More than 20 years
¨ Prefer not to respond

32
How long have you been employed in your current position? (DR/MGR)
¨ Less than one year
¨ 1-2 years
¨ 3-5 years
¨ 6-10 years
¨ 11-15 years
¨ 16-20 years
¨ More than 20 years
¨ Prefer not to respond
What is your approximate annual salary in US dollars? (DR/MGR)
¨ Less than $25,000
¨ $25,000 - $49,000
¨ $50,000 - $49,000
¨ $75,000 - $99,000
¨ $100,000 - $124,000
¨ $125,000 - $150,000
¨ More than $150,000
¨ Prefer not to respond
What percent bonus did you receive last year? (DR/MGR)
¨ 1-2%
¨ 3-5%
¨ 6-10%
¨ 11-15%
¨ 16-20%
¨ 20-30%
¨ More than 30%
¨ I did not receive a bonus last year
¨ Prefer not to respond
How many employees does your organization employ worldwide? (MGR)
¨ Less than 100
¨ 100 - 999
¨ 1,000 - 2,499
¨ 2,500 - 4,999
¨ 5,000 - 9,999
¨ 10,000 - 49,999
¨ 50,000 - 99,999
¨ More than 100,000
¨ Prefer not to respond
How many employees does your organization employ at this facility? (MGR, Western)
¨ Less than 100
¨ 100 - 999
¨ 1,000 - 2,499
¨ 2,500 - 4,999
¨ 5,000 - 9,999
¨ 10,000 - 49,999
¨ 50,000 - 99,999
¨ More than 100,000
¨ Prefer not to respond
How many employees does your organization employ in your country? (MGR, Eastern)
¨ Less than 100
¨ 100 - 999
¨ 1,000 - 2,499
¨ 2,500 - 4,999
¨ 5,000 - 9,999
¨ 10,000 - 49,999
¨ 50,000 - 99,999
¨ More than 100,000
¨ Don’t know
¨ Prefer not to respond

33
What is the approximate gross annual revenue of your organization worldwide? (MGR, Western)
¨ Less than $1 Million
¨ $1M - $5M
¨ $6M - $10M
¨ $11M - $50M
¨ $51M - $100M
¨ $101M - $500M
¨ $501M - $1B
¨ More than $1 Billion
¨ Don’t know
¨ Prefer not to respond
What is the approximate gross annual revenue of your organization in your country? (MGR, Eastern)
¨ Less than $1 Million
¨ $1M - $5M
¨ $6M - $10M
¨ $11M - $50M
¨ $51M - $100M
¨ $101M - $500M
¨ $501M - $1B
¨ More than $1 Billion
¨ Don’t know
¨ Prefer not to respond
Are you: (DR/MGR) ¨ Male
¨ Female
¨ Prefer not to respond
Please indicate your highest completed level of education. (DR/MGR, Western)
¨ High school
¨ Trade school / technical degree
¨ 2-year college degree
¨ 4-year college degree
¨ Masters/MBA
¨ Doctorate
¨ Other
¨ Prefer not to respond
Please indicate your highest completed level of education. (DR/MGR, Eastern)
¨ High school
¨ Trade school / technical degree
¨ 2-year college degree
¨ 4-year college degree
¨ Masters/MBA
¨ Doctorate
¨ Other
¨ Prefer not to respond
Please indicate your age (by year of birth). (DR/MGR)
¨ Born 1928-1945
¨ Born 1946-1964
¨ Born 1965-1980
¨ Born 1981-1994
Do you currently, or have your previously has, a mentor is your career? (DR/MGR, Eastern)
¨ Yes
¨ No
¨ Prefer not to respond

34
Please indicate your race and/or ethnic heritage. (DR/MGR, Western)
¨ White
¨ Black or African American
¨ American Indian or Alaska Native
¨ Asian Indian
¨ Chinese
¨ Filipino
¨ Japanese
¨ Spanish/Hispanic/Latino
¨ Korean
¨ Vietnamese
¨ Native Hawaiian
¨ Guamanian or Chamorro
¨ Samoan
¨ Other (please specify)
¨ Prefer not to respond
In which geographic region do you work? (DR/MGR, Western)
¨ Africa
¨ Asia
¨ Caribbean
¨ Central America
¨ Europe East
¨ Europe West
¨ Middle East
¨ North America
¨ South America
¨ Other (please specify)
¨ Prefer not to respond
Please indicate your nationality. (DR/MGR, Eastern)
¨ Chinese (Hong Kong)
¨ Chinses (Mainland China)
¨ Chinese (Taiwan)
¨ Asian Indian
¨ Filipino
¨ Indian (South Asia)
¨ Indonesian
¨ Japanese
¨ Korean
¨ Malaysian
¨ Singaporean
¨ Thai
¨ Vietnamese
¨ Other (please specify)
¨ Prefer not to respond
In which geographic region do you work? (DR/MGR, Eastern)
¨ Australia and New Zealand
¨ Indonesia
¨ Japan
¨ Korea
¨ Mainland China
¨ Malaysia
¨ Philippines
¨ Singapore
¨ South Asia
¨ Taiwan
¨ Thailand
¨ Vietnam
¨ Other (please specify)
¨ Prefer not to respond

35
Appendix C
Research Focus Groups
Upon reviewing the quantitative results from the research, different demographic sub-groups were identified to participate in focus group sessions. The purpose of the focus groups was to collect qualitative results in order to further understand:
• How the Four Stages of Contribution model can be applied to 21st century careers
• Employee development and contribution
• Areas of improvement in organizational efficiency and productivity
We facilitated focus groups with three different organizations. The group participants we selected randomly based upon demographic criteria and were on a volunteer basis. The demographic criteria were based on employees representing each of the Four Stages, different generations, tenure, ethnicity (African American and women), and employees outside corporate offices. The number of participants in each group ranged from six to 12. To encourage participants to speak frankly and thoughtfully, we guaranteed anonymity.
Seventeen focus groups were conducted over a period of six months.

36
Appendix D
Analysis Explanation
The purpose of this section is to explain the rationale for establishing overall stage ratings for individuals where ratings are available on a group of competency questionnaire items.
In the past, only a single data point was generated by managers establishing an individual’s stage. In their research Dalton and Thompson generally “...explained the four stages... and...we gave the managers a deck of three-by-five cards with the names of each person on a card and asked the manager to place them in four piles representing the four stages.”
On the basis of this technique the Four Stages career model and relationship to perceived performance was established. This same technique of obtaining an overall stage rating for individuals was employed for the 1998 Novations revisit of the model.
The current research employed a different technique. Twenty questions based on 10 competencies (two questions per competency) were presented to managers. The managers were asked to describe the stage level that the individual was performing for each question. Managers were not asked for their overall rating—our research model described below was used to establish overall stage of the individual.
On the basis of the Dalton and Thompson research and our work with the Four Stages model over the past 25 years, we recognized that few individuals performed all of their activities within just one of the Four Stages. In other words, a Stage 3 individual may also do some Stage 2 work. A Stage 1 individual may be performing some tasks at a Stage 2 level. The challenge is to numerically establish an overall stage when there is some variance in each individual’s ratings. Indeed, of the 1,925 participants in the current study, only three had no variance in their ratings.
The dataset contained up to 20 stage ratings per individual. (Note: there was some missing data.) The central tendency statistical indices (mode, median, mean) were deemed to
be inadequate in categorizing individuals. For example, if an individual received seven Stage 1 ratings and six each in Stages 2 and 3, the mode would categorize this individual as a Stage 1 performer, although a majority of their effort was spend in higher stages. The median and mean, along

37
with the mode, categorized many individuals appropriately—but had too many exceptions where it became obvious that a proper stage rating was not being derived.
We then turned to rationale pattern analysis to establish stage. The following outlines the filtering process followed:
1. If an individual was rated at any stage on two thirds or more of the 20 items, we deemed the individual to be performing at that stage. On a sensitivity basis, we also considered 50% and 75% criteria.
2. For individuals not categorized in the above step, we selected those who were rated at or above 60% at Stages 3 and 4 combined. These individuals were performing at either Stage 3 or 4. The individuals rated as performing greater than 30% of their behaviors at Stage 4 were deemed to be at Stage 4. The rest of this cohort was deemed to be in Stage 3.
3. For those individuals who were not filtered out by the steps outlined above, we selected those who were rated as performing 60% or more of the 20 items at Stages 2, 3, or 4. If more than 30% of their ratings were at Stage 3, they were deemed to be performing at that stage. The remaining individuals from this group were deemed to be at Stage 2.
4. Finally, the remaining individuals performing 60% or more in Stages 1 and 2, and more than 30% in Stage 2, were deemed to be performing in Stage 2. The rest were deemed to be Stage 1 performers.
5. We declared as anomalies individuals with very unusual patterns such as 25% of their ratings in each of the four stages. A total of 55 anomalies were identified.
6. Although the “cut-off” scores employed were based on rational thought and not selected to achieve a specific stage distribution, the results were extremely close to the distributions found in the original research and 1998 updates. Comparisons between the US and Asian participants were not affected when different “cut-off” scores were tested.

38
Appendix E
Survey Participants
Participating Organizations:
AmorePacific
AWB (Brazil)
Bayer
British Transport Police Coach
Coca – Cola (Brazil) Decathlon
DuPont
General Mills
ING
Inverness Medical Innovations (UK)
Inverness Medical/Biosite (US)
Mary Kay
Novations
Novo Nordisk
Redecard (Brazil)
Right Management
SLS Bearings
WellPoint
Participating Countries:
Brazil
Mainland China and Hong Kong Singapore
United Kingdom
United States

39
Appendix F
Research Partners
About Global Novations
Global Novations (www.globalnovations.com) is a talent management firm that helps leading organizations leverage the power of the global workforce. We partner with clients around the world to address their most pressing business challenges and increase organizational performance. Our inclusion- driven solutions are designed to unleash the capacity of every employee, develop broad leadership behaviors, and promote continuous improvement.
Four Stages of Contribution Research Team
• Executive Sponsor: Mike Hyter, President and Managing Partner
• Project Leader: Paul Terry, Vice President, Global Partnerships
• Project Manager: Simone Solondz
• Project Manager: Marji Marcus
• Project Technical Lead: Alan Graden
• Statistical Analysis: Ed Haltrecht, Ph.D.

40
About Right Management
Right Management (www.right.com) a global leader in talent and career management workforce solutions within ManpowerGroup. We design and deliver solutions to align talent strategy with business strategy. Our capabilities span five broad categories in which we have demonstrated expertise: talent assessment, leader development, organizational effectiveness, employee engagement, workforce transition and outplacement.
Four Stages of Contribution Asia Research Team
• Project Coordinator: Zulinah Mooksan, Manager, Marketing & Strategic Alliance, Asia Pacific
• Executive Sponsor: Ronnie Tan Li Tong, Group Executive Vice President, Asia Pacific
• Project Advisor: Robert Lim, Practice Leader, Talent Management

41
About Leading Indicator Systems (LIS)
Leading Indicator Systems (www.leadingindicator.com) designs, develops and implements state-of-the-art, web-based assessment systems and products. Our innovative solutions are used to measure and track key leading indicators—from employees, customers, suppliers, and markets—that directly impact individual and organizational performance. We partner with organizations to help deliver highly effective assessment solutions in these areas.
Four Stages of Contribution Asia Research Team
• Project Leader: Dr. Bill Nolen, Vice President Research and Development
• Project Manager: Scott Maggs
• Quality Assurance Lead: Pamela Argandoña

42
About Across
Across (www.across.com.br) is an organizational development consultancy with a focus on people management. Based in Brazil, our practices enable consistent and sustainable changes for both the organization and individual and prepare organizations to achieve better results in increasingly competitive environments.

43
About Emenex
Emenex LTD (www.emenex.uk.co), formerly Global Novations UK, bring a great depth of experience and expertise around employee engagement to solutions, coupled with leading research-based tools and methodologies from world leading research and development organisations. We offer comprehensive end-to-end solutions for effective and sustainable change management, talent management and leadership development within organisations of all sizes.

44
About The Korn/Ferry InstituteThe Korn/Ferry Institute generates forward-thinking research and viewpoints that illuminate how talent advances business strategy. Since its founding in 2008, the institute has published scores of articles, studies and books that explore global best practices in organizational leadership and human capital development.
About Korn/Ferry International Korn/Ferry International is a premier global provider of talent management solutions, with a presence throughout the Americas, Asia Pacific, Europe, the Middle East and Africa. The firm delivers services and solutions that help clients cultivate greatness through the attraction, engagement, development and retention of their talent.
Visit www.kornferry.com for more information on Korn/Ferry International, and www.kornferryinstitute.com for thought leadership, intellectual property and research.
© 2013 The Korn/Ferry Institute