the nexus between illicit drug crop cultivation and deforestation in latin america and asia
TRANSCRIPT
The nexus between illicit drug crop cultivation and deforestation
in Latin America and AsiaLiliana M. Dávalos, Stony Brook University
!
Thank you for inviting me and attending this talk. I’ve been investigating the relationship between forest and illicit crops since the 2000s. At the beginning, data were scarce, however with the release of many remote sensing products for forest cover, it has become easier to evaluate how one affects the other
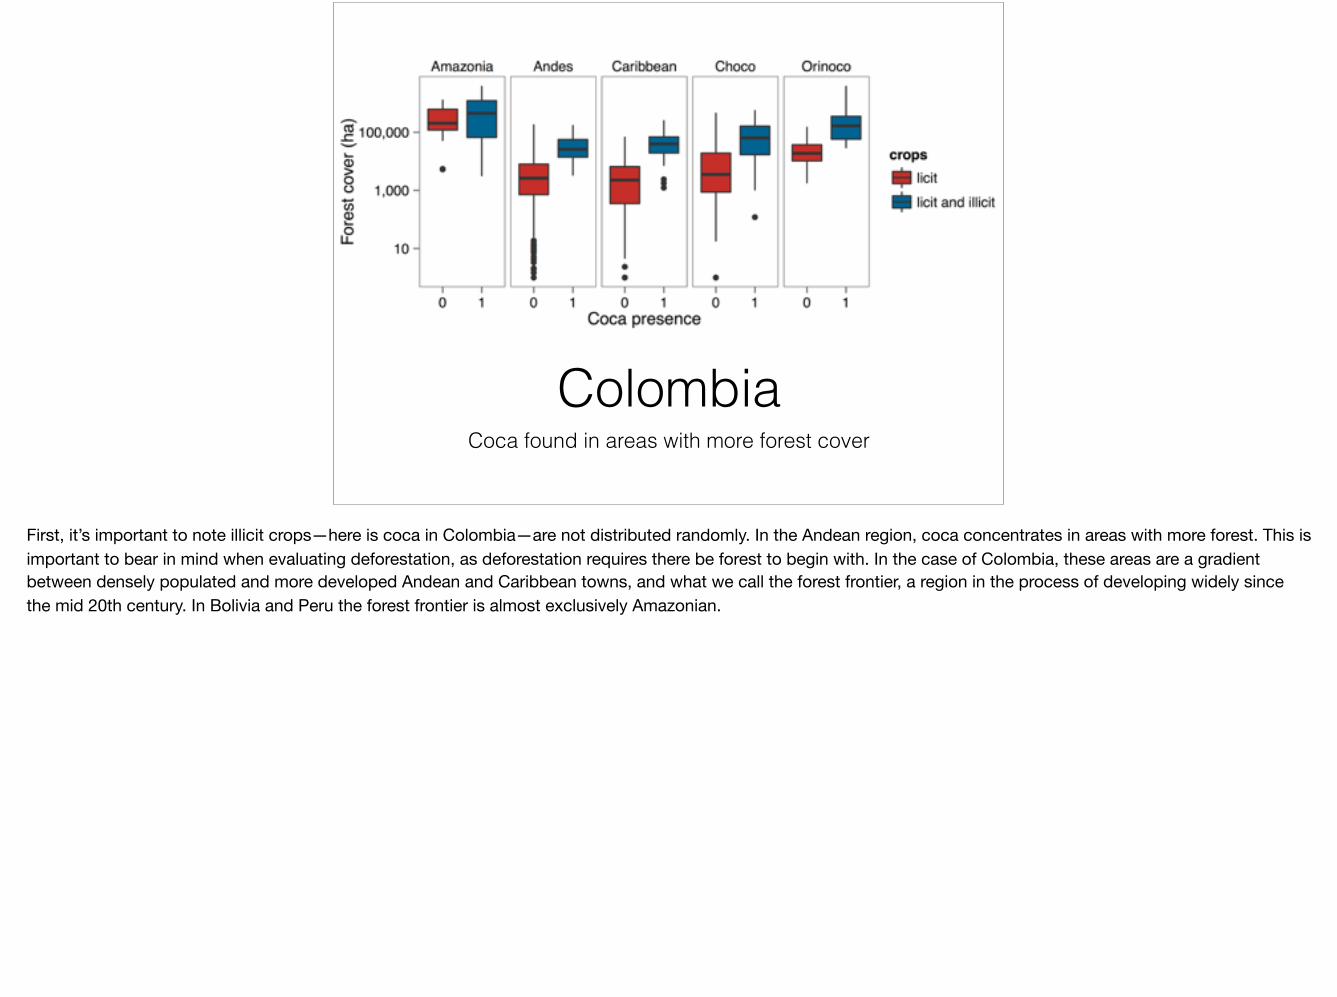
ColombiaCoca found in areas with more forest cover
First, it’s important to note illicit crops—here is coca in Colombia—are not distributed randomly. In the Andean region, coca concentrates in areas with more forest. This is important to bear in mind when evaluating deforestation, as deforestation requires there be forest to begin with. In the case of Colombia, these areas are a gradient between densely populated and more developed Andean and Caribbean towns, and what we call the forest frontier, a region in the process of developing widely since the mid 20th century. In Bolivia and Peru the forest frontier is almost exclusively Amazonian.
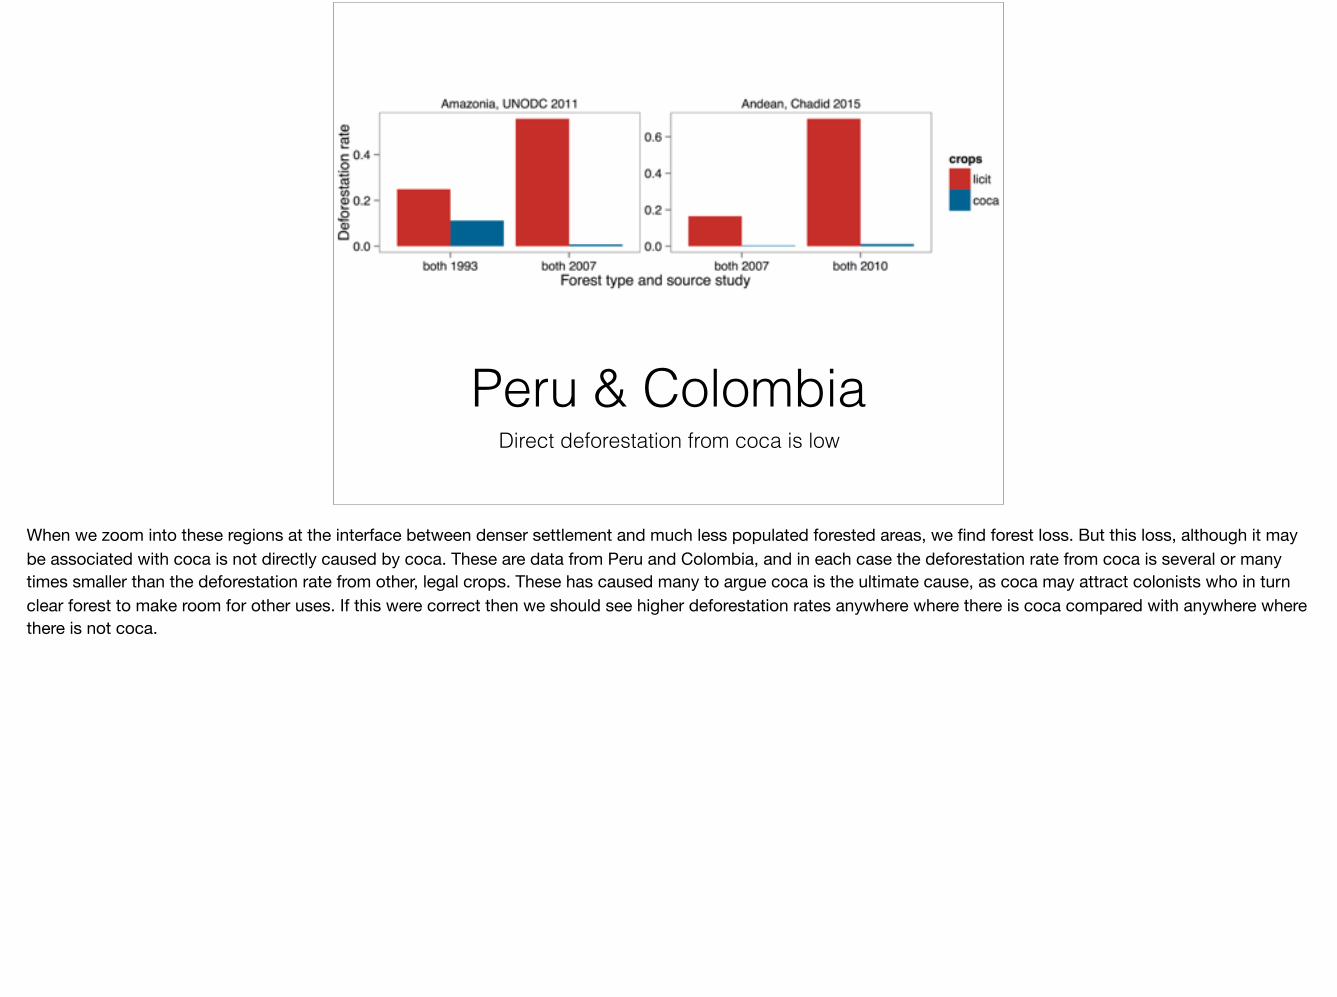
Peru & ColombiaDirect deforestation from coca is low
When we zoom into these regions at the interface between denser settlement and much less populated forested areas, we find forest loss. But this loss, although it may be associated with coca is not directly caused by coca. These are data from Peru and Colombia, and in each case the deforestation rate from coca is several or many times smaller than the deforestation rate from other, legal crops. These has caused many to argue coca is the ultimate cause, as coca may attract colonists who in turn clear forest to make room for other uses. If this were correct then we should see higher deforestation rates anywhere where there is coca compared with anywhere where there is not coca.
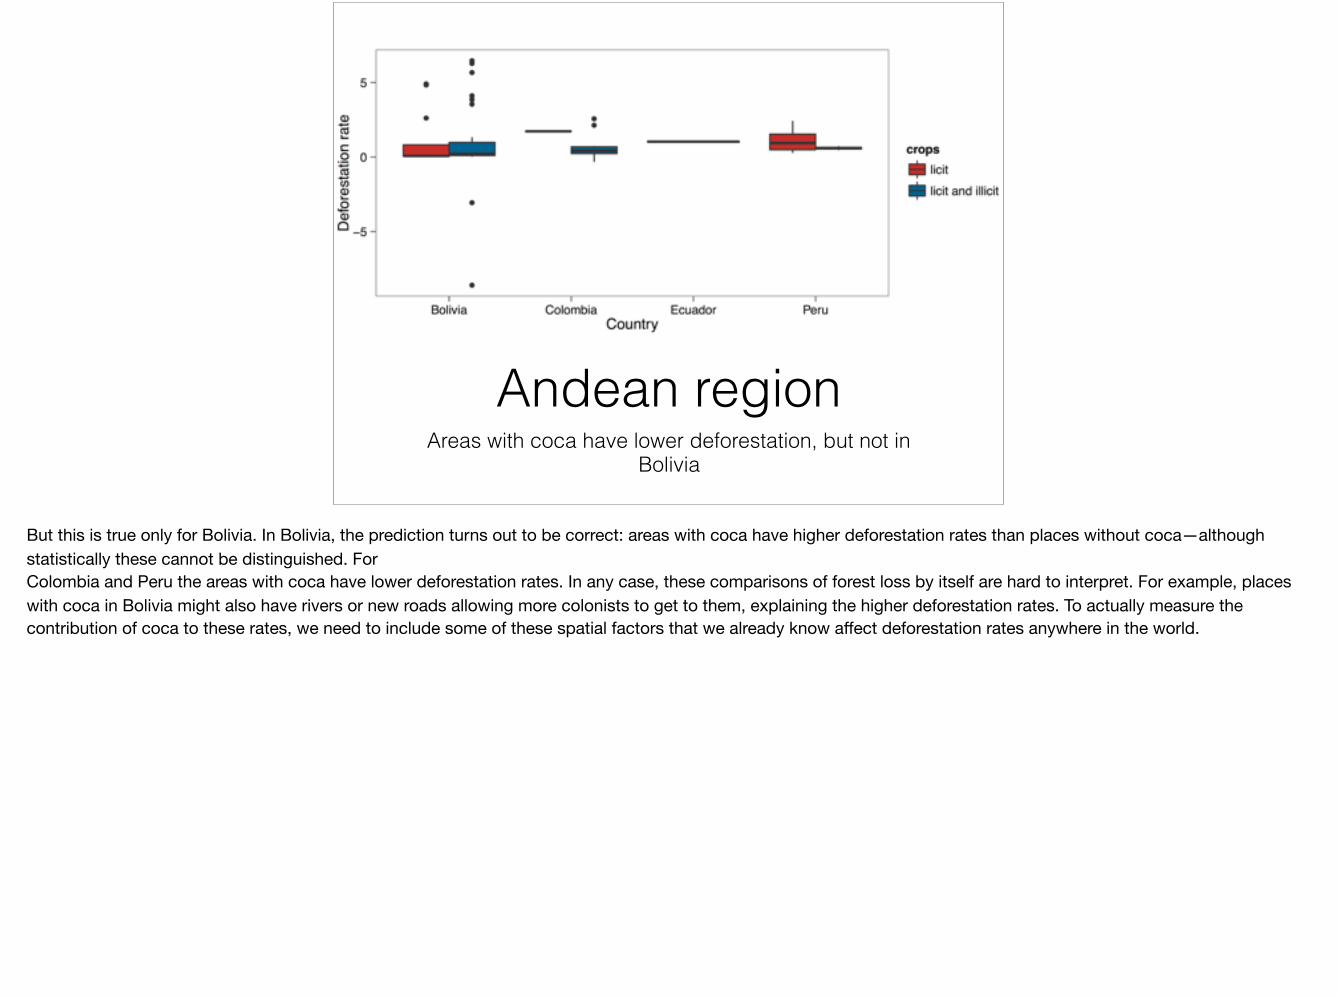
Andean regionAreas with coca have lower deforestation, but not in
Bolivia
But this is true only for Bolivia. In Bolivia, the prediction turns out to be correct: areas with coca have higher deforestation rates than places without coca—although statistically these cannot be distinguished. For Colombia and Peru the areas with coca have lower deforestation rates. In any case, these comparisons of forest loss by itself are hard to interpret. For example, places with coca in Bolivia might also have rivers or new roads allowing more colonists to get to them, explaining the higher deforestation rates. To actually measure the contribution of coca to these rates, we need to include some of these spatial factors that we already know affect deforestation rates anywhere in the world.
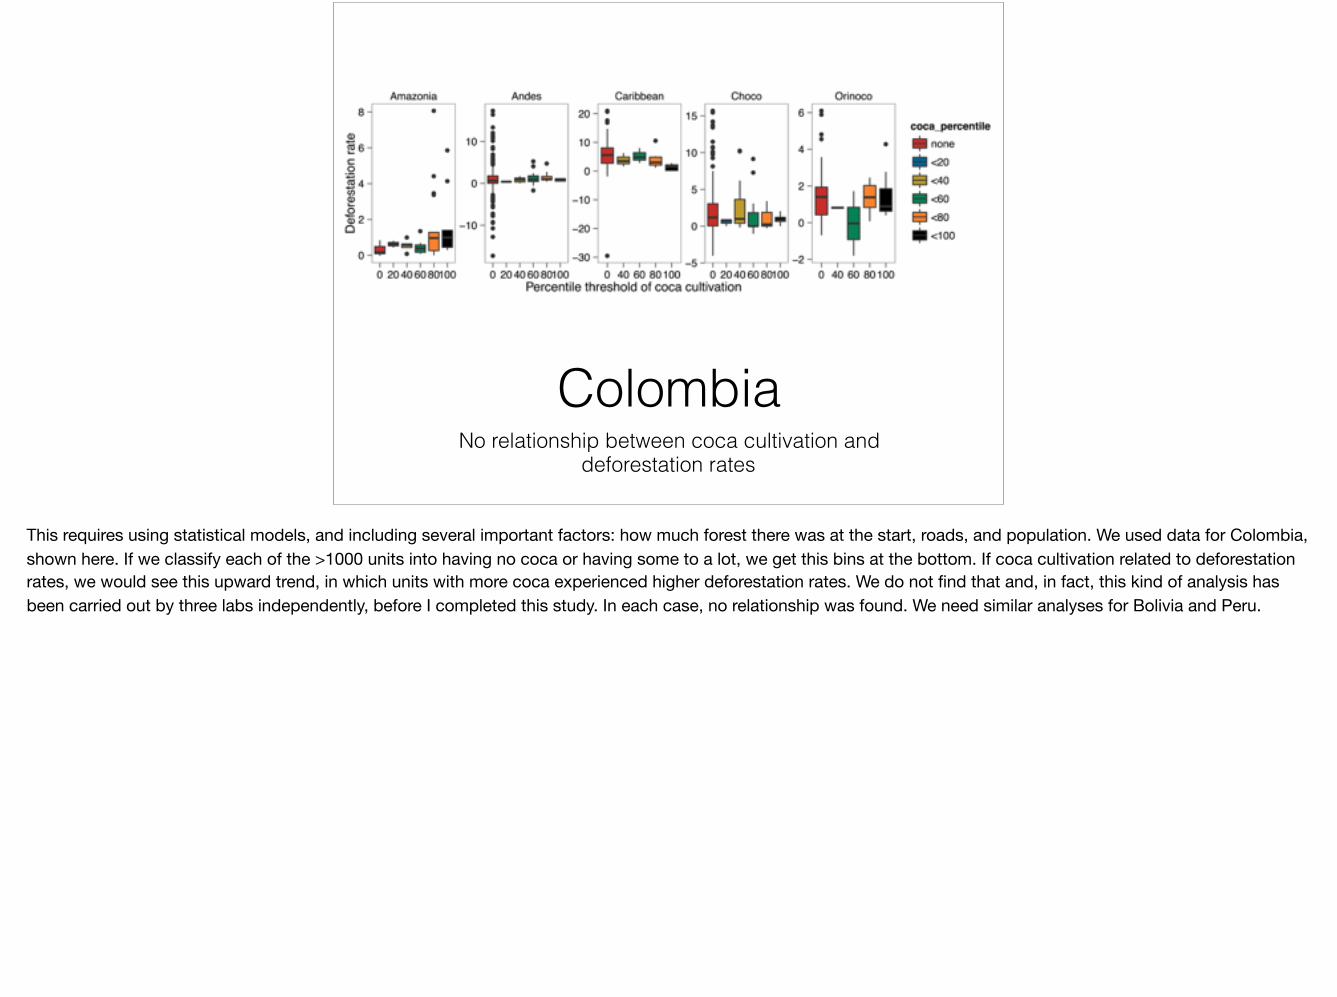
ColombiaNo relationship between coca cultivation and
deforestation rates
This requires using statistical models, and including several important factors: how much forest there was at the start, roads, and population. We used data for Colombia, shown here. If we classify each of the >1000 units into having no coca or having some to a lot, we get this bins at the bottom. If coca cultivation related to deforestation rates, we would see this upward trend, in which units with more coca experienced higher deforestation rates. We do not find that and, in fact, this kind of analysis has been carried out by three labs independently, before I completed this study. In each case, no relationship was found. We need similar analyses for Bolivia and Peru.
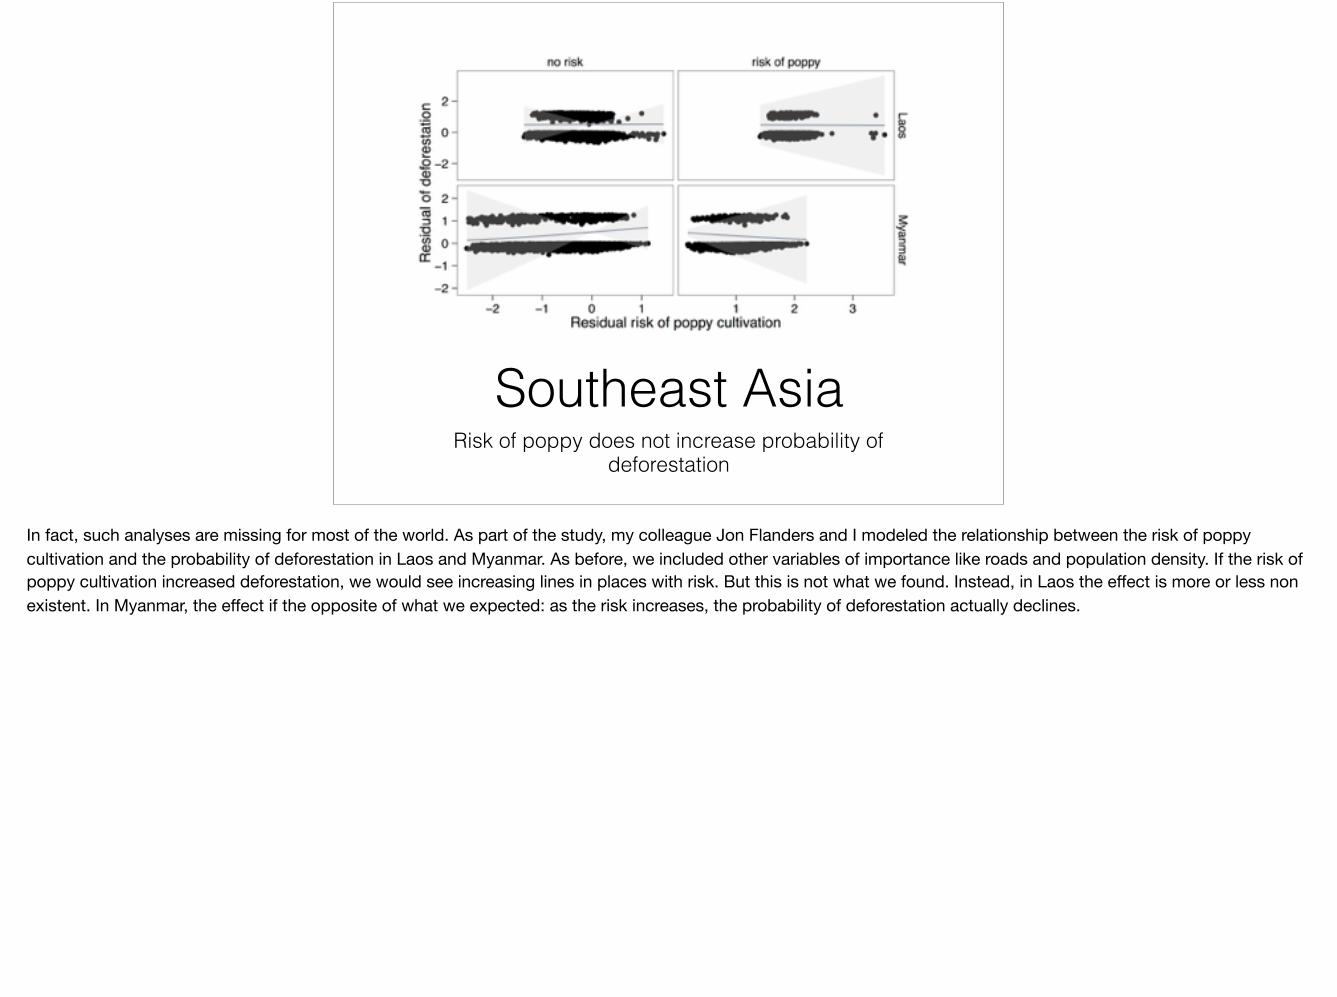
Southeast AsiaRisk of poppy does not increase probability of
deforestation
In fact, such analyses are missing for most of the world. As part of the study, my colleague Jon Flanders and I modeled the relationship between the risk of poppy cultivation and the probability of deforestation in Laos and Myanmar. As before, we included other variables of importance like roads and population density. If the risk of poppy cultivation increased deforestation, we would see increasing lines in places with risk. But this is not what we found. Instead, in Laos the effect is more or less non existent. In Myanmar, the effect if the opposite of what we expected: as the risk increases, the probability of deforestation actually declines.
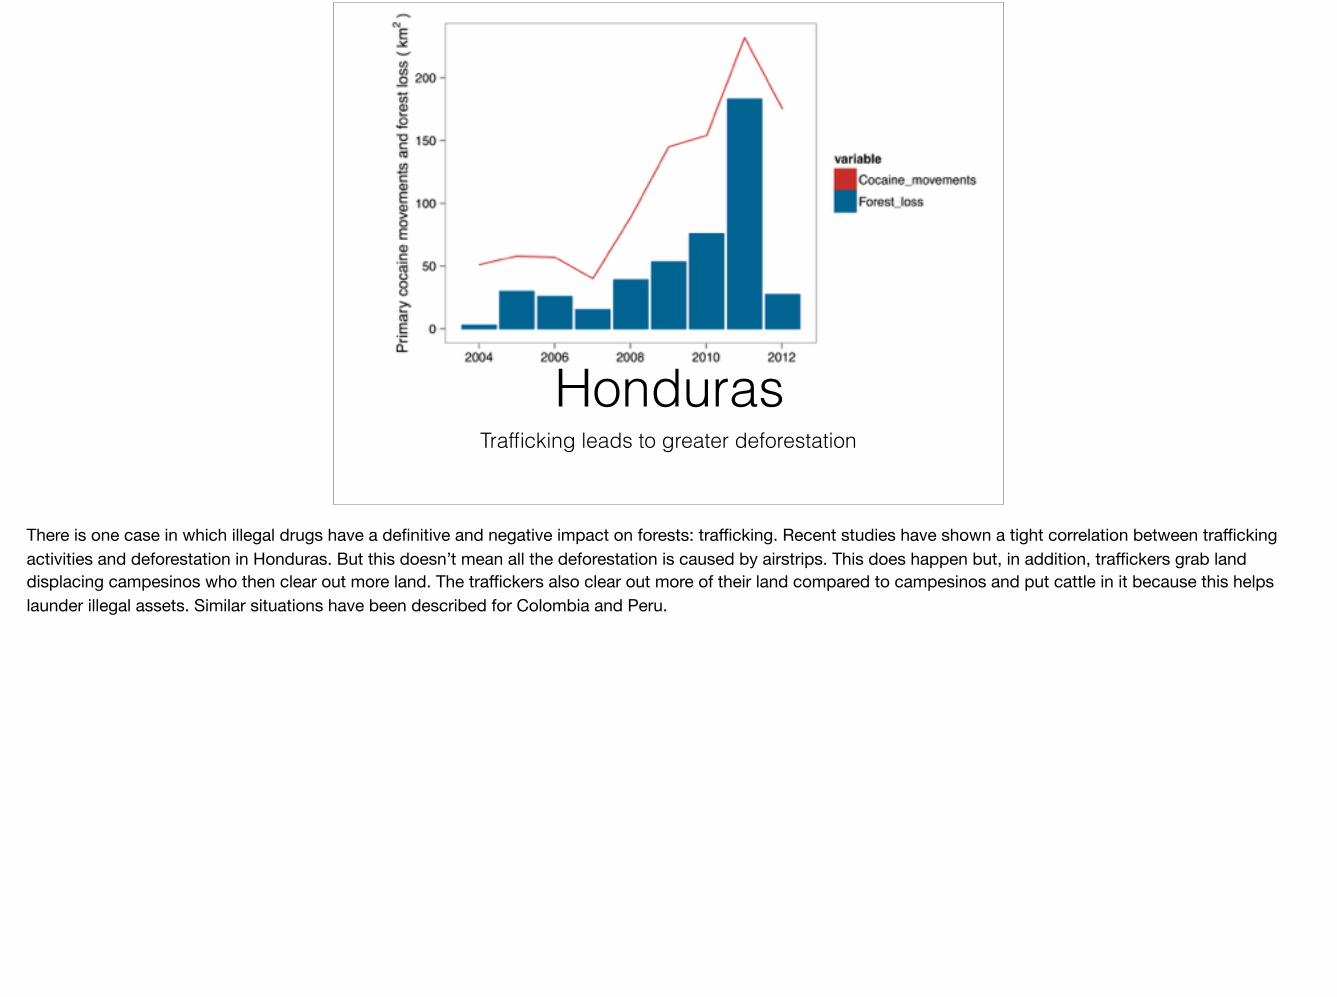
HondurasTrafficking leads to greater deforestation
There is one case in which illegal drugs have a definitive and negative impact on forests: trafficking. Recent studies have shown a tight correlation between trafficking activities and deforestation in Honduras. But this doesn’t mean all the deforestation is caused by airstrips. This does happen but, in addition, traffickers grab land displacing campesinos who then clear out more land. The traffickers also clear out more of their land compared to campesinos and put cattle in it because this helps launder illegal assets. Similar situations have been described for Colombia and Peru.
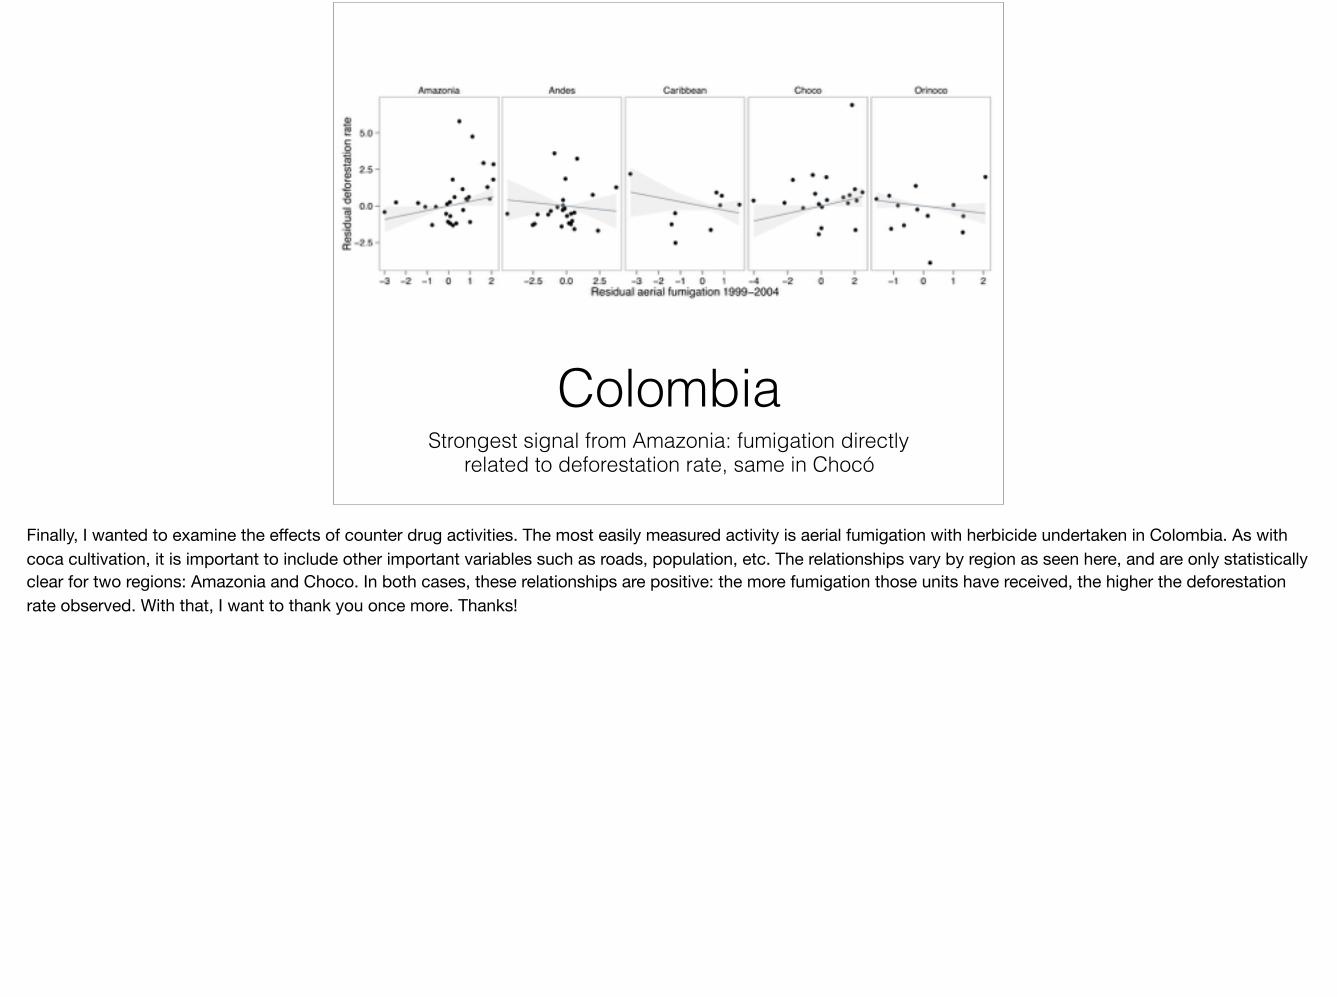
ColombiaStrongest signal from Amazonia: fumigation directly
related to deforestation rate, same in Chocó
Finally, I wanted to examine the effects of counter drug activities. The most easily measured activity is aerial fumigation with herbicide undertaken in Colombia. As with coca cultivation, it is important to include other important variables such as roads, population, etc. The relationships vary by region as seen here, and are only statistically clear for two regions: Amazonia and Choco. In both cases, these relationships are positive: the more fumigation those units have received, the higher the deforestation rate observed. With that, I want to thank you once more. Thanks!
1400
1600
1800
2000
2200●
●
●
●
●●
●
●
3035404550
Forest
NP
1500
2000
2500
●
●
●
●
●●
●
●
28 30 32 34 36 38 40
Pasture
150200250300350400
●
●
●
●●
●
●
●
0.51.01.52.02.5
Coca
500
550
600
650
700 ●●
●
●●
●
●
●
3035404550
PA (h
a)
150
200
250
300
350
●●
●●
●
● ●
●
28 30 32 34 36 38 40
2468
101214
●
●
●
●●●
●●
0.51.01.52.02.5
90
100
110
●
●
●
●
●
●
●
●
3035404550PLAND
ENN
(m)
95100105110115120
●
●
●
●
●
●
● ●
28 30 32 34 36 38 40PLAND
300
400
500
600
●
●
●
●
●
●
●
●
0.51.01.52.02.5PLAND
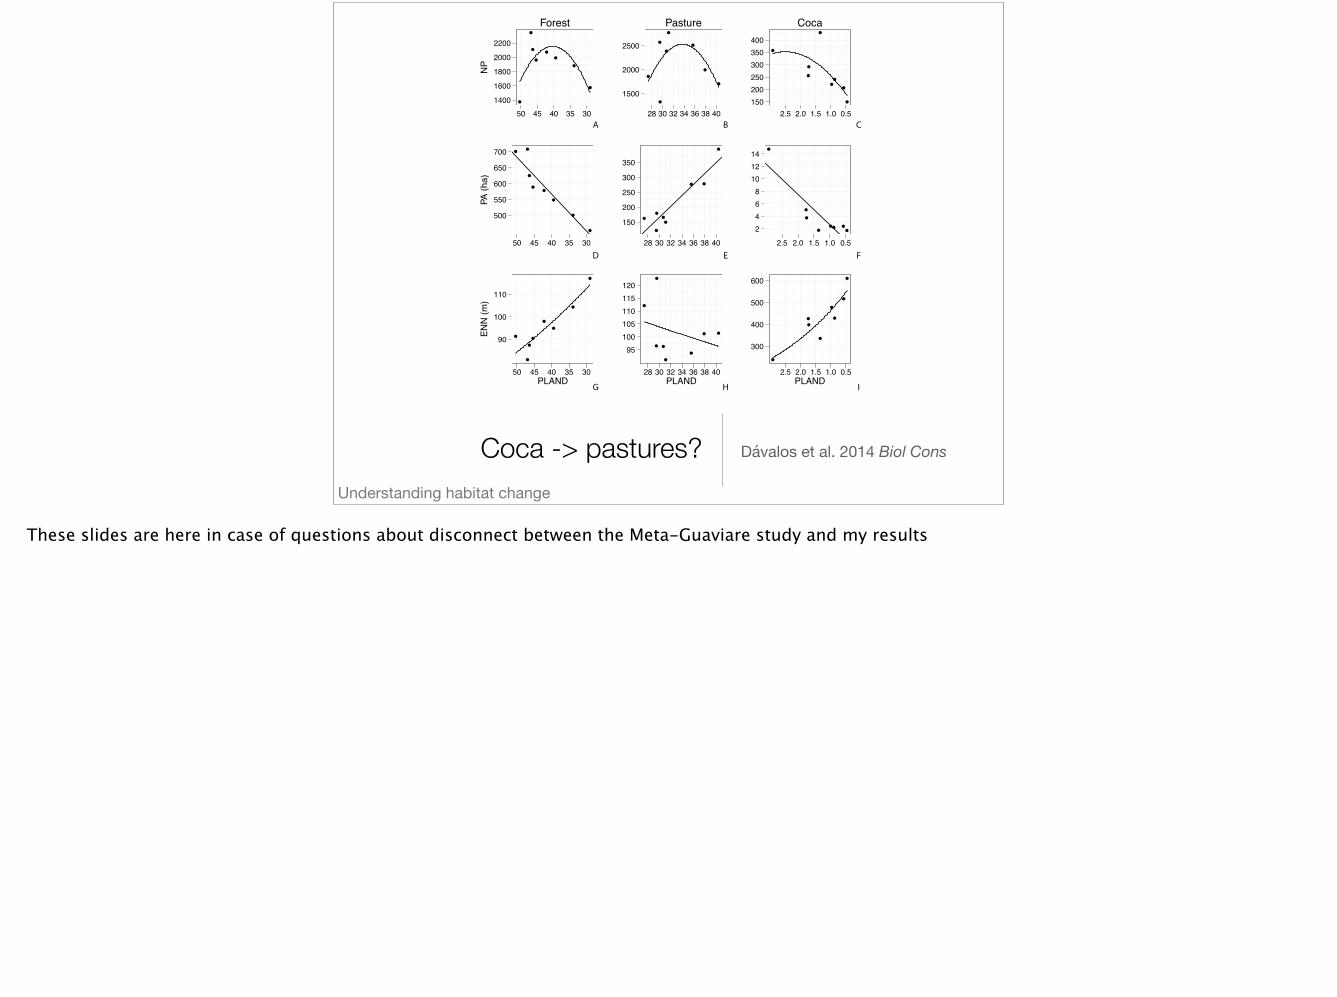
Figure 2
BA
G
C
E FD
H I
Coca -> pastures? Dávalos et al. 2014 Biol Cons
Understanding habitat change
These slides are here in case of questions about disconnect between the Meta-Guaviare study and my results
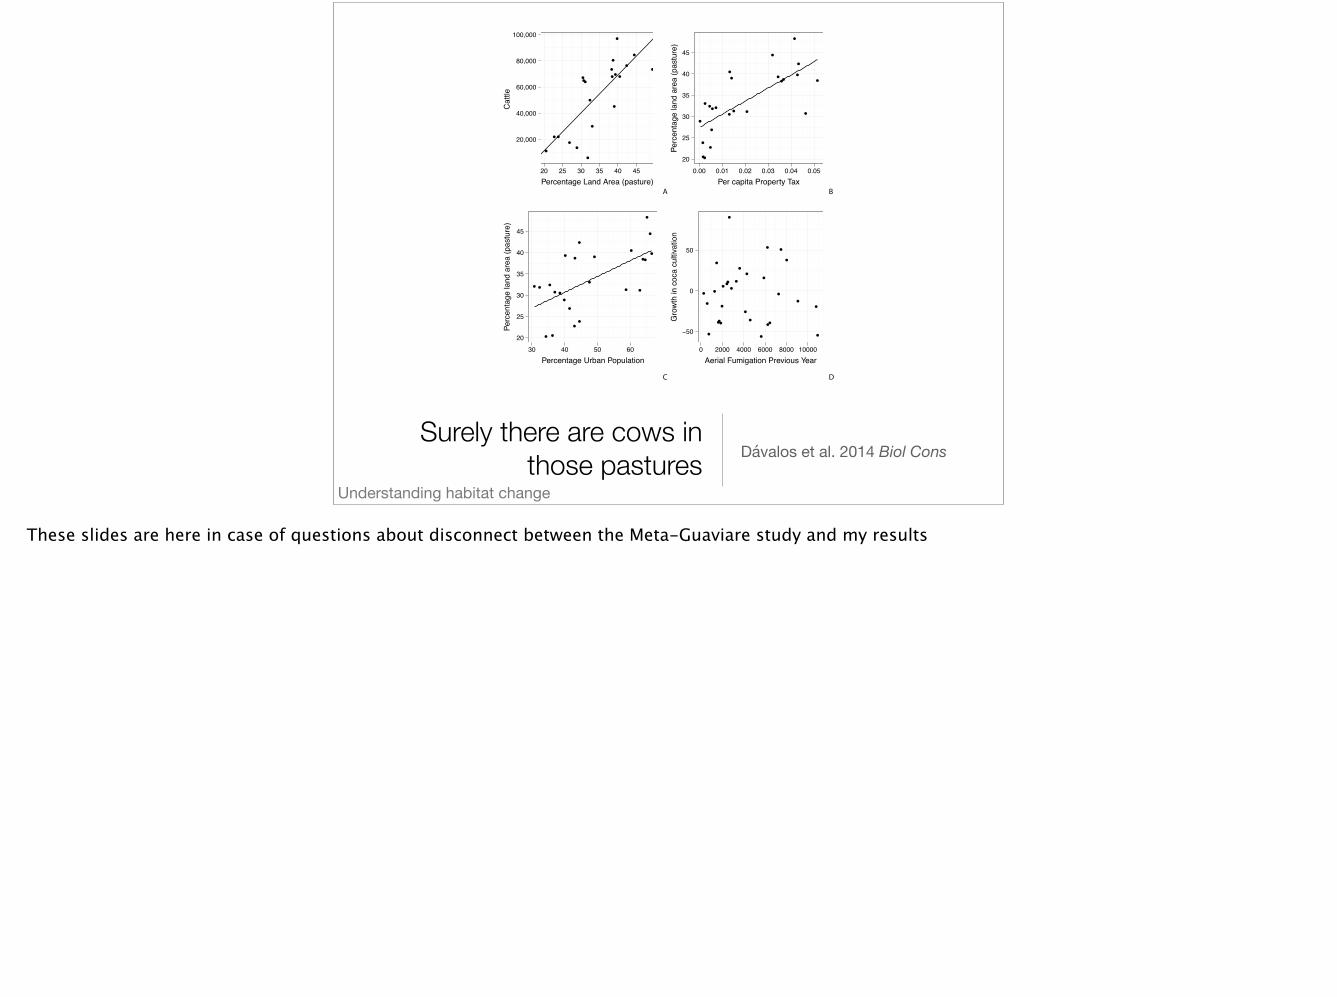
Figure 4
BA
DC
20,000
40,000
60,000
80,000
100,000
●
●
●
●
●
●
●
●●
●
●
●
●
●
●
●
●
●
●
●
●
20 25 30 35 40 45
Percentage Land Area (pasture)
Cat
tle
20
25
30
35
40
45
●
●●
●
●
●
●
●
●
●
●
●
●
●
●
●
●
●
●
●
●
●
●
●
0.00 0.01 0.02 0.03 0.04 0.05
Per capita Property Tax
Perc
enta
ge la
nd a
rea
(pas
ture
)
20
25
30
35
40
45
●
●●
●
●
●
●
●
●
●
●
●
●
●
●
●
●
●
●
●
●
●
●
●
30 40 50 60
Percentage Urban Population
Perc
enta
ge la
nd a
rea
(pas
ture
)
−50
0
50
●
● ●
●
●
●
●
●
●
●
●
●
●
●
● ●
●
●
●
●
●
●
●
●
●
●
●
●
●
●
0 2000 4000 6000 8000 10000
Aerial Fumigation Previous Year
Gro
wth
in c
oca
culti
vatio
n
Surely there are cows in those pastures Dávalos et al. 2014 Biol Cons
Understanding habitat change
These slides are here in case of questions about disconnect between the Meta-Guaviare study and my results
A
B
C
Figure 4
Calamar
El Retorno
San Jose
30,000
60,000
90,000
10
20
30
Year
Cat
tleP
rice
of b
eef (
peso
s/K
g)R
anch
ing
GD
P (1
09 pe
sos)
2000 2002 2004 2006 2008 2010
1,600
1,800
2,000
2,200
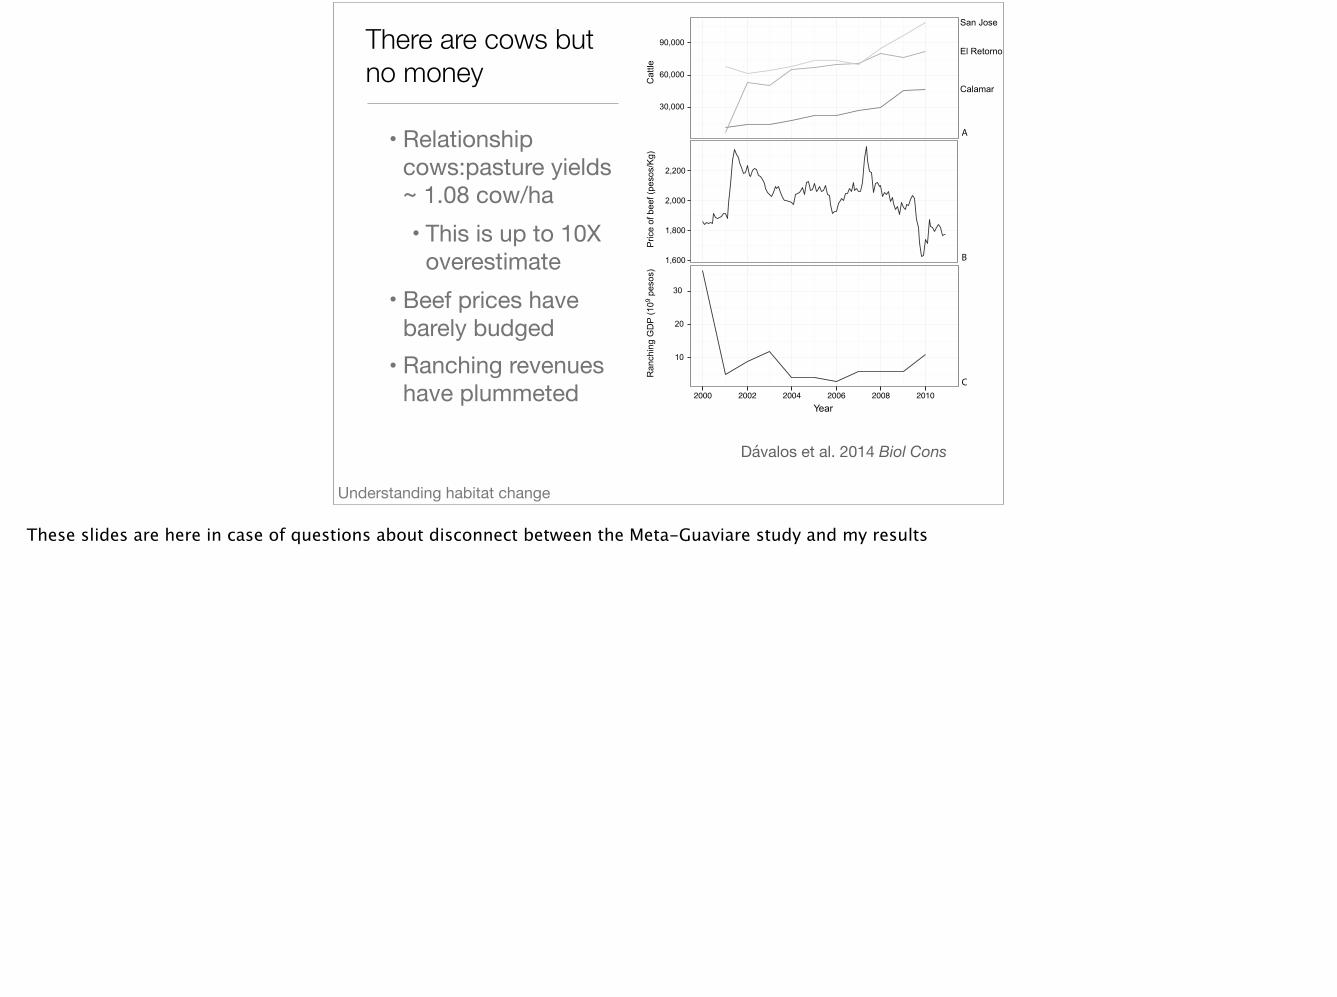
There are cows but no money
• Relationship cows:pasture yields ~ 1.08 cow/ha• This is up to 10X
overestimate• Beef prices have
barely budged• Ranching revenues
have plummeted
Understanding habitat change
Dávalos et al. 2014 Biol Cons
These slides are here in case of questions about disconnect between the Meta-Guaviare study and my results
Municipality●
●
●
CalamarEl RetornoSan Jose
Figure 6
A B
●
●
●
●
●
●
●
●●
●●
●●
●
●
●
● ●
●
●
●
20
30
40
30,000 60,000 90,000
Cattle
Perc
enta
ge la
nd p
astu
re
●
●
●
●
●
●
●
●
●
●
●
●
●
●
●
●
●
●
●
● ●
●
●
●
●
●
●
●
●
●
●
●●
2,000
4,000
6,000
30 40 50 60
Percentage population urban
Coc
a cu
ltiva
tion
(ha)
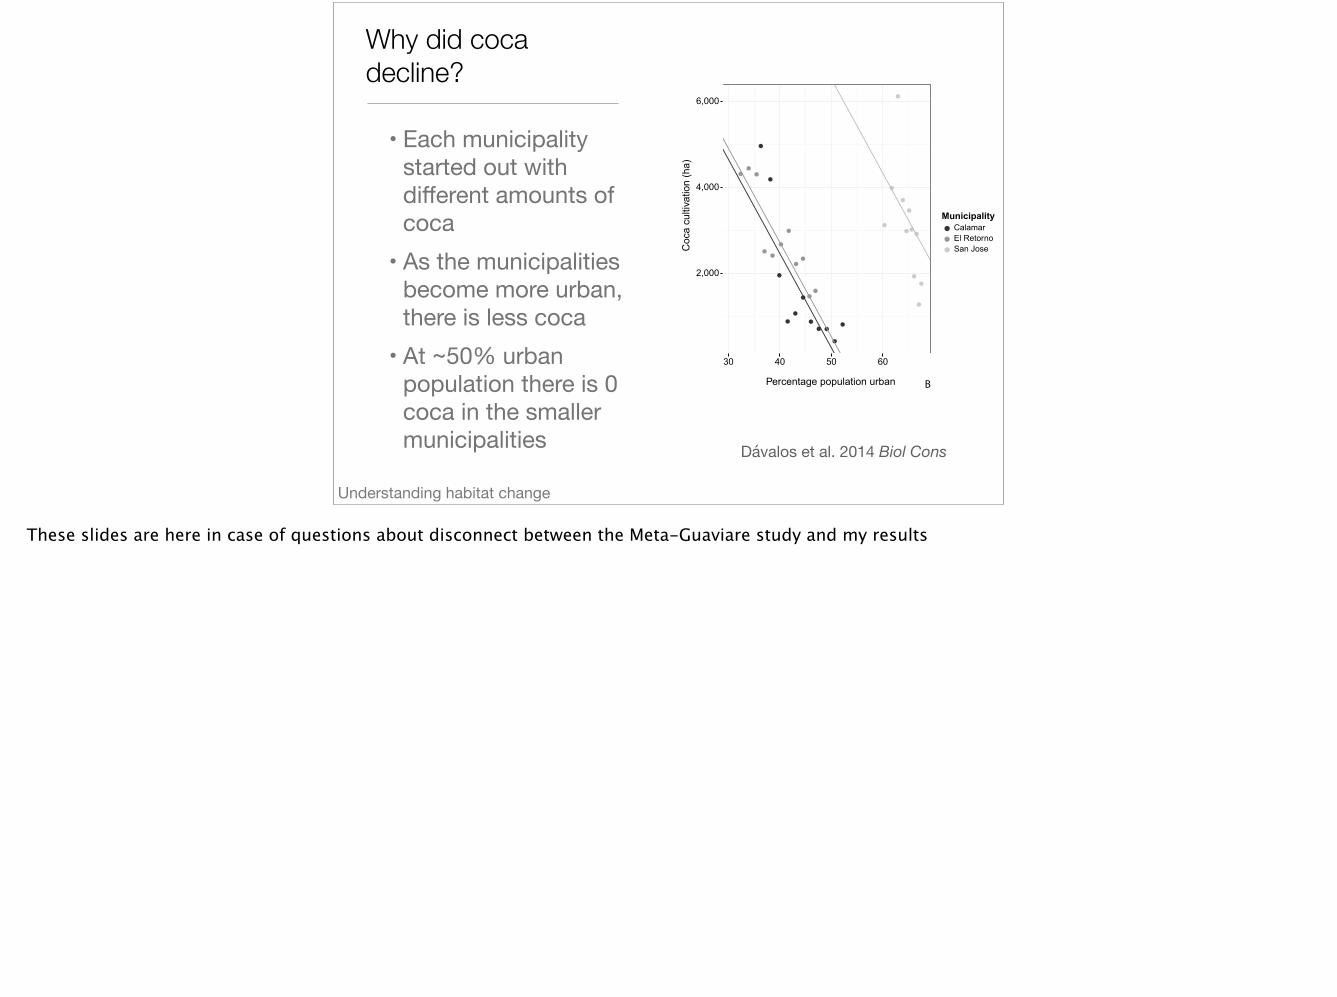
Why did coca decline?
• Each municipality started out with different amounts of coca
• As the municipalities become more urban, there is less coca
• At ~50% urban population there is 0 coca in the smaller municipalities Dávalos et al. 2014 Biol Cons
Understanding habitat change
These slides are here in case of questions about disconnect between the Meta-Guaviare study and my results
A
B
C
Figure 5
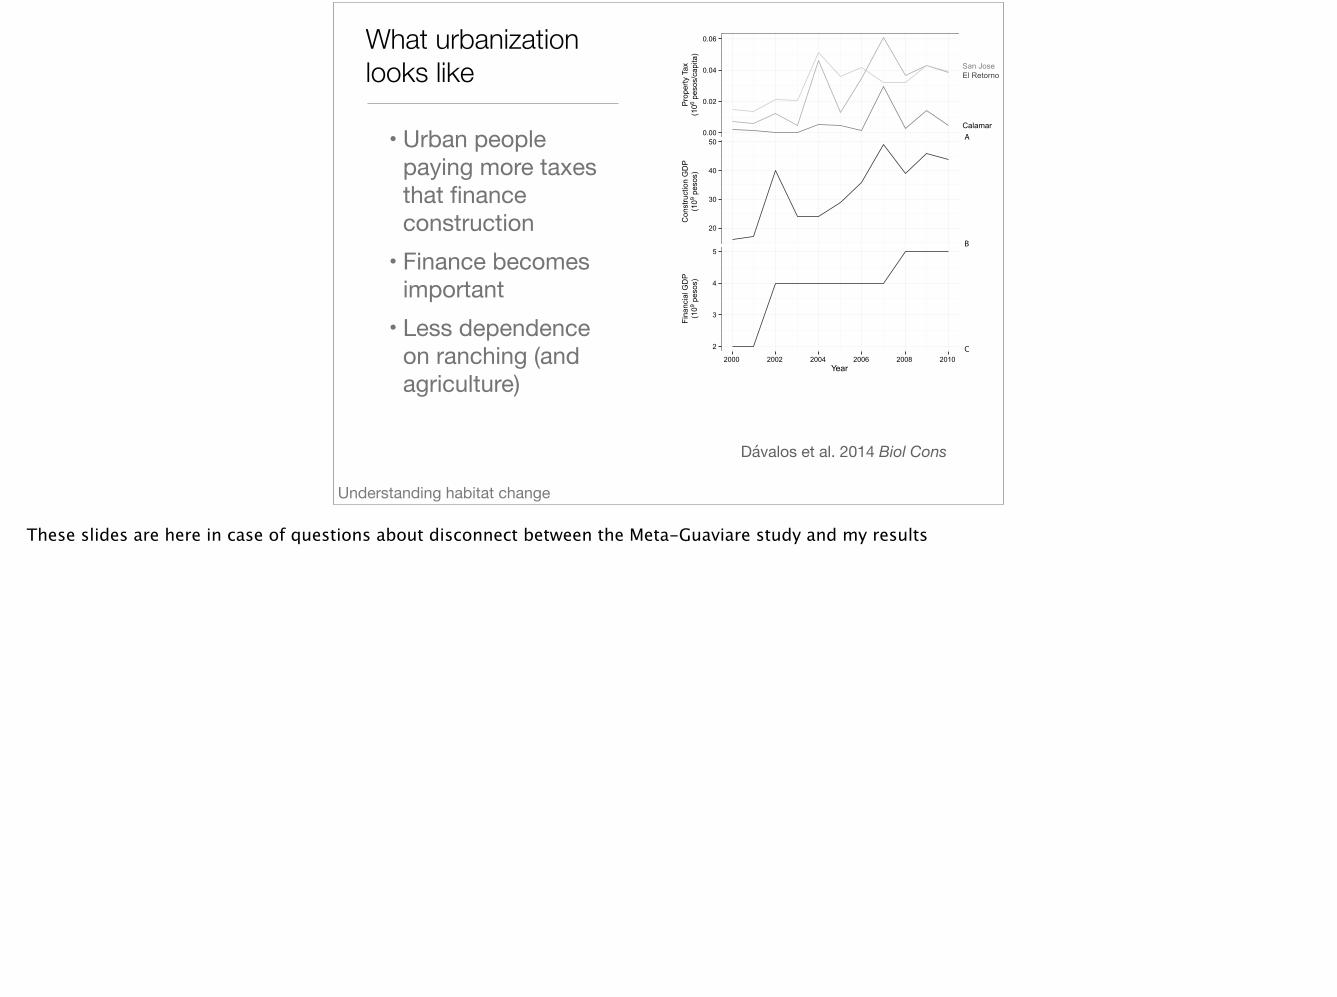
Calamar
El RetornoSan Jose
2010
0.00
0.02
0.04
0.06
20
30
40
50
2
3
4
5
2000 2002 2004 2006 2008Year
Fina
ncia
l GD
P(1
09 pe
sos)
Con
stru
ctio
n G
DP
(109
peso
s)Pr
oper
ty T
ax(1
06 pe
sos/
capi
ta)
What urbanization looks like
• Urban people paying more taxes that finance construction
• Finance becomes important
• Less dependence on ranching (and agriculture)
Dávalos et al. 2014 Biol Cons
Understanding habitat change
These slides are here in case of questions about disconnect between the Meta-Guaviare study and my results