the normal distribution - lpswp.lps.org/dhartman/files/2014/03/stats1ppt.pdf · 3/23/14 3 normal...
TRANSCRIPT
3/23/14
1
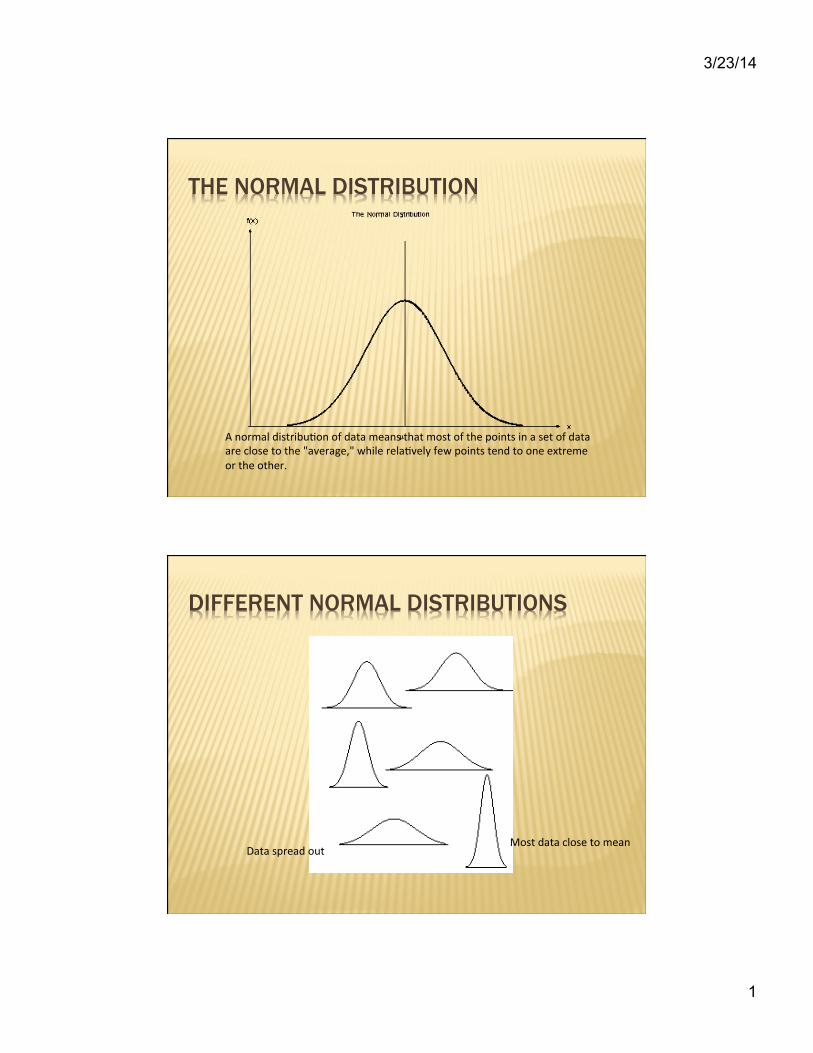
THE NORMAL DISTRIBUTION
A normal distribu/on of data means that most of the points in a set of data are close to the "average," while rela/vely few points tend to one extreme or the other.
DIFFERENT NORMAL DISTRIBUTIONS
Most data close to mean Data spread out

3/23/14
2
STANDARD DEVIATION
Ò The standard deviation ( ) is a statistic that tells you how tightly all the various examples are clustered around the mean in a set of data.
When the data are pre@y /ghtly bunched together and the bell-‐shaped curve is steep, the standard devia,on is small.
When the data are spread apart and the bell curve is more flat, that tells you you have a rela/vely large standard devia,on.
σ
ONE STANDARD DEVIATION
One standard devia/on
Two standard devia/ons
Three standard devia/ons
34% 34%
13.5% 13.5%
2.5% 2.5%
All together = 99%!
3/23/14
3
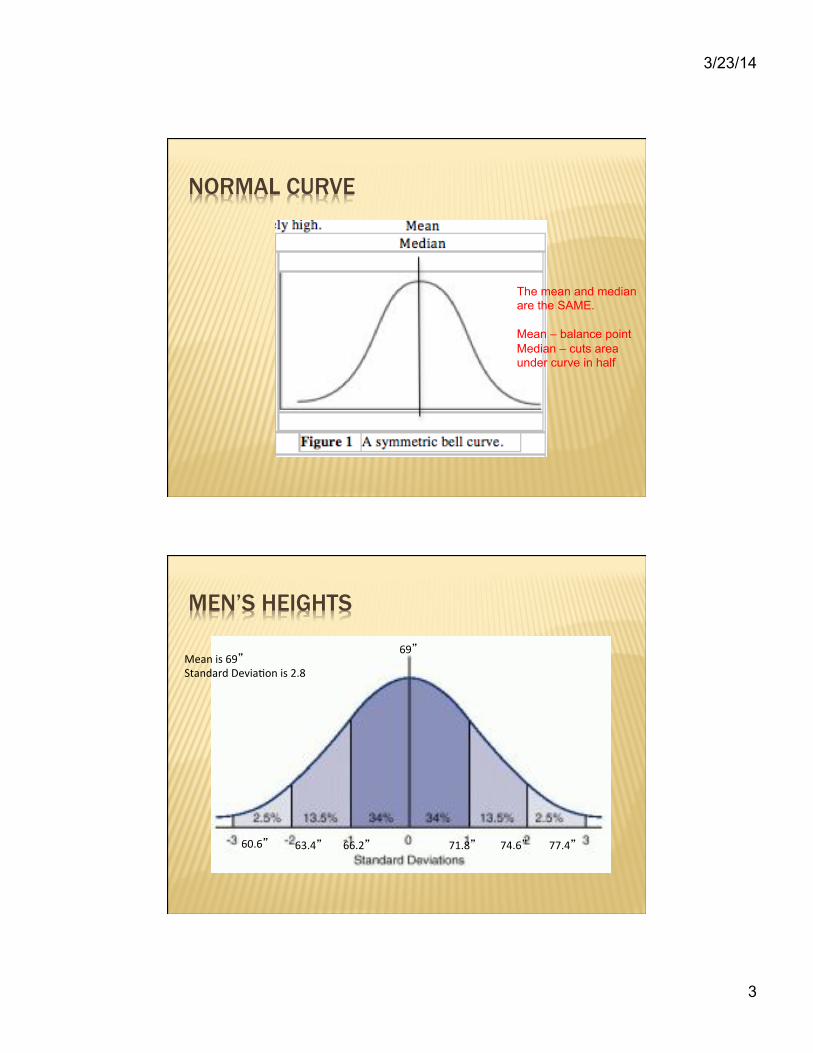
NORMAL CURVE
The mean and median are the SAME. Mean – balance point Median – cuts area under curve in half
MEN’S HEIGHTS
69” Mean is 69” Standard Devia/on is 2.8
71.8” 74.6” 77.4” 66.2” 63.4” 60.6”

3/23/14
4
MEN’S HEIGHTS
69”
Michael Jordan is 78” tall
71.8” 74.6” 77.4” 66.2” 63.4” 60.6”
OUTLIER
Ò A value that is substantially different from other data in the set.
Ò Michael Jordan’s height is an outlier.
3/23/14
5
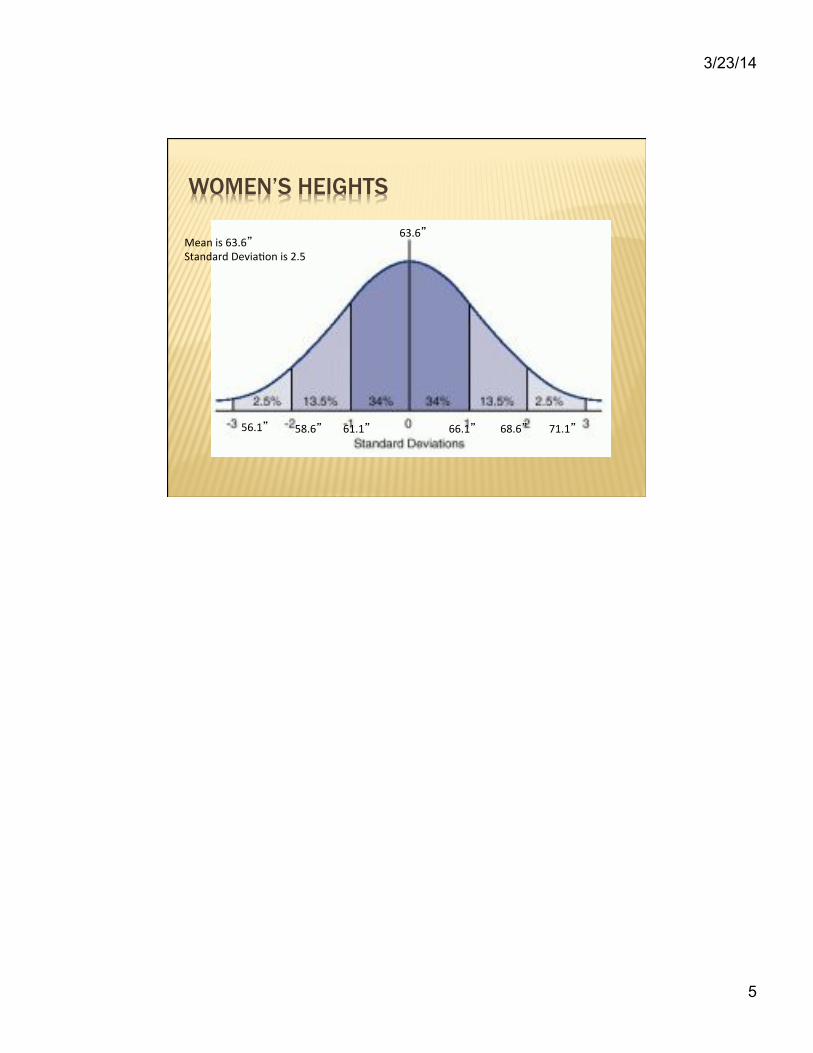
WOMEN’S HEIGHTS
63.6” Mean is 63.6” Standard Devia/on is 2.5
66.1” 68.6” 71.1” 61.1” 58.6” 56.1”