the north american gas value chain: developments and ... · pdf filethe north american gas...
TRANSCRIPT

SPECIAL REPORT
WWW.OIL.PLATTS.COM
The North American Gas Value Chain: Developments and Opportunities
September, 2012Platts Price Group, Power, Oil and Petrochemical Divisions

PLATTS SPECIAL REPORT | 2
The North American Gas Value Chain: Developments and Opportunities
INTRODUCTIONThe exploration and proliferation of shale gas deposits in North America have changed the face of regional natural gas and natural gas liquids industries. The groundswell in domestic onshore supplies has reversed typical supply flows in the US, with shale plays such as the Marcellus and potentially the Utica opening up the possibility the US Northeast could become a net exporter of gas in a few years. This paradigm shift that has positioned the US now as a potential net exporter of natural gas, a complete reversal from the concerns a decade ago that spurred the construction of new liquefied natural gas import terminals along US coastlines. Many of those same terminals are now re-exporting and/or seeking licenses to export gas. US natural gas producers now have the ability to bring more gas to the domestic market than the market can absorb.
The shifting ground has extended further down the supply chain as well. Natural gas liquids margins, not natural gas itself, are driving development in US shale plays, and with natural gas prices at the Henry Hub benchmark at close to historic lows just below the $3/MMBtu mark, these wet, or high BTU, plays should continue to drive production growth.
This proliferation in liquids promises to shift the US petrochemical industry into a new “golden age,” as supply growth throughout the gas value chain promises plentiful feedstock supply for the downstream industry. As the crude-to-gas ratio and the fractionation spread between ethane and natural gas, or “frac spread” rose to record highs in late 2011, expansions and new construction projects for olefin-producing steam crackers, primarily ethane-fed and ethylene producing, have progressed in the US at a rate of growth not seen since the 1980s.
The crude-to-gas ratio, which measures the relative value of crude oil compared to natural gas by dividing the first value by the second, has recovered from recent declines. As an example, current crude prices in the US are close to 40 times above the equivalent gas price. However,“frac spreads” have dropped further thanks to plentiful NGL supply. But a persistently weak natural gas price environment has kept fractionation margins healthy on a historical basis, and should continue to incentivize long-term high BTU-gas drilling.
SHALE GAS: FROM SUPPLY DEFICIT TO SURPLUSThe market landscape for natural gas in the US was dramatically different at the start of the new millennium. Natural gas prices almost breached the $10/MMBtu mark for the front-month NYMEX Henry Hub futures contact in the winter of 2000-01, and successive rallies were seen in the following winters as demand overwhelmed low inventories and declining production.
In 2005 following hurricanes Katrina and Rita, Henry Hub natural gas futures prices soared to record highs of $15.38/MMBtu in December 2005, as demand once again exceeded supplies amid post-hurricane production shut-ins and a lack of shoulder season inventory builds.
This ongoing imbalance between supply and demand spurred the building of new LNG terminals and the reopening of existing terminals starting in the late 1990s, with new LNG import facilities such as Sabine Pass and Freeport operational along the US Gulf Coast from 2005 through 2008.
Tight US gas supplies and the recurring price volatility also encouraged petrochemical producers to shift to heavier feeds, resulting in the importing of liquefied petroleum gases (propane in
North American Unconventional Gas Growth, Bcf/d
Source: Ziff Energy

PLATTS SPECIAL REPORT | 3
The North American Gas Value Chain: Developments and Opportunities
the winter), and even olefins like ethylene as the polymer industries sought cheaper feedstocks overseas. US winter propane imports peaked in February 2009 at 564,000 b/d, the highest weekly levels seen since the US Energy Information Administration began collecting data since 2004. By comparison, US winter propane exports in 2011-12 hit their highest levels in December of 194,000 b/d. The US is now a net exporter of LPGs including propane, with 37 million barrels exported in 2011, and 45-50 million barrels expected to be exported in aggregate in 2012, according to analyst Raymond James.
The advent of the dry gas, or low BTU, shale plays in the last decade such as the Barnett, Fayetteville, and Haynesville changed the game. The resulting surge in domestic onshore natural gas production in 2008-09, once Haynesville Shale commercial production began, not only offset declines in conventional Lower 48 gas production, but created a surplus of gas. This gas surplus forced NYMEX prices down to sub-$2/MMBtu levels in April and spot prices that month down to levels last seen some 10 years ago. The US now has the capability and the reserves to supply more gas than the market can absorb, a complete reversal from the tight markets of the previous decade.
With natural gas production margins near zero, gas processing margins and NGL extraction are now driving where new wells are being drilled in these shale plays. The crude-to-gas ratio hit a historic high of 53-to-1 on April 20, 2012. (see graph to the right).
The crude-to-gas ratio narrowed back in to close to 30-to-1 in June, but still represents a structural shift from the crude vs. gas economics seen in the previous decade. Buoyant crude prices in July and August have also allowed the crude to gas ratio to recover to near 40-to-1. This structural shift in both crude and NGL economics relative to natural gas should support US NGL production growth while simultaneously supporting associated natural gas production, despite weak gas margins.
However, recent declines in conventional gas production could temper US NGL production growth, with the gas rig count falling to 13-year lows (see rig count graphs). While the majority of conventional, or “legacy,” gas is dry, the aggregate liquids extracted from those drier streams may curb raw mix NGL production this year. The full impact of this trend has not been fully assessed, analysts have said. Analyst IHS CERA does not expect legacy gas shut-ins to impact production of raw mix, but has noted that falling prices for NGLs could begin to temper additional capital investment for the upstream and the midstream of the natural gas value chain.
BASIS EROSION AND THE IMPACT ON THE PIPELINE SECTORShale gas has driven total production in the US to record highs. According to the US’ Energy Information Administration, June 2012 production in the Lower-48 US states was 72.37 Bcf/day. The agency further breaks down gas production for seven key areas – Offshore Gulf of Mexico, Louisiana, New Mexico, Oklahoma, Wyoming, and Other States. This “Other States” region, which includes many of the key shale plays such as Marcellus and Bakken, has been the greatest gainer – growing to 22.6 Bcf/d in June,
0
10
20
30
40
50
60
Source: CME Group
Crude-to-Gas Ratio
1990 1992 1994 1996 1998 2000 2002 2004 2006 2008 2010 2012
up 19% from its year-ago of 18.98 Bcf/d – these “Other States” now compromise more than 30% of overall Lower-48 production, previously explained by the EIA as “new wells and continuous drilling in the Marcellus shale play.”
Shale production is generally projected to grow exponentially (see above graph) – despite recent announcements by several producers that they would curtail production – over the next few years.
This shale-related burst of supplies has weighed down natural gas prices, and although producers have shifted their drilling rigs away from dry-gas plays to unconventional formations that contain NGLs and/or crude, supplies from these dry-gas plays remains robust nationally. On a regional level, the advent of emerging shale plays far closer to major consumption areas than traditional supply basins has crushed many basis spreads across North America.
Various analysts estimates for dry gas production currently peg the Barnett around 5 Bcf/d, 5.5 Bcf/d coming out of Haynesville although rigs there have been almost halved over the past 18 months, the Marcellus around 4.5 Bcf/d and Fayetteville around 3 Bcf/d. The
0
9
18
27
36
45
Source: Bentek Energy
Shale Gas Production Forecasts Through 2016 (Bcf/d)
2009 20142011 2013 201520122010 2016
MarcellusAnadarko
FayettevilleEagle Ford
HaynesvilleFt. WorthWoodford

PLATTS SPECIAL REPORT | 4
The North American Gas Value Chain: Developments and Opportunities
move to wet gas plays does not preclude continued gas growth. The Eagle Ford, for instance, with its promise of both NGLs and crude, is estimated to produce about 1.5 Bcf/d of dry gas currently.
The impact of this onrush of shale supplies has been manifold. In the spot markets, for instance, the changing flow dynamics have upended several traditional price relationships. For instance, Appalachian spot pricing points now average consistently either on par or below the benchmark Henry Hub spot price because of burgeoning Marcellus Shale supplies struggling through pipeline constraints to get to premium-priced Northeast city-gates markets.
On September 7, for instance, Dominion, South point averaged $2.67/MMBtu, 6 cents below the $2.73/MMBtu Henry Hub spot average on the same day – a far cry from 2009, prior to commercial production in the Marcellus Shale, also the physical location of the Dominion hub, when Dominion’s premium over Henry Hub peaked at $2.405 on January 15, 2009.
In the Southeast, this intense gas-on-gas competition due to the proliferation of shale gas E&P activity has led to the complete erosion of basis spreads markets in the region as evidenced below, between Carthage Hub (the nearest pricing hub to the Barnett) and Columbia Gulf, mainline (standing in for the Haynesville).
This basis erosion across the entire US gas market has disincentivized long-haul transportation of gas supplies, resulting in lower throughput on pipelines and lower revenues for pipeline operators that employ a fee-based business model. Midstream companies with gas pipeline assets have sought to regain their business through various means: raising rates, converting to transporting more lucrative hydrocarbons or completely re-imagining their business models. Please see the table on page 20 for these gas pipeline transformations.
How midstream companies continue to grow revenue for their gas-only pipeline assets in the wake of the shale revolution should prove an ongoing issue in the coming years, as several pipelines come up for rate reviews or face the end of several major firm contracts by the end of the decade.
The pipeline industry isn’t the only natural gas sector affected by these basis erosions. Storage operators that depend on spreads in both the futures and forward basis markets to entice customers to ‘roll’ their supplies out to longer-dated seasons, have seen pullbacks across their customer base. In addition, storage operators have seen a particular pullback from banks and marketers – players either acting as third-parties or middlemen for end-users, or engaging in proprietary physical trading – because of the lack of margins in these markets.
As such, storage operators are modifying their business plans – targeting end-users directly for long-term contracts, offering hourly delivery services where possible, partnering with pipelines to bundle park-and-loan and wheeling services, among others.
Park-and-loan is a service that gives customers the flexibility of putting gas onto a pipeline system for later use (parking) or borrowing gas from a system and paying back the volume at a later date (loan). Wheeling, meanwhile, refers to the transfer of gas from one interconnected pipeline to another via a header, or hub.
DEMAND: SHALE GAS BOOSTS POWER GENERATION, POTENTIAL LNG EXPORTSWhile the natural gas industry itself has struggled to deal with the supply surplus it has engendered, other related industries have found a boon in the boom. Lower gas prices have encouraged a tremendous amount of coal-to-gas switching among electricity generators, particularly in the Southeast where the phenomenon is often commonplace in summer, when coal-fired units go offline for maintenance.
As gas prices have remained depressed, becoming more competitive against coal prices, and with federal regulation looming to further tighten coal-fired generation, power operators look set to turn still more towards natural gas. Interestingly, this has resulted in greater exports of coal by the US as natural gas displaces coal domestically and forces coal onto the international market.
Wells Fargo Securities analysts estimate that by 2020, increased gas-fired generation in the Southeast will consume an additional 2 Bcf/d of gas. This year, however, the falling price of gas has made the fuel extremely competitive with coal, so much so that coal-to-gas displacement has occurred at a median rate of 6 Bcf/d across the US, according to analysts. Mandated coal retirements in Ontario by 2014 should increase gas demand by 1 Bcf/d in the Canadian province by 2020, analysts have stated.
As onshore supplies increase, the need for imported gas in the form of LNG has greatly waned. LNG imports are now come in at less than a 1 Bcf/d on any given day, Platts data shows. With import terminals standing greatly underutilized, their operators have instead mooted the idea of exported domestically-produced LNG.
Although the idea is not new – the Kenai terminal in Alaska has been exporting gas for decades – exporting gas is a new prospect in the Lower-48 , engendering heated responses both for and against the idea.
-0.2
0.4
1.0
1.6
2.2
Source: Platts
Barnett-to-Haynesville Price Spread ($/MMBtu)
2008 2012201120102009

PLATTS SPECIAL REPORT | 5
The North American Gas Value Chain: Developments and Opportunities
The favorable “frac spread” and the feverish pace of wet gas drilling earlier this year have given the petrochemical industry confidence in a steady stream of supplies, particularly ethane, the dominant component in the average NGL barrel. This spread has fallen to 2010 levels, down from the record highs of $11/MMBtu seen in November 2011, as plentiful ethane supplies in the spring and summer of 2012 have pushed spot ethane prices at Mont Belvieu lower. The effects of increased wet gas drilling are revealing themselves in weaker ethane prices, as demand has yet to catch up with supply.
NGLs: THE PRODUCTION WAVEUS natural gas liquids production is expected to rise dramatically this decade thanks to recent favorable economics for drilling and the rapid development of “high-BTU” US shale plays. This expected surge in NGL supply has ushered in a wave of petrochemical capacity expansions not seen in nearly thirty years, but the delicacy in developing infrastructure along the gas value chain may result in price volatility and localized surpluses/shortages in supply over the next five years. This surge in supply ahead of necessary infrastructure and downstream demand growth has already reared its head in the
Thus far, 15 possible export projects totaling some 22 Bcf/d have been announced in North America: 10 in the US, five in Canada. The sites, either proposed or existing, largely cluster around areas where shale supply bubbles exist: the Gulf Coast (Sabine Pass, Freeport, among others), Marcellus (Cove Point) and western Canada (Kitimat, BC LNG, an unnamed Petronas project, and Shell’s LNG Canada project).
Most of these are somewhere in the process of securing federal approval to export LNG, but only Sabine Pass, Kitimat and BC LNG have so far been allowed to export supplies to both free-trade and non free-trade agreement countries. Sabine, additionally, has secured nearly 1 Bcf/d in take-or-pay contracts from BG and Spain’s Gas Natural for its first liquefaction phase and nearly 1.1 Bcf/d of contracts from Korea Gas, BG and Indi’s GAIL. BC LNG, meanwhile, has gotten the green light to export about 230,000 Mcf/d for 20 years.
Analysts, such as Wood Mackenzie, Poten & Partners and Standard Chartered, estimate LNG exports could total between 1 Bcf/d and 2 Bcf/d in 2016-17, increasing to between 2 Bcf/d and 4 Bcf/d in 2018 onwards.
WET GAS PLAYS DRIVE PRODUCTION, PETROCHEMICALS RENAISSANCE The impact of shale in North America is most keenly felt in the petrochemicals sector. A renaissance in the sector has been seeded in amove to liquids-rich plays that began picking up in 2010, specifically when drilling in Texas’ Eagle Ford began in earnest.With the techniques used to unearth shale gas now being deployed to extract NGLs and crude, producers have now honed in on the following plays: Eagle Ford, Bakken, Niobrara, Uinta, Utica, the Mississippi Lime, the southwest portion of the Marcellus, and a four-county area of the Barnett, among others.
Third-party capital has followed this move. Some $6.5 billion flowed from investors, both foreign and domestic, into unconventional drilling efforts in 2010. In 2011, that number moved up to $11.6 billion and for the year-to-date, it stands at $28.9 billion. Plays that have dominated this capital inflow include the Eagle Ford, Niobrara, Mississippi Lime and the Montney – all liquids-rich. As such, the oil rig count has skyrocketed to record levels, while gas rigs hit a 13-year low in July. Falling prices for NGLs in recent months and a narrowing of the “frac spread” to levels not seen since 2010 could temper any new capital expenditures in the rich gas shale plays and liquids infrastructure, IHS CERA noted (see graph in Purity Products section).
Analyst Raymond James has reduced its crude price forecast, and as a result its rig growth forecast for both crude oil and wet gas as they expect wet gas rigs to fall from June levels at 359 down to 270 by the end of 2013. This has clipped Raymond James’ forecasts for long-term NGL production growth, but production is expected to increase overall through 2015 as gas drilling as a whole will continue to focus on liquids-rich shale plays (see NGL production section).
0
400
800
1200
1600
2000
Source: Baker Hughes
Baker Hughes Weely Rig Count: Oil vs. Gas
1988 20081996 2004 201220001992
GasOil
-2
0
2
4
6
8
10
12
Source: Platts
Mont Belvieu Ethane vs. Henry Hub Cash ($/MMBtu)
2007 20122009 201120102008

PLATTS SPECIAL REPORT | 6
The North American Gas Value Chain: Developments and Opportunities
called raw mix, or Y-grade. US gas processing plant capacity will increase by 15.5 Bcf/day through 2015, up from current levels of 72 Bcf/day, to process the growing wet gas production and extract the high-value liquids, according to data analysis provider and Platts unit Bentek Energy. 47 new plants are slated to come online in the next five years, Bentek said, adding 8.5 Bcf/day of capacity, and these plants will all be highly efficient, cryogenic units that can extract high volumes of ethane from the gas stream. 41 plants will undergo expansions, adding 7 Bcf/day of capacity.
Analyst En*Vantage estimates that 12.4 Bcf/day of new gas processing capacity will come online by year-end 2015. While downstream infrastructure developments could possibly be overbuilt, this portion of the gas value chain is the most vulnerable to feedstock (natural gas) outstripping available capacity, according to En*Vantage.
Production of raw NGLs from US gas plants stood at 2.33 million b/d as of June 2012, according to the EIA. This is down from the 2.37-2.39 million b/d levels seen monthly from January through May of this year, and the lowest production levels seen since October 2011. Sharp declines in purity NGL prices, particularly in the US midcontinent, might have been behind the slight decline. In addition, declining conventional gas, in the absence of the shale developments, could also have pressured overall raw NGL output in the US. Over time, the boost from NGLs out of the wet gas shale play production activity is generally expected to mostly if not completely offset these declines from conventional gas plays, as Marcellus and Eagle Ford are viewed as the most robust of all the US shale formations.
The anticipated production boom from wet gas shale plays is expected to boost raw NGL production levels by as much as 31% in
Conway, Kansas ethane/propane mix market, where prices fell to a record 2.35 cents/gal on July 6 on a lack of regional storage and exit capacity to Mont Belvieu (see infrastructure section).
The record wide ethane-to-gas, or “frac” spreads, have driven natural gas exploration and production in US shale plays for the first half of this year (see graph on page 5). The result has been relatively stable natural gas production despite a low price environment, as this gas is simply a by-product of crude oil, condensate, and potential natural gas liquids in these plays. It is the Marcellus, Bakken, Eagle Ford, and Granite Wash/Anadarko where the wet gas drilling has increased rapidly in 2012.
Gas rig counts have declined to 13 year lows sin the face of cheap natural gas prices. These declines are in drier legacy fields, but it is still uncertain how the loss of the liquids from these legacy fields will impact overall raw mix NGL production in the short-term and how falling NGL prices relative to gas may curb liquids-rich drilling and midstream infrastructure buildouts. In addition, a narrowing of the ethane vs natural gas “frac” spread could also rein in wet gas drilling for the remainder of the year, as the “frac” spread (ethane vs. gas) in late August fell to $2/MMBtu. But short-term price volatility for purity products is expected in general as supply growth, infrastructure construction, and demand capability is not simultaneous and coordinated. At this stage, raw mix NGL production appears to be increasing ahead of the build-outs in downstream capacity for purity products such as ethane for petrochemical cracking and propane for export out of the US Gulf Coast.
Wet, or rich, gas is processed through a gas processing plant to extract the NGLs while maintaining enough ethane content to meet pipeline specifications for gas. What is extracted at these plants is
Map of US Gas Processing Plant Additions and Expansions
Source: Bentek Energy

PLATTS SPECIAL REPORT | 7
The North American Gas Value Chain: Developments and Opportunities
the next four years. Analyst Raymond James is forecasting US raw mix NGL production to hit 2.95 million b/d by 2015. This is a reduction from its previous forecast of 3.15 million b/d by 2015 due to an expected dampening effect of narrowing “frac spreads” on drilling activity.
Bentek is forecasting that total US NGL production will come close to 3.2 million b/d by 2016. En*Vantage is forecasting similar numbers – 3.2 million b/d by 2015. This forecast assumes maximum extraction of NGLs from gas. It is also based on expected growth in wet gas production in the Marcellus and an 830,000 b/d increase in gas processing, with most gas processing capacity growth occurring in the rich gas shale plays (Marcellus and Eagle Ford).
In terms of specific US shale plays, Eagle Ford, located in southern Texas and dipping into northern Mexico, will contribute approximately 500,000 b/d of raw mix production by 2015, according to Raymond James, up from current levels around 175,000 to 200,000 b/d. Analyst IHS CERA is forecasting raw NGL production around 300,000 to 400,000 b/d by 2016.
Raymond James expects Eagle Ford to be one of the most prolific of the “high BTU” shale gas plays, thanks to its close proximity to the heart of the North American petrochemical industry. 80% of North American ethylene cracking capacity can be found on the US Gulf Coast. It is because of this proximity, and the stronger hydrocarbon yields coming out of the wet gas/condensate “window” of the Eagle Ford shale formation, that capital expenditures have been flowing into Eagle Ford NGL midstream development at higher multiples than even the Marcellus Shale, Raymond James said.
Eagle Ford wet gas has a much higher BTU content, averaging around 1,440 BTUs, than other US shale plays, according to Bentek.
In PADD III, the US Gulf Coast region, raw mix production is expected to top 1.705 million b/d by 2016, almost half of expected US production, thanks to rich gas drilling and NGL extraction in the Eagle Ford, Permian Basin, and the Anadarko/Granite Wash shale plays, according to Bentek. Eagle Ford and Permian Basin have been, respectively, the largest contributors to the growth in PADD III overall raw NGLs production. Bentek expects that the fastest growth in NGL production in the next five years will be in the Texas portion of Anadarko/Granite Wash, from 117,000 b/d to 167,000 b/d by year-end 2016 .
In general, Bentek is forecasting Permian Basin NGL production to increase from 274,000 b/d to 377,000 b/d by 2016 and Eagle Ford production to increase by 212,000 b/d to 487,000 b/d by year-end 2016, with Bentek estimating current levels at 272,000 b/d as of June.
The Marcellus Shale in the mid-Atlantic portion of the US – Pennsylvania and West Virginia – is also projected to be a strong contributor to overall raw mix NGL production in North America. What sets Marcellus apart from the other rich-BTU shale plays is the rich ethane content of its natural gas – 50-55% of the raw mix extracted from Marcellus gas is ethane, compared to about 45% ethane content in other parts of the US. It is this ethane content, the close proximity
to the Ontario/Sarnia petrochemical complex, and the rapid pace of wet gas drilling that has caught the attention of the NGL midstream industry and petrochemical consumers.
Overall, the production figures for Marcellus are not quite as aggressive as those projected for Eagle Ford raw NGL production – in part due to the shale play’s distance from the continent’s fractionation and consumption hub, the US Gulf Coast. NGL supply expectations for the Marcellus still vary widely. Bentek Energy calls for 362,000 b/d by year-end 2015. En*Vantage is forecasting that propane plus (C3+) NGL production will hit 240,000 b/d by 2015 for Marcellus & Utica combined. En*Vantage expects 360,000 b/d raw mix NGL production for Marcellus/Utica by year-end 2015, forecasting about 120,000 b/d of ethane production in the region at that time. However, given the costly transportation for Marcellus ethane producers to the US Gulf Coast petrochemical complex, En*Vantage expects Marcellus to be the swing ethane producing region for the US.
The Utica Shale play, located in the mid-Atlantic states with the center of activity in Ohio, is an unknown variable in the US NGL production forecast picture. Little public information is available around potential reserves. Natural gas production, Bentek forecast, could reach 2.3 Bcf/day by 2016, which would equate to 50,000 b/d to 250,000 b/d of NGLs depending on the BTU content of the gas produced.
PADD II raw mix NGL production is also expected to contribute substantially, thanks to exploration of shale plays in the Willston Basin of North Dakota, Woodford in Oklahoma, and the Anadarko basin in Oklahoma. Bentek expects raw mix production by 2015 to breach 600,000 b/d by year-end 2016, up from around 460,000 b/d currently.
Wells Permitted and Completed in Eagle Ford Shale Play
Source: Texas Railroad Commission

PLATTS SPECIAL REPORT | 8
The North American Gas Value Chain: Developments and Opportunities
These robust growth forecasts are on the back of the recently wide ethane-to-gas spreads, and an expectation that these spreads will stay wide as gas remains a cheap by-product and relatively high oil prices lend support to NGLs, which are also known as liquefied petroleum gas (LPG) when produced from the crude oil refining process.
Large amounts of capital investment on the midstream portion of the business – processing, gathering, transporting, and fractionating – will be needed for rich shale gas producers and petrochemical consumers to capture these economics, especially in areas such as the Marcellus where infrastructure in the gas value chain is limited, particularly storage.
RAW NGL INFRASTRUCTURE: FROM TRANSPORTATION TO FRACTIONATIONThis unprecedented rate and scope of NGL midstream development and expansion projects will determine how supply and demand will intersect on a local, regional, and national basis in the coming years. Ultimately, this collision between significant growth in the upstream and downstream extraction and transportation capacity could lead to localized shortages or surpluses as a logistical transition so vast in size will not happen in complete synchronization with production growth.
PIPELINESMidstream companies have responded to the expected boom in US natural gas liquids production, proposing a wide swath of projects to transport both raw mix from gas processing plants to fractionation capacity and for ethane to petrochemical consumers. Total US natural gas liquids pipeline capacity is expected to grow from 2.4 million b/d this year to 3.9 million b/d by 2014, according to Raymond James.
The bulk of the estimated 1.549 million b/d raw mix capacity, according to Platts data, proposed by US midstream companies is pointed towards Mont Belvieu, Texas, the main US hub for NGL fractionation and storage.The details of these pipeline projects are displayed in the table on page 19.
Several projects are looking to benefit from the expected raw NGL production growth out of the Eagle Ford and Permian Basin shale plays in Texas, the backyard of the Mont Belvieu fractionation and storage hub. The majority of the Eagle Ford/Permian projects are set to be completed in 2012 and early 2013. In addition, midstream companies are keen to capitalize on the NGL production growth out of the Bakken and Granite Wash Shale plays in PADD II, as well as existing natural gas basins in the Rockies such as Unita, Green River, and San Juan. And both OneOk and DCP Midstream are adding purity and raw mix capacity out of Conway, Kansas that will relieve the recent bottlenecks seen in the US midcontinent.
There is the potential for 500,000 b/d of raw mix capacity from Conway to Mont Belvieu between the OneOk Sterling projects and DCP Southern Hills. Several analysts have said that there could be an overbuild for NGL pipelines for this route and in general as NGL production from natural gas processing may not rise enough in PADD II to fill these lines for several years. Bentek expects these
lines may not be fully utilized until “several years after 2016.” En*Vantage said NGL pipelines as a whole in the US could be overbuilt in the next five years.
FRACTIONATIONTo extract all the value out of the raw mix NGL flowing from these growing production centers in the US, NGL fractionation capacity must expand from current levels of 2.8 million b/d and be in place ahead of the forecasted production growth in raw NGLs – as much as 3.2 million b/d by 2016. And the efficiency of the fractionation capacity as well as the proximity to the wellhead or the downstream consumer will determine what fractionation capacity may either be utilized or under-utilized.
Once again, there is a delicate interplay of when raw NGL production will rise to top out current pipeline capacity, when extra pipeline capacity will come online to alleviate bottlenecks, and when the fractionation capacity will be in the right place to convert raw NGLs into purity products. These simultaneous and overlapping developments will ultimately settle regional supply/demand balances and price volatility as the gas value chain infrastructure goes through a dramatic period of change.
In the immediate future, there looms a mismatch between proposed Mont Belvieu pipeline capacity and Mont Belvieu fractionation expansions, which could create an overhang of raw NGLs and tighten spare fractionation capacity in the coming years.
Close to 1.37 million b/d of fractionation capacity, both new units and expansions, are planned for the next two years across the US (see table on page 9). The majority of this new capacity, about 755,000 b/d, will be located in Mont Belvieu, Texas, where existing raw mix lines, fractionation, storage, and exit capacity via purity lines connect to the downstream or waterborne export facilities. Wells Fargo Securities expects that fractionators in the US Gulf Coast outside of Mont Belvieu will see less throughput of raw NGLs as newer, more efficient fractionators are being constructed in Mont Belvieu. Enterprise’s projects are the largest of these Mont Belvieu expansions, with 225,000 b/d in proposed capacity by the end of 2013.
And the capacity may have room to grow further. Analysts expect Eagle Ford NGL production alone to hit as much as 650,000 b/d by 2015, in addition to the expected increases in NGL supply from the Permian, Anadarko/Granite Wash, and inflows from new and expanding Conway to Mont Belvieu pipelines (potential of 500,000 b/d of capacity). Mont Belvieu capacity, which would hit over 2 million b/d by 2014, will be heavily utilized thanks to its proximity to production areas and downstream markets, particularly petrochemical producers.
Bentek expects that fractionation capacity in Mont Belvieu will remain constrained until most of the expansions are completed in the first half of 2013, then capacity should be adequate to process the rise in raw mix NGL supply flowing into the hub. Wells Fargo Securities expects that the supply of raw mix NGLs into Mont Belvieu will exceed fractionation capacity by 300,000 to 450,000 b/d in 2014-

PLATTS SPECIAL REPORT | 9
The North American Gas Value Chain: Developments and Opportunities
2016. This expectation stems from the overhang in proposed raw mix NGL capacity in Mont Belvieu versus the availability of Mont Belvieu fractionation capacity, assuming that these y-grade lines run at 80% of capacity.
Outside of Mont Belvieu, MarkWest has several projects in place to expand its fractionation capacity within key shale plays such as Marcellus and Utica, taking advantage of close proximity to the wellhead and gas processing plants. Through several projects, MarkWest will have 175,000 b/d of NGL fractionation capacity in the Marcellus by 2014 – 75,000 b/d of de-ethanization capacity in the third quarter of 2013 and an additional 40,000 b/d in the second quarter of 2014 at its Houston processing facility In Washington, Pennsylvania.
MarkWest Energy Partners also announced this year it intends to build a 100,000 b/d fractionator in the Utica Shale play at Harrison, Ohio in addition to 200,000 mcf/d of processing capacity in Harrison and Monroe County and an NGL gathering system for the Utica Shale. The fractionator should be operational in the second quarter of 2012. Williams is also expanding their gathering system to bring rich Utica Shale gas to their company’s processing plant in Marshall County, West Virginia, and has planned 103,000 b/d of expansions at their Moundsville, Taylor, and Fort Beeler fractionators – Moundville to be completed by the end of 2012, Taylor and Fort Beeler by the third quarter of 2013.
Willams acquired these assets from Caiman Energy in a buyout April 30. These fractionators are also poised to process raw mix NGLs from Marcellus rich gas. In total, Marcellus/Utica fractionation capacity, essentially PADD I, is set to expand by 364,000 b/d by 2015, according to Bentek.
ETHANE INFRASTRUCTUREWith a lack of downstream ethane demand near the Marcellus and Utica Shale plays, ethane takeaway capacity will be critical to the gas processing and fractionation industries in PADD I. While Shell and Aither Chemicals have talked of building ethylene crackers near the Marcellus in Pennsylvania and West Virginia, the completion of these projects and thus providing local ethane demand is uncertain, according to industry analysts. As noted in the demand section of this report, the US Gulf Coast will be the center of ethane demand for North America thanks to the proposed cracker build-out and renovations of existing crackers towards ethane consumption.
Two pipeline projects are at the forefront of this Marcellus/Utica ethane takeaway wave – MarkWest Liberty Midstream & Resources and Sunoco Logistics’ Mariner West and Enterprise Products Partners’ Appalachia to Texas (ATEX) line, the only two lines from the region to downstream consuming areas that have attracted shipper commitments.
The Mariner West project includes building a 45-mile pipeline as well as using existing infrastructure. The system will run from MarkWest Liberty’s Houston, Pennsylvania, fractionation complex to Sarnia,
Owner/Operator Location Initial/Expansion Capacity In-Service (,000 b/d)Williams Marshall, WV (Moundsville I) 12.5 2Q12Gulf Coast Fractionators Mt. Belvieu, TX 43 2Q12Southcross Energy Refugio, TX 22.5 1Q13Williams Marshall, WV (Moundsville II) 30 4Q12Enterprise Products (MB1 train 6) Mt. Belvieu, TX 75 4Q12Dominion Transmission Marshall, WV 36 4Q12ChevronPhillips Chemical Sweeny, TX 22 1Q13Enterprise Products (WTX 1) Mt. Belvieu, TX 10 1Q13Formosa Hydrocarbons Point Comfort, TX 75 1Q13Lone Star NGL Mt. Belvieu, TX 100 1Q13QEP Energy Resources Sweetwater, UT 10 2Q13Crosstex Energy Services (Eunice) Acadia, LA 40 2Q13Targa Resources (CBF train 4) Mt. Belvieu, TX 100 2Q13OneOk Inc. (Brushton) Ellsworth, KS 60 2Q13Cheasepeake/M3/EV Energy Harrison, OH 90 2Q13MarkWest Liberty Midstream* Washington, PA 38 2Q13MarkWest Liberty Midstream* Marshall, WV 38 2Q13OneOk Inc. (MB-2) Mt. Belvieu, TX 75 2Q13Williams* Marshall, WV (Ft. Beeler) 30 3Q13Dominion Transmission Marshall, WV 23 3Q13Enterprise Products (MB1 train 7) Mt. Belvieu, TX 75 3Q13Williams Marshall, WV (Moundsville III) 30 4Q13Enterprise Products (MB1 train 8) Mt. Belvieu, TX 75 4Q13MarkWest Utica Harrison, OH 60 4Q13MarkWest Utica* Harrison, OH 40 1Q14Lone Star NGL Mt. Belvieu, TX 100 1Q14MarkWest Liberty Midstream* Marshall, WV 38 2Q14Williams* Marshall, WV (Ft.Wetzel) 20 TBDTotal proposed fractionation capacity 1,368*
Source: Platts
Fractionators
US Fractionation Additions and Expansions

PLATTS SPECIAL REPORT | 10
The North American Gas Value Chain: Developments and Opportunities
Ontario, home of a massive petrochemicals and refineries complex. The 50,000 b/d project is slated to come online by third quarter 2013 and could be expanded to 65,000 b/d. Calgary-based petrochemicals firm Nova Chemicals has signed up for an undisclosed amount of ethane.
ATEX, meanwhile, is a 1,230-mile, 90,000 b/d system combining new build with a reversal of an existing propane line from Washington County in southwestern Pennsylvania to Enterprise’s benchmark hub at Mont Belvieu, Texas. Chesapeake Energy, a major Marcellus producer, has signed up to deliver as much as 75,000 b/d on the line when it begins service in first-quarter 2014. In early January, another Marcellus producer, Range Resources, committed to 15-year, 20,000 b/d contract on ATEX. Enterprise launched another open season for commitments on this line on August 30.
The Mariner East project to move NGLs from Marcellus fractionators to storage terminals for potential export has witnessed a shift in scope and a shift in ownership. Sunoco now appears to be the primary driver behind Mariner East, a 45-mile, 50,000 b/d pipeline from MarkWest’s Houston, Pennsylvania fractionation hub to connect with an existing Sunoco refined products pipeline system and on to Philadelphia.
Originally, MarkWest had proposed Mariner East as an ethane line with the potential to export ethane out of Philadelphia to the US Gulf Coast and Europe. In August, Sunoco announced that this line, with an increased initial capacity of 65,000 b/d, would begin transporting propane by the second half of 2014, and both propane and ethane by the first half of 2015.
Market analysts noted that as an ethane export project, Mariner East was felled by two things: the competing pipelines and the fact that Europe predominantly uses oil-based naphtha — not ethane — as a petrochemical feedstock. IHS CERA said that the pipeline economics for ethane beat out the cost of waterborne shipping.Ethane exports, either barges to the US Gulf Coast or cargoes to Europe, would require vessels with LNG-like technology due to the high gravity of ethane.
Several purity ethane projects out of the Marcellus and Utica shale plays have failed, including El Paso Midstream and Spectra Energy’s Marcellus Ethane Pipeline System, a 60,000 b/d system aimed at moving ethane down to the Baton Rouge area. Recently, El Paso announced “suspension of accelerated development efforts.”
The Vantage Pipeline project aims to take ethane from Bakken-sourced fractionators and feed the Alberta provincial petrochemical market, where feedstock has fallen short of cracking capacity for
Owner/Operator Pipeline Direction Initial Capacity Distance In-Service (from-to) (,000 b/d) (miles)Vantage Pipeline Vantage Williston Basin (ND) to Alberta 45 (up to 60) 430 3Q 2013MarkWest Mariner West Marcellus Shale to Sarnia, ON 50 (up to 65) 350 3Q 2013Enterprise ATEX express Marcellus & Utica shale to Mont Belvieu,TX. 125 (up to 190) 369 1Q 2014Sunoco Logistics Mariner East Marcellus Shale to Philadelphia, PA 65 300 2Q 2014Total Proposed Capacity 285
Source: Platts
some time. This 45,000 b/d purity ethane line will run from the Hess gas processing and fractionation facility at Tioga, North Dakota to Alberta, where it will tie in the existing Alberta ethane pipeline system near Empress. The line can be expanded up to 60,000 b/d, and Vantage expects to complete the project in the second quarter of 2013. Nova Chemicals has a definitive agreement with Hess and Vantage to buy 100% of the ethane produced at Tioga for its Joffre Petrochemical Complex.
PURITY NGL PRODUCTS: SUPPLY & DEMANDStrong economics for ethane and propane versus gas, mainly the ethane-to-natural gas “frac spread” is the primary driver for expected increase in rich gas production, the midstream projects to separate NGLs from gas and transport them to fractionation hubs, and the build-up in fractionation capacity to separate out the liquids into high-value purity products. This spread hit record highs earlier this year, but has tumbled in the past few months given the recent declines in NGL prices relative to gas (see graph on page 5). Still, NGL to gas spreads remain at profitable levels.
This substantial build-out in infrastructure and when certain portions of value chain logistics will come on-stream is critical in determining supply/demand balances for ethane and propane. While fractionation supply increases and ethane delivery capacity is built in the next two years, US petrochemical facilities will also experience a substantial wave of infrastructural improvements and construction, including feedstock shifts away from heavier natural gas liquids and naphtha for ethylene crackers, restarts of existing ethylene crackers, and construction of new ethylene crackers.
The resulting decline in demand for propane should result in propane exports increasing dramatically, possibly overwhelming the almost 700,000 b/d of propane export capacity expansions proposed for the US Gulf Coast. Rising supplies and declining demand in the face of petrochemical feedstock shifts to ethane and residential/commercial switching to natural gas will continue to swing the supply/demand balance domestically towards exports. The US shifted from 37 million barrels of annual propane imports in 2005 to 37 million barrels of propane exports in 2011. Raymond James expects US propane exports to reach 45-50 million barrels total for 2012.
In general, analyst expectations for price vary widely as the complete build-out of the gas value chain from wellhead to ethylene cracker is not completely synchronized, but all in all, the ethane supply to fill these crackers and the propane exports to keep these terminals loading ships near full capacity is generally expected to be there
Ethane Pipeline Projects

PLATTS SPECIAL REPORT | 11
The North American Gas Value Chain: Developments and Opportunities
in the next five years, and may even fall short on the ethane side if enough petrochemical capacity is added. Analysts agree, however, that short-term price volatility and periods of oversupply could result due to the lack of synchronization in the gas value chain build-out.
Some of this volatility has already surfaced this year. The onset of this shift to lighter feedstocks and higher ethylene yields by US petrochemical plants has already begun to impact price for E/P mix, a purity product that is comprised of 80% ethane and 20% propane. Prices for E/P mix at the Conway, Kansas hub fell to 2.35 cents/gal on July 6, making E/P mix one of the cheapest energy commodities on the planet. The E/P mix in Conway has since recovered thanks to some ethane rejection at the gas processing level.
A combination of infrastructure bottlenecks and structural demand shifts created this perfect storm for E/P mix, and stands as a case study of how these dramatic changes in the North American natural gas value chain could affect spot markets.
ETHANE: WILL NEW CAPACITY ARRIVE IN TIME TO ABSORB SUPPLY?Ethane supply/demand balances through the end of the decade have been the focus of many forecasts, analyst reports, and general consternation from the petrochemical industry looking to expand
capacity. In general, analysts expect that supply will generally increase over the next five years thanks to supply increases in raw mix NGLs production and higher ethane yield rich gas plays such as Marcellus and Bakken, and that demand will clearly increase as the petrochemical industry switches existing capacity to ethane feed and expands total capacity via new builds or capacity additions.
The number of US greenfield, worldscale cracker projects on the table currently is unprecedented. Seven projects in total have been announced – five located on the US Gulf Coast and two near the Marcellus Shale. And foreign companies are reportedly showing renewed interest in building crackers in the US based on expectations of cheap ethane feedstock. Please see the table on page 20 and map below for additional details on the worldscale cracker projects.
Current ethane demand is estimated to be 950,000 b/d on average for the US. Platts estimates that as much as 10.73 million metric tons/year of ethylene production capacity, or roughly 670,000 b/d of potential ethane demand, is expected to come online by 2018, if all announced brownfield expansion projects and greenfield new construction projects go forward. Under a 90% operating rate, this would result in roughly 600,000 b/d, Assuming that all proposed cracker restarts and conversions to ethane take place (estimated by
US Ethylene Cracking Capacity – Addition and Expansions
Source: Platts

PLATTS SPECIAL REPORT | 12
The North American Gas Value Chain: Developments and Opportunities
Wells Fargo to equate to 270,000 b/d of demand at a 90% operating rate), this would push total ethane demand over 1.8 million b/d by 2017 in this best case scenario at a 90% operating rate.
However, the likelihood of completion for all seven worldscale cracker greenfield projects – Formosa’s 800,000 mt/year Point Comfort cracker, Shell Chemical’s 1.50 million mt/year Appalachia cracker, ChevronPhilips Chemical’s 1.50 million mt/year Baytown, TX cracker, Dow Chemical’s 1.50 million mt/year Freeport, Texas cracker, and Sasol’s 1.4 million mt/year Lake Charles, ExxonMobil’s 1.50 million mt/year Baytown cracker, and Aither Chemical’s 272,000 mt/year West Virginia cracker – is low. Assuming that just the CP Chemical, ExxonMobil, Dow, and Formosa crackers are built, that would mean an additional 5.3 million mt/year of potential ethylene production capacity, or 330,000 b/d of ethane demand at 100% utilization. Assuming a 90% operating rate and the 270,000 b/d of cracker conversions, restarts and expansions mentioned above, total US ethane demand could rise to 1.55 million b/d by 2017.
This median scenario for ethylene capacity expansions is roughly in line with most analysts. Raymond James expects to see ethane demand increase by 300,000 b/d to 1.24 million b/d by 2015 thanks to cracker conversions both from naphtha feedstocks and from other NGLs to solely ethane. Ethane demand from three potential new crackers will likely add an additional 200,000 to 250,000 b/d between 2016 and 2018, according to Raymond James. If all ethylene cracker projects are completed, Raymond James forecasts 2018 ethane demand at 1.5-1.6 million b/d.
Wells Fargo Securities Equity Research expects 2017 potential US ethane demand to hit 1.726 million b/d – forecasting 148,000 b/d of ethane demand from heavy-to-light feed cracker conversions, 122,000 b/d from ethylene cracker expansions, 105,000 b/d of exports in 2013 and beyond for Sarnia and Alberta, and 246,000 b/d of incremental demand from the ChevronPhillips, Dow, and ExxonMobil crackers. This analysis assumes a 90% operating rate,
En*Vantage expects that maximum ethane demand to hit near 1.8 million b/d by 2018, up 740,000 b/d from current levels, assuming that four of the worldscale crackers are built – Formosa, Dow, ExxonMobil, and ChevronPhillips. This assumes that maximum ethane cracking capacity will increase by almost 280,000 b/d thanks to furnace conversions, plant expansions, and a plant restart, that about 100,000 b/d of ethane will be exported to Canada via the Mariner West and Vantage projects, and that the four world scale crackers will bring 328,000 b/d of cracking capacity to the market. If the Sasol cracker project is completed, this demand figure will exceed 1.8 million b/d, according to EnVantage.
With raw NGL pipelines capacity into Mont Belvieu expected to exceed local fractionation capacity, total US ethane supply is expected to grow substantially as Mont Belvieu fractionation capacity should be fully utilized. Total US ethane supply should increase close to 600,000 b/d to just over 1.67 million b/d by 2017, according to Wells Fargo Securities. Wells Fargo assumes that Mont Belvieu fractionation expansions should add 380,000 b/d of ethane supply by the end of 2015, and an expected 120,000 b/d flowing on Enterprise’s ATEX pipeline to Mont Belvieu by 2017.
En*Vantage expects to see ethane supplies almost 1.5 million b/d by 2016. Prior to 2016, the ethane market should be somewhat oversupplied, with Marcellus as the potential incremental supply source. Petrochemical producers should be incentivized to maximize ethane cracking capacity. As En*Vantage analyst Peter Fasullo said, “Never underestimate the ability of the petrochemical industry to take advantage of cheap feedstock.” Dislocations in either supply or demand could occur in this 2012-2016 period as the infrastructure buildout continues, so ethane prices may be subject to extreme volatility. Post-2016, EnVantage expects supply will rise to just under 1.6 million b/d, and more ethane supply will be needed to support more than two new worldscale crackers.
Raymond James forecasts that ethane supply will outpace demand until 2015, and then new cracking capacity coming online between 2016-2018 should reasonably tighten the market, assuming three worldscale crackers are completed – given its 2016 supply forecast of 1.3 million b/d. If all projects are completed, Raymond James expects that ethane demand could outpace 2018 supplies by 150,000-200,000 b/d.
However, analysts Tudor, Pickering, Holt & Co. argue that the ethane market will shift into oversupply of around 200,000 b/d from second half 2013 through 2018. “The bottlenecks in the NGL market will not be at the fractionation points or gas gathering and processing by 2013-2014. The bottleneck will be ethane.” This is due to the length of time it takes to build a cracker, and Tudor, Pickering, Holt & Co. expects to see ethane prices close to gas for some time as the market is captive. Eventually, this erosion of margins should slow down drilling activity in the liquids rich plays, the analysis group said.
E/P MIX: ETHANE’S NEGLECTED SIBLINGE/P mix is a blend of 80% ethane and 20% propane that comes out of the fractionation process. Some petrochemical producers have the flexibility to switch between ethane, propane, and E/P mix, depending on the relative margins for ethylene and propylene. However, demand for E/P mix is shrinking as the US petrochemical industry is shifting towards ethane-fired crackers.
Part of this move away from E/P mix is related to both supply and stronger ethylene prices compared with propylene. Ethane supply projections are buoyant given the high BTU (and ethane content) of rich gas from US shale plays. Despite the cheap price of E/P mix in July, ethylene cracker margins from E/P mix were only marginally better than ethane cracker margins.
As of July 12, when E/P mix prices at Conway hit record lows, Mont Belvieu E/P mix cracker margins were 29.27 cents/lb, while ethane cracker margins were 26.78 cents/lb, a narrower relationship between the two feedstock margins than what has occurred over the past year. Because ethane yields more ethylene and is linked to higher-priced ethylene polymers, petrochemical producers chose ethane over E/P mix despite the better theoretical margins for the latter.
This reduced demand coupled with infrastructure issues created an unprecedented decline in E/P mix prices at the Conway, Kansas hub. In June, the spot price of E/P mix fell into single digits, dropping from

PLATTS SPECIAL REPORT | 13
The North American Gas Value Chain: Developments and Opportunities
10 cents/gal to just 2.35 cents/gal on July 6. As mentioned earlier, this decline is not only attributable to declining E/P mix demand but overwhelmed storage and pipeline infrastructure in Conway.
Midstream companies have responded to the weakness in the US midcontinent purity NGL market. In July, Enterprise began to reject ethane at its Rockies gas processing plants to open up space for Conway E/P mix on its pipelines to Mont Belvieu. Kinder Morgan’s Cochin line has started to move about 5,000 b/d of E/P mix out of the US Midcontinent to Sarnia, according to industry players, providing a cheap feedstock for the Canadian petrochemical industry. And overall ethane rejection in the US Midcontinent helped to clean up the supply overhang, allowing Conway E/P mix prices to recover back to the strongest levels since March.
By comparison, the Sarnia E/P mix market should have a rosy future with crackers there poised to run the blend, IHS CERA said. This E/P mix would be transported on the Mariner West line, and could potentially leave additional ethane supply to be transported to the US Gulf Coast or to be consumed by the two proposed regional crackers – Shell and Aither.
PROPANE: HOW CAN EXPORTS RELIEVE SUPPLY GLUT?The key to the propane supply/demand balance in the US will be the oncoming export capacity from the US Gulf Coast and potentially the US Atlantic Coast. As overall raw NGL production capacity rises along with fractionation capacity, the resulting propane production will likely overwhelm domestic US demand in 2012 and 2013, as heating demand shifts from relatively expensive propane to cheap natural gas. As export capacity comes online, market analysts generally expect the propane market to shift into balance by 2014. And the advent of propane dehydrogenation units this decade could also create more demand for propane.
Wells Fargo Securities expects propane supplies to grown by 280,000 b/d to 1.593 million b/d by year-end 2015 . Natural gas processing and fractionation will be the sole contributor to this supply growth, according to Wells Fargo. Demand should fall short of supply until 2014, when the market will become balanced. Wells Fargo expects supply to exceed demand by 34,000 b/d in 2012, 15,000 b/d in 2013, and then balanced in 2014-2017.
Wells Fargo forecasts that exports of propane will jump in 2014 to 483,000 b/d, 361,000 b/d above 2011 levels. This significant increase on their exports forecast is due to three factors: arbitrage opportunities, expansions of propane export facilities and continued growth in propane supply from fractionation expansions. However, they also estimate that exports will tail off post-2014 to as low as 442,000 b/d in 2016, but notes that an assessment of the magnitude of LPG exports that could be absorbed globally was not part of this analysis, and a 55-65% utilization rate of LPG export capacity was assumed for 2015-2016. If prices between the US Gulf Coast and other global markets favor export activity, according to Wells Fargo, the propane market could be undersupplied by 2014.
En*Vantage expects propane supplies to grow by 200,000 b/d to over 1.1 million b/d by 2018. Demand for propane in the US, however is expected to match supply through 2018 as export capacity increases
and propane dehydrogenation units come online. As propane cracking for ethylene production decreases over the next 6 years, En*Vantage expects propane dehydrogenation demand to rise to 150,000 b/d by 2017. The export market is key to maintaining the balance between supply and demand as US waterborne export capacity could expand between 250,000 b/d and 650,000 b/d, according to En*Vantage.
Bentek expects that rising refinery production of propane will compete with the boost in propane supplies from natural gas processing, potentially overwhelming demand and pushing prices lower. Bentek also estimate that by 2015 the US propane market will be in balance, as total US propane production to grow by 144,000 b/d to close to 1.284 million b/d by 2016. As well, Bentek expects residential and commercial demand to decline due to price competition with natural gas.
PROPANE EXPORT INFRASTRUCTURE PROJECTSThe propane export projects out of the US Gulf Coast are numerous and include expansions to existing terminals as well as new capacity. Enterprise is planning to expand the export capacity for LPGs out of its Houston Ship Terminal from 4 million to 7.5 million barrels/month, an increase of roughly 120,000 b/d, by the end of this year. Targa Resources is expanding its Houston Ship Channel terminal to 120,000 b/d (5,000 barrels/hour) by the third quarter of 2013, an increase of 84,000 b/d ( 3,500 barrels/hour), with the ability to load three to four VLGCs (very large gas carriers) per month. Following this expansion, Targa will be able to load low-e quality propane, which has 2% ethane content and is the preferred quality globally. Current, the Targa terminal only loads HD5 quality propane (5% ethane content).
ConocoPhillips, Occidental, and TransMontaigne has proposed building a new export terminal on the Houston Ship Channel with the ability to load cargoes of propane and butane at a rate of 15,000 to 20,000 barrels/hour, or roughly 420,000 b/d – the project has a projected start date of the first quarter of 2014.
Vitol has also proposed an export terminal near Beaumont with an overall loading capacity of 100,000 to 200,000 b/d starting up in the first quarter of 2013, roughly 6,250 barrels/hour total capacity. Wells Fargo expects that this project is unlikely to be completed, based on
0
8
16
24
32
40
Source: Platts
E/P Mix Conway (Cts/gal)
Jan-12 Sep-12Aug-12Jul-12Jun-12May-12Apr-12Mar-12Feb-12

PLATTS SPECIAL REPORT | 14
The North American Gas Value Chain: Developments and Opportunities
conversations with the industry. However, a spokesman for Vitol said that the project has not been canceled, and there is no change in the proposed start-up date.
As for the US Northeast, Sunoco Logistics has shifted the Mariner East project to potentially export propane first in 2014, then propane and ethane in 2015. The potential loading capacity of a Philadelphia-based propane export facility for Mariner East has yet to be announced.
Wells Fargo noted in its recent analysis that propane export projects in the US Northeast will be necessary to relieve the expected surplus of propane in the region, as Marcellus and Utica-sources raw NGL mix is processed at local fractionators. In addition, regional demand for propane is expected to decline for heating in the face of cheap Marcellus and Utica gas. In addition, Plains All-American has indicated the possibility of exporting LPGs from its recently acquired Yorktown refinery in Virginia.
WHAT WILL HAPPEN TO NAPHTHA/C5?As demand from US petrochemical producers makes the shift towards ethane, the supply/demand balance of naphtha in North America is destined to change. Naphtha exports from the US have picked up this year, according to market sources – a shift from the US’ net importer position. As naphtha demand declines, so goes natural gasoline – light naphtha extracted from gas processing that is used in North America as a gasoline blending component and a feedstock for heavy ethylene crackers.
Petrochemical demand for naphtha, natural gasoline, and gasoil has already declined to only 10-15% of the overall US petrochemical cracker feed slate during the month of August, according to Raymond James. Year to date, naphtha and gasoil represent approximately 12% of the feed slate, or roughly 230,000 b/d. Raymond James expects naphtha demand could decline further as additional capacity shifts towards lighter feed.
While demand is declining, supply is rising. Increased drilling in the Eagle Ford is yielding condensate, crude with an API higher than 50 degrees. While much of this condensate is moving to Canada to be used as diluent, condensate splitter capacity is increasing across Texas, and is also increasing US Gulf Coast naphtha supplies. In addition, Eagle Ford crude runs along the US Gulf Coast are also increasing naphtha yields, as even a “heavy” Eagle Ford barrel
at 42 API yields 40% naphtha when distilled, compared to a 30% naphtha yield from a 42 API WTI-like barrel. All of this is translating into bulging naphtha supplies and reduced refiner demand for full-range and reformer-grade naphtha. In 2012, the US shifted to a net exporter of naphtha thanks to Eagle Ford crude and condensate, as production has broached the 400,000 b/d level.
To complicate matters, the quality of US Gulf Coast naphtha produced is also changing thanks to Eagle Ford, yielding a lower N+A, lower octane naphtha that is adequate at times for reforming but is too low in octane for blending into the CBOB (conventional blendstock for oxygenate blending) gasoline pool.
Natural gasoline supplies should also rise in line with the expected increase in raw mix NGL capacity. Assuming a 10-13% yield of natural gasoline from y-grade, natural gasoline supply from fractionation by 2015 could be as much as 416,000 b/d, assuming the highest natural gasoline yield and the top end of the aforementioned raw mix NGL capacity forecasts at 3.2 million b/d. This is line with Bentek’s forecast for around 400,000 b/d of natural gasoline production by 2016.
Gasoline blending demand could decline significantly for natural gasoline and light naphthas due to pending EPA rules and increased ethanol blending. Proposed EPA guidelines are calling for an end to the 1 psi ethanol blending waiver by 2014, improvement in octane by 2 and lowering of aromatics content to 10-20% by 2014, and lowering the sulfur content in gasoline from 30 ppm to 10 ppm by 2014-2016. If all of these guidelines are put in place, this will reduce demand for natural gasoline as a blendstock, due to its high RVP and aromatics content. Bentek expects that the decline in natural gasoline demand by 2014 could be as much as 225,000 b/d by 2016 – more than half of expected natural gas production.
However, increased supplies of natural gasoline and naphtha could find a home in the diluent market. As Canadian oil sands production increases, the need for diluent also follows. There is also export demand for diluent in Latin America, as countries such as Colombia use light naphtha/natural gasoline in many of their heavier crude oil grades such as Castilla Blend and South Blend.
In addition, demand for natural gasoline as a denaturant of ethanol could also increase as ethanol production is mandated to rise across
Reference Owner/Operator Location Product New/Expansion Capacity (b/d) In-service1 Enterprise Products Houston Ship Channel, TX Propane 115,000 4Q122 Vitol (CCI) Beaumont, TX Propane 100,000 to 200,000 1Q133 Targa Resources Galena Park, TX Propane 84,000 3Q134 Phillips66, Occidental, Houston Ship Channel, TX Propane/Butane 420,000 1Q14 and TransMontaigne
1 Ability to load multiple vessels simultaneously 2 Storage Capacity of 3 million mt/yr, expandable up to 6 million mt/yr 3 Ability to load 3-4 VLGC (Very Large Gas Carriers) ships per month 4 15,000 to 20,000 barrels/hour; capable of loading VLGC ships, connected to Mont Belvieu via Occidental pipeline
Source: Platts
US LPG Export Projects

PLATTS SPECIAL REPORT | 15
The North American Gas Value Chain: Developments and Opportunities
the US. This, of course, assume that the economics for using natural gasoline as a denaturant will remain favorable versus competitive feedstocks such as raffinate and light straight run gasoline.
If arbitrage economics are favorable, light naphtha and natural gasoline could be exported regularly from the US to Europe and Asia, where ethylene crackers are geared to run heavier feedstocks. These incremental exports are dependent upon the health of the petrochemical industry outside of the Americas – an industry that feels the brunt of economic decline first due to its close proximity to the consumer.
In 2012, economic woes in both Asia and Europe have slashed petrochemical demand for naphtha, in turn pushing prices lower globally and somewhat limiting arbitrage opportunities from the Americas to Europe and Asia petrochemicals despite more than ample supplies (see graph on global naphtha prices). Naphtha and natural gasoline’s future supply/demand balance in the US may hinge solely on Americas heavy crude oil production economics and the relative strength of the Europe and Asia petrochemical industries.
OLEFINS AND POLYMERS: A RENAISSANCE FOR THE NORTH AMERICAN PETROCHEMICAL INDUSTRYShale gas has breathed new life into the once seemingly destitute petrochemical industry in the United States. The combination of cheap and abundant feedstock – in the form of natural gas and natural gas liquids, or NGLs – has the industry, and olefins producers in particular, proposing an unprecedented build-out in new ethylene production capacity of 10.73 million/mt year. Nonetheless, a big bet has been placed – and it has everything to do with ethylene and its derivatives.
Why ethylene? The answer lies in just how essential NGLs have become to the petrochemical industry in North America and how versatile ethylene is.
Whereas heavier feedstocks such as naphtha still power the majority of steam crackers around the world, ethane, the most abundant of the NGLs, is the preferred feedstock for the production of olefins – and ethylene in particular – in the US. Ethylene is a key building block of the petrochemical industry with seemingly endless uses that range from household chemicals to plastics to fibers. The petrochemical industry accounts for most, if not all, of the demand for ethane in North America
This newfound abundance of shale-derived natural gas in the US likely means NGLs supply, but especially ethane, will be plentiful – if not cheap – for the foreseeable future, ushering a potentially generous feedstock advantage second only to that of the Middle East. That, in turn, has created a sort of renaissancefor an industry that just a few years ago was in decline/.
As noted in the ethane demand section, US ethylene cracking capacity is set to increase by 10.73 million/mt year thanks to greenfield and brownfield cracker additions. A recent report by Chemical Market Resources estimates that today’s feedstock dynamics in US crackers have shifted to as much as 87% ethane-based, up from the historical 70%.
Daily spot ethylene assessments by Platts averaged 53.80 cents/lb in August, while US Gulf Coast purity ethane averaged 35.23 cents/
gal. The ethane price, when converted to pounds, yields a rough cash cost of 14.87 cents/lb, for ample margins of nearly 39 cents/lb. The wide margins in recent month are attributed to historically cheap cash costs and some moderate strength in ethylene prices.
However, this does not come close to the record levels for ethane-fed ethylene margins earlier this year, when tight ethylene supplies and historical weak ethane prices yielded a record margin of 55 cents/lb. It is worth pointing out that these record margins came as the olefins industry was undergoing a busy turnaround season, which has tightened ethylene supply and pushed prices to 75 cents/lb, while reducing feedstock demand.
But one glance at cracker margins in 2011, and it is clear that those producers who cracked ethane or ethane/propane mix saw 20- to 25 cent/lb margins become the norm – this for an industry for which 10 cents/lb was historically good. When compared to naphtha-based European cracker margins for ethylene, US cracker margins based on ethane are far and away a winner.
Yet ethylene is not where most in the market see the feedstock advantage being developed to its potential. Polyethylene and other derivatives, they say, is where the cost advantages for US petrochemical producers lie. A recent report by Peter Callais of Townsend Solutions forecasts global polyethylene demand to grow at a 4.9% yearly average through 2015, when it could reach nearly 95 million mt/year, up from just under 75 million mt in 2010.
The bulk of the demand growth through this period will come from emerging economies/regions, Callais noted. North American demand is expected to grow at an average of 3.6% to as much as 18 million mt/year by 2015, according to the Townsend report.
Many market participants and analysts expect a hard-fought race among producers to both secure feedstocks and upgrade or build the infrastructure needed to enjoy the most return on investment As noted in the previous section on ethane demand, there are a mix of proposed brownfield and greenfield cracker projects poised to take advantage of the projected surplus of ethane. Some of the greenfield
0
50
100
150
200
250
300
350
Source: Platts
Global Naphtha Prices (Cts/gal)
Jan-12 Sep-12Aug-12Jul-12Jun-12May-12Apr-12Mar-12Feb-12
Natural Gasoline Mont Belvieu Non-Targa Pipe
Naphtha C+F Japan CargoNaphtha CIF NWE Cargo

PLATTS SPECIAL REPORT | 16
The North American Gas Value Chain: Developments and Opportunities
projects, which are not slated to come online until after 2016, may miss some of the early benefits of plentiful ethane supplies, according to LyondellBasell CEO Jim Gallogly.
The industry’s big bet on ethylene is indeed not without risks, not the least of which is the threat of overbuilding. Several analyst firms have projected a potential overbuild as ethane demand is expected to exceed supply post-2016 (EnVantage, Wells Fargo, RBN Energy, and others).
The etane feedstock advantage will likely translate into not exports of olefins, but of ethylene derivatives, particularly polymers such as HDPE, LLDPE and LDPE, and potentially monoethylene glycol. The US Gulf Coast may be best place to capitalize on cheap production costs and exports, given its close proximity to South America, where plastic consumption is growing in individual countries and imports are expected to rise.
The cash costs for converting ethylene to PE have already dropped to unprecedented levels, creating tremendous margins for integrated producers. The ethylene cash cost to HDPE blow molding spread has averaged nearly 33 cents/lb ($727/mt) from June 2010-June 2012. With such a wide margin, traders hoped that any additional capacity in the US would bring more business to them.
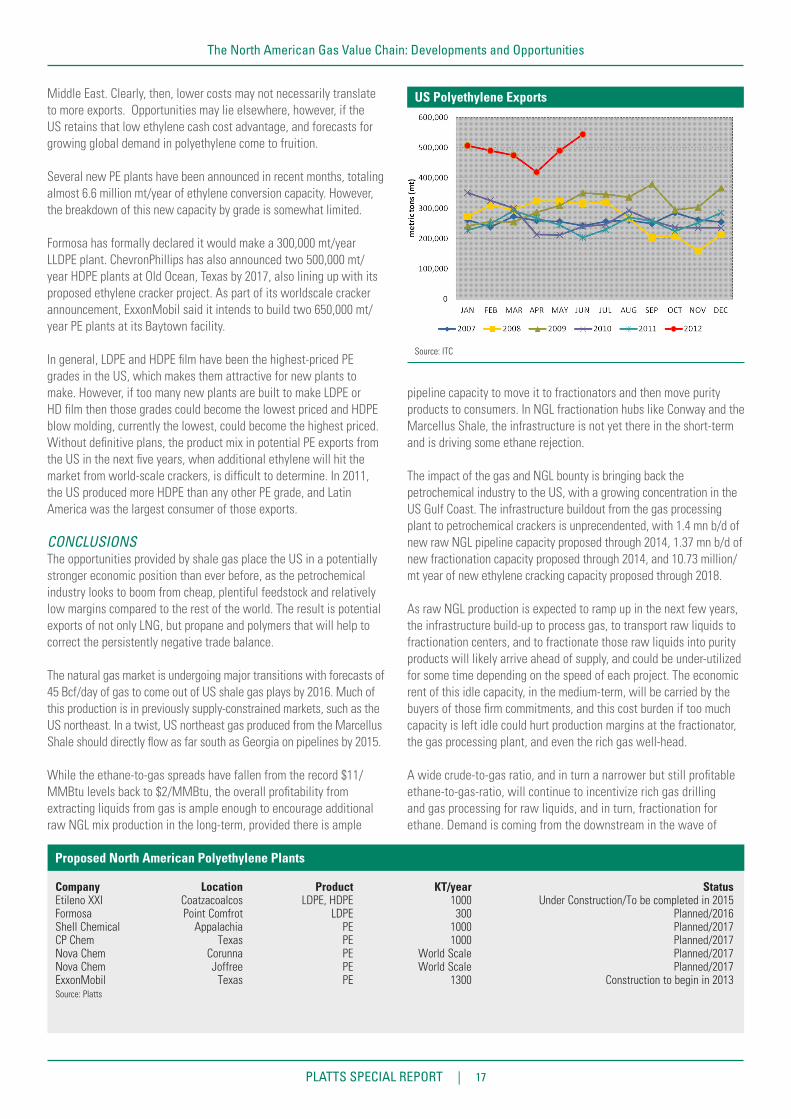
US PE exports have increased this year, according to data from ITC. US polyethylene exports (both low, linear low, and high density) have averaged over 480, 000 mt/month from January through June 2012, compared to an average of 270,000 mt/month between 2007 and 2011 (see graph below). The majority of these exports for the first six months of 2012 are LDPE (60.8%) and HDPE (28.1%). A recent increase in domestic PE prices, however, has curbed some of this export activity.
Therefore, an increase in PE production relative to domestic consumption could result in greater exports. North America remains long in nameplate capacity of polyethylene, beyond any plans to construct new capacity. The US produced about 37.42 billion lbs (17 million mt) of polyethylene in 2010, about 670 million lbs more than it did in 2009. The US had for most of the first decade of 2000 exported about 25% of its production, but when feedstock costs rose through 2007 until the crash of 2008 profits suffered and plants were closed. Dow Chemical was the most aggressive in shutting unprofitable plants, shuttering roughly 782 million lbs/year (350,000 mt/year) of capacity from 2006-10. Dow, along with Flint Hills Resources, LyondellBasell, and Westlake, closed about 1.7 billion lbs/year of capacity in that period. While Formosa in the US and Nova in Canada brought on a little over half a billion pounds of PE production, overall North America production fell just under 3%, according to industry reports.
The loss of that production hit the export market the hardest as producers reduced spot volume to traders to concentrate more on the domestic market. One impact this had on the market was to open up South America to imports from Asia. The subsequent economic slowdown in China last year also encouraged additional exports from Asia and the Middle East to flow to South America, which consistently beat out US-origin product by hundreds of dollars.
US PE exporters would need to gain ground in what has been a saturated South American spot market in recent years. LLDPE, for example, was offered in the last week of February at $1,554/mt FAS Houston, which was just about on par with the CFR offers into South America, one of the highest-priced import markets in the world. US offers were being undercut from high-cost naphtha producers in South America, South Korea as well as gas feedstock producers in the
US NGL Cracker Margins vs. European Naphtha Cracker Margins
Source: Platts
PLATTS SPECIAL REPORT | 17
The North American Gas Value Chain: Developments and Opportunities
Middle East. Clearly, then, lower costs may not necessarily translate to more exports. Opportunities may lie elsewhere, however, if the US retains that low ethylene cash cost advantage, and forecasts for growing global demand in polyethylene come to fruition.
Several new PE plants have been announced in recent months, totaling almost 6.6 million mt/year of ethylene conversion capacity. However, the breakdown of this new capacity by grade is somewhat limited.
Formosa has formally declared it would make a 300,000 mt/year LLDPE plant. ChevronPhillips has also announced two 500,000 mt/year HDPE plants at Old Ocean, Texas by 2017, also lining up with its proposed ethylene cracker project. As part of its worldscale cracker announcement, ExxonMobil said it intends to build two 650,000 mt/year PE plants at its Baytown facility.
In general, LDPE and HDPE film have been the highest-priced PE grades in the US, which makes them attractive for new plants to make. However, if too many new plants are built to make LDPE or HD film then those grades could become the lowest priced and HDPE blow molding, currently the lowest, could become the highest priced. Without definitive plans, the product mix in potential PE exports from the US in the next five years, when additional ethylene will hit the market from world-scale crackers, is difficult to determine. In 2011, the US produced more HDPE than any other PE grade, and Latin America was the largest consumer of those exports.
CONCLUSIONSThe opportunities provided by shale gas place the US in a potentially stronger economic position than ever before, as the petrochemical industry looks to boom from cheap, plentiful feedstock and relatively low margins compared to the rest of the world. The result is potential exports of not only LNG, but propane and polymers that will help to correct the persistently negative trade balance.
The natural gas market is undergoing major transitions with forecasts of 45 Bcf/day of gas to come out of US shale gas plays by 2016. Much of this production is in previously supply-constrained markets, such as the US northeast. In a twist, US northeast gas produced from the Marcellus Shale should directly flow as far south as Georgia on pipelines by 2015.
While the ethane-to-gas spreads have fallen from the record $11/MMBtu levels back to $2/MMBtu, the overall profitability from extracting liquids from gas is ample enough to encourage additional raw NGL mix production in the long-term, provided there is ample
pipeline capacity to move it to fractionators and then move purity products to consumers. In NGL fractionation hubs like Conway and the Marcellus Shale, the infrastructure is not yet there in the short-term and is driving some ethane rejection.
The impact of the gas and NGL bounty is bringing back the petrochemical industry to the US, with a growing concentration in the US Gulf Coast. The infrastructure buildout from the gas processing plant to petrochemical crackers is unprecendented, with 1.4 mn b/d of new raw NGL pipeline capacity proposed through 2014, 1.37 mn b/d of new fractionation capacity proposed through 2014, and 10.73 million/mt year of new ethylene cracking capacity proposed through 2018.
As raw NGL production is expected to ramp up in the next few years, the infrastructure build-up to process gas, to transport raw liquids to fractionation centers, and to fractionate those raw liquids into purity products will likely arrive ahead of supply, and could be under-utilized for some time depending on the speed of each project. The economic rent of this idle capacity, in the medium-term, will be carried by the buyers of those firm commitments, and this cost burden if too much capacity is left idle could hurt production margins at the fractionator, the gas processing plant, and even the rich gas well-head.
A wide crude-to-gas ratio, and in turn a narrower but still profitable ethane-to-gas-ratio, will continue to incentivize rich gas drilling and gas processing for raw liquids, and in turn, fractionation for ethane. Demand is coming from the downstream in the wave of
US Polyethylene Exports
Source: ITC
Company Location Product KT/year StatusEtileno XXI Coatzacoalcos LDPE, HDPE 1000 Under Construction/To be completed in 2015Formosa Point Comfrot LDPE 300 Planned/2016Shell Chemical Appalachia PE 1000 Planned/2017CP Chem Texas PE 1000 Planned/2017Nova Chem Corunna PE World Scale Planned/2017Nova Chem Joffree PE World Scale Planned/2017ExxonMobil Texas PE 1300 Construction to begin in 2013Source: Platts
Proposed North American Polyethylene Plants

FOR MORE INFORMATION, PLEASE CONTACT THE PLATTS SALES OFFICE NEAREST YOU:Web www.platts.com E-mail [email protected]
NORTH AMERICA EMEA LATIN AMERICA ASIA-PACIFIC RUSSIA +1-800-PLATTS8 (toll-free) +44-(0)20-7176-6111 +54-11-4804-1890 +65-6530-6430 +7-495-783-4141 +1-212-904-3070 (direct)
The North American Gas Value Chain: Developments and Opportunities
© 2012 Platts, a Division of The McGraw-Hill Companies, Inc.
Reproduction of this publication in any form is prohibited except with the written permission of Platts. Because of the possibility of human or mechanical error by Platts’ sources, Platts does not guarantee the accuracy, adequacy, completeness, or availability of any Platts information and is not responsible for any errors or omissions or for the use of such Platts information. Platts gives no express or implied warranties, including, but not limited to, any implied warranties of merchantability or fitness for a particular purpose or use. In no event shall Platts be liable for any direct, indirect, special, or consequential damages in connection with subscribers’ or others’ use of this publication.
world-scale ethylene crackers by 2018 to absorb the purity product supply that will result from these favorable economics to exploit US shale deposits for natural gas liquids. While the full impact of recent legacy gas well shut-ins has not been fully assessed on overall raw mix production this year, the crude-to-gas ratio and the “frac spread” should still remain historically wide in the long-term�, despite the recent declines seen in crude and NGL prices. Assuming a relatively stable economic environment, these spreads will continue to drive rich gas drilling and processing.
Cheaper and plentiful ethane equates to lean ethylene and polyethylene production margins for the North American petrochemical
industry, margins that could compete with the Middle East as the lowest cost ethylene producer globally, and in turn, result in greater exports of polyethylene from the US to the rest of the world.
Platts is the only commodities information service that publishes spot prices throughout the North American gas value chain, from spot natural gas in North America, to spot natural gas liquids, down to olefins and polymers. Platts is evaluating additional pricing assessment opportunities to provide price discovery as this unprecedented production and infrastructure boom continues, and welcomes your feedback. Please contact [email protected] for any questions, comments or suggestions.
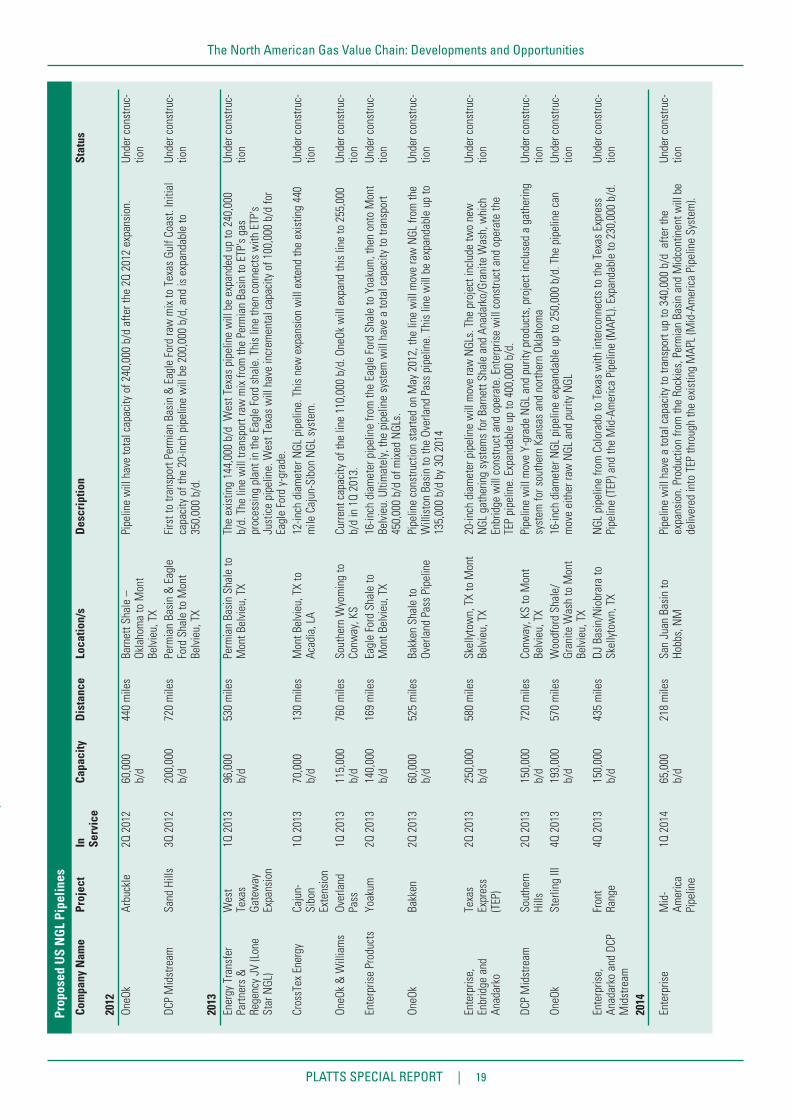
PLATTS SPECIAL REPORT | 19
The North American Gas Value Chain: Developments and OpportunitiesPr
opos
ed U
S N
GL
Pipe
lines
Com
pany
Nam
ePr
ojec
tIn
Se
rvic
eCa
paci
tyD
ista
nce
Loca
tion/
sD
escr
iptio
nSt
atus
2012
OneO
kAr
buck
le2Q
201
260
,000
b/
d44
0 m
iles
Barn
ett S
hale
–
Okla
hom
a to
Mon
t Be
lvie
u, T
X
Pipe
line
will
hav
e to
tal c
apac
ity o
f 240
,000
b/d
afte
r the
2Q
2012
exp
ansi
on.
Unde
r con
stru
c-tio
n
DCP
Mid
stre
amSa
nd H
ills
3Q 2
012
200,
000
b/d
720
mile
sPe
rmia
n Ba
sin
& E
agle
Fo
rd S
hale
to M
ont
Belv
ieu,
TX
Firs
t to
trans
port
Perm
ian
Basi
n &
Eag
le F
ord
raw
mix
to T
exas
Gul
f Coa
st. I
nitia
l ca
paci
ty o
f the
20-
inch
pip
elin
e w
ill b
e 20
0,00
0 b/
d, a
nd is
exp
anda
ble
to
350,
000
b/d.
Unde
r con
stru
c-tio
n
2013
Ener
gy T
rans
fer
Partn
ers
&
Rege
ncy
JV (L
one
Star
NGL
)
Wes
t Te
xas
Gate
way
Ex
pans
ion
1Q 2
013
96,0
00
b/d
530
mile
sPe
rmia
n Ba
sin
Shal
e to
M
ont B
elvi
eu, T
XTh
e ex
istin
g 14
4,00
0 b/
d W
est T
exas
pip
elin
e w
ill b
e ex
pand
ed u
p to
240
,000
b/
d. T
he li
ne w
ill tr
ansp
ort r
aw m
ix fr
om th
e Pe
rmia
n Ba
sin
to E
TP's
gas
proc
essi
ng p
lant
in th
e Ea
gle
Ford
sha
le. T
his
line
then
con
nect
s w
ith E
TP's
Just
ice
pipe
line.
Wes
t Tex
as w
ill h
ave
incr
emen
tal c
apac
ity o
f 100
,000
b/d
for
Eagl
e Fo
rd y
-gra
de.
Unde
r con
stru
c-tio
n
Cros
sTex
Ene
rgy
Caju
n-Si
bon
Exte
nsio
n
1Q 2
013
70,0
00
b/d
130
mile
sM
ont B
elvi
eu, T
X to
Ac
adia
, LA
12-in
ch d
iam
eter
NGL
pip
elin
e. T
his
new
exp
ansi
on w
ill e
xten
d th
e ex
istin
g 44
0 m
ile C
ajun
-Sib
on N
GL s
yste
m.
Unde
r con
stru
c-tio
n
OneO
k &
Will
iam
sOv
erla
nd
Pass
1Q 2
013
115,
000
b/d
760
mile
sSo
uthe
rn W
yom
ing
to
Conw
ay, K
SCu
rrent
cap
acity
of t
he li
ne 1
10,0
00 b
/d. O
neOk
will
exp
and
this
line
to 2
55,0
00
b/d
in 1
Q 20
13.
Unde
r con
stru
c-tio
nEn
terp
rise
Prod
ucts
Yoak
um2Q
201
314
0,00
0 b/
d16
9 m
iles
Eagl
e Fo
rd S
hale
to
Mon
t Bel
vieu
, TX
16-in
ch d
iam
eter
pip
elin
e fro
m th
e Ea
gle
Ford
Sha
le to
Yoa
kum
, the
n on
to M
ont
Belv
ieu.
Ulti
mat
ely,
the
pipe
line
syst
em w
ill h
ave
a to
tal c
apac
ity to
tran
spor
t 45
0,00
0 b/
d of
mix
ed N
GLs.
Unde
r con
stru
c-tio
n
OneO
kBa
kken
2Q 2
013
60,0
00
b/d
525
mile
sBa
kken
Sha
le to
Ov
erla
nd P
ass
Pipe
line
Pipe
line
cons
truct
ion
star
ted
on M
ay 2
012,
the
line
will
mov
e ra
w N
GL fr
om th
e W
illis
ton
Basi
n to
the
Over
land
Pas
s pi
pelin
e. T
his
line
will
be
expa
ndab
le u
p to
13
5,00
0 b/
d by
3Q
2014
Unde
r con
stru
c-tio
n
Ente
rpris
e,
Enbr
idge
and
An
adar
ko
Texa
s Ex
pres
s (T
EP)
2Q 2
013
250,
000
b/d
580
mile
sSk
elly
tow
n, T
X to
Mon
t Be
lvie
u, T
X20
-inch
dia
met
er p
ipel
ine
will
mov
e ra
w N
GLs.
The
pro
ject
incl
ude
two
new
N
GL g
athe
ring
syst
ems
for B
arne
tt Sh
ale
and
Anad
arko
/Gra
nite
Was
h, w
hich
En
brid
ge w
ill c
onst
ruct
and
ope
rate
. Ent
erpr
ise
will
con
stru
ct a
nd o
pera
te th
e TE
P pi
pelin
e. E
xpan
dabl
e up
to 4
00,0
00 b
/d.
Unde
r con
stru
c-tio
n
DCP
Mid
stre
amSo
uthe
rn
Hills
2Q 2
013
150,
000
b/d
720
mile
sCo
nway
, KS
to M
ont
Belv
ieu,
TX
Pipe
line
will
mov
e Y-
grad
e N
GL a
nd p
urity
pro
duct
s, p
roje
ct in
clus
ed a
gat
herin
g sy
stem
for s
outh
ern
Kans
as a
nd n
orth
ern
Okla
hom
aUn
der c
onst
ruc-
tion
OneO
kSt
erlin
g III
4Q 2
013
193,
000
b/d
570
mile
sW
oodf
ord
Shal
e/
Gran
ite W
ash
to M
ont
Belv
ieu,
TX
16-in
ch d
iam
eter
NGL
pip
elin
e ex
pand
able
up
to 2
50,0
00 b
/d. T
he p
ipel
ine
can
mov
e ei
ther
raw
NGL
and
pur
ity N
GLUn
der c
onst
ruc-
tion
Ente
rpris
e,
Anad
arko
and
DCP
M
idst
ream
Fron
t Ra
nge
4Q 2
013
150,
000
b/d
435
mile
sDJ
Bas
in/N
iobr
ara
to
Skel
lyto
wn,
TX
NGL
pip
elin
e fro
m C
olor
ado
to T
exas
with
inte
rcon
nect
s to
the
Texa
s Ex
pres
s Pi
pelin
e (T
EP) a
nd th
e M
id-A
mer
ica
Pipe
line
(MAP
L). E
xpan
dabl
e to
230
,000
b/d
.Un
der c
onst
ruc-
tion
2014
Ente
rpris
eM
id-
Amer
ica
Pipe
line
1Q 2
014
65,0
00
b/d
218
mile
sSa
n Ju
an B
asin
to
Hobb
s, N
MPi
pelin
e w
ill h
ave
a to
tal c
apac
ity to
tran
spor
t up
to 3
40,0
00 b
/d a
fter t
he
expa
nsio
n. P
rodu
ctio
n fro
m th
e Ro
ckie
s, P
erm
ian
Basi
n an
d M
idco
ntin
ent w
ill b
e de
liver
ed in
to T
EP th
roug
h th
e ex
istin
g M
APL
(Mid
-Am
eric
a Pi
pelin
e Sy
stem
).
Unde
r con
stru
c-tio
n

PLATTS SPECIAL REPORT | 20
The North American Gas Value Chain: Developments and Opportunities
North American Natural Gas Pipeline Shifts
Owner/Pipeline Date of Change Change in Strategy Capacity (Bcf/d)
Alliance Pipeline December 2010 Announced that only 8% of its existing shippers planned to extend their contracts beyond 2015, and it would introduce new services and an exchange-traded point, the Alliance Chicago Exchange.
1.5
Columbia Gulf Pipeline October 2010 Filed its first rate case in 14 years. The reason of the change was due to shippers using points near Delhi, Louisiana, to source their gas, while the onshore system has seen flows drop some 50% in the last 10 years
1.7
Kinder Morgan/Tennesse Gas Pipeline
November 2010 Applied to raise its rate base to $2.6 billion, up 73%, and its cost of service to $1.05 billion, or 50%. The reason of the rate increment was due that shippers are reduc-ing their reliance on Gulf Coast supplies and resulting long-haul transport in favor of basins close to their market areas, such as the Rockies and Marcellus Shale.
6.7
TransCanada Mid-2010 Announced it wanted to hike rates on its Alberta system in order to recover operation-al costs on its mainline, which has suffered from falling throughout. Platts flow data shows flows at various border points on TransCanada’s system have dropped between 13% and 73% between 2009 and 2010. Transcanada’s 2012/13 toll structure has yet to be approved even though it proposed to lower long-haul tolls 32%, while raising prices for interruptible services.
7
Trunkline Gas Pipeline July 2011 Pipeline placed into service its newly modified South Texas segment, which can move liquids-rich gas bidirectionally. The 165-mile system has as its anchor shipper DCP Midstream, which signed a 15-year deal.
1.5
Boardwalk Pipeline Partners
May 2012 Filed an application with FERC to convert some 280 miles of its Gulf South Pipeline, all of it in South Texas, to carry wet gas. The segment had been running at 7% capacity since the beginning of last year, the filing stated.
6.9
Kinder Morgan/Pony Express Pipeline
August 2012 Announced it would switch its 430-mile gas line to crude oil. The project also involves constructing a new 260-mile extension to Oklahoma. The pipeline will be running from Guernsey, Wyoming, to Phillips 66 Ponca City Refinery, Oklahoma and to Cushing, OK. The line is expected to be in service by 3Q 2014. The system was originally an oil pipeline that was converted to gas in 1997.
2.2
Ethylene Cracker Projects
Company Name Project Location
In Service
Ethylene Capacity (mt/year)
Description
Formosa Plastics Point Comfort 2016 800,000 Part of overall expansion at existing Point Comfort facility
ExxonMobil Chemical
Baytown, Texas
2016 1,500,000 Brownfield worldscale cracker project at existing olefins complex
Sasol Lake Charles, Louisiana
2017 1,400,000 Part of a new worldscale cracker and derivatives complex
ChevronPhillips Chemical
Baytown, Texas
2017 1,500,000 Company announced the cracker would be at its existing Cedar Bayou complex earlier this year
Dow Chemical Freeport, Texas 2017 1,500,000 New worldscale cracker at the Texas Operations facility to cost $1.7 million, would increase ethylene production capacity to 2.3 million mt/year
Shell Chemical Pennsylvania 2017 1,500,000 New petrochemical complex that would upgrade Marcellus/Utica ethane
Aither Chemicals/Bayer
West Virginia 2015 272,000 Completed an ethylene open season on July 20 with a “positive response,” Aither plant will focus on producing ethylene and derivatives such as polyethylene, ethylene glycol, acetic acid, and ethylene oxide.