the north american ride control aftermarket
TRANSCRIPT
The North American Ride Control Aftermarket
How to Handle Upcoming Challenges and Corner the
Market
Matthew Scruggs, Industry Analyst
Automotive & TransportationAutomotive & Transportation
December 14, 2010

Today’s Presenter
Matthew Scruggs, Industry Analyst
Frost & Sullivan
2
Experience covering a broad range of sectors, leveraging long-standing
working relationships with leading industry participants’ Senior Executives in
the following sectors:
•OE Product Development Strategies
•Aftermarket Powertrain Control Electronics
•Aftermarket Legislative Impact Forecasting
•Aftermarket Body Electronics

Focus Points
Agenda
Total North American Ride Control Aftermarket Data
Standard Replacement Ride Control Aftermarket
• Market Data
• Analysis of Drivers, Restraints, Opportunities, and Challenges by Product Type
3
• Analysis of Distribution Channels
Performance Ride Control Aftermarket
• Market Data
• Analysis of Consumer Behavior Data
Strategic Recommendations
Total North American Ride Control Aftermarket
4

Total North American Ride Control Aftermarket
8.5%
91.5%
Revenues by Geographic Region (North America), 2009Top Three Participant Revenue Shares (North America), 2009
44%
19%
15%
5N732-18
91.5%
Source: Frost & Sullivan
20162009
Units (Millions)45.07
Revenues ($ Millions)621.70
Units (Millions)45.66
Revenues ($ Millions)632.11
CAGR 0.19%
CAGR 0.24%

Ride Control Aftermarket Product Segments and Splits by Percentage of Revenue
Performance
17%
Entry-level Shock Absorbers 36% Premium Twin-Tube
Shock Absorbers
4%
Premium Monotube
Shock Absorbers
3%
Entry-level Struts 23% Pre- Premium Premium
6
Entry-level Struts 23% Pre-Assembled Struts 6%
Premium Twin-Tube
Struts
3%
Premium Monotube
Struts
1%
Coil Springs 3%
Strut Mounts 4%
100%

Standard Replacement Ride Control Aftermarket
7

Standard Replacement Aftermarket Unit Shipment and Revenue Forecast
Total Standard Replacement Aftermarket: Unit
Shipment and Revenue Forecast (North America) 2006-
2016
41.00
42.00
43.00
44.00
Un
its (
Mil
lio
n)
540
560
580
600
Reven
ues (
$ M
illi
on
s)
Steady market declines increased dramatically with
the 2008 recession.
Growth from 2010 to 2013, driven by
deferred repair jobs. Growth in this period
also supported by increase in the average
VIO age.
8N732-18
38.00
39.00
40.00
41.00
2006 2008 2010 2012 2014 2016
Un
its (
Mil
lio
n)
480
500
520
540
Reven
ues (
$ M
illi
on
s)
Slight decline after 2013 due to a decline in unit shipments as deferred demand evaporates and OE warranty
terms and part quality increases.
Source: Frost & Sullivan
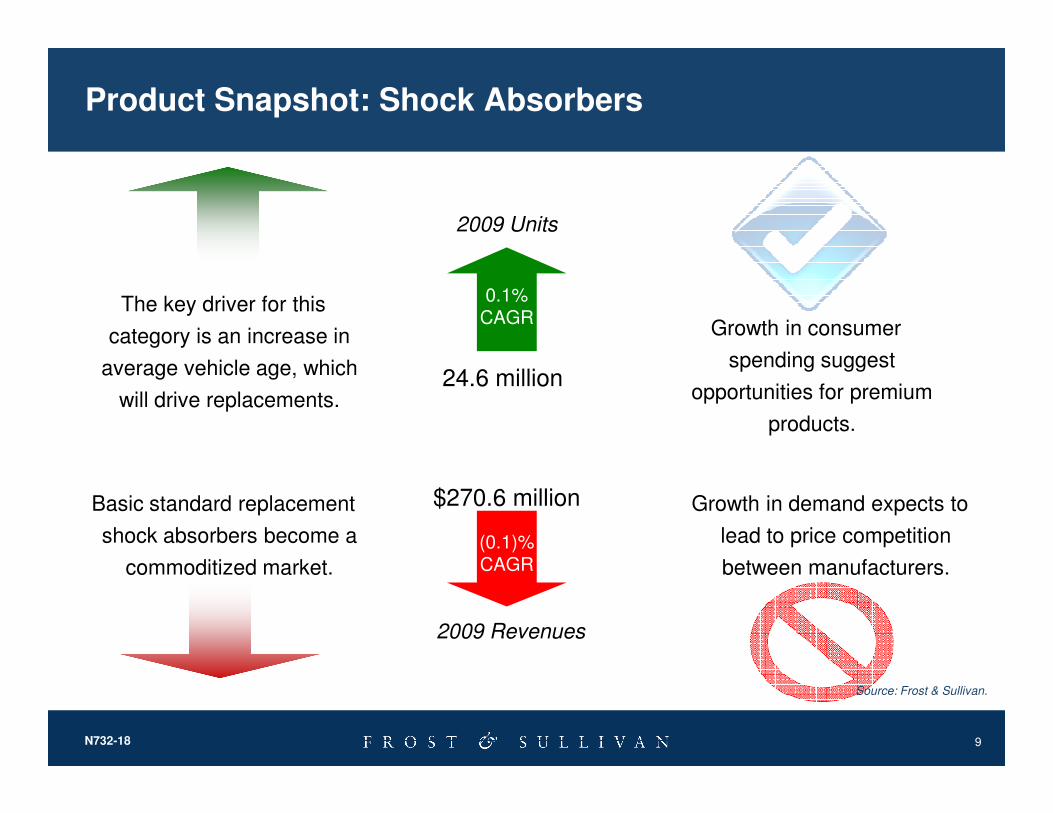
Product Snapshot: Shock Absorbers
The key driver for this
category is an increase in
average vehicle age, which
will drive replacements.
Growth in consumer
spending suggest
opportunities for premium
2009 Units
0.1%CAGR
24.6 million
9N732-18
will drive replacements.
Basic standard replacement
shock absorbers become a
commoditized market.
products.
Growth in demand expects to
lead to price competition
between manufacturers.
Source: Frost & Sullivan.
2009 Revenues
(0.1)%CAGR
$270.6 million

Product Snapshot: Struts
Installed base expects to
increase as small vehicles are
sold more often than light
trucks.
Pre-assembled struts have an
opportunity to cannibalize sales of
coil springs in certain segments.
2009 Units
0.3%CAGR
9.4 million
10N732-18
Extended OE warranty terms
reduces replacements through
the independent aftermarket
Manufacturers must accommodate
growth in product line and growth in
SKUs for retailers as vehicle
applications expand.
Source: Frost & Sullivan.
2009 Revenues
$205.9 million
0.2%CAGR

Product Snapshot: Coil Springs
A shift toward small cars will
increase the installed base of
vehicles with coil springs.
Mild demand growth combined
with low cost for raw materials
creates the potential for
2009 Units
0.94 million
(0.1)%CAGR
11N732-18
Coil springs have a very low
replacement rate, as they are
usually a life-of-the-vehicle part.
enhanced margins.
Steel prices are expected to
increase across the forecast
period, negatively impacting
margins or average pricing.
Source: Frost & Sullivan.
2009 Revenues
(0.2)%CAGR
$20.7 million

Product Snapshot: Strut Mounts
An increase in strut suspension-
equipped vehicles will increase
the installed base.Package sales of struts and strut
mounts drives value proposition
for replacing both components.
2009 Units
0.2%CAGR
5.5 million
12N732-18
Increased OE warranty terms
reduces replacements in the
independent aftermarket.
Manufacturers are challenged to
incorporate product differentiation to
avoid market commoditization.
Source: Frost & Sullivan.
2009 Revenues
$24.8 million
0.2%CAGR

Analysis of Revenues by Distribution Channel
Revenues Split by Distribution Channel (North America), 2009
OES Channel 13% Retail Channel 14% Warehouse Distribution Channel 73%
• Product shift in this channel from shocks to struts
• Extended OE warranty terms on
• Sales come primarily from DIFM installations
• DIY drives retail channel in certain
• WD channel will continue to control the vast majority of revenues
• Slight erosion in some product
13N732-18
Source: Frost & Sullivan
warranty terms on new vehicles
• Strong revenue support from independent installers
Slight growth through
2015
channel in certain segments
• Product shift from coil springs to pre-assembled struts
some product segments to OES channel
• Declines offset by aging vehicle parc
Stability expected
through 2015
Slight decline through
2015

Performance Ride Control Aftermarket
14

Performance Aftermarket Unit Shipment and Revenue Forecast
Total Performance Product Aftermarket: Unit Shipments
and Revenue Forecast (North America) 2006-2016
4.65
4.70
4.75
4.80
4.85
4.90
Un
its (
Mil
lio
n)
100
102
104
106
108
110
Reven
ues (
$ M
illi
on
s)
The performance suspension market
experienced a sharp decline in 2008, as the economic recession restricted consumer
spending.
15N732-18
4.45
4.50
4.55
4.60
2006 2008 2010 2012 2014 2016
Un
its (
Mil
lio
n)
94
96
98
100
Reven
ues (
$ M
illi
on
s)
Beginning in 2009, this market was expected to return to the growth state it enjoyed prior to 2008,
due to economic recovery and a return of consumer spending.

Relevant information from Frost and Sullivan’s Vehicle Modification Study
• Suspension modification rose from 32% to 48% • 61% classify their skill set as “advanced”• 90% modify their vehicles for performance• 56% define themselves as light truck/SUV enthusiasts
• 82% spend $1,000 to $5,000+ on total vehicle modifications
• 51% purchase performance parts from an automotive retailer
• 46% purchase from a custom/speed shop
Source: Frost & Sullivan.
16N732-18
• 64% of modifications are DIY • 52% of modifications are performed on Luxury/Specialty
vehicles• 51% of modifications are performed on SUVs or CUVs
• 30% plan to modify a Chevrolet or Ford vehicle for their next vehicle
• 44% plan to modify a vehicle model year of 2008 or newer

Strategic Recommendations
17
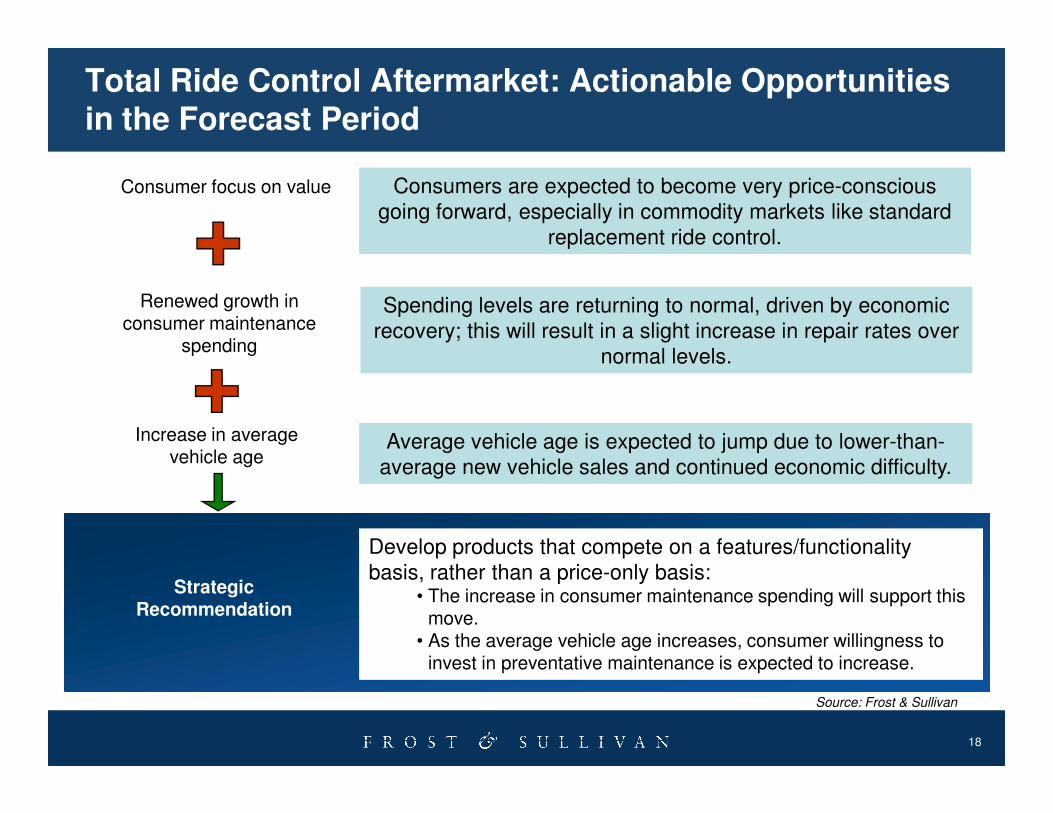
Total Ride Control Aftermarket: Actionable Opportunities in the Forecast Period
Renewed growth in consumer maintenance
spending
Consumer focus on value Consumers are expected to become very price-conscious going forward, especially in commodity markets like standard
replacement ride control.
Spending levels are returning to normal, driven by economic recovery; this will result in a slight increase in repair rates over
normal levels.
18
Increase in average vehicle age
Strategic Recommendation
Average vehicle age is expected to jump due to lower-than-average new vehicle sales and continued economic difficulty.
Develop products that compete on a features/functionality basis, rather than a price-only basis:
• The increase in consumer maintenance spending will support this move.
• As the average vehicle age increases, consumer willingness to invest in preventative maintenance is expected to increase.
Source: Frost & Sullivan

Total Ride Control Aftermarket: Actionable Challenges in the Forecast Period
Serious lack of consumer education
Vehicle population shifting
Imported products competing on a price basis
Imported products that compete in the standard replacement market can create downward price pressure on other
competitors.
Consumer education about the impact of ride control equipment on vehicle safety and comfort has historically been
lacking.
The dramatic jump in fuel prices in mid-2008 began a trend of vehicle downsizing. The result will be a larger proportion of
19
Vehicle population shifting towards passenger cars
Strategic Recommendation
vehicle downsizing. The result will be a larger proportion of passenger cars in the key replacement age range near the end
of the forecast period.
Adjust product line to deliver suitable applications for the vehicles forecast to enter the target replacement age:
• Offer value-added features and functionality • Capitalize on the manufacturer’s reputation for quality through
extended warranty support for entry-level products• Launch aggressive consumer education campaigns, both on-
location and through social media and internet outlets
Source: Frost & Sullivan
Next Steps
� Request a proposal for or Growth Partnership Services or Growth Consulting Services to support you and your team to accelerate the growth of your company. ([email protected]) 1-877-GoFrost (1-877-463-7678)
� Join us at our annual Growth, Innovation, and Leadership 2011: A Frost & Sullivan Global Congress on Corporate Growth (www.gil-global.com)
20
� Register for the next Chairman’s Series on Growth: Driving Innovation – The What, Why & How of Visions and Benchmarks
(December 20, 2010) (http://www.frost.com/growth)
� Register for Frost & Sullivan’s Growth Opportunity Newsletter and keepabreast of innovative growth opportunities(www.frost.com/news)

Your Feedback is Important to Us
Growth Forecasts?
Competitive Structure?
What would you like to see from Frost & Sullivan?
21
Emerging Trends?
Strategic Recommendations?
Other?
Please inform us by taking our survey.
Frost & Sullivan’s Growth Consulting can assist with your growth strategies

Follow Frost & Sullivan on Facebook, LinkedIn, SlideShare, and Twitter
http://www.facebook.com/pages/Frost-Sullivan/249995031751?ref=ts
http://www.linkedin.com/companies/4506
22
http://twitter.com/frost_sullivan
http://www.linkedin.com/companies/4506
http://www.slideshare.net/FrostandSullivan

For Additional Information
Sarah Saatzer
Corporate Communications
(210) 477-8427
Craig Hays
Director of Sales
Automotive & Transportation
(210) 247-2460
23
Mary-Beth Kellenberger
Global Program Manager
Automotive & Transportation
(416) 490-1997