the nox budget trading program: 2008 emission, … · format using google earth or a similar...
TRANSCRIPT

T he NOx Budget Trading Program (NBP) was a mar-ket-based cap and trade program created to reduce the regional transport of emissions of nitrogen
oxides (NOx) from power plants and other large combus-tion sources that contribute to ozone nonattainment in the eastern United States. NOx is a major precursor to the formation of ground-level ozone, a pervasive air pollution problem in many areas in the East. The NBP was designed to reduce NOx emissions during the warm summer months, referred to as the ozone season, when ground-level ozone concentrations are highest. In 2009, the NBP was replaced by the Clean Air Interstate Rule (CAIR) NOx ozone season program, which started requiring emission reductions from affected sources in an expanded geographic area on May 1, 2009.
Over the next few months, the U.S. EPA will release sev-eral reports summarizing progress under the NBP. The first report in this four-part series, released in May, pre-sented 2008 data on emission reductions, compliance re-sults, and NOx allowance prices. This is the second report in the series, and it further evaluates progress under the NBP in 2008 by analyzing emission reductions, reviewing compliance results, investigating factors affecting market price, and exploring control options used by sources. For more information on the NBP, please visit: <http://www.epa.gov/airmarkets/progsregs/nox/sip.html>. Detailed emission results and other facility and allowance data are also publicly available on EPA’s Data and Maps Web site at <http://camddataandmaps.epa.gov/gdm>. To view emis-sion and other facility information in an interactive file format using Google Earth or a similar three-dimensional platform, go to <http://www.epa.gov/airmarkets/prog-ress/interactivemapping.html>.
Overview of the NOx Budget Trading Program: Market-based Emission Reductions The NOx State Implementation Plan (SIP) Call, promulgat-ed in 1998, was designed to address the problem of ozone transport across the eastern United States. It required states to reduce ozone season NOx emissions that contrib-ute to ozone nonattainment in other states. EPA created a cap and trade program, the NBP, as a cost-effective alter-
At a Glance: NBP Results in 2008
Ozone Season Emissions: 481,420 tons
• 9% below 2008 cap
• 62% lower than in 2000 (before implementation of the NBP)
75% low• er than in 1990 (before implementation of the 1990 Clean Air Act Amendments)
Compliance: Nearly 100%
Only 2 uni• ts out of a total 2,568 units were out of compliance by a total of 63 tons
Continues tr• end of near-perfect compliance since start of program in 2003
Controls: 70% of NBP units have NOx controls
Emission • rates for all units have dropped by 45% since 2003
Emission rates for• units without controls have dropped by over 50% since 2003
Allowances: Prices and activity are down but there is still a substantial bank and an active market
28% price decline in 2008, from an average price of • $825/ton in January to $592/ton in November
275,367 un• used NBP allowances transferred for fu-ture use under the Clean Air Interstate Rule (CAIR)
July 2009
native to achieve the required reductions. All 20 affected states and the District of Columbia (DC) chose to meet mandatory NOx SIP Call reductions primarily through par-ticipation in the NBP.
Over the past six ozone seasons, the NBP significantly low-ered NOx emissions from affected sources, contributing to improvements in regional air quality across the Midwest, Northeast, and Mid-Atlantic.
Cap and trade programs such as the NBP and the Acid Rain Program (ARP) set a cap on overall regional emissions and allocate allowances to each affected source. Each allow-
The NOx Budget Trading Program:2008 Emission, Compliance, and Market Analyses

2
The NOx Budget Trading Program: 2008 Emission, Compliance, and Market Analyses
ance authorizes a certain number of emissions – in this case, one ton. This approach provides individual sources with flexibility in complying with emission limits. Sources may sell or bank (save) excess allowances if they reduce emissions and have more allowances than they need, or purchase allowances if they are unable to keep emissions within their allocated budget. As a group, the participating sources cannot exceed the cap. The cap level is intended to
Key Components of the NBP
The NBP was an ozone season (May 1 to September 30) cap and trade program for electric generating units (EGUs) and large industrial combustion sources, primar-ily boilers and turbines. The program had several impor-tant features:
Regionwide Cap:• The sum of state emission budgets that EPA established under the NOx SIP Call to help states meet their air quality goals to protect human health and the environment.Limited Allowances:• Authorizations to emit, known as allowances, were allocated to affected sources based on state trading budgets. The NOx allowance market enabled sources to trade (buy and sell) al-lowances throughout the year. Compliance Alternatives:• Sources could choose among several options to reduce NOx emissions, such as adding emission controls, replacing existing controls with more advanced technologies, optimiz-ing existing controls, or switching fuels.Stringent, Complete Monitoring: • To accurately monitor and report emissions, sources used continu-ous emission monitoring systems (CEMS) or other approved monitoring methods under EPA’s stringent monitoring requirements (40 CFR, Part 75). Compliance Determination:• At the end of every ozone season, each source had to surrender sufficient allowances to cover its ozone season NOx emissions (each allowance represents one ton of NOx emis-sions). This process is called annual reconciliation.Automatic Penalties:• If a source did not have enough allowances to cover its emissions, EPA automatically deducted allowances from the following year’s allo-cation at a 3:1 ratio. Units out of compliance in 2008 had to surrender 2009 CAIR NOx ozone season al-lowances.Allowance Market and Banking:• If a source had ex-cess allowances because it reduced emissions beyond required levels, it could sell the unused allowances or bank (save) them for use in a future ozone season. On January 1, 2009, EPA transferred NBP banked al-lowances for use under the CAIR NOx ozone season program.
protect public health and the environment and to sustain that protection into the future, regardless of growth in the affected sector. The cap also lends stability and predictabil-ity to the allowance trading market and provides regula-tory certainty to affected sources. Cap and trade programs like the NBP and the ARP have proven highly effective in reducing emissions from multiple sources, while meeting environmental goals, and improving human health.
Affected States and Compliance Dates
Compliance with the NOx SIP Call was scheduled to begin on May 1, 2003, for the full ozone season. However, litiga-tion delayed implementation for 12 states not previously in the Ozone Transport Commission’s (OTC) NOx Budget Pro-gram. The eight states previously in the OTC adopted the original compliance date of May 1, 2003, in transitioning to the NOx SIP Call (see Figure 1). These OTC states included Connecticut, Delaware, Maryland, Massachusetts, New Jer-sey, New York, Pennsylvania, and Rhode Island, as well as the District of Columbia.
Eleven states not previously in the OTC NOx Budget Pro-gram began compliance on May 31, 2004, one month into the normal ozone season. These states were Alabama, Il-linois, Indiana, Kentucky, Michigan, North Carolina, Ohio, South Carolina, Tennessee, Virginia, and West Virginia. Fi-nally, Missouri began compliance with the program on May 1, 2007.
May 1, 2003May 31, 2004May 1, 2007
Compliance Deadline
Figure 1: NOx SIP Call Program Implementation
Source: EPA, 2009

3
The NOx Budget Trading Program: 2008 Emission, Compliance, and Market Analyses
Only portions of Alabama, Michigan, and Missouri were af-fected by the program. In addition, Georgia was originally slated to begin compliance with the NBP in 2007 along with Missouri. However, on April 16, 2008, EPA finalized a rule to remove the requirements of the NOx SIP Call for Georgia in response to a petition, and Georgia never participated in the NBP.
Affected Units
There were 2,568 affected units under the NBP in 2008, including some units that may not have operated nor had emissions during the 2008 ozone season. For example, some units provide electricity only on peak demand days, and may not operate every year.
Most of the units in the NBP were electric generating units (EGUs), which are large boilers, turbines, and combined cycle units used to generate electricity for sale. Figure 2 shows that EGUs constituted 88 percent of all regulated NBP units. The program also applied to large industrial units that produce electricity or steam primarily for inter-nal use. Examples of these units were boilers and turbines at heavy manufacturing facilities, such as paper mills, pe-troleum refineries, and iron and steel production facilities. These units also included steam plants at institutional set-tings, such as large universities or hospitals. Additionally, some states included other categories of units, such as pe-troleum refinery process heaters and cement kilns.
States could also choose to allow individual sources that were not affected by the NBP to opt in to the trading pro-gram. Opt-ins were limited to fossil fuel combustion de-vices that vent all emissions through a stack and that met EPA’s stringent Part 75 emission monitoring requirements. Potential opt-in sources had to apply for a state NBP opt-in permit. If approved, these sources were issued opt-in al-lowances, which were in addition to the state’s base bud-get. In 2008, there were three states with five total opt-in units under the program.
Emission ReductionsEPA uses two baseline years for measuring progress under the program:
1990: This baseline represents emission levels before the implementation of the 1990 Clean Air Act Amend-ments.
2000: This baseline represents emission levels after the implementation of NOx regulatory programs under the 1990 Clean Air Act Amendments but before im-plementation of the NBP.
Figure 3: Ozone Season NOx Emissions from All NBP Sources
0
200
400
600
800
1,000
1,200
1,400
1,600
1,800
2,000
2,200
2008
Emis
sion
s (th
ousa
nd to
ns)
Ozone Season
1,924
1990
1,256
2000
849
2003
609
2004
549
2005
508
2006
506
2007
481
528
Total State Trading Budgets Ozone Season NOx Emissions
Notes: Data reflect full ozone season emissions in all years for all states. •The year 2000 baseline value has been adjusted to correct a mis-print in Figure 5 of the 2007 NBP report.The 2008 total state trading budgets include opt-in allowances, •where applicable (New York, Ohio, and West Virginia).
Source: EPA, 2009
Figure 2: Number of Units in the NBP by Type in 2008Unclassified EGUs 3 (<1%)
Gas EGUs1,098 (43%)
Industrial Units 319 (12%)
Coal EGUs715 (28%)
Oil EGUs433 (17%)
Notes: • The three “unclassified” units represent units in long-term shut-
down or other non-operating status that remained identified as affected units under the NBP and that had not retired prior to the 2008 ozone season.
• Percentages add up to more than 100 due to rounding. Source: EPA, 2009
4
The NOx Budget Trading Program: 2008 Emission, Compliance, and Market Analyses
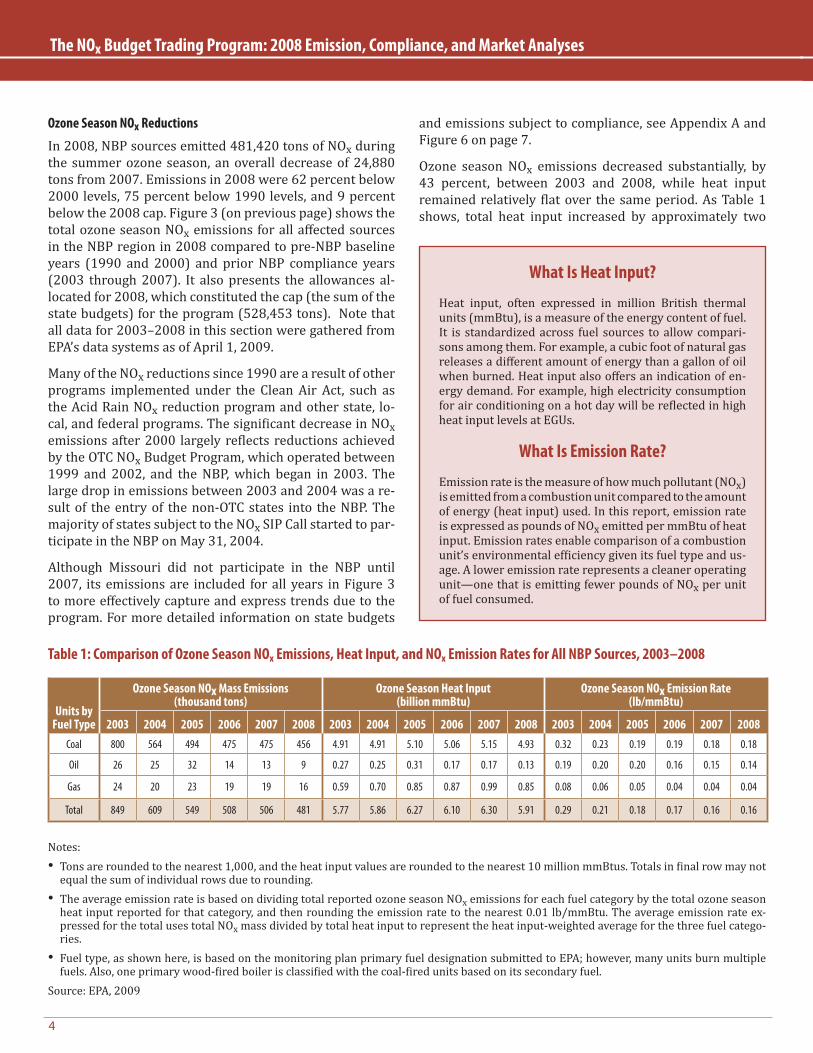
Units by Fuel Type
Ozone Season NOx Mass Emissions (thousand tons)
Ozone Season Heat Input (billion mmBtu)
Ozone Season NOx Emission Rate (lb/mmBtu)
2003 2004 2005 2006 2007 2008 2003 2004 2005 2006 2007 2008 2003 2004 2005 2006 2007 2008Coal 800 564 494 475 475 456 4.91 4.91 5.10 5.06 5.15 4.93 0.32 0.23 0.19 0.19 0.18 0.18
Oil 26 25 32 14 13 9 0.27 0.25 0.31 0.17 0.17 0.13 0.19 0.20 0.20 0.16 0.15 0.14
Gas 24 20 23 19 19 16 0.59 0.70 0.85 0.87 0.99 0.85 0.08 0.06 0.05 0.04 0.04 0.04
Total 849 609 549 508 506 481 5.77 5.86 6.27 6.10 6.30 5.91 0.29 0.21 0.18 0.17 0.16 0.16
Notes:Tons are rounded to the nearest 1,000, and the heat input values are rounded to the nearest 10 million mmBtus. Totals in final row may not •equal the sum of individual rows due to rounding.The average emission rate is based on dividing total reported ozone season NO• x emissions for each fuel category by the total ozone season heat input reported for that category, and then rounding the emission rate to the nearest 0.01 lb/mmBtu. The average emission rate ex-pressed for the total uses total NOx mass divided by total heat input to represent the heat input-weighted average for the three fuel catego-ries.Fuel type, as shown here, is based on the monitoring plan primary fuel designation submitted to EPA; however, many units burn multiple •fuels. Also, one primary wood-fired boiler is classified with the coal-fired units based on its secondary fuel.
Source: EPA, 2009
Table 1: Comparison of Ozone Season NOx Emissions, Heat Input, and NOx Emission Rates for All NBP Sources, 2003–2008
Ozone Season NOx Reductions
In 2008, NBP sources emitted 481,420 tons of NOx during the summer ozone season, an overall decrease of 24,880 tons from 2007. Emissions in 2008 were 62 percent below 2000 levels, 75 percent below 1990 levels, and 9 percent below the 2008 cap. Figure 3 (on previous page) shows the total ozone season NOx emissions for all affected sources in the NBP region in 2008 compared to pre-NBP baseline years (1990 and 2000) and prior NBP compliance years (2003 through 2007). It also presents the allowances al-located for 2008, which constituted the cap (the sum of the state budgets) for the program (528,453 tons). Note that all data for 2003–2008 in this section were gathered from EPA’s data systems as of April 1, 2009.
Many of the NOx reductions since 1990 are a result of other programs implemented under the Clean Air Act, such as the Acid Rain NOx reduction program and other state, lo-cal, and federal programs. The significant decrease in NOx emissions after 2000 largely reflects reductions achieved by the OTC NOx Budget Program, which operated between 1999 and 2002, and the NBP, which began in 2003. The large drop in emissions between 2003 and 2004 was a re-sult of the entry of the non-OTC states into the NBP. The majority of states subject to the NOx SIP Call started to par-ticipate in the NBP on May 31, 2004.
Although Missouri did not participate in the NBP until 2007, its emissions are included for all years in Figure 3 to more effectively capture and express trends due to the program. For more detailed information on state budgets
What Is Heat Input?
Heat input, often expressed in million British thermal units (mmBtu), is a measure of the energy content of fuel. It is standardized across fuel sources to allow compari-sons among them. For example, a cubic foot of natural gas releases a different amount of energy than a gallon of oil when burned. Heat input also offers an indication of en-ergy demand. For example, high electricity consumption for air conditioning on a hot day will be reflected in high heat input levels at EGUs.
What Is Emission Rate?
Emission rate is the measure of how much pollutant (NOx) is emitted from a combustion unit compared to the amount of energy (heat input) used. In this report, emission rate is expressed as pounds of NOx emitted per mmBtu of heat input. Emission rates enable comparison of a combustion unit’s environmental efficiency given its fuel type and us-age. A lower emission rate represents a cleaner operating unit—one that is emitting fewer pounds of NOx per unit of fuel consumed.
and emissions subject to compliance, see Appendix A and Figure 6 on page 7.
Ozone season NOx emissions decreased substantially, by 43 percent, between 2003 and 2008, while heat input remained relatively flat over the same period. As Table 1 shows, total heat input increased by approximately two
5
The NOx Budget Trading Program: 2008 Emission, Compliance, and Market Analyses
percent from 2003 to 2008, with gas-fired units primar-ily responsible for this growth in heat input. Furthermore, the average NOx emission rate for all units remained stable between 2007 and 2008, maintaining the 45 percent over-all drop in emission rate since the program began in 2003. Because heat input has not significantly changed since the start of the program, other factors, such as fuel choice and added NOx controls, have contributed to this improve-ment.
Table 1 shows that between 2007 and 2008, ozone season emissions decreased for all fuel types, primarily reflecting a six percent decline in 2008 ozone season heat input.
State-by-State NOx Reductions
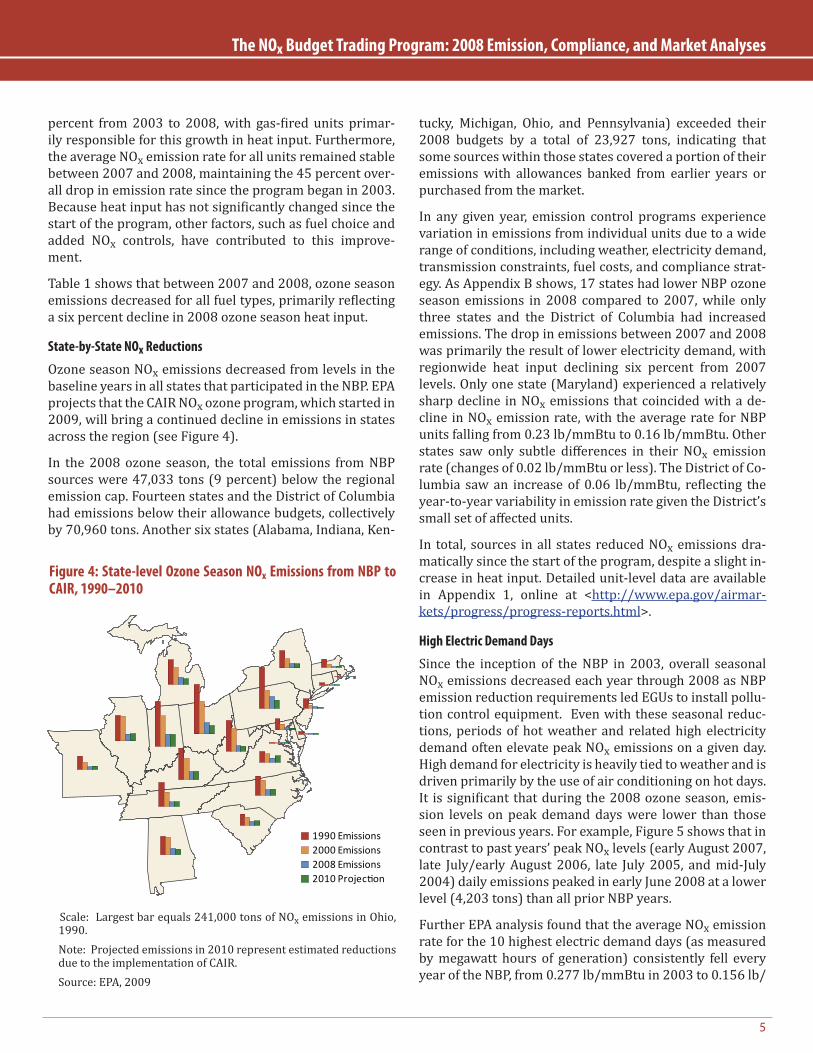
Ozone season NOx emissions decreased from levels in the baseline years in all states that participated in the NBP. EPA projects that the CAIR NOx ozone program, which started in 2009, will bring a continued decline in emissions in states across the region (see Figure 4).
In the 2008 ozone season, the total emissions from NBP sources were 47,033 tons (9 percent) below the regional emission cap. Fourteen states and the District of Columbia had emissions below their allowance budgets, collectively by 70,960 tons. Another six states (Alabama, Indiana, Ken-
Figure 4: State-level Ozone Season NOx Emissions from NBP to CAIR, 1990–2010
Scale: Largest bar equals 241,000 tons of NOx emissions in Ohio, 1990.Note: Projected emissions in 2010 represent estimated reductions due to the implementation of CAIR.Source: EPA, 2009
1990 Emissions2000 Emissions2008 Emissions2010 Projection
tucky, Michigan, Ohio, and Pennsylvania) exceeded their 2008 budgets by a total of 23,927 tons, indicating that some sources within those states covered a portion of their emissions with allowances banked from earlier years or purchased from the market.
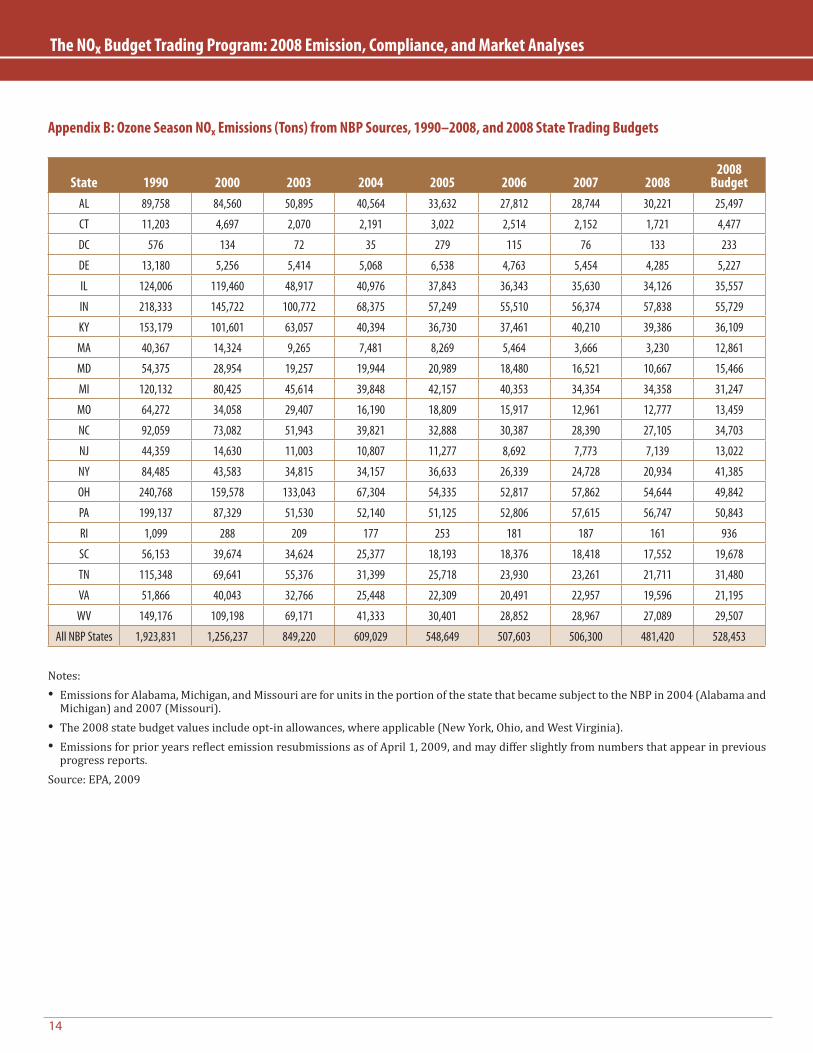
In any given year, emission control programs experience variation in emissions from individual units due to a wide range of conditions, including weather, electricity demand, transmission constraints, fuel costs, and compliance strat-egy. As Appendix B shows, 17 states had lower NBP ozone season emissions in 2008 compared to 2007, while only three states and the District of Columbia had increased emissions. The drop in emissions between 2007 and 2008 was primarily the result of lower electricity demand, with regionwide heat input declining six percent from 2007 levels. Only one state (Maryland) experienced a relatively sharp decline in NOx emissions that coincided with a de-cline in NOx emission rate, with the average rate for NBP units falling from 0.23 lb/mmBtu to 0.16 lb/mmBtu. Other states saw only subtle differences in their NOx emission rate (changes of 0.02 lb/mmBtu or less). The District of Co-lumbia saw an increase of 0.06 lb/mmBtu, reflecting the year-to-year variability in emission rate given the District’s small set of affected units.
In total, sources in all states reduced NOx emissions dra-matically since the start of the program, despite a slight in-crease in heat input. Detailed unit-level data are available in Appendix 1, online at <http://www.epa.gov/airmar-kets/progress/progress-reports.html>.
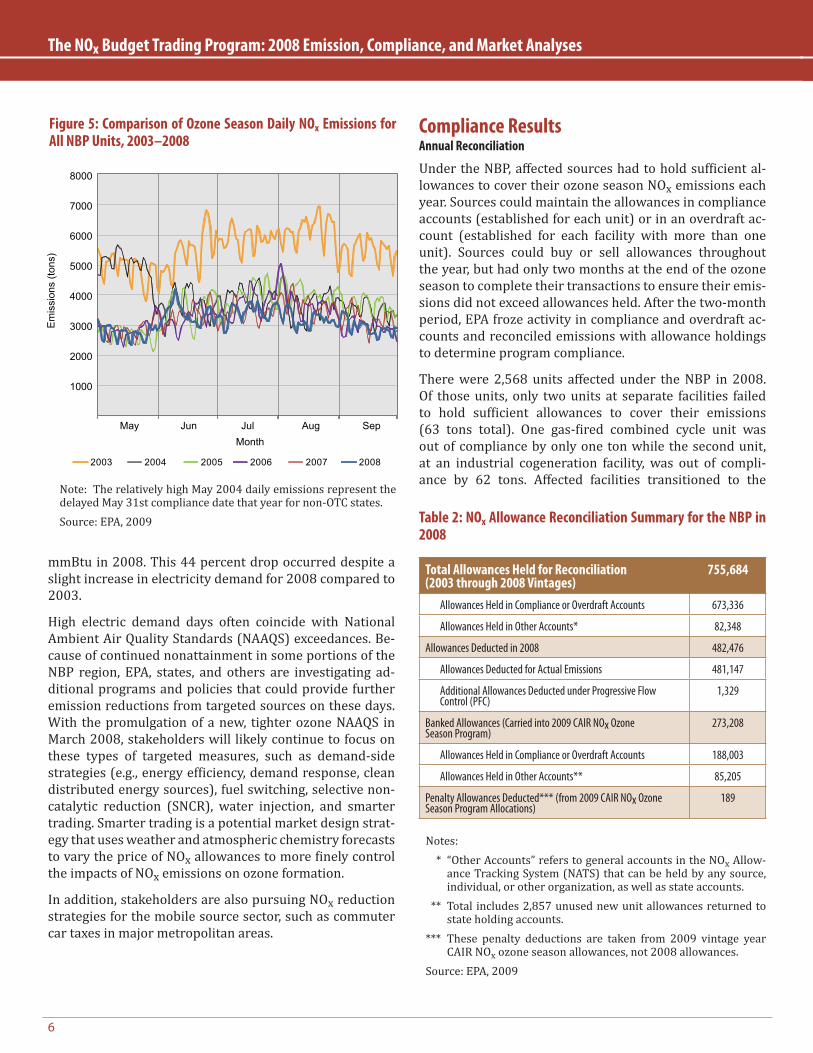
High Electric Demand Days
Since the inception of the NBP in 2003, overall seasonal NOx emissions decreased each year through 2008 as NBP emission reduction requirements led EGUs to install pollu-tion control equipment. Even with these seasonal reduc-tions, periods of hot weather and related high electricity demand often elevate peak NOx emissions on a given day. High demand for electricity is heavily tied to weather and is driven primarily by the use of air conditioning on hot days. It is significant that during the 2008 ozone season, emis-sion levels on peak demand days were lower than those seen in previous years. For example, Figure 5 shows that in contrast to past years’ peak NOx levels (early August 2007, late July/early August 2006, late July 2005, and mid-July 2004) daily emissions peaked in early June 2008 at a lower level (4,203 tons) than all prior NBP years.
Further EPA analysis found that the average NOx emission rate for the 10 highest electric demand days (as measured by megawatt hours of generation) consistently fell every year of the NBP, from 0.277 lb/mmBtu in 2003 to 0.156 lb/
6
The NOx Budget Trading Program: 2008 Emission, Compliance, and Market Analyses
mmBtu in 2008. This 44 percent drop occurred despite a slight increase in electricity demand for 2008 compared to 2003.
High electric demand days often coincide with National Ambient Air Quality Standards (NAAQS) exceedances. Be-cause of continued nonattainment in some portions of the NBP region, EPA, states, and others are investigating ad-ditional programs and policies that could provide further emission reductions from targeted sources on these days. With the promulgation of a new, tighter ozone NAAQS in March 2008, stakeholders will likely continue to focus on these types of targeted measures, such as demand-side strategies (e.g., energy efficiency, demand response, clean distributed energy sources), fuel switching, selective non-catalytic reduction (SNCR), water injection, and smarter trading. Smarter trading is a potential market design strat-egy that uses weather and atmospheric chemistry forecasts to vary the price of NOx allowances to more finely control the impacts of NOx emissions on ozone formation.
In addition, stakeholders are also pursuing NOx reduction strategies for the mobile source sector, such as commuter car taxes in major metropolitan areas.
Compliance ResultsAnnual Reconciliation
Under the NBP, affected sources had to hold sufficient al-lowances to cover their ozone season NOx emissions each year. Sources could maintain the allowances in compliance accounts (established for each unit) or in an overdraft ac-count (established for each facility with more than one unit). Sources could buy or sell allowances throughout the year, but had only two months at the end of the ozone season to complete their transactions to ensure their emis-sions did not exceed allowances held. After the two-month period, EPA froze activity in compliance and overdraft ac-counts and reconciled emissions with allowance holdings to determine program compliance.
There were 2,568 units affected under the NBP in 2008. Of those units, only two units at separate facilities failed to hold sufficient allowances to cover their emissions (63 tons total). One gas-fired combined cycle unit was out of compliance by only one ton while the second unit, at an industrial cogeneration facility, was out of compli-ance by 62 tons. Affected facilities transitioned to the
Figure 5: Comparison of Ozone Season Daily NOx Emissions for All NBP Units, 2003–2008
Note: The relatively high May 2004 daily emissions represent the delayed May 31st compliance date that year for non-OTC states.Source: EPA, 2009 Table 2: NOx Allowance Reconciliation Summary for the NBP in
2008
Total Allowances Held for Reconciliation (2003 through 2008 Vintages)
755,684
Allowances Held in Compliance or Overdraft Accounts 673,336
Allowances Held in Other Accounts* 82,348
Allowances Deducted in 2008 482,476
Allowances Deducted for Actual Emissions 481,147
Additional Allowances Deducted under Progressive Flow Control (PFC)
1,329
Banked Allowances (Carried into 2009 CAIR NOx Ozone Season Program)
273,208
Allowances Held in Compliance or Overdraft Accounts 188,003
Allowances Held in Other Accounts** 85,205
Penalty Allowances Deducted*** (from 2009 CAIR NOx Ozone Season Program Allocations)
189
Notes: * “Other Accounts” refers to general accounts in the NOx Allow-
ance Tracking System (NATS) that can be held by any source, individual, or other organization, as well as state accounts.
** Total includes 2,857 unused new unit allowances returned to state holding accounts.
*** These penalty deductions are taken from 2009 vintage year CAIR NOx ozone season allowances, not 2008 allowances.
Source: EPA, 2009
Em
issi
ons
(tons
)
1000
2000
3000
4000
5000
6000
7000
8000
May Jun Jul Aug SepMonth
2003 2004 2005 2006 2007 2008
7
The NOx Budget Trading Program: 2008 Emission, Compliance, and Market Analyses
CAIR NOx ozone season program on May 1, 2009. Accord-ingly, the two units out of compliance automatically sur-rendered first year (2009) CAIR NOx ozone season pro-gram allowances on a 3:1 basis, or 189 allowances total. Table 2 (on page 6) summarizes the allowance reconcilia-tion process for 2008, and the textbox on this page provides details on how reported emissions for the 2008 ozone sea-son translated into allowances deducted for those emis-sions.
Banking in 2008
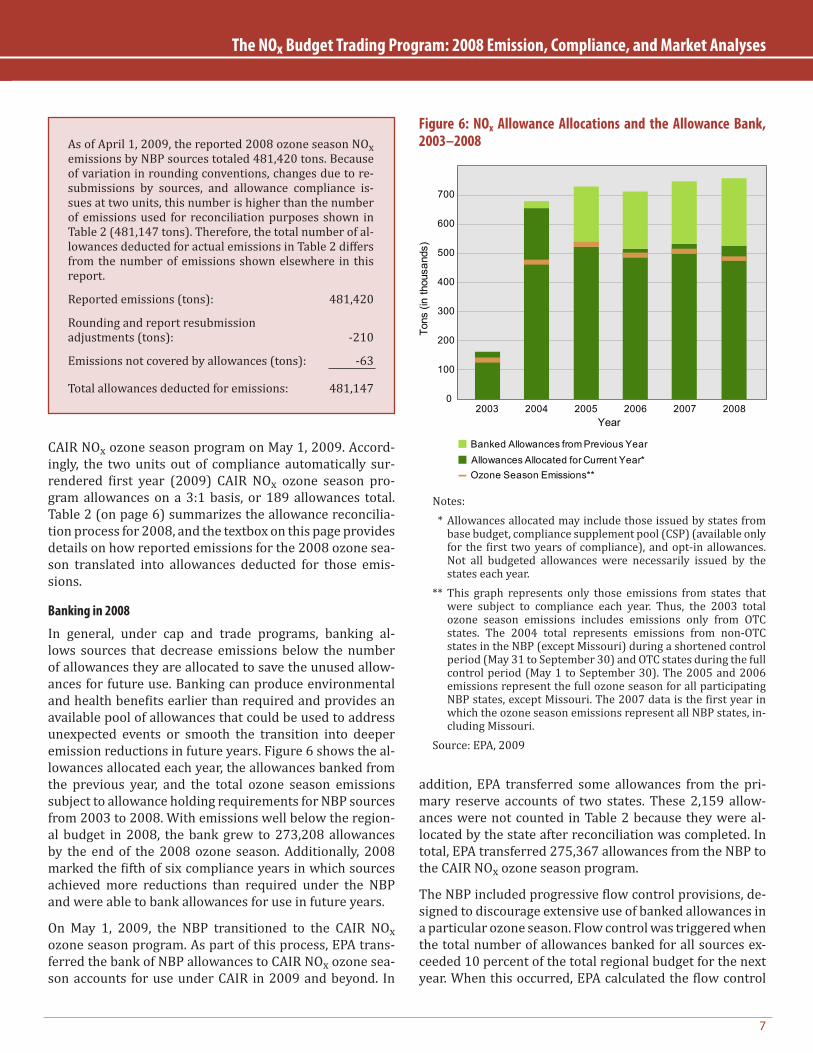
In general, under cap and trade programs, banking al-lows sources that decrease emissions below the number of allowances they are allocated to save the unused allow-ances for future use. Banking can produce environmental and health benefits earlier than required and provides an available pool of allowances that could be used to address unexpected events or smooth the transition into deeper emission reductions in future years. Figure 6 shows the al-lowances allocated each year, the allowances banked from the previous year, and the total ozone season emissions subject to allowance holding requirements for NBP sources from 2003 to 2008. With emissions well below the region-al budget in 2008, the bank grew to 273,208 allowances by the end of the 2008 ozone season. Additionally, 2008 marked the fifth of six compliance years in which sources achieved more reductions than required under the NBP and were able to bank allowances for use in future years.
On May 1, 2009, the NBP transitioned to the CAIR NOx ozone season program. As part of this process, EPA trans-ferred the bank of NBP allowances to CAIR NOx ozone sea-son accounts for use under CAIR in 2009 and beyond. In
As of April 1, 2009, the reported 2008 ozone season NOx emissions by NBP sources totaled 481,420 tons. Because of variation in rounding conventions, changes due to re-submissions by sources, and allowance compliance is-sues at two units, this number is higher than the number of emissions used for reconciliation purposes shown in Table 2 (481,147 tons). Therefore, the total number of al-lowances deducted for actual emissions in Table 2 differs from the number of emissions shown elsewhere in this report.
Reported emissions (tons): 481,420
Rounding and report resubmission adjustments (tons): -210
Emissions not covered by allowances (tons): -63
Total allowances deducted for emissions: 481,147
Notes: * Allowances allocated may include those issued by states from
base budget, compliance supplement pool (CSP) (available only for the first two years of compliance), and opt-in allowances. Not all budgeted allowances were necessarily issued by the states each year.
** This graph represents only those emissions from states that were subject to compliance each year. Thus, the 2003 total ozone season emissions includes emissions only from OTC states. The 2004 total represents emissions from non-OTC states in the NBP (except Missouri) during a shortened control period (May 31 to September 30) and OTC states during the full control period (May 1 to September 30). The 2005 and 2006 emissions represent the full ozone season for all participating NBP states, except Missouri. The 2007 data is the first year in which the ozone season emissions represent all NBP states, in-cluding Missouri.
Source: EPA, 2009
Figure 6: NOx Allowance Allocations and the Allowance Bank, 2003–2008
0
100
200
300
400
500
600
700
Tons
(in
thou
sand
s)
Banked Allowances from Previous YearAllowances Allocated for Current Year*Ozone Season Emissions**
Year2003 2004 2005 2006 2007 2008
addition, EPA transferred some allowances from the pri-mary reserve accounts of two states. These 2,159 allow-ances were not counted in Table 2 because they were al-located by the state after reconciliation was completed. In total, EPA transferred 275,367 allowances from the NBP to the CAIR NOx ozone season program.
The NBP included progressive flow control provisions, de-signed to discourage extensive use of banked allowances in a particular ozone season. Flow control was triggered when the total number of allowances banked for all sources ex-ceeded 10 percent of the total regional budget for the next year. When this occurred, EPA calculated the flow control
8
The NOx Budget Trading Program: 2008 Emission, Compliance, and Market Analyses
ratio by dividing 10 percent of the total regional NOx trad-ing budget by the number of banked allowances (a larger bank thus resulted in a lower flow control ratio). The flow control ratio established the percentage of banked allow-ances that could be deducted from a source’s account on a 1:1 ratio of one allowance per ton of emissions. The re-maining banked allowances, if used, had to be deducted at a 2:1 ratio of two allowances per one ton of emissions. In 2008, the flow control ratio was 0.22, and 1,329 additional allowances were deducted from the allowance bank under the flow control provisions.
Flow control, however, will no longer apply in 2009 and be-yond with the transition to CAIR. Thus, the transferred NBP allowances may be used under CAIR with no restrictions or time limits on a straight 1:1 basis.
Continuous Emission Monitoring Systems Accurate and consistent emissions monitoring is the foun-dation of a cap and trade system. EPA has developed de-tailed procedures (40 CFR Part 75) to ensure that sources monitor and report emissions with a high degree of pre-cision, accuracy, reliability, and consistency. Sources use continuous emission monitoring systems (CEMS) or other approved methods. Part 75 requires sources to conduct stringent quality assurance tests of their monitoring sys-tems, such as daily and quarterly calibration tests and a semiannual or annual relative accuracy test audit. These tests ensure that sources report accurate data and provide assurance to market participants that a ton of emissions measured at one facility is equivalent to a ton measured at a different facility.
While many NBP units with low levels of emissions did not have to use CEMS, the vast majority—over 99 percent—of the NOx emissions under the NBP were measured by CEMS. Coal-fired units were required to use CEMS for NOx con-centration and stack gas flow rate (and if needed, a diluent carbon dioxide or oxygen gas monitor and stack gas mois-ture measurement) to calculate and record their NOx mass emissions. Oil-fired and gas-fired units could use a NOx CEMS in conjunction with a fuel flowmeter to determine NOx mass emissions. Alternatively, for oil-fired and gas-fired units that either operated infrequently or had very low NOx emissions, Part 75 provided low-cost alternatives for NBP sources to conservatively estimate NOx mass emis-sions.
In all, about 70 percent of NBP units used CEMS in 2008, including 100 percent of coal-fired units, 66 percent of gas-fired units, and 28 percent of oil-fired units. The relatively low percentage for oil-fired units was consistent with the
decline in oil-fired heat input, as most of these units were used infrequently and qualified for reduced monitoring.
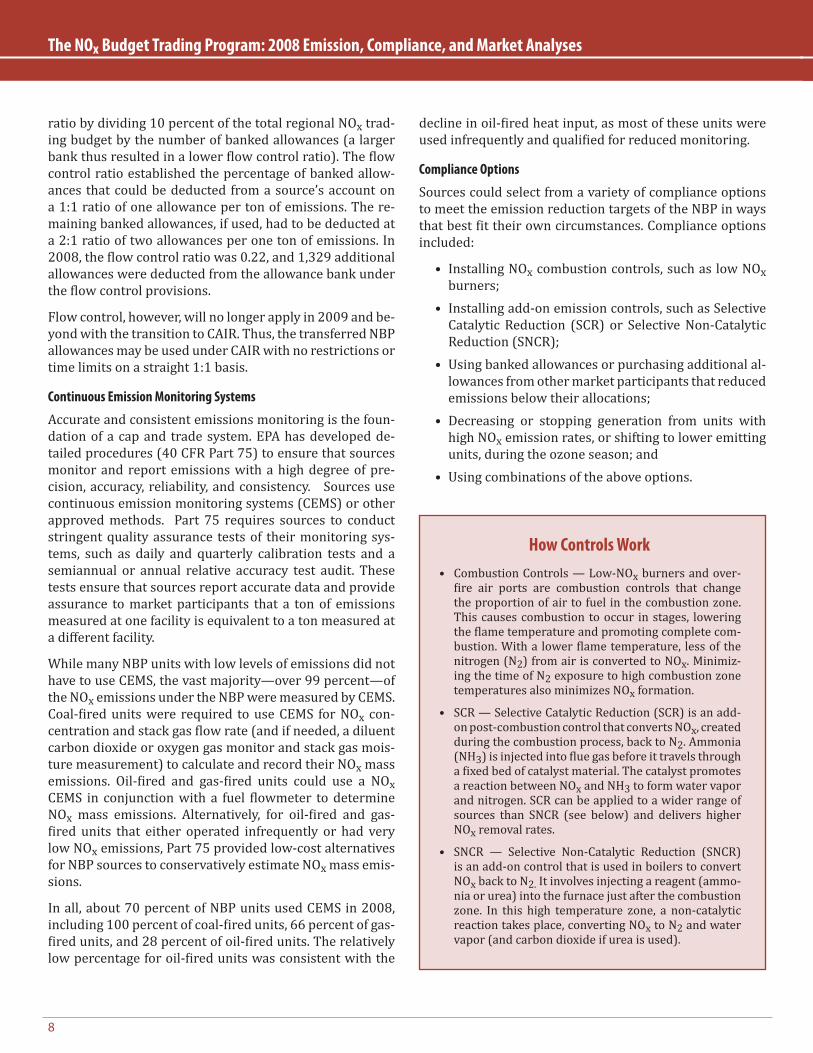
Compliance Options
Sources could select from a variety of compliance options to meet the emission reduction targets of the NBP in ways that best fit their own circumstances. Compliance options included:
• Installing NOx combustion controls, such as low NOx burners;
• Installing add-on emission controls, such as Selective Catalytic Reduction (SCR) or Selective Non-Catalytic Reduction (SNCR);
• Using banked allowances or purchasing additional al-lowances from other market participants that reduced emissions below their allocations;
• Decreasing or stopping generation from units with high NOx emission rates, or shifting to lower emitting units, during the ozone season; and
• Using combinations of the above options.
How Controls Work • Combustion Controls — Low-NOx burners and over-
fire air ports are combustion controls that change the proportion of air to fuel in the combustion zone. This causes combustion to occur in stages, lowering the flame temperature and promoting complete com-bustion. With a lower flame temperature, less of the nitrogen (N2) from air is converted to NOx. Minimiz-ing the time of N2 exposure to high combustion zone temperatures also minimizes NOx formation.
• SCR — Selective Catalytic Reduction (SCR) is an add-on post-combustion control that converts NOx, created during the combustion process, back to N2. Ammonia (NH3) is injected into flue gas before it travels through a fixed bed of catalyst material. The catalyst promotes a reaction between NOx and NH3 to form water vapor and nitrogen. SCR can be applied to a wider range of sources than SNCR (see below) and delivers higher NOx removal rates.
• SNCR — Selective Non-Catalytic Reduction (SNCR) is an add-on control that is used in boilers to convert NOx back to N2. It involves injecting a reagent (ammo-nia or urea) into the furnace just after the combustion zone. In this high temperature zone, a non-catalytic reaction takes place, converting NOx to N2 and water vapor (and carbon dioxide if urea is used).

9
The NOx Budget Trading Program: 2008 Emission, Compliance, and Market Analyses
NOx Controls in 2008
Of the 2,563 units that operated in 2008 (out of a total of 2,568 affected units), approximately 30 percent were non-controlled (see Table 3), a share that has remained stable since the start of the program in 2003. As Figure 7 shows, however, the average ozone season NOx emission rate for all non-controlled units dropped dramatically, by over 50 percent, from 0.425 lb/mmBtu in 2003 to 0.211 lb/mmBtu in 2008. The following section presents results from an EPA examination of this striking drop in emission rate among non-controlled units.
The group of non-controlled units in the NBP included coal-, oil-, and gas-fired units. While the overall number of units did not change significantly from 2003 to 2008, the fuel mix shifted, primarily from coal to gas. Figure 7 illus-trates this trend as the number of non-controlled coal-fired units dropped by 34 percent, from 182 units in 2003 to 120 in 2008, while gas units increased by 17 percent, from 261 to 306.
Further evidence of this shift can be seen in the trends in heat input, a measure of fuel consumption indicating how intensely various units are operating. As Figure 7 indicates, ozone season heat input for non-controlled coal units de-creased significantly since the start of the program. In 2003, coal made up 68 percent of non-controlled heat input; by 2008 that share had dropped below 50 percent. During this same period, oil usage also fell by over 50 percent. The drop in utilization of coal and oil units was made up by gas, which experienced a 65 percent increase in heat input be-tween 2003 and 2008, with gas accounting for nearly 40 percent of the non-controlled heat input in 2008. Because the NOx emission rate of gas units without any controls is considerably lower than coal or oil, this fuel switching ac-counts for much of the improvement (lower emission rate) in the non-controlled units as a group.
Fuel switching, however, does not entirely explain the drop, given that the improvement in NOx emission rate holds across all three fuel types (see Figure 7). One of the as-
Table 3: NBP Operating Units by Control Type in 2008
Control Type Number of Units Percent of Total
Non-controlled 762 30%
Combustion 803 31%
SCR 435 17%
SNCR 101 4%
Other Control 462 18%
Figure 7: Summary Ozone Season Data, 2003–2008
Source: EPA, 2009
Source: EPA, 2009
Coal Units Oil Units Gas Units All Units
2003 2004 2005 2006 2007 2008
Hea
t Inp
ut (b
illio
n m
mB
tu) 0.50
0.40
0.30
0.20
0.10
2003 2004 2005 2006 2007 2008
Em
issi
on R
ate
(lb/m
mB
tu)
0.50
0.40
0.30
0.20
0.10
0.60NOx Rate for Non-Controlled Units
2003 2004 2005 2006 2007 2008
Uni
ts
40035030025020015010050
Number of Non-Controlled Units
Heat Input for Non-Controlled Units
100
80
60
40
20
120
140
2003 2004 2005 2006 2007 2008
NOx Mass for Non-Controlled Units
Em
issi
ons
(thou
sand
tons
)

10
The NOx Budget Trading Program: 2008 Emission, Compliance, and Market Analyses
sumptions that underlies cap and trade programs is that the “dirtiest” units are more likely to either be retired, used less often, or be retrofitted with controls. Out of the 132 NBP units that retired since 2003, 91 were non-controlled, and 33 of those were coal-fired boilers with decades of ser-vice stretching as far back as the end of World War II. EPA examined whether the assumption about the dirtiest units holds true for the NBP by comparing the performance of the 33 retired, non-controlled, coal-fired units to similar units that stayed in service.
The 2003 ozone season NOx rate for the 33 coal-fired units that retired was 0.797 lb/mmBtu. These units were dirtier than average, and had a considerably higher emission rate compared with the average 2003 emission rate of 0.538 lb/mmBtu for the group of all 182 non-controlled, coal-fired units (see Figure 8). Also, by the end of the NBP, not only had 33 of the coal-fired units retired, an additional 41 units were retrofitted with NOx controls. After ranking the non-controlled, coal-fired units by their 2003 NOx emission rates, EPA found that nine of the top ten least efficient units either retired or added controls by 2008. With the less ef-ficient units taken out of service each year and the addition of controls on many of the remaining units, the NOx emis-sion rate for this group of units fell 40 percent from 2003 to 2008.
In conclusion, sources in a cap and trade program may take a variety of measures to meet compliance obligations, including fuel switching, retiring less efficient units, and adding controls. This examination of non-controlled units demonstrates that all three strategies were at work in the NBP.
Note: Prompt vintage is the vintage for the “current” compliance year. For example, 2008 vintage allowances were considered the prompt vintage until the true-up period closed at the end of No-vember 2008.Source: CantorCO2e’s Market Price Indicator (MPI), 2009; see <www.emissionstrading.com>
Figure 9: NOx Allowance Spot Price (Prompt Vintage), January 2008–November 2008
$0 $100 $200 $300 $400 $500 $600 $700 $800 $900
$1,000 $1,100 $1,200 $1,300 $1,400 $1,500
Nom
inal
Pric
e ($
/ton)
JanDate
Feb Mar Apr May Jun Jul Aug Sep Oct Nov
Figure 8: Comparison of Ozone Season NOx Emission Rate for Re-tired versus Active Non-Controlled Coal Units, 2003–2008
Note: Non-controlled coal units that retired by 2008 did not report emissions in 2008.Source: EPA, 2009
Market ActivityNOx Allowance Prices
The 2008 NOx allowance market experienced a 28 percent price decline—beginning the year at $825 per ton in Janu-ary and climbing as high as $1,413 during the middle of the year before falling to a period-end closing price in Novem-ber of $592 per ton (see Figure 9).
In 2008, the final year of the NBP before CAIR went into effect, NBP emissions were 5 percent below 2007 levels. Not surprisingly, the downward tendency of allowance prices that occurred from 2003 to 2007 continued into 2008 (although there was a sharp price spike in August following the court decision to vacate CAIR). During the ozone season, NBP sources emitted 47,033 tons fewer than their overall budget, and the allowance bank increased to 273,208. This increase contributed to the lower allowance prices. These banked allowances have been converted to CAIR NOx ozone season allowances as of January 1, 2009 and will be available for compliance purposes under CAIR.
In a cap and trade program, sources may purchase allow-ances as part of their compliance strategy. Because abate-ment costs are not the same for all sources, the flexibility offered by cap and trade programs (e.g., choice of controls, efficiency, buy/sell/bank allowances) allows sources to achieve emission targets at a lower cost than through a command and control program. By allowing sources to buy, sell, and bank allowances in order to comply with the
Non-Controlled Coal Units that Retired by 2008All Non-Controlled Coal Units
2003 2004 2005 2006 2007 2008
Ave
rage
NO
x R
ate
0.700.600.500.400.300.200.10
0.800.90

11
The NOx Budget Trading Program: 2008 Emission, Compliance, and Market Analyses
program’s emission reduction requirements, a market for emission allowances can emerge, and the allowance price should ultimately reflect the marginal cost of emission reductions. Emission control decisions can then be made based on the cost of control options relative to the market price of allowances. The allowance price motivates those who can reduce their facility’s emissions at a relatively low cost to make those investments and then sell their surplus allowances to those with higher marginal reduction costs.
Looking ahead to the CAIR NOx allowance markets (ozone season and annual), it is EPA’s expectation that the CAIR NOx annual cap will absorb most of the capital costs of con-trols (i.e., SCRs). These capital costs will most likely be re-flected in allowance prices in the CAIR NOx annual market, while the NOx ozone season allowance prices will primarily be driven by the operating costs of controls. The final 2008 NBP NOx allowance price was below the total expected control cost, and continued to reflect the variable costs of SCR operation. Therefore, EPA sees the SCR operating cost acting as a surrogate price floor for the CAIR NOx ozone season allowance price—at least until EPA promulgates a new rule to replace CAIR.
On July 11, 2008, the U.S. Court of Appeals for the D.C. Cir-cuit issued a ruling vacating CAIR in its entirety. EPA and other parties requested a rehearing, and on December 23, 2008, the Court revised its decision and remanded CAIR to EPA without vacatur. This ruling leaves CAIR and the CAIR Federal Implementation Plans (FIPs)—including the CAIR trading programs—in place until EPA issues new rules to replace CAIR. EPA estimates that development and finaliza-tion of a replacement rule could take about two years.
As currently written, the CAIR NOx ozone season program includes six additional eastern states (Arkansas, Florida, Iowa, Louisiana, Mississippi, and Wisconsin) and full state coverage in Alabama, Missouri, and Michigan. The 2009 CAIR NOx ozone season cap is 580,000 tons.
Transaction Types and Volumes
NOx allowance transfer activity includes two types of trans-fers: EPA transfers to accounts and private transactions. EPA transfers to accounts include the initial allocation of allowances by states or EPA, as well as transfers into ac-counts related to special set-asides. This category does not include EPA transfers used to retire allowances. Private transactions include all transfers initiated by authorized account representatives for any compliance or general ac-count purposes.
As Figure 10 shows, trends in market activity continue to show an active market based on a look at overall NOx al-lowance transfer activity. Although the overall volume was
lower in 2008 than in previous years, the market remains active. To help better understand the trends in market perfor-mance and transfer history, EPA classifies private transfers of allowance transactions into two categories:
• Transfers between separate and distinct economic en-tities, which may include companies with contractual relationships such as power purchase agreements, but excludes parent-subsidy types of relationships. These transfers are categorized broadly as “economi-cally significant trades.”
• Transfers within a company or between related enti-ties (e.g., holding company transfers between a unit compliance account and any account held by a com-pany with an ownership interest in the unit).
While all transactions are important to proper market operation, EPA follows trends in the economically signifi-cant transaction category with particular interest because these transactions represent an actual exchange of assets between unaffiliated participants.
What Is the Difference between Marginal Cost, Operating Cost, and Capital Cost?
In the context of the NBP allowance market, marginal cost is the cost to reduce one additional ton of NOx emissions. Operating costs are the day-to-day costs of operating and maintaining an emission control technology. Capital costs are the one-time setup cost of installing a control technolo-gy, after which there will only be recurring operating costs.
Figure 10: Cumulative NOx Allowances Transferred, 1998–2008
Allo
wan
ces
(mill
ions
)
1998 1999 2003 2004 2005 2006 2007 2008200220012000Year
1
2
3
4
5
6
7
8
9
10
EPA Transfers to Account Private Transactions
Source: EPA, 2009

12
The NOx Budget Trading Program: 2008 Emission, Compliance, and Market Analyses
As mentioned, there was a noticeable drop in trading activ-ity in 2008 compared to previous years. In 2008, economi-cally significant trades represented only about 25 percent of the total private trades (down from 35 percent in 2007). The volume of economically significant trades also de-creased in 2008, falling from approximately 247,000 trades in 2007 to 131,000 in 2008 (see Figure 11). Industrial sources continued to participate in the allowance market, accounting for just over 10 percent of the economi-cally significant trade volume, an increase from 2007 levels. In 2008, as in prior years, industrial sources transferred far more allowances to others than they received. Most of these trades were between industrial sources and electric generating companies or brokers, with very few trades in-volving an industrial source as both buyer and seller.It is worth noting that more facilities found themselves at or below current cap levels as they reduced NOx emissions
in anticipation of CAIR and thus shifted fewer allowances among their units. It is the drop in economically significant trading by nearly half, however, that is most striking be-cause it signifies a dramatic turnaround from the growth in trading in recent years. This decline in trading is, in large part, a result of uncertainty regarding the value of allow-ances due to the litigation surrounding CAIR.
Role of Brokers and Their Fees
Brokers play an important role in the emissions allowance markets. They primarily facilitate and conduct trades be-tween willing buyers and sellers, undertaking the direct costs of identifying trading partners and transacting sales at a price acceptable to both parties. In the allowance trad-ing market, the fees charged by brokerage firms are often considered to be transaction costs. These fees are the di-rect costs associated with buying and selling allowances. Costs for services are fairly standardized and are generally low compared to the value of allowances—usually within the 1 to 2 percent range of allowance values typically quot-ed in the economics literature.1 There is sufficient compe-tition amongst the brokerage houses that any attempt at charging fees in excess of market standards would likely be bid down through existing competition and entry of more businesses able to provide brokerage services. In many in-stances, larger clients can negotiate fees even lower than market averages. In addition, if a company needs some ex-pert analysis or opinions to maximize the value of its allow-ances, it may agree to pay additional fees unrelated to the actual execution of the trades. For example, brokers may collect and provide historic and current price information for a cost.While the majority of transactions are conducted through brokers, emission allowances and derivatives (i.e., futures contracts) may also be traded on exchanges such as the New York Mercantile Exchange (NYMEX) and the Chicago Climate Exchange. The fees charged for conducting busi-ness on exchanges appear to be markedly lower than the fees charged by brokerage firms. On a per ton basis, these exchange fees as applied to CAIR NOx allowances translate to less than $1.00 per ton for seasonal NOx and up to $2.50 per ton for annual NOx. These fees are both below the bro-ker fees charged for transactions between two parties.
Figure 11: Breakdown of Private NOx Allowance Transfers, 2003–2008
2003 2004 2005 2006 2007 2008
900
800
700
600
500
400
300
200
100
0
Allo
wan
ces
(thou
sand
s)
131
199
194
425
228
544
237
608
247
459
131
404
Year
Allowances Transferred Between Economically Distinct PartiesAllowances Transferred Between Related Parties
Source: EPA, 2009
1 Personal communication with Gary Hart, ICAP-United, June 25, 2007 as quoted in Napolitano, S., J. Schreifels, G. Stevens, M. Witt, M. LaCount, R. Forte, & K. Smith. 2007. “The U.S. Acid Rain Program: Key Insights from the Design, Operation, and Assessment of a Cap-and-Trade Program.” Electricity Journal. Aug./Sept. 2007, Vol. 20, Issue 7.
Schennach, Susanne M. 2000. “The Economics of Pollution Permit Banking in the Context of Title IV of the 1990 Clean Air Act Amend-ments.” Journal of Environmental Economics and Management. 40, 189-210.
LECG, LLC. “Emissions Trading Market Study.” Report to the Ontario Ministry of Environment. July 2, 2003.

13
The NOx Budget Trading Program: 2008 Emission, Compliance, and Market Analyses
Appendix A: State Trading Budgets, 2003–2008
STATE 2003 2004 2005 2006 2007 2008AL 0 34,459 25,497 25,497 25,497 25,497
CT 4,950 4,477 4,477 4,477 4,477 4,477
DC 233 233 233 233 233 233
DE 5,395 5,227 5,227 5,227 5,227 5,227
IL 0 53,245 35,557 35,557 35,557 35,557
IN 0 75,644 55,729 55,729 55,729 55,729
KY 0 49,744 36,224 36,224 36,109 36,109
MA 13,334 12,861 12,861 12,861 12,861 12,861
MD 19,306 15,466 15,466 15,466 15,466 15,466
MI 0 41,154 31,247 31,247 31,247 31,247
MO 0 0 0 0 19,089 13,459
NC 0 42,184 41,547 34,632 34,713 34,703
NJ 9,750 13,022 13,022 13,022 13,022 13,022
NY 44,161 41,388 41,380 41,397 41,397 41,385
OH 0 72,366 49,975 49,978 49,974 49,842
PA 66,606 50,843 50,843 50,843 50,843 50,843
RI 936 936 936 936 936 936
SC 0 25,022 19,678 19,678 19,678 19,678
TN 0 42,045 31,480 31,480 31,480 31,480
VA 0 26,699 21,195 21,195 21,195 21,195
WV 0 46,215 29,501 29,507 29,507 29,507
Totals: 164,671 653,230 522,075 515,186 534,237 528,453
Note: Totals include base budget, compliance supplement pool, and opt-in allowances, as applicable, for a given year and state. Some states may not issue all budget allowances, and so the total budgets presented in this file may be higher than the total allowances allocated as pre-sented in report tables and graphics that depict allowance allocations and allowance bank totals (see, e.g., Figure 6). Source: EPA, 2009
14
The NOx Budget Trading Program: 2008 Emission, Compliance, and Market Analyses
Appendix B: Ozone Season NOx Emissions (Tons) from NBP Sources, 1990–2008, and 2008 State Trading Budgets
State 1990 2000 2003 2004 2005 2006 2007 20082008
BudgetAL 89,758 84,560 50,895 40,564 33,632 27,812 28,744 30,221 25,497
CT 11,203 4,697 2,070 2,191 3,022 2,514 2,152 1,721 4,477
DC 576 134 72 35 279 115 76 133 233
DE 13,180 5,256 5,414 5,068 6,538 4,763 5,454 4,285 5,227
IL 124,006 119,460 48,917 40,976 37,843 36,343 35,630 34,126 35,557
IN 218,333 145,722 100,772 68,375 57,249 55,510 56,374 57,838 55,729
KY 153,179 101,601 63,057 40,394 36,730 37,461 40,210 39,386 36,109
MA 40,367 14,324 9,265 7,481 8,269 5,464 3,666 3,230 12,861
MD 54,375 28,954 19,257 19,944 20,989 18,480 16,521 10,667 15,466
MI 120,132 80,425 45,614 39,848 42,157 40,353 34,354 34,358 31,247
MO 64,272 34,058 29,407 16,190 18,809 15,917 12,961 12,777 13,459
NC 92,059 73,082 51,943 39,821 32,888 30,387 28,390 27,105 34,703
NJ 44,359 14,630 11,003 10,807 11,277 8,692 7,773 7,139 13,022
NY 84,485 43,583 34,815 34,157 36,633 26,339 24,728 20,934 41,385
OH 240,768 159,578 133,043 67,304 54,335 52,817 57,862 54,644 49,842
PA 199,137 87,329 51,530 52,140 51,125 52,806 57,615 56,747 50,843
RI 1,099 288 209 177 253 181 187 161 936
SC 56,153 39,674 34,624 25,377 18,193 18,376 18,418 17,552 19,678
TN 115,348 69,641 55,376 31,399 25,718 23,930 23,261 21,711 31,480
VA 51,866 40,043 32,766 25,448 22,309 20,491 22,957 19,596 21,195
WV 149,176 109,198 69,171 41,333 30,401 28,852 28,967 27,089 29,507
All NBP States 1,923,831 1,256,237 849,220 609,029 548,649 507,603 506,300 481,420 528,453
Notes:Emissions for Alabama, Michigan, and Missouri are for units in the portion of the state that became subject to the NBP in 2004 (Alabama and •Michigan) and 2007 (Missouri).The 2008 state budget values include opt-in allowances, where applicable (New York, Ohio, and West Virginia).•Emissions for prior years reflect emission resubmissions as of April 1, 2009, and may differ slightly from numbers that appear in previous •progress reports.
Source: EPA, 2009