the nun path
TRANSCRIPT
The Nun Path (נ)The Evolution and Quenching of Satellite
Galaxies
By
TOMER NUSSBAUM
Supervisor
PROF. AVISHAI DEKEL
In Memory of the great Nussbaum,a Holocaust survivor,
badly wounded in his freedom fight for the Jewish nation,and the establishment of the miracle of the middle east, the state of Israel.
Nurtured and cared for orphans and persecuted Jewish survivor youth at the Youth Aliyah. Manager of Mount Herzl.A true Zionist, a family man, and a kind man to all (with plenty of jokes for any event).
A good husband, a great father, and a wonderful grandpa - my grandpa.In our hearts you remain,
Kalman Nussbaum (1928-2020)
The Racah Institute of PhysicsTHE HEBREW UNIVERSITY OF JERUSALEM
A dissertation submitted to the Hebrew University of Jerusalem as a partial fulfillment ofthe requirements of the degree of MASTER OF SCIENCE at The Racah Institute of Physics.
DECEMBER 2018
arX
iv:2
103.
1025
8v1
[as
tro-
ph.G
A]
18
Mar
202
1

ABSTRACT
The galaxy quenching process, a process in which a galaxy stops forming stars is a crucial
stage in galaxy life. Two primary mechanisms for quenching are possible: halo mass
quenching of central galaxies in their dark-matter halos and environmental quenching
of satellite galaxies. This thesis will describe the satellite galaxies (SG) quenching process and
its primary causes. The analysis contains a study of a large sample of 118 SGs within the Vela
zoom-in cosmological simulations, identified with a specific SG merger tree algorithm.
We consider a SG stellar mass sample which ranges between 106 − 109.5 M¯, orbiting and
accreting onto host galaxies with stellar masses between 109.5−1011 M¯ at low redshift (z<1). We
find that the quenching evolves through a typical path in the diagram of specific star formation
(sSFR) vs. inner stellar surface density (Σ?,0.5kpc), with the inner surface density defined as the
density within 0.5kpc from the center of mass of the SG. Three discrete phases characterize this
path: 1. Halt in gas accretion with SG compaction at high sSFR as the SG keeps forming stars
2. Gas removal and rapid drop in the sSFR at the peri-center of its orbit within the host halo
3. Stellar heating and stripping that may lead to coalesce with the halo center, an ultra-diffuse
galaxy (UDG), a compact elliptical galaxy (eCg) or a globular cluster (GC).
We find that the main drivers of SG evolution are ram pressure stripping at the initial stages and
tidal forces at the final stages, aided by starvation, suppression of gas accretion. We also show
that other processes, such as gas depletion by star formation or stellar feedback are secondary.
We construct an analytic model that successfully reproduces this SG evolution.
Moreover, we present an innovative method for constructing galaxy stellar merger trees in
simulations which solves systemic errors in both identification and follow up of galaxies. Two
new significant results of this method presented here: a. Decoupling of dark-matter from the
stellar component in SGs. b. Compact elliptical SG formation. We present an assembly of these
results and others in a fast and robust catalog for further research.
i


DEDICATION AND ACKNOWLEDGEMENTS
I would like to thank the universe for existing and giving me the chance to study it.
Thank you oh mighty universe!
Equivalent in importance! I wish to thank my supervisor, Prof. Avishai Dekel, who taught mecore physics work (“You should make the right, simplest assumptions”). It was a privilege.
For my awesome group co-researchers: Dr. Yuval Birnboim, Sharon Lapiner, Dr. Nir Mandelker,Omry Ginzburg, Dr. Jonathan Freundlich, Dr. Nicolas Cornuault, Dr. Fangzhou Arthur Jiang, Dr.Sarkar Kartick and Dr. Yakov Faerman, As well as the big Astro-center, many people from manybackgrounds with many adventures together, Thank you guys.
To my Alpha program pupils and guests, dearest galactic hunters! Naftali Deutch, Zohar Milman,Oz Weizer, Raphael Buzaglo, Noam Chouchena and Adam Beili. Remember that, “Superhumaneffort isn’t worth a damn unless it achieves results”. So where are they? ;)
I want to thank my friends, especially Or Sharir, Odelia Teboul, Ragit Moshe and Yohai Devir.
To my dear family, my stunning siblings: Bar, Raz and Netta,and to my mom and dad, Rachel and Ran.Thanx ;x)
For all who are far beyond the known universe... I dedicate this work to you. :)
iii


TABLE OF CONTENTS
Page
1 Physical Introduction 11.1 Galaxy Bi-modality . . . . . . . . . . . . . . . . . . . . . . . . . . . . . . . . . . . . . . 2
1.2 Satellite galaxies . . . . . . . . . . . . . . . . . . . . . . . . . . . . . . . . . . . . . . . 4
1.3 Objectives of This Thesis . . . . . . . . . . . . . . . . . . . . . . . . . . . . . . . . . . . 6
2 Numerical Introduction 72.1 VELA High-Resolution Cosmological Simulation . . . . . . . . . . . . . . . . . . . . 7
2.2 Comparison to Observations and limitations . . . . . . . . . . . . . . . . . . . . . . . 10
2.3 VELA suite . . . . . . . . . . . . . . . . . . . . . . . . . . . . . . . . . . . . . . . . . . . 11
3 Methods 133.1 Stellar Kernel Merger Tree . . . . . . . . . . . . . . . . . . . . . . . . . . . . . . . . . 13
3.1.1 Stellar Component Identification . . . . . . . . . . . . . . . . . . . . . . . . . 14
3.1.2 Merger Tree Algorithm . . . . . . . . . . . . . . . . . . . . . . . . . . . . . . . 15
3.1.3 Results . . . . . . . . . . . . . . . . . . . . . . . . . . . . . . . . . . . . . . . . . 17
3.1.4 Discussion . . . . . . . . . . . . . . . . . . . . . . . . . . . . . . . . . . . . . . . 18
3.2 Galaxy Properties . . . . . . . . . . . . . . . . . . . . . . . . . . . . . . . . . . . . . . . 19
3.2.1 Central Galaxies . . . . . . . . . . . . . . . . . . . . . . . . . . . . . . . . . . . 19
3.2.2 Stellar Radius . . . . . . . . . . . . . . . . . . . . . . . . . . . . . . . . . . . . . 19
3.2.3 Derived Masses and Radii . . . . . . . . . . . . . . . . . . . . . . . . . . . . . 20
3.2.4 Main Galactic Quantities . . . . . . . . . . . . . . . . . . . . . . . . . . . . . . 21
3.3 Computing Forces . . . . . . . . . . . . . . . . . . . . . . . . . . . . . . . . . . . . . . . 21
3.3.1 Ram Pressure Force . . . . . . . . . . . . . . . . . . . . . . . . . . . . . . . . . 21
3.3.2 Tidal Force . . . . . . . . . . . . . . . . . . . . . . . . . . . . . . . . . . . . . . . 22
3.3.3 Satellite Self-Gravitational Force . . . . . . . . . . . . . . . . . . . . . . . . . 22
3.4 Satellite Galaxies characteristics . . . . . . . . . . . . . . . . . . . . . . . . . . . . . . 22
3.5 Catalog Summary . . . . . . . . . . . . . . . . . . . . . . . . . . . . . . . . . . . . . . . 23
4 The Satellite Quenching Process 254.1 Satellite Galaxies Sample in the VELA Simulations . . . . . . . . . . . . . . . . . . 25
v

TABLE OF CONTENTS
4.2 Case Studies of Satellite Galaxy Evolution . . . . . . . . . . . . . . . . . . . . . . . . 27
4.3 Evolution of Satellites as a Function of Time . . . . . . . . . . . . . . . . . . . . . . . 30
4.4 Evolution of Satellites Versus the Distance to the Central Galaxy . . . . . . . . . . 33
4.5 Nun Path (נ) - Evolution Track by star formation vs compactness . . . . . . . . . . 34
4.6 Comparison to Observations . . . . . . . . . . . . . . . . . . . . . . . . . . . . . . . . . 38
5 Origins of Satellite Galaxy Quenching 435.1 Main Quenching Causes . . . . . . . . . . . . . . . . . . . . . . . . . . . . . . . . . . . 43
5.2 Case Studies of Satellite Galaxy Force Evolution . . . . . . . . . . . . . . . . . . . . 46
5.3 Force Evolution as a Function of Time . . . . . . . . . . . . . . . . . . . . . . . . . . . 50
5.4 Force Evolution as a Function of distance to the central galaxy . . . . . . . . . . . . 51
5.5 Starvation . . . . . . . . . . . . . . . . . . . . . . . . . . . . . . . . . . . . . . . . . . . . 52
5.6 Sub-Dominant Quenching Causes . . . . . . . . . . . . . . . . . . . . . . . . . . . . . 54
5.7 Comparison to Observations . . . . . . . . . . . . . . . . . . . . . . . . . . . . . . . . . 55
6 Summary and Conclusions 57
References 61
vi
CH
AP
TE
R
1PHYSICAL INTRODUCTION
Cosmology, the field of formation and evolution of the universe has been an existential
need since the days of the first man across a variety of cultures, some independently
growing oceans away from each other. The questions of “who and what we are?” coupled
with “where and in what we are?” always appeared.
In the last century and especially these following 25 years, we witness a fantastic rise in our
ability to answer the question “In what we are?”. With the arrival of new mesmerizing observation
techniques we can observe the early formation stages of the universe and watch galaxies at z
∼ 11.1, 400 Myr after the big bang and have high quality observations of enormous number of
galaxies at z ∼ 2-3 (2-3 Gyr after the big bang) which is the peak of formation of galaxies in the
universe. These observations aid us to solve the core question regarding the galaxy and structure
evolution of the universe and also learn about the initial conditions of the universe itself. From
initial fluctuations in the cosmic background radiation to the breathtaking spiral galaxies vs.
elliptical giants we see around our Milky Way galaxy.
On the broad aspect, galaxies and clusters of galaxies are our only sign today to the presence
of dark-matter or a change in the gravity force on large scales, and one of our signs to the presence
of dark energy. Dark-matter and dark energy together hold 95% of the energy of the universe!
Therefore, today, those issues are part of the core questions in physics and science.
The dramatic change in observations does not stand alone, as hand in hand with the ad-
vancement in observation tech, came an exponential growth in computing power and numerical
algorithm methods, allowing us simulating Megaparsecs wide cubes of the universe in details.
These simulations became a useful tool, and with this tool, we explore an assortment of new
theories and find new phenomena. A short description on our numeric methods is given at §2.
1

CHAPTER 1. PHYSICAL INTRODUCTION
Finally, we wish to point out that the following work assumes ΛCDM Model, the current
cosmological standard model which is considered to be the simplest model that can explain the
observed phenomena, from the cosmic microwave background (CMB) radiation properties to
the structural evolution of the universe, including hydrogen abundance and universe expansion
acceleration.
1.1 Galaxy Bi-modality
The primary “hot” subject today in the galaxy formation field can be shown in the riddle hiding
of one plot. The “Star formation rate (SFR) vs Stellar mass galaxy distribution colored by the
galaxy shape”, shown in fig 1.1 (Sometimes there are variations of this plot by sSFR instead of
SFR, when sSFR is the SFR divided by the stellar mass or by surface density instead of mass,
in this work we will use sSFR vs. surface density of the galaxies). Going back to z ∼ 2 we can
already see two distinctive classes of galaxies: star-forming (SF) galaxies (“The main sequence”,
MS) and not forming stars, quenched (QG) galaxies (Red & dead region).
Today, the research focuses on “field galaxies” which galaxies that are alone in the sky (not in
groups or clusters) or they are massive by ten times or more from their nearest neighbors. The
field galaxy evolution from a star-forming stage to a quenched stage is often addressed as halo
mass quenching.
Figure 1.1: SFR - stellar Mass diagram colored by the surface brightness profile shape.By Wuyts et al. (2011). A “structural main sequence” is present at all observed epochs. Star-forminggalaxies on the main sequence (MS) are well characterized by exponential disks, and the quenched (QG)galaxies at all epochs are elliptical. The quenched population include galaxies below 1010.5M¯, themass in which galaxies become quenched by the “mass quenching” process, showing another quenchingmechanism is needed to explain the less massive galaxies quenching process.
One of the most advanced studies today (Dekel et al., n.d.; Tacchella et al., 2016) suggests
2

1.1. GALAXY BI-MODALITY
that a galaxy is having compacting fluctuations on the MS until it reaches a stellar mass of
about 1010.5M¯, there the galaxy suffers a sharp drop in its gas fraction and therefore lacks the
material to form new stars and becomes quenched. The process itself happens due to a heating of
the gas by the stars, a powerful process when the stars are compact. A nice explanation can be
seen at S1.2.
This process also changes the shape and color of the galaxy from a blue disc shape (blue as
new stars a bluish) to a red elliptical shape galaxy (red as old stars are red).
Two other significant phenomena are also in the heart of the current study. A supermassive
black hole that exists in the center of each galaxy and when active (AGN), heats the gas and
throws it outside the galaxy and a merger with another galaxy. Both can be triggers for compaction
or to influence each other.
log M [M ]
ΔM
S [d
ex] scatter of M
S
0.0
0.3
-0.3
8.0 12.010.0
Blue Nugget Phase:
Quenching Attempt:Quenching:
Associated with a compact, massive core of gas and star-formation rate, short depletion time and high gas fraction. The downturn at the upper bound is due to the peak in SFR and outflow and the suppression of inflow. Onset of quenching inside-out due to central gas depletion.
Central gas depletion gives rise to inside-out quenching. In low-mass haloes at high redshift, when trep < tdep, inflow of gas resumes, leading to the prerequisite for another compaction.
Inflow rate cannot recover in hot haloes and at late times (trep > tdep), leading to gas depletion and full quenching.
compaction depletion co
mpacti
on
successful quenching
trep < tdep (z > 3)
Mhalo < Mshock
trep > tdep (z < 3)Mhalo > Mshock
depletion
Compaction:Triggered by an intense gas inflow event, involving minor mergers or counter-rotating streams, and is commonly associated with violent disc instability. The inflow rate is more efficient than the SFR.
Figure 1.2: Field Galaxies main sequence evolution and mass quenching, by Tacchella et al.(2016): Sketch of the self-regulated evolution along the star-forming galaxies (SFG) main sequence (MS).SFG is confined to a narrow MS before they quench. During this evolution, the galaxy lives throughone or more blue nugget phases during which a minimum in gas depletion time and a maximum in thegas fraction reached. The blue nugget phases are followed by gas depletion inside-out. These quenchingattempts fail for low halo masses and at high redshifts since the recovered inflow rate triggers a newepisode of compaction and high star formation. At high halo masses (hot halo), the inflow rate cannotrecover, and the galaxies cease its star formation activity.
3

CHAPTER 1. PHYSICAL INTRODUCTION
1.2 Satellite galaxies
In the lifetime of galaxies, the lion’s share of galaxies becomes satellites of another bigger central
galaxy and even merge with it. This process is a crucial factor of the structure evolution in the
universe (Press & Schechter, 1974; White & Rees, 1978; Bardeen, Bond, Kaiser, & Szalay, 1986;
Lacey & Cole, 1993). We define Satellite Galaxy (SG) as a galaxy in a virial dark-matter halo of a
bigger galaxy. We observe SGs by the projected distance between SG and its central galaxy. For
example, we observe satellite galaxies around the Milkey Way. These observations not always
fitting our theoretical or numerical simulation models, as we do not observe enough SGs around
the Milkey Way as we expect from theoretical models as can be found on missing SG problem
(Klypin, Kravtsov, Valenzuela, & Prada, 1999; Moore et al., 1999; Simon & Geha, 2007). Also,
as discussed earlier, it has a lead rule in halo mass quenching of galaxies (Dekel et al., n.d.).
Therefore it is crucial to understand SG evolution to complete the theory of galaxy formation and
evolution.
On the Quenching aspect: The purpose halo mass quenching described at §1.1 cannot explain
the full quenching phenomena. Fig 1.1 shows that there are quenched galaxies well below a
stellar mass of 1010.5M¯, as halo mass quenching occurs on galaxies at above 1010.5M¯ it means
another quenching process exists (Wuyts et al., 2011). This process is called environmental
quenching, and it is identified as satellite quenching (jie Peng et al., 2010; jie Peng, Lilly, Renzini,
& Carollo, 2012; Wetzel, Tinker, Conroy, & van den Bosch, 2013; c et al., 2013; van den Bosch et
al., 2008).
Hence, satellite galaxy evolution and quenching mechanism are important to the galaxy
formation and evolution research.
Observational studies (Omand, Balogh, & Poggianti, 2014; Woo, Carollo, Faber, Dekel, &
Tacchella, 2017), suggests possible evolution paths. All of them include gas stripping out of the
SG and later compaction of the SG (Wetzel et al., 2013; Woo et al., 2017). As can be seen at fig
1.3 by looking at mass bins of SGs at the lower fig, it seems that the SGs are becoming compact
through their evolution and quench on the way. The upper figure shows the different suggested
paths.
Additionally, it has been shown that the binned quenched fraction of SGs is mass depended.
The smaller the SGs mass is, the higher is the quenched fraction of the SGs (Slater & Bell, 2014;
Wheeler, Phillips, Cooper, Boylan-Kolchin, & Bullock, 2014; Wetzel, Tollerud, & Weisz, 2015;
Fillingham et al., 2015). Also, the quenching process dependence on the distance from the central
galaxy (Fillingham et al., 2018; Woo et al., 2017), The closest the SGs are, the higher is the
quenched fraction. There is also halo dependence on galaxy groups and galaxy clusters as bigger
the halo mass is the higher the quenched fraction (Woo et al., 2012; Balogh et al., 2016; Woo et
al., 2017)
4

1.2. SATELLITE GALAXIES
Figure 1.3: Woo et al. (2017) Satellite Galaxies proposed evolution path. Upper fig: Schematicdiagram illustrating quenching paths in sSFR-Σ1kpc space at constant stellar mass. The region marked“SF” refers to the “star-forming” population, and the region marked “Q” refers to the “quenched” population.The arrows are the proposed quenching paths for SG. Lower fig: sSFR vs. Σ1kpc comparing the field tosatellites in mass M? bins. The contours represent the logarithmic number density in each panel and areseparated by 0.2 dexes. The color scale is normalized such that dark red represents the highest numberdensity in the panel. The sample size mentioned at the bottom left. Satellites have a higher proportion ofquenched galaxies than the field at all masses. Quenched galaxies have higher Σ1kpc than star-forminggalaxies (SFG) by about 0.2-0.3 dex whether in the field or as satellites. These effects are most active forthe lowest masses and decrease in significance for the most massive galaxies.
5

CHAPTER 1. PHYSICAL INTRODUCTION
1.3 Objectives of This Thesis
Field galaxy evolution is studied today with great care. However, one could ask,
what is the next step on galaxy formation research?
A common practice in physics is to study system in equilibrium and later apply disturbances
to the system, allowing us to get fundamental knowledge on the system (Resonance, decay...).
The analog in our case is after studying the “normal” field galaxy evolution track is to add
disturbances to the this “normal” evolution and earn further knowledge regarding galaxies.
As we cannot hold a galaxy in a lab and disturb it (It is just too big), we should use naturally
disturbed galaxies. Those are satellite galaxies. SGs are disturbed by variating gravitational
potential slope due to the bigger galaxy gravitational potential well shape. SGs are also disturbed
by densities of gas from the bigger galaxy that is near the SG and apply “wind” (Ram pressure)
on the SG. Those two forces throw galaxies out if their “normal” evolution track and give us new
case studies of galaxies, with hopefully, some fundamental knowledge. Hence, SGs allow us to
learn new physics and limitations on dark-matter, stars, and gas in the universe.
Our objective in this thesis is to give a crude description of the SG evolution process. We
will describe these results on the famous sSFR vs. Σ? diagram, thus, comparing them with
the “normal” field galaxies halo mass quenching process. We would provide analytic expression,
high-resolution numerical results from the VELA cosmological simulation suit and observational
results to support our description.
These results would enable us to learn new inner dynamics of galaxies together with integrat-
ing the SG quenching path to the complete galaxy quenching process picture.
A by-product of this work, we will present a new rigorous, fast and simple method to analyze
SG out of cosmological simulations (a.k.a a new merger tree algorithm) and will provide a broad
base of SG samples for future study. This new method allows us to study other interesting
phenomena such as: Ultra diffused galaxy (UDG), compact elliptical galaxy (eCg), globular cluster
(GC) and baryon dominant galaxy (BG) formation mechanisms, star formation bursts before full
quenching (“Swansong”), Globular cluster evolution in a SG, baryon dominant galaxies formation,
dark-matter halo and gas halo properties and more...
6

CH
AP
TE
R
2NUMERICAL INTRODUCTION
Galactic process timescale is long, very long, above 100 Myr or more. Therefore galactic
observations give us only glance at a time with no dynamical process. This glance is flat
as we see projections of galaxies in the sky and as many objects just cannot be observed:
some types of gas and of course dark-matter. In order to bypass these limitations and also to allow
us to try different approximations and different physical parameters and their stability, one of the
essential tools for a researcher today are simulations. In this chapter, we describe VELA, a state
of the art cosmological simulation suite used to mimic galactic evolution. This process is done
numerically by graduating the initial conditions of the universe by physical dynamical terms (see
§2.1) when the results are compared and verified by observations with recalling the simulation
limitations (see §2.2) to determine the confidence in the simulation. Later, these simulations
results §2.3) can be used for galactic and cosmological evolution study as presented on this thesis.
2.1 VELA High-Resolution Cosmological Simulation
The VELA suite is a high-resolution zoom-in hydro-cosmological simulation with 34 simulation
runs of central galaxies around 1011M¯ halo mass at z∼2. VELA was ran using Adaptive
Refinement Tree (ART) code (Kravtsov, Klypin, & Khokhlov, 1997; Kravtsov, 1999, 2003; Ceverino
& Klypin, 2009), a simulation package that includes N-body particles simulation for dark matter
and stars with Eulerian gas hydrodynamics using Adaptive Mesh Refinement (AMR). VELA was
first run with an N-body dark-matter particles governed by gravity, with the initial distribution
function of the universe at early times and then was ran again, refined around chosen halos. The
second ran used higher resolution dark matter with addition of gas and stars at the minimum
mass of 8.3 ·104 M¯ for dark matter, 1 ·103 M¯ for stars and 1.5 ·106 M¯ gas with a minimum
7

CHAPTER 2. NUMERICAL INTRODUCTION
AMR cell mass of 2.6 ·105 M¯ for dark matter and stars in a cell. Most of the simulation runs
were ran until z ∼ 1 with a maximum AMR resolution of 17-35 pc at all times (Dekel et al., n.d.;
Mandelker et al., 2016)
The simulation assumes an expanding universe with the standard ΛCDM cosmology, with
the WMAP5 cosmological parameters: ΩΛ = 0.73, Ωm = 0.27, Ωb = 0.045, h = 0.7 and σ8 = 0.82
(Komatsu et al., 2009). Moreover, it includes mechanisms for the following physical process: (1)
Gravity (2) Gas Hydrodynamics (3) Stochastic star-formation (4) Stellar mass loss (5) Gas cooling
(6) Photo-ionization heating (7) Gas recycling and metal enrichment (8) Supernovae thermal
feedback (9) Radiation pressure feedback
2.1.0.1 Gravity
Gravity was implemented by Newtonian gravity on the AMR with force resolution of twice
the cell-size (equivalent to softening length of 34 pc in the high-resolution regions). While the
high-resolution region of the dark-matter particles is a Lagrangian sphere of 2 times the virial
radius centered at the main galaxy at z=1. At higher red-shifts, the same Lagrangian volume has
more complicated shapes.
2.1.0.2 Gas Hydrodynamics
The hydro mechanism assumes equation of state of an ideal mono-atomic gas. The artificial
fragmentation on cell size is prevented by a pressure floor, ensuring that Jeans scale is resolved
by at least seven cells (Ceverino, Dekel, & Bournaud, 2010).
2.1.0.3 Stochastic star-formation
Star-formation added by assuming it occurs at densities above 1 cm−3 and temperature below
104 K . More than 90% of stars are formed well below 104 K when the median is 300 K in cells
with gas density above 10 cm−3. A stochastic model implements the star-formation in a discrete
time-steps of ∆tSF = 5 M yr by a probability of:
PNew star particle(cell)=min(0.2,
√ρgas
1000 [cm−3]
)(2.1)
The newly formed star particle mass is:
m? ≡ mgas · ∆tSFτ
' 0.42 ·mgas(2.2)
Where mgas is the gas mass in the cell and τ is 12 M yr. We assume initial mass function as
described in (Chabrier, 2003). This stochastic mechanism yields star-formation efficiency per
free-fall time of ∼2%, at a given resolution, this efficiency ruffly mimic the empirical Kennicutt-
Schmidt law (Kennicutt, 1998). As a result of the universal local SFR law adopted, the global
8

2.1. VELA HIGH-RESOLUTION COSMOLOGICAL SIMULATION
SFR follows the global gas mass. By observations, a simple universal local SFR law of 1% SFR of
molecular gas per local free-fall time fits the galactic clouds, nearby galaxies and high-redshift
galaxies (Krumholz & Dekel, 2012). Runaway stars included by applying velocity kick of ∼ 10 [km/s]
to 30% of new star particles as they formed.
2.1.0.4 Gas Cooling & Photoionization Heating
Gas cooling is estimated by atomic hydrogen or helium and by metals and molecular parts in the
gas and photoionization heating implemented by the UV-background with partial self-shielding.
By using the CLOUDY code (Ferland et al., 1998) and adding terms for a gas density, temperature,
metallicity, and UV-background the cooling and heating rates are calculated assuming slab of a
thickness of 1kpc. UV-background is calculated assuming uniform radiation redshift dependent
model by (Haardt & Madau, 1996). Except for cases of gas densities above 0.1 [cm3] in which we
reduce the radiation to 5.9 ·1026 [ ergs·cm2·Hz ] and enabling the gas to cool down to temperatures of
300 K in order to mimic the self-shielding of gas.
2.1.0.5 Supernovae: Stellar mass loss, supernovae thermal feedback, gas recycling,and metal enrichment
Thermal stellar feedback model (Ceverino et al., 2010; Ceverino et al., 2012) releases energy
from stellar winds and supernova explosions at a constant heating rate of above 40 Myr follows
star-formation. 40 Myr is the typical age of the least massive stars that explode as a type-II core-
collapse supernova, Heating rate due to the feedback can overcome the cooling rate, depending
on the gas condition in the star-forming region (Dekel & Silk, 1986; Ceverino & Klypin, 2009), in
this simulation there is no artificial cooling shutdown added.
The gas recycling and metal enrichment of the interstellar medium (ISM) implemented via
Type-Ia supernova and stellar mass loss computation that is added as well to the computation.
2.1.0.6 Radiation pressure feedback
The radiation pressure implemented by the addition of non-thermal pressure term to the gas
pressure in regions where massive stars ionizing photons are produced and may be trapped,
this radiation injects momentum to cells around massive stars younger then 5 Myr with column
density above 1021 cm−2 increasing pressure in the star-forming regions (Agertz, Kravtsov,
Leitner, & Gnedin, 2013) - Appendix B. We assume isotropic radiation fields in a given cell with
radiation pressure proportional to Γ ·m?, where m? is the mass of the stars in the cell, and Γ
is luminosity of ionizing photons per stellar mass. Γ= 1036 [ ergM¯·s ] chosen from STARBURST99,
stellar population synthesis code (Leitherer et al., 1999) with a time-averaging of over the first 5
Myr of the evolution of a single stellar population. After 5 Myr, the number of high mass stars and
ionized photons declines significantly. Radiation pressure is also dependent on the optical depth
9

CHAPTER 2. NUMERICAL INTRODUCTION
of the gas in the cell, using the hydrogen column density threshold, N = 1021 cm−2, in which
above it the radiation effectively trapped and the radiation is added to the total gas pressure.
This threshold is chosen to correspond to the typical column density of cold neutral clouds that
host optically-thick column densities of neutral hydrogen (Thompson, Quataert, & Murray, 2005).
2.2 Comparison to Observations and limitations
The VELA cosmological simulation is considered to be one of the leading cosmological simulations.
Regarding high-resolution AMR hydrodynamics and key physical processes implementation at
sub-grid level. Explicitly, VELA suite traces cosmological streams that feed galaxies at high-
redshift, including mergers and smooth flows, resolves VDI that governs high redshift disc
evolution and bulge formation (Ceverino et al., 2010; Ceverino et al., 2012; Ceverino, Dekel,
Tweed, & Primack, 2015; Mandelker et al., 2014).
As shown before, star-formation calculated by SFR efficiency per free-fall time. Although this
method proved to be more realistic then previous versions, it still does not fully replicate the
formation of molecules and the metallicity effect of SFR (Krumholz & Dekel, 2012). Moreover,
the resolution does not allow the Sedov-Taylor capturing of the adiabatic phase of a supernova.
Radiating stellar feedback assumes no infrared trapping, as the trapping effect should be low
(Dekel & Krumholz, 2013) based on (Krumholz & Thompson, 2012). In contrast to other works
(Murray, Quataert, & Thompson, 2010; Krumholz & Dekel, 2010; Hopkins, Kereš, Murray,
Quataert, & Hernquist, 2012), which assumes significant trapping, and therefore puts the VELA
suite with a lower radiating stellar feedback in comparison to other simulations.
Some mechanisms are missing today in the VELA suite. They include AGN feedback, cosmic-
ray feedback, and magnetic fields. Nonetheless, the star-formation rate, gas fraction and stellar-
to-halo mass ratio are all within the estimates derived from the abundance matching to the
observations, better than other simulations (Ceverino et al., 2014). Uncertainties and other
possible mismatches between observations and the simulation by a factor of 2 are comparable to
the observational uncertainties.
With those caveats in our mind, we emphasize the use of the simulations to understand
the qualitative features of the main physical processes that govern galaxy evolution. Later we
should validate those notions by analytic models that are tested in observations and additional
simulations.
Note that in this specific study of satellite quenching, having lower stellar feedback in VELA
can be a virtue of the VELA simulation, as it gives us a good upper bound on the significant
dynamics of the SG, with less high order effects noise.
10

2.3. VELA SUITE
2.3 VELA suite
The VELA suite includes 34 simulation runs around 1011M¯ halo mass at z ∼ 2. It includes
central galaxies, satellite galaxies, halos, filaments, walls, clumps and more... Some basic details
about the simulation can be seen at table 2.1
Currently, it is one of the highest cosmological simulation suits, and as such, it is a fountain
of knowledge awaits to be discovered.
11

CHAPTER 2. NUMERICAL INTRODUCTION
The VELA suite of 34 simulated galaxiesSim id Rvir Mvir M? Mgas SFR Reff,M? cellmin afin zfin #components
[kpc] [M¯] [M¯] [M¯] [M¯yr−1] [kpc] [pc]01 58.25 11.2 9.31 9.17 2.64 0.93 18 0.5 1.0 5502 54.5 11.11 9.21 9.07 1.43 1.81 36 0.5 1.0 2203 55.5 11.14 9.58 8.95 3.67 1.41 18 0.5 1.0 6304 53.5 11.09 8.91 8.9 0.45 1.73 36 0.5 1.0 2405 44.5 10.85 8.86 8.71 0.38 1.81 18 0.5 1.0 2506 88.25 11.74 10.33 9.51 20.6 1.05 36 0.37 1.7 13107 104.25 11.96 10.76 9.9 18.14 2.85 36 0.54 0.85 24708 70.5 11.45 9.54 9.17 5.7 0.74 36 0.57 0.75 14209 70.5 11.44 10.01 9.46 3.57 1.74 36 0.4 1.5 13710 55.25 11.12 9.78 9.11 3.2 0.46 36 0.56 0.78 11311 69.5 11.43 9.88 9.52 8.94 2.14 36 0.46 1.17 4912 69.5 11.42 10.29 9.3 2.7 1.13 36 0.44 1.27 4713 72.5 11.5 9.76 9.55 4.48 2.48 18 0.4 1.5 7914 76.5 11.56 10.1 9.64 23.32 0.32 36 0.41 1.44 4615 53.25 11.08 9.71 8.92 1.35 1.07 36 0.56 0.79 3416* 62.75 11.7 10.61 9.7 18.47 0.61 26 0.24 3.17 10317* 105.75 12.05 10.93 10.04 61.4 1.36 34 0.31 2.23 20219* 91.25 11.94 10.65 9.76 40.47 1.22 32 0.29 2.44 9420 87.5 11.73 10.56 9.55 5.55 1.72 18 0.44 1.27 25921 92.25 11.8 10.61 9.64 7.89 1.73 18 0.5 1.0 32522 85.5 11.7 10.64 9.45 12.0 1.31 18 0.5 1.0 6023 57.0 11.17 9.88 9.12 3.06 1.16 18 0.5 1.0 6424 70.25 11.44 9.94 9.41 3.88 1.68 18 0.48 1.08 25725 65.0 11.34 9.84 8.93 2.29 0.73 18 0.5 1.0 34926 76.75 11.55 10.2 9.44 9.36 0.74 18 0.5 1.0 5727 75.5 11.54 9.85 9.48 6.1 1.98 18 0.5 1.0 5328 63.5 11.3 9.27 9.32 5.54 2.32 18 0.5 1.0 4229 89.25 11.72 10.36 9.55 16.82 1.89 19 0.5 1.0 33530 73.25 11.49 10.2 9.37 2.97 1.43 18 0.34 1.94 29631* 38.5 11.37 9.89 9.1 15.27 0.43 21 0.19 4.26 3732 90.5 11.77 10.42 9.64 14.86 2.58 18 0.33 2.03 19933 101.25 11.92 10.68 9.7 32.68 1.23 18 0.39 1.56 11734 86.5 11.72 10.19 9.66 14.47 1.84 18 0.35 1.86 24835* 44.5 11.35 9.75 9.39 22.93 0.33 24 0.22 3.54 92
Table 2.1: VELA Simulation Major Quantities Table: The virial radius - Rvir, total virial mass - Mvir,stellar mass - M?, gas mass - Mgas, star-formation rate - SFR and half stellar mass-radius - Reff, M? , forthe 34 VELA simulations. When M?, Mgas, SFR and Reff,M? are quoted within 0.1Rvir and all of themasses Mvir, M?, Mgas are shown in their log10 values. Also listed are the minimum cell size cellmin inthe snapshot, the final simulation scale factor - afin, and redshift - zfin, as well as the number of stellarcomponents throughout the simulation #components. All physical properties and cellmin are quoted atz = 2, except for the five cases marked ∗, where they are quoted as the final simulation output, zfin > 2.Looking at #components, there are numerous galaxies in the simulation with a diverse population of thecentral halos in its mass range.
12
CH
AP
TE
R
3METHODS
Equipped with theoretical models and numerical data we go on to define what is a galaxy?
This is done by the stellar kernel merger tree, an identification & follow-up algorithm of
the dense stellar population in simulations (see §3.1). Then we measure the galaxies with
basic analysis (see §3.2), forces analysis (see §3.3) and time events analysis (see §3.4). Results of
these calculations and others enrolled in our pandas catalog system (see §3.5)
3.1 Stellar Kernel Merger Tree
In cosmology and specifically in the field of galaxy formation, our knowledge comes from what
we observe, which is mainly stars and some specific gas properties (Sadly we cannot observe
dark matter). So, in order to compare the simulations to the real universe, we choose to compare
items which we can observe, hence stellar population. This approach is different from the usually
chosen research which focuses on dark matter follow up in the simulation. As the dark matter
has been proven to be the main factor for structure formation in the universe. Notwithstanding,
we choose to follow the observed quantity, stars, and this approach has proven right, as, in the
galactic scale, there are baryonic effects in which an observed stellar component formation or
evolution are not governed by dark matter. It can be UDGs with no dark matter (van Dokkum
et al., 2018) or baryonic galaxies as we will show later in this thesis. It is also true to say that
galaxies are baryon dominated in their centers, and as such the stellar population is denser than
the dark matter and therefore it is better to follow-up stars to follow galaxies and smaller stellar
components. (if one will follow halo evolution, even its center, the stellar component sometimes
departs from the halo. Therefore one can get the wrong understanding of satellite formation),
case studies are shown at (Chang, Macciò, & Kang, 2013). One word about gas tracing, as gas is
13

CHAPTER 3. METHODS
not a fully observed quantity and as it is hard to trace it in the current VELA implementation, we
choose not to follow it. As except mergers and early formation, gas particles flow with the stellar
component. These specific cases, are known to us and are handled each case in details. One caveat
of this method is the fact that we do not follow dark matter only halos and sub-halos, this kind
of research is essential, for cross-correlation and dark matter - baryon matter relations in the
universe. However, as we choose to study observed satellite galaxies (and not dark matter only
satellite) this is a caveat we choose to “live with”. Further research comparing stellar components
evolution with dark matter halo evolution can be fascinating to our understanding of the missing
satellite problem, the gas ratio and dynamical limits in the universe.
We have also chosen not to limit our identification by computing if a stellar component is
bound as we wish to study the simulation as a “mock universe” that could be compared to the real
universe. If those stellar components exist in our simulation, we would like to know. Likewise,
this approach of identification observed quantity can let us be versatile in the theoretical models
that we will apply later. Example for that can be the question of what one measure when one has
a SG inside a disk. Does he want only the bound part of the satellite or does he want all the mass
in a sphere? Because that is affecting the self-gravity calculation, or because he would like to
compare it to observation. Also, in this case, gas can collide (satellite gas with disk gas), then it
would not be bound to any of the galaxies in this stage. So we wish to be adaptive to many cases
and choose the strategies later.
Studying stellar components enabled us to explain the formation and evolution of observed
phenomena such as ultra diffused galaxies (UDGs), stellar clumps, Baryon dominated galaxies
(BG), and more. It can aid us to investigate any other stellar components whether the component
associated with a halo or not.
3.1.1 Stellar Component Identification
Identifying stellar populations is applied by the ZANAPACK package (Tweed et al., 2009), a stellar
density identification package based on an adaptation of dark matter density ADAPTAHOP
package (Aubert, Pichon, & Colombi, 2004)[Appendix B]. We used ZANAPACK to find dens
structures. The structures found by calculating “star neighborhood density” by averaging over its
40 closest neighbors (the common and default number for star particles). If a star is above ∆ρcrit
(ρcrit is the critical density in the universe) threshold it is ascribed to its densest neighbor star.
By this process, the stars are connected to each other and become identified as a structure. When
the densest star is the structure center. We have limited our structures to be above our resolution
limit. Therefore we set min particles per structure limit to be 100-star particles (min expected is
10, 50-100 is the common use).
The standard approach (Srisawat et al., 2013) is following the Morse Theory (Jost, 2002)
which gathers structures above the critical density ρcrit of the universe. By (Tweed et al., 2009)
14

3.1. STELLAR KERNEL MERGER TREE
this threshold is set to 80ρcrit (Corresponds to b = 0.2 in the FOF algorithm (More et al., 2011)).
Which gives a galaxy radii for the stellar component which is similar to 0.1Rvir
Unlike the approach described above, our purpose is to follow the gravitational potential well
of each component and later resolve the component around it. We choose to look at highly dens
structures (kernels of galaxies and other stellar components), as the particles in dense structures
are more likely to be bound and define a stable potential well (continues through time). Then,
by tracing the particles in these dense structures, we resolve the whereabouts of the potential
well through time. This method has shown to be well consistent in identifying and tracing of
galaxies with more than one dense region, meaning a small substructure as ex-situ or in-situ
clumps. This method even proved itself with identifying UDGs, eCgs, satellite galaxies in the
merger/flyby process and more. We choose a 5000ρcrit which is similar or above R?,e f f , the half
stellar mass-radius of the stellar component. We choose this number in the following way: For
R?,e f f the radius in which half of the mass of the galaxy is in, and for M?,e f f half of the stellar
mass we get:
M?,eff4π3 (R?,eff)3
=12 M?,0.1Rvir
4π3 (0.2 ·0.1Rvir)3
= 12 ·0.23
M?,0.1Rvir
4π3 (0.1Rvir)3
≈ 12 ·0.23 ·80ρcrit ≈ 5000ρcrit(3.1)
Where the first step is using the R?,eff ≈ 0.02Rvir following (Kravtsov, 2013; Somerville et
al., 2018) and the third step we have used the (Tweed et al., 2009) threshold for resolving stellar
radius of galaxies M?4π3 (R?)3 = 80ρcrit, with the R? ≈ 0.1Rvir
N = 5000ρcrit was examined with different densities, and it was found that the range 2000−7000 seems to identify well the stellar component in the VELA simulation, inside galactic disks
(fly-bys), during mergers, as clumps (ex-situ or in-situ) and more.
This approach benefits us with substantial low computational overhead by resources and
time with a fully comprehensive tracing of components during the simulation.
3.1.2 Merger Tree Algorithm
Merger tree (MT) algorithm is a specific algorithm used to connect halos or galaxies between
different times (two snapshots in a cosmological simulation) and identifying them as one over
time component. This subsection shows how using the specific definition of the stellar component
structure identification with other selective ideas we have adopted achieves an efficient, fast and
accurate MT.
Following the current limitation of existing common (MTs) described in (Srisawat et al., 2013;
Tweed et al., 2009) There are three main difficulties left to handle: (i) Galaxy center position
15

CHAPTER 3. METHODS
stability - Center identification is switching between 2 dense regions in the galaxy through time
(ii) Time resolution stability - Different time resolution produces different MTs as the processes
that are shorter then the snapshot timescale are mistreated (iii) Mis-identification of Satellite
flybys as mergers.
As we can see, all these major difficulties are vital for studying satellite galaxies and other
stellar components, (i) and (iii) as they specifically address misidentification of satellite dynamics
and (ii) as we want to use high resolution in time for fast mechanisms as baryon galaxies
formation. These runs called “Thin”, and they save the simulation data each 2-5 Myr instead of
170-240 Myr between snapshots on “Thick” simulation runs.
Therefore we have designed our MT in the following way: First, we use particle tracing, this
method has been proven to be robust and accurate in connecting between components at different
times. We implemented important changes that manifest in the following way:
(i) Galaxy center position stability: As shown in 3.1.1 we follow potential-well position. That is
done by following kernels of galaxies. In that way we redundant the problem of misidentifi-
cation of centers, as they counted as two objects, except the case they are very close to each
other and then they are probably bound as one kernel of the galaxy. If they count as one
object, but they are not bound, it means the case is not two components in one galaxy, and
therefore this is a flyby mode, which is covered by technique (iii).
(ii) Time resolution stability: This issue solved in 2 ways. First, we look farther in time steps,
and we connect between shared components no matter if there are snapshots in which they
do not appear. Second, we sew different galaxy branches as the same branch if they have
the same shared particles over time. Meaning, it does not matter if the shared fraction of
particles between 2 snapshots is higher than some value (Unlike the conventional approach
for MTs as shown at (Srisawat et al., 2013)), it does matter if over the branch there is a
maximization of the shared particles. This way we add a “smoothing” part that creates
a tree in the merger graph (As the merger tree is firstly a directed graph between many
objects) in the way that the maximum of the stars will go on the same line. That way we
reconnect threads and find cases objects that had disappeared on the identifier and later
returned (can occur at fly-bys).
(iii) Satellite flybys misidentification: Flybys can be identified in 3 ways: First two ways are
using the same solutions that were described in (i) and (ii). (i) Identifying kernels of galaxies
and in this way identifying satellite galaxy even inside disks of bigger galaxies. (ii) If the
satellite is not identified in that time-step in the simulation, it can be identified farther in
time by successor search or branch sewing. The third way is using a merit function to match
two snapshots (Srisawat et al., 2013). We choose the following merit function:
16

3.1. STELLAR KERNEL MERGER TREE
Merit(A,B)= (NA ∩NB)NB
(3.2)
For NA as the number of stars in the galaxy core on the younger event in time and NB the
latter one. We choose this merit function as it measures the fraction of the stars in the later
event from the older one. Meaning the physics of the galaxy B is influenced by A. If we
would have taken (NA∩NB)NA
factor in, as used in some of the MTs described at (Srisawat et al.,
2013), it means that in case of “fly-by” there would have false identification in a stage that a
satellite is identified after the occurrence in the central galaxy. Because this would zero the
merit function. As we are interested in this phenomena, we did not include this merit factor.
The main difference in this MT is that we do not check if a particle is bound or not ((Gill,
Knebe, & Gibson, 2004; Knollmann & Knebe, 2009)), nor we check the particles in the 6-phase
position and velocity space (Behroozi, Wechsler, & Wu, 2012; Cañas et al., 2018)) Meaning we
do not use an analytic physical term, we learn how much particles are “bound by practice”! A
particle is “bound by practice” for MT calculation (not for physical models) if it stays in the
stellar component for a long time, then it is bound by the literal definition of being bound and
in-depended of complications due to using analytic terms (and it is also much faster to run!)
3.1.3 Results
We can see at fig 4.3 a dark matter lose from the inner part of the galaxy! Without the same loss
of the stellar part. This total loss of dark matter shows the great power of tracing the stellar
component and specifically the gravitational potential minimum position. It directly shows that
in many cases, tracing of dark-matter particles or tracing dark matter and stars will lose the
tracing of a satellite galaxy!
This phenomenon was seen here for the first time in a cosmological simulation. However, it is
expected in simulations (Chang et al., 2013; Macciò et al., 2017) and there are observations on
galaxies with no dark matter (van Dokkum et al., 2018) and with SG with low-velocity dispersion
(Wang, Wang, Mo, Lim, et al., 2018). It is caused due to a strong tidal force that is applied
for a brief time, causing lowering the tidal radius to a very low value and by that moving the
gravitational potential well of the galaxy inward. Causing stellar and dark-matter material
outside of this radius to dis-attach from the satellite galaxy and also drive particles with eccentric
orbits outside too (high kinetic energy). As dark-matter particles are much more eccentric in
their orbit, the dark-matter is flowing outside of the galaxy even inside 0.5 kpc radius, leaving
the stellar component with lower dark matter core.
This dark matter detachment caused by the fact that stellar material formed from a gas
that has cooled down in the center of the potential well and therefore it is less energetic. While
17

CHAPTER 3. METHODS
the dark matter might be virialized at the virial radius, but does not lose all of its energy and
therefore is in eccentric orbits.
This result shows one example of a galaxy losing its dark matter and keeping its stellar
material. As this phenomenon is expected to be seen more often in eccentric orbits, it might
be a reason for not seeing much satellite UDGs in simulations before, as most of the merger
trees having difficulty in fly-bys identifications and as most of the halo finders are based on dark
matter sub-halo identification. Details about this mechanism and others are to be published in
our further work.
Note that these phenomena separated from the numerical effects described at (van den Bosch,
Ogiya, Hahn, & Burkert, 2018), as the stellar component well kept while the inner dark-matter
is pushed out. Moreover, On this case, the baryon component supposed to hold more dark matter
inside the subhalo and the SG, as the stellar component is dominating the inner core of the SG
and as it is lower energy component, its stellar mass profile is less expected to change due to tidal
force.
3.1.4 Discussion
We have presented a new way to define galaxies by their nucleus component instead of the group
of particles that are bound or just above thresholds. In that sense, we have shown our proposed
algorithm solves the current merger tree algorithm problems as described in the comparison
project of (Srisawat et al., 2013).
We have presented a case in which even a stellar merger tree would not resolve fly-bys,
especially in high eccentric orbits, which can explain systemic errors in SG merger trees, these
phenomena exist at least 10% of the SG.
In order to get another confirmation, in the future, we wish to add tracing of particles that are
next to the center of mass of the object and see where this center of mass goes to. When the traced
particles are particles inside small sphere around the center of mass of the stellar component,
those traced particles should also be consistent in several of snapshots (or all of them), in that
way we can find out the “bounded particles by practice”. This method identifies more appearances
in the simulation, including lower densities stellar component that was not identified because
they were beneath the density threshold. This method also including cases in which the stellar
component is mixed in another component and is not identified again because the identification
returns one component. We have not implemented this method yet, as the results we got are good
enough without it. Even so, we strongly feel that applying this as a redundant parallel method
would not just increase our data points but also increase our assurance and the percentages of
correct identification and can find extremely fascinating objects in cases of disagreement between
the methods.
18

3.2. GALAXY PROPERTIES
Also, note that we have purposely implemented a few redundant methods in this merger tree
in order to increase our certainty in the results and to be able to quantify it.
Finally, It is our notion that the problem of building a stable MT is solvable by applying some
version of “max network flow” algorithms such as Ford-Fulkerson, Edmonds-Karp, and others.
3.2 Galaxy Properties
3.2.1 Central Galaxies
Central galaxies analysis made in order to be consistent with previous papers (Mandelker et al.,
2016; Tacchella et al., 2016; Tacchella et al., 2016; Dekel et al., n.d.). Therefore the centering,
Rvir, and other physical quantities were kept as they were. The MT has been overridden to keep
the trunk of the central galaxies. Meaning we first force the MT with the central galaxies by
(Mandelker et al., 2016) and later we identify all the other stellar components.
The central galaxy identification was made by choosing the biggest galaxy in the latest
snapshot of the simulation and by tracing this galaxy back in time by stellar particle tracing
to previous snapshots. It was also altered to follow the same galaxies in previous generations
of the VELA suite, GEN2, later the galaxies where re-centered. The re-centering was done by
starting with a virial radius sphere around a galactic center and then by a repeating process,
finding the center of mass and taking 0.1 smaller radius sphere around the new center, then,
again and again, finding the center of mass and decreasing sphere radius, until convergence.
3.2.2 Stellar Radius
Following our more “observed” approach, we define the stellar radius, Rsat, this radius is defined
to be similar to radius definition in observations: radius that encapsulates 90% of the stellar
mass of the stellar component. We have checked other percentages as 80% and 85% that gave
similar results or even better, but we choose to define the same as observers. The mass of the
stellar component calculation dividing into two cases: (i) Isolated stellar component (ii) entangled
stellar component.
Case (i), as the component is isolated, the Mass of the component is the point at which the
mass growth is small. We chose the point for 10% radius increase. The mass increase is less than
10%. We found that the smallest radius in which ∆ ln M?(r)∆ ln r < 1
10 is a good measure for it. This
radius is defined as Rslope,0.1
Rslope,0.1 =r1 + r2
2when
∆ ln M?(r)∆ ln r
< 110
(3.3)
19

CHAPTER 3. METHODS
Case (ii), if there are two or more entangled stellar components, the radius should difference
and separate the two. The separation done by taking the radius as the distance between the
center of each component to the saddle point between the two components. Accordingly this
radius if exists, is smaller then Rslope0.1). Specifically, it is calculated dlnρdln r and looking for the
radius (r) place in which this quantity changes its sign. In case of satellite inside the central
galaxy, the satellite radius will be its own, but the radius of the central galaxy may not change at
all, as in its scale the dlnρdln r will not change its sign. We call this radii R1st ρmin
Final radius calculation: The stellar component radius is set by taking the minimum of these
two calculations, and then, similar to observations, we take the radius that holds 90% of the
stellar mass. So finally we get Rsat (stellar radius):
Rsat = R90%(Min
(Rslope,0.1,R1st ρmin
))(3.4)
This method is consistent to (Tweed et al., 2009; More et al., 2011) definition of radii. Note
that this method breaks the generic and adaptable MT algorithm we used before and choose a
method to define a galaxy. Other methods that can use here are a specific 6-phase decomposition
(Cañas et al., 2018; Behroozi et al., 2012) and bound particles calculation (Knollmann & Knebe,
2009; Gill et al., 2004) or any other specific choice.
3.2.3 Derived Masses and Radii
Rvir is the radius in which a sphere around the galaxy center encompasses over-density of ∆(z)=(18π2 −82ΩΛ(z)−39ΩΛ(z)2)/Ωm(z) , where ΩΛ(z) and Ωm(z) are the cosmological parameters at
z (Bryan & Norman, 1998). The Reff,M?is the radius that includes the half the stellar mass of
the stars included in the stellar radius of the galaxy. When in central galaxies stellar radius is
set to be 0.1Rvir due to compatibility with previous papers.
In the same way, R0.9cold mass,Mgas , R0.5cold mass,Mgas are the radii that includes 0.9 and 0.5
of the gas mass of the gas include in the stellar radius of the galaxy, when again, the central
galaxies stellar radius is set to be 0.1Rvir.
Mtot,R is defined to be the total mass include in a sphere with a R radius. also, in the same
method, Mdm,R , M?,R , Mgas,R are defined as the dark matter, stars and gas masses include in a
R radius sphere.
Other terms that shown here are cold gas and young stars when cold gas is gas with a
temperature below 1.5 ·104 K and young stars are stellar particles that formed in less than
100 M yr since the snapshot time.
20

3.3. COMPUTING FORCES
3.2.4 Main Galactic Quantities
Star-formation rate (SFR) is calculated in the following way:
SFR (R)= ⟨M?(tage<tmax) / tmax
⟩tmax
(3.5)
where M?
(tage < tmax
)is the mass of stars younger than tmax within a sphere of radius
R. The average ⟨·⟩tmax is obtained for tmax ∈ [40,80]M yr in steps of 0.2 M yr in order to reduce
fluctuations due to a ∼ 5 M yr discreteness in stellar birth times in the simulation. The tmax in
this range are long enough to ensure good statistics. more info in (Tacchella et al., 2016; Tacchella
et al., 2016)
Surface stellar density Σ?,r calculated as the stellar Mass encapsulated in a sphere with
radius r divided by π · r2.
Concentration calculated as Rsat/Re f f , Rorbit is the distance between the centers of the satellite
galaxy and the central galaxy. In the same way, vorbit is the difference in the velocities of the two.
Last, vcirc is calculated by the virial theoram: vcirc = Gmr , and specifically at the virial radius vvir,
vvir = GMvirrvir
3.3 Computing Forces
To answer the causes of quenching we should ask ourselves what are the main dynamical process
that acts on a satellite galaxy, will be shown at §5, the primary processes are: ram pressure from
the surrounding gas in the halo, tidal forces inflicted by the halo gravitational potential and
self-gravity of the satellite itself.
The conventional way to study these forces, mostly by semi-analytic models but also in
simulations, is to find the Rtidal , Rram pressure, which are the radii where the tidal force is
equal to the self-gravity force and the ram-pressure is equal to the self-gravity force. As these
approximations assume a quasi-static equilibrium which we will further show that it might
not be the usual case on satellites, we have chosen to expand the technique that was used on
the gas component at (Simpson et al., 2018). We have tried to get a better approximation by
measuring the forces as an average force on the gas and stellar component. As the gas is far from
being spherical, we have tried different methods, and we finally found that R0.9, cold gas spherical
radius is a good fit for the gas component and Rsat for the stellar component.
We have measured the forces in the following way:
3.3.1 Ram Pressure Force
Ram Pressure calculated as described at (Simpson et al., 2018; Gunn & J. Richard, 1972):
21

CHAPTER 3. METHODS
fram (r)= Pram
Σcold gas (r)· v = ρgas, environment ·v2
orbit
Σcold gas (r)· v(3.6)
ρgas, environment is the gas in front of the satellite when ρgas, environment = ∆Mgas∆V of a shell in
the halo of the central galaxy between Rorbit ±Rsat
3.3.2 Tidal Force
Tidal force per one solar mass calculated following (Dekel, Devor, & Hetzroni, 2003)
ftidal (r)= (α−1)GM(cen, Rorbit)
R3orbit
·−→r(3.7)
Where Mcen, Rorbit is the total mass encapsulate in a sphere with radius Rorbit around the
central galaxy center, Rorbit is the distance between the satellite and the central galaxy and r is
a chosen radius of the satellite galaxy. α is measured as the average density slope of the halo
α(r)=−dln ρdln r ;ρ = Mcen(r)
4π3 r3 and G is the gravitational constant.
3.3.3 Satellite Self-Gravitational Force
The SG gravity force per one solar mass can be described by Newton’s gravitational force as:
fself gravity (r)= GM(sat, r)
r2 · r(3.8)
where r is the radial distance to the center of the satellite center, M(sat, r) is the total mass of
the satellite in a r sphere, and G is the gravitational force.
3.4 Satellite Galaxies characteristics
Satellite galaxies has a specific events in time that are important in their evolution. We’ve marked
the following events:
• entering_halo_outside - Last snapshot before the satellite enter the halo
• entering_halo_inside - First snapshot after the satellite enter the halo
• entering_halo - Average values of in entering_halo_outside and entering_halo_inside
• peri− center (#i) - The #i local minimum in the orbit (discrete over snapshots)
22

3.5. CATALOG SUMMARY
• apo− center (#i) - The #i local maximum in the orbit (discrete over snapshots)
• f ·M? - Fraction f of the stellar mass from entrance to the halo remained (example: 0.9M?
will be the first snapshot the satellite galaxy has less then 0.9 of its stellar mass since
entering the halo
• f · Mcold gas, f ·Rcold gas and f ·SFR - Fraction f of the cold gas mass, cold gas effective
radius and SFR from entrance to the halo remained.
The time measured in two ways: First, thalo, the time of the satellite inside the central galaxy
halo in Gyr.
Second, tdyn, the time from the first peri-center normalized by the travel time between the
first peri-center to the first apo-center.
tdyn = tH − tH, 1st peri−center
|tH, 1st apo−center − tH, 1st peri−center|(3.9)
When tH is the time from the big bang, tH, 1st peri−center is the time of the first peri-center and
tH, 1st peri−center is the time of the first apo-center.
Rorbit/Rvir is the distance of the satellite from the central galaxy, Rorbit divided by the current
virial radius of the central galaxy, Rvir.
3.5 Catalog Summary
The calculated quantities described above and others, compiled with additional quantities from
other papers of the HUJI cosmological group are available in one catalog system. This cata-
log holds simulation snapshots meta-data, central galaxies quantities, halo properties, SGs
occurrences, and time-series data, Merger Graphs and Merger Trees, Mergers table and more...
Additional in preparation work includes component density plots (dark-matter, stars, gas, cold
gas and more...), mock-up observational pictures, 3D-model and a 3D-animation model for each
stellar component.
The central galaxies catalog includes 254 quantities for 1120 occurrences of the 34 central
galaxies in the Vela suite. It includes masses of dark matter, stars, young stars, gas, and cold gas.
Additionally, it includes SFR, different angular momentum, a 3d ellipsoid fit of the galaxy and
more. All of those quantities available with different radii around the central galaxy and in the
halo.
The Stellar Components analysis, include between 65 to 382 different quantities over 162189
occurrences of the 4369 stellar components identified by our merger tree algorithm. It includes
masses of dark matter, stars, young stars, gas, and cold gas. Moreover, it includes SFR, forces,
numerically integrated forces... All of those quantities available with different radii around the
23

CHAPTER 3. METHODS
SG. The Stellar components time-series analysis includes 4369 stellar components evolution
paths over the simulation lifetime and includes notable events in the life of the stellar component
as described at §3.4.
Other catalogs are available and would be described on the relevant in preparation paper.
The catalog themselves are available at a fast, robust and easy to use research tool called
pandas, a python library for data science.
Figure 3.1: Central galaxy catalog example
24

CH
AP
TE
R
4THE SATELLITE QUENCHING PROCESS
Let’s get our hands dirty and see how do satellite quench in the simulations. First, we
will describe our selected satellite sample (see §4.1) following with few examples (see
§4.2). Then we will show how satellite evolve with time (see §4.3) and by their distance to
the central galaxy (see §4.4) relative to the central galaxy and to the halo. All the stages above
bring us to the bothering core question: “How do satellite galaxy quench?”. We will answer this
question by the famous galaxy diagram, sSFR-Σ?, 12 kpc (see §4.5). Last, as our answer can be seen
as inconsistent with today’s satellite conception, we will settle those disagreement (see §4.6.
4.1 Satellite Galaxies Sample in the VELA Simulations
In order to understand the formation and evolution of satellite galaxies, we focus now on galaxies
that have entered the halo and were identified by the MT in at least ten snapshots, including
five inside the halo, in the way that some dynamics could be resolved. This filtering retains 214
galaxies, i.e., the majority of the galaxies that are long lived in a central galaxy halo. Among
them, we select satellite galaxies with distinguished orbit, containing at least one peri-center
and at least one apo-center. This selection allows us to track the evolution of forces throughout
the different stages of a SG orbit, which cleared out fast mergers (mostly major mergers) and
Identified secondary galaxies in the VELA suit#appearances All Enter the halo Only inside halo1 4369 528 9171 < 2009 528 18910 < 834 333 15
Table 4.1: SGs statistics: Identification & follow-up of SGs by different criterion in the VELA suit
25

CHAPTER 4. THE SATELLITE QUENCHING PROCESS
Figure 4.1: Satellite sample statistics: Statistics of long living satellites in the halo. First row(left to right): 1. SG stellar mass shows a wide range of SG masses 2. SG mass divided by the centralgalaxy stellar mass with a variety of ratios (but less major mergers as they introduce specific dynamics)3. SG cold gas mass divided by the SG stellar mass 4. SG fraction of cold gas in the halo divided by thefraction of the satellite when the fraction is the cold gas mass over the stellar mass. Second row (left toright): 5. First minimal orbital distance from the central galaxy (peri-center) divided by the virial radius ofthe halo. 6. The eccentricity of the SG orbit by first peri-center and first apo-center 7. Velocity ratio at theentrance to the halo, the orbital velocity divided by the circular velocity at the halo radius. 8. Velocity ratioat first peri-center, the orbital velocity divided by the circular velocity at the first peri-center. In thisfigure we can see the diversity of the sample, including many mass ranges and mass ratio with differentorbits, from circular to eccentric orbits.
fly-bys. We finally obtain a sample of 118 satellite galaxies; histograms of their main properties
are shown in Fig. 4.1, (The broad scope of the stellar galaxies presented at table 4.1)
The sample covers a wide range of galaxies from 106.5 to 109.5 with a mass ratio of mostly
less than 10% of the main central galaxy. Therefore includes less major mergers in the sample, as
major mergers suffer great dynamical friction and hence had short dynamical time in the halo
and can merge at the first peri-center.
The distribution of cold gas to stars mass ratio (Mcold gas /Mstars) is mostly above 1% and is
quite similar between satellite and central galaxies. We note that 18 satellites have meager cold
gas ratio because they were quenched before entering the halo. There are three possible scenarios
for this prior quenching: 1. The SG quenched by another halo first then fell onto this halo. 2. The
quenching of the SG occurred at the outskirts of the halo. 3. The SG formed on a low gas region.
Further investigation is required.
Regarding the orbit properties, we find relatively large values of SGs with high eccentricities.
That explained by the fact that ordinarily, SG enters the halo perpendicular with a filament,
or just as SG entering a the halo at tangent orbit limits the possible allowed velocities (higher
velocities would cause the SG to fly outside the halo (fly-by), and smaller would cause radial orbit,
only few would end with a circular orbit). Those high eccentric orbits of the SGs allow them to
penetrate deep in the halo at the first peri-center, reaching distances of 0.1 to 0.2 Rvir to the
26

4.2. CASE STUDIES OF SATELLITE GALAXY EVOLUTION
center of the halo. These eccentric orbits are also manifesting by the distribution of Vorbit/Vvir at
Rvir, which shows that most of the satellites enter the halo with a higher velocity. Note that for
Vorbit/Vvir at the peri-center this ratio is changed due to dynamical friction.
4.2 Case Studies of Satellite Galaxy Evolution
The following figures are 3 case studies of satellite galaxies with interesting behavior that
represent different aspects of the dynamics acting on the satellite galaxies:
1. “Fast Quenching” - satellite galaxy 07-041 4.2 is an example of the common case of SG that
loses its cold gas the first peri-center and suffers a stellar stripping and heating at each
peri-center.
2. “Slow Quenching”, “Dark-matter loss” and “eCg formation” - satellite galaxy 22-004 4.3 is
an example of a SG that loses its cold gas only at the second peri-center and looses its dark
matter mass in the SG center region, at the center of the SG potential well.
3. “Fast Quenching” and “Starvation” - satellite galaxy 23-007 4.4 is an example of the common
quenching at first peri-center and starvation, a halt in gas accretion.
Fig 4.2 at first row shows a typical case of SG evolution. A gas-rich galaxy enters the halo
and loses its gas at the first peri-center and therefore stop forming stars. Initially, the stellar
component increases until near the peri-center owing to star formation; it then sharply decreases
(less than 100 Myr)due to the stripping process is seen as lose of stellar mass at Rsat) and heating
in the center of the SG which is seen as mass loss at 0.5 kpc radius of the SG. Regarding the
trajectory, the SG stays in a constant orbit around the central galaxy and does not merge. We can
see no accretion of gas, which here is not a cold gas on later time as the gas component in Rsat
does not reach the center of the galaxy.
We can also see in fig 4.2 second row a correlation between cold gas, sSFR, and young stars.
All of them active in the same way before the first peri-center, and all of them are quiescent at
after the first peri-center at the same time. It may be a trivial assumption, as they somewhat
depended on each other in the simulation and calculation (SFR). However, it demonstrates why
measuring one of them is enough to describe the SFR change. Note that the gas component is not
correlative to star formation; therefore, we mainly focus on cold gas and not on total gas.
The last row of Fig 4.2 shows a plot of various SG properties against the distance to the center.
We find a mass increment at peri-center with heating at the 0.5 kpc radius, together with a sharp
cut in the star formation with a later relaxation in each apo-center, the heating and stripping
also continue in each peri-center after. No stellar change is shown between the apo-center to the
peri-center.
27

CHAPTER 4. THE SATELLITE QUENCHING PROCESS
Figure 4.2: Satellite galaxy 07-041 evolution (Total halo mass 9.5 ·1011M¯, central galaxy stellarmass 5.8 ·1010M¯ at halo entrance): Each plot depicts a satellite property against the time or against thedistance, and splits to two columns; left column focuses on the SG enclosed in a sphere in Rsat radius andright column focus on the 0.5 kpc radius sphere. By rows, the first row describes basic galactic parametersover time in halo: Rorbit (blue), Rvir, o.1Rvir (dashed lines), dark matter mass (purple), stellar mass (red),gas (green). The second row describes additional star formation related parameters: in addition to theRorbit and Rvir over time in halo, which are the sSFR (orange), cold gas mass (light green) and young stars(cyan). The last row describe important quenching and stripping parameters depending on the distance tothe central galaxy normalized by their amount while entering Rvir: sSFR, stellar mass and cold gas (withthe same coloring as before). This figure present fast quenching case of a SG. We can see the SG enterthe halo at the point the blue line Rorbit intersects with the grey dashed line Rvir. Later around the firstperi-center which is the minimum of the blue line, we can see by the light green and orange lines that theSG losses its cold gas component very sharply (less than 100 Myr) and stop forming stars. Moreover, byfollowing the red lines in both of the columns, we can see stellar heating and stripping which lowers theSG stellar mass to 10% of its original mass
28
4.2. CASE STUDIES OF SATELLITE GALAXY EVOLUTION
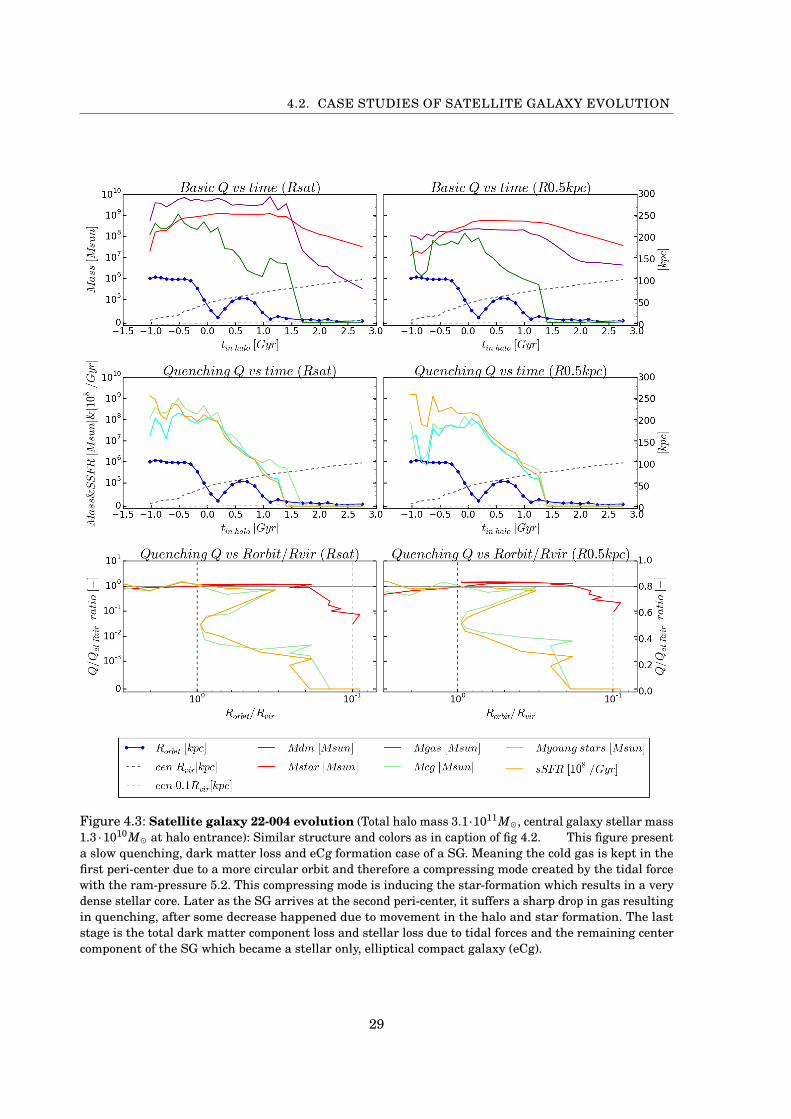
Figure 4.3: Satellite galaxy 22-004 evolution (Total halo mass 3.1·1011M¯, central galaxy stellar mass1.3 ·1010M¯ at halo entrance): Similar structure and colors as in caption of fig 4.2. This figure presenta slow quenching, dark matter loss and eCg formation case of a SG. Meaning the cold gas is kept in thefirst peri-center due to a more circular orbit and therefore a compressing mode created by the tidal forcewith the ram-pressure 5.2. This compressing mode is inducing the star-formation which results in a verydense stellar core. Later as the SG arrives at the second peri-center, it suffers a sharp drop in gas resultingin quenching, after some decrease happened due to movement in the halo and star formation. The laststage is the total dark matter component loss and stellar loss due to tidal forces and the remaining centercomponent of the SG which became a stellar only, elliptical compact galaxy (eCg).
29

CHAPTER 4. THE SATELLITE QUENCHING PROCESS
Fig 4.3 shows an extremely interesting case an “Slow Quenching”, “Dark-matter loss” and
“eCg formation” SG. The satellite does not quench at first peri-center, but on the second peri-center,
it keeps forming stars and undergoes stellar growth in its center. Finally, we see a sharp drop in
the dark matter component in the middle of the satellite whereas the stellar mass decreases less.
This dark matter loss is a potentially interesting mechanism explaining how a galaxy may lose
most of its dark matter component, even at its center while remaining a long-lived stellar galaxy.
Its orbit is circular, which results in less stripping, as will be seen later. Finally, We stress that
this example is the first eCg (elliptical compact galaxy) to be found in a cosmological simulation;
this is thanks to resolution and to the merger tree algorithm that we used, as explained in §3.1.
This SG is an example of an initial condition for a gas-dominated object that formed inside a
filament and which, upon entering the halo, results in an eCg. This eCg formation case is similar
to a specific simulated galaxy run by (Du et al., 2018).
Our tidal and ram pressure analysis presented in §5.2 shows that this situation arises in a
compaction scenario, in which the tidal forces compress the gas along one direction and the ram
pressure along another the opposing direction with about the same intensity. This compressive
state allows the gas to stay inside the galaxy for an additional orbit, resulting in higher young
stars population and thus enabling the creation of an eCg.
Lastly, Fig 4.4 is another example of SG fast quenching in the peri-center, with one difference,
there is no accretion of cold gas to the satellite, This is an example for the starvation process
which will is described at the Pac-Man model at §5.5 Note that this galaxy is puffing-up due to
tidal forces as shown by a drop in the stellar mass in the inner 0.5 kpc and later relaxation as
shown by the delayed drop in stellar mass at the stellar radius sphere.
4.3 Evolution of Satellites as a Function of Time
This section describes the evolution of satellite properties as a function of time. The evolution
is stacked either against the time spent by the SG in the halo (in the observer’s referential) or
against td yn as described in Section 3.4. The latter is stacking against the first peri-center and
the first apo-center in order to study orbital dependencies.
Fig 4.5 shows the evolution of SGs by time spent in halo, and reveals several features. First,
we observe a sharp drop in sSFR which shows that overall, quenching of SGs is a rapid process.
The star formation starts to drop after around 0.5 Gyr. Even though some cold gas is remaining,
By 1 Gyr, the SGs has stopped forming stars. Note that the gas mass in any point in the halo does
not increase which suggests that starvation is at least a general phenomena. Simultaneously,
we observe an increase in both the stellar mass and the inner 0.5 kpc radius stellar mass until
about 0.5 Gyr, after which both properties start to decrease while the surface density decrease
30

4.3. EVOLUTION OF SATELLITES AS A FUNCTION OF TIME
Figure 4.4: Satellite galaxy 23-007 evolution (Total halo mass 2.4·1011M¯, central galaxy stellar mass3.6 ·109M¯ at halo entrance): Similar structure and colors as in caption of fig 4.2. This figure presenta fast quenching, and starvation, halt in gas accretion case of a SG. We can see at the first peri-centerquenching of the SG and that on a later time, 1.1 Gyr time in the halo, the SG travels through a cold gasregion and do not accrete it as described at our starvation model at §5.5
31
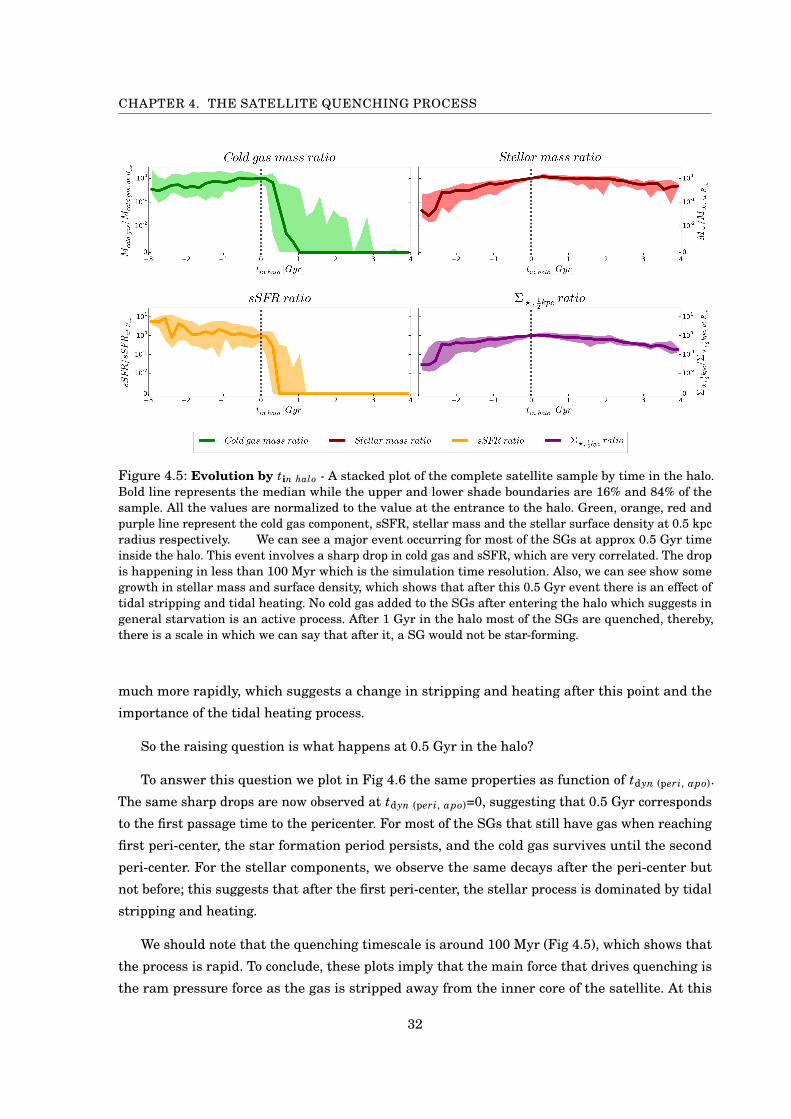
CHAPTER 4. THE SATELLITE QUENCHING PROCESS
Figure 4.5: Evolution by tin halo - A stacked plot of the complete satellite sample by time in the halo.Bold line represents the median while the upper and lower shade boundaries are 16% and 84% of thesample. All the values are normalized to the value at the entrance to the halo. Green, orange, red andpurple line represent the cold gas component, sSFR, stellar mass and the stellar surface density at 0.5 kpcradius respectively. We can see a major event occurring for most of the SGs at approx 0.5 Gyr timeinside the halo. This event involves a sharp drop in cold gas and sSFR, which are very correlated. The dropis happening in less than 100 Myr which is the simulation time resolution. Also, we can see show somegrowth in stellar mass and surface density, which shows that after this 0.5 Gyr event there is an effect oftidal stripping and tidal heating. No cold gas added to the SGs after entering the halo which suggests ingeneral starvation is an active process. After 1 Gyr in the halo most of the SGs are quenched, thereby,there is a scale in which we can say that after it, a SG would not be star-forming.
much more rapidly, which suggests a change in stripping and heating after this point and the
importance of the tidal heating process.
So the raising question is what happens at 0.5 Gyr in the halo?
To answer this question we plot in Fig 4.6 the same properties as function of tdyn (peri, apo).
The same sharp drops are now observed at tdyn (peri, apo)=0, suggesting that 0.5 Gyr corresponds
to the first passage time to the pericenter. For most of the SGs that still have gas when reaching
first peri-center, the star formation period persists, and the cold gas survives until the second
peri-center. For the stellar components, we observe the same decays after the peri-center but
not before; this suggests that after the first peri-center, the stellar process is dominated by tidal
stripping and heating.
We should note that the quenching timescale is around 100 Myr (Fig 4.5), which shows that
the process is rapid. To conclude, these plots imply that the main force that drives quenching is
the ram pressure force as the gas is stripped away from the inner core of the satellite. At this
32

4.4. EVOLUTION OF SATELLITES VERSUS THE DISTANCE TO THE CENTRAL GALAXY
Figure 4.6: Evolution by tdyn (peri, apo) - A stacked plot of the complete satellite sample by dynamicaltime as defined on §3.4. Similar structure and colors as in caption of fig 4.5. We recall that the time scaleand offset are chosen such that t=0 is set as first peri-center and t=1 is set as first apo-center, by this linearapproximation method, t=2 would be around the second peri-center an so on. We can see that most ofthe SG quenching occurs at the first peri-center (tdyn (peri, apo) = 0), as a sharp drop in cold gas and sSFRhappens. And utmost of the SGs quench after the second prei-center (tdyn (peri, apo) = 2). Also as mentionedat Fig 4.5 we can see that as time in halo passes the stellar surface density and the stellar mass of the SGis decreasing but with increasing of its variance.
stage of time evolution, the stellar part is mostly intact as it decreases slightly there.
4.4 Evolution of Satellites Versus the Distance to the CentralGalaxy
This section describes the evolution of SG properties as a function of distance to the central
galaxy.
The evolution is stacked against the SG distance to the central galaxy normalized by the virial
radius, Rorbit/Rvir, either for all identified occurrences of the SG (in the observer’s referential) or
all occurrences until first peri-center.
Fig. 4.7 shows that most of the galaxies in the halo are quenched, as they do not form stars
and do not contain cold gas. Unlike galaxies outside of the halo, which are usually star-forming,
as was shown in Section 4.1. The Stellar mass ratio decreases as Rorbit gets small, starting from
about Rorbit ∼ 0.3Rvir. Therefore, we should find below this limit deformed stripped satellites; we
also expect them to feature a stellar mass drop within their core due to heating.
33

CHAPTER 4. THE SATELLITE QUENCHING PROCESS
Figure 4.7: Evolution by Rorbit/Rvir - A stacked plot of the complete satellite sample by Rorbit/Rvir.Similar structure and colors as in caption of fig 4.5. we can notice that first, most of the SG in the haloare quenched. Second, the more SG is close to the central galaxy, the more it is disrupted with high varietyin disruption types, due to tidal forces, this disruption happens mostly at range which is less than 0.3Rvir.
Another interesting point, which contradicts the theory suggested by Woo et al. (2017), is that
we do not observe significant stellar mass growth.
A more thorough explanation is provided by interpreting Fig. 4.8 in terms of evolution until
the first peri-center. We observe no major evolution of the SG properties until the first peri-center.
Most changes viewed in Fig. 4.7 occur due to the post pericenter effect, including the appearance
of disrupted quenched satellites. We, therefore, conclude that any quenched disrupted galaxy
around halo has already passed at least once around the peri-center of its orbit.
Regarding the evolution of the stellar mass and cold gas, we have already seen that after the
first peri-center, neither the gas nor the stellar masses grow; it drops for the gas mass. We also
note that Fig. 4.8 shows that even before the first peri-center, no significant growth observed
either which again suggests starvation mechanism is active.
4.5 Nun Path (נ) - Evolution Track by star formation vscompactness
Now that we have better understood the evolution of the satellites with respect to time and
location, one remaining point is to study their evolution on the general diagram of specific star
formation (sSFR) vs. inner surface density (Σ?, 12 kpc). This diagram will allow us to address our
34

4.5. NUN PATH (נ) - EVOLUTION TRACK BY STAR FORMATION VS COMPACTNESS
Figure 4.8: Evolution by Rorbit/Rvir until first peri-center - A stacked plot of the complete satellitesample by Rorbit/Rvir. Similar structure and colors as in caption of fig 4.5. We can see here that beforethe peri-center, even relatively close to the central galaxy at 0.3Rvir there is no drop in cold gas mass,meaning there is importance to the peri-center itself instead of just the distance. We can also see thatthere is no significant growth in stellar mass or cold gas mass relating the distance, meaning the tidalheating or stripping are less active before the first peri-center and there is no significant gas accretion onthose regions.
original question, namely, how do satellites evolve and quench with respect to the central galaxies.
We show in Fig. 4.9 satellite galaxy evolution tracks in the diagram of sSFR-Σ?, 12 kpc. In this
representation, the track of a satellite evolution has the same shape as the Hebrew letter Nun ,(נ)and divided into three major stages of evolution: (1) Halt in gas accretion with SG compaction
at high sSFR as the SG keeps forming stars (2) Gas removal and rapid drop in the sSFR at the
peri-center of its orbit within the host halo (3) Stellar heating and stripping that may lead to
coalesce with the halo center, an ultra-diffuse galaxy (UDG), a compact elliptical galaxy (eCg) or
a globular cluster (GC).
The first stage lasts until reaching the first peri-center and “delays quenching”. Then, at
the peri-center region, the cold-gas sharply drops due to ram-pressure. Last by tidal forces and
depending on the orbit type and the mass ratio between the satellite and central galaxy, either
a merger, a UDG, a compact elliptical galaxy (eCg) or even a globular cluster (GC); a short
explanation is provided in Chapter §5, and a longer one in a future article.
Beyond the population averages, we show in Fig. 4.10 not normalized evolution tracks of four
different individual satellites. They are reasonably similar to the stacked trajectories, which
confirms that deviations from the average normalized trajectory are small. Moreover, we do not
35

CHAPTER 4. THE SATELLITE QUENCHING PROCESS
Figure 4.9: Nun (נ) path - SGs Evolution tracks in the diagram of sSFR-Σ?, 12 kpc - Stacked picture
of 89% of satellite galaxy evolution tracks. Each track is normalized by its maximum star formation rateand by its average surface density at quenching. The solid line shows the average track of the satellitepopulation and the gray area correspond to the 16% and 84% percentiles. The solid line colored as afunction of the satellite distance from the center normalized by the virial radius of the central galaxy.The SG evolution track looks like the Hebrew letter Nun (נ) which is divided to 3 major evolution stages:(1) Halt in gas accretion with SG compaction at high sSFR as the SG keeps forming stars (2) Gas removaland rapid drop in the sSFR at the peri-center of its orbit within the host halo (3) Stellar heating andstripping that may lead to coalesce with the halo center, an ultra-diffuse galaxy (UDG), a compact ellipticalgalaxy (eCg) or a globular cluster (GC).
36

4.5. NUN PATH (נ) - EVOLUTION TRACK BY STAR FORMATION VS COMPACTNESS
Figure 4.10: 4 Satellites Galaxies in the Diagram of sSFR-Σ?, 12 kpc - Each plot represent the total
evolution of a SG from birth, first identification until last identification. Major events in the SG lifetime aremarked with a specific marker. Halo entrance event (last outside the halo and first inside the halo), firstand second peri-centers, first and second apo-centers and amount of masses loss, cold gas and stellar mass.We can see that a distinguish Nun path can be observed in each one of the SG, Sharp drop in sSFR due toram-pressure and then a significant stellar mass loss, when this whole mechanism is independent fromthe stellar surface densities.
find any correlation between the quenching event of the satellites and their surface density. This
lack of correlation is in contrast with field galaxies, whose evolution track significantly depends
on their surface density (Dekel et al., n.d.; Tacchella et al., 2016).
This lack of correlation best illustrated by Fig. 4.11, which shows evolution tracks for Satellite
and field galaxies. Notwithstanding the field galaxies with stellar surface density above 1010.5
quench by halo mass quenching process as described at §1.1, at SG in its mass range, the
quenching is unrelated to stellar surface density. We, therefore, deduce from Fig. 4.11 that
galaxies with stellar surface density smaller than 1010.5 quench mostly based on their orbit, and
more specifically on their peri-center. Above this value, satellite quenching should occur via the
same mechanism as field galaxies by halo mass quenching process §1.1. Halo mass quenching
37

CHAPTER 4. THE SATELLITE QUENCHING PROCESS
is based on stellar density and AGN, which are an internal process. Therefore, it should not be
affected by the environmental mechanisms of the halo. In the best case scenario, this quenching
process should be even enhanced.
7.0 7.5 8.0 8.5 9.0 9.5 10.0
log Σ⋆1 [M⊙ kpc−2 ]
−2.5
−2.0
−1.5
−1.0
−0.5
0.0
0.5
1.0
logsSFR
[Gyr−1
]
High−mass galaxies
8.5 9.0 9.5 10.0 10.5 11.0
M⋆
Figure 4.11: Satellites and field galaxies evolution tracks in the diagram of sSFR-Σ? Left fig: SGevolution track, starting from the first event in the halo, marked with first peri-center life event and 10%stellar mass loss life event. Colored by normalized distance to the central galaxy. Right fig: Field galaxyevolution path presents the typical halo mass quenching process. The coloring here is by the field galaxystellar mass. These to figures are summarizing the full quenching process, below 1010.5, quenchingcan be caused by SG quenching process as described in this thesis and above, whenever it is a field or SGthe galaxy would quench at that mass scale when the later difference would be additional stripping on thecase of SG.
4.6 Comparison to Observations
We’ve Mentioned on §1.2 that there is a mass dependency of the SGs to fraction of quenched
SGs, example can be seen on fig 4.12. We stated in §1.2 that the SGs to fraction of quenched
SGs depends on the mass, as illustrated by Fig. 4.12. Additionally, we said in the same section
that the surface density increases after quenching, as illustrated by Fig. 1.3. How are both these
observations consistent with our proposed model, which states that quenching mostly depends on
peri-center properties and only mildly the SG mass?
We now look at Fig. 4.12, which shows the fraction of quenched galaxies as a function of the
stellar mass for satellites around halos of 1012M¯ as well as for field galaxies with the same
mass. We can see that most of the galaxies in this mass range that undergo quenching are SGs,
demonstrating that for masses below around 1010.5 M¯ (our mass quenching criterion), quenching
is regularly a SG quenching mechanism
The conventional explanation in the literature is that there is a clear transition near 107 −108 M¯; under this range, quenching occurs faster [than with the field galaxy mechanism]. Here,
38

4.6. COMPARISON TO OBSERVATIONS
5 6 7 8 9 10Log Stellar Mass
0.0
0.2
0.4
0.6
0.8
1.0Q
uench
ed F
ract
ion
NSA
Local Group
LMC
SM
C
Figure 4.12: Fraction of quenched satellites as a function of galaxy stellar mass (solid line), along withfraction of quenched field galaxies (dashed line). The data comprise three samples: dwarfs in the LocalGroup (black squares), more massive satellites from the NSA catalog after correction for contamination(green circles). Slater and Bell (2014): There is a clear transition near 107 −108 M¯ from nearlyubiquitous quenching of satellites at low mass to much lower quenched fractions at higher masses.
we suggest that this transition depends on the time spent by the SG in the halo. As the dynamical
friction is proportional to the ratio of the mass of the halo over the mass of the SG (Mo, van den
Bosch, & White, 2010), less massive SGs, spend more time in the halo than massive SGs as they
will suffer less dynamical friction. Therefore we should normalize this observable by dynamical
time spent in the halo. Moreover, as shown by the Nun path described in §4.5 we should also
include the galaxies that underwent tidal stripping and whose mass, therefore, is underestimated.
We argue that both of these effects would produce the same result.
This proposed interaction can be validated by observation, as it implies that among the
quenched SGs, dense SGs should outnumber diffused ones. Indeed, dense SGs are more likely
to survive several peri-centers whereas diffused are expected to disrupt tidally. Therefore, all
the observed diffused SGs are at an early stage of entrance into the halo. We note that this is
slightly counter-intuitive, as diffused galaxies have shallower potential wells, their surrounding
gas should be less bound and therefore should be more likely to be stripped apart. Nonetheless,
Fig. 4.13 from (Omand et al., 2014) confirms our claim: quenched fraction of SGs compared to
field galaxies, contains higher fraction of dense SGs than diffused SGs. Other researchers have
reported similar results; for instance, in (Wang, Wang, Mo, Lim, et al., 2018; Wang, Wang, Mo,
van den Bosch, et al., 2018) the authors have shown that the bigger the bulge to disk ratio is in a
SG, the more likely it is to be quenched SG.
39

CHAPTER 4. THE SATELLITE QUENCHING PROCESS
7 8 9 10 11 12-0.5
0.0
0.5
1.0
1.5
7 8 9 10 11 12log(M*/MO •)
-0.5
0.0
0.5
1.0
1.5
log(
Re (
kpc)
)
Centrals
7 8 9 10 11 12-0.5
0.0
0.5
1.0
1.5
0.0 0.1 0.2 0.3 0.4 0.5 0.6 0.7 0.8 0.9 1.0
Quiescent Fraction
7 8 9 10 11 12-0.5
0.0
0.5
1.0
1.5
7 8 9 10 11 12log(M*/MO •)
-0.5
0.0
0.5
1.0
1.5
log(
Re (
kpc)
)
Satellites
7 8 9 10 11 12-0.5
0.0
0.5
1.0
1.5
0.0 0.1 0.2 0.3 0.4 0.5 0.6 0.7 0.8 0.9 1.0
Quiescent Fraction
7 8 9 10 11 12-0.5
0.0
0.5
1.0
1.5
7 8 9 10 11 12log(M*/MO •)
-0.5
0.0
0.5
1.0
1.5lo
g(R
e (kp
c))
Centrals
7 8 9 10 11 12-0.5
0.0
0.5
1.0
1.5
0.0 0.1 0.2 0.3 0.4 0.5 0.6 0.7 0.8 0.9 1.0
Quiescent Fraction
Figure 4.13: The central (left) and satellite (right) galaxy quiescent fraction as a function of stellar massM? and effective radius Re. Contours are spaced every 0.1 in quiescent fraction. The dashed line indicatesconstant M∗/R1.5
e . Solid and dashed, white contours indicate the region where the number density ofgalaxies contributing to the calculation is greater than 100 per bin, and 20 per bin, respectively. Thisrepresentation demonstrates that the quiescent fraction does not depend only on stellar mass, but also ongalaxy structure. By Omand et al. (2014)
Fig. 4.14 also shows that there are more dense SGs than dense field galaxies. This more
extensive range of density variation is due to the tidal stripping and heating, which produce
a diversity of SGs, and well predicted by our examples. It is also consistent with the work of
Hartley, Conselice, Mortlock, Foucaud, and Simpson (2015), who showed that the power-law
slopes of massive SG are systematically steeper than those of lower mass SG. They expected a
higher number of low-mass SG and suggested that SG disruption could explain these results.
The extensive work of Omand et al. (2014) also includes a model in which they take the star-
forming field galaxy distribution and check different mechanisms to get the same SG quenched
fraction distribution. If in addition to cutting from the field galaxies population part of the Re f f in
their model, they had decrease part of the M?, applying tidal heating and stripping (Shifting left
the dense population). They could have had a satisfying fit between the field galaxies population
after the transformation to the observed SG population. As this thesis is limited by size while the
work of Omand et al. (2014) should be explained with enough details, we did not include the full
explanation here, and we encourage the reader to follow the work of Omand et al. (2014) together
with this explanation.
One last support for our claim comes from (Tacchella et al., 2017), which by age measuring
techniques showed that dense SGs are older than dense field galaxies, whereas diffused SGs
are younger than the diffused field galaxies. This age - density correlation is consistent with our
40

4.6. COMPARISON TO OBSERVATIONS
7 8 9 10 11 12-0.5
0.0
0.5
1.0
1.5
7 8 9 10 11 12log(M*/MO •
)
-0.5
0.0
0.5
1.0
1.5
log(
Re (
kpc)
)
7 8 9 10 11 12-0.5
0.0
0.5
1.0
1.5
0.00 0.05 0.10 0.15 0.20 0.25 0.30 0.35 0.40 0.45 0.50 1.00
Satellite Fraction
Figure 4.14: The satellite fraction as a function of stellar mass M? and effective radii Re f f . Differencesbetween coloured contour levels are statistically significant within the solid white contours, which indicatethe region where the number density of galaxies contributing to the calculation is greater than 100 perbin. The dashed, white contours indicate a lower number density of 20 per bin; correlations outside thisregion are of low statistical significance. By Omand et al. (2014)
finding that dense satellites are more resistant to tidal forces than diffused ones.
Interestingly, our proposed model solves some of the inconsistencies regarding the ram-
pressure efficiency, which is sometimes too strong and sometimes too weak in SAMS. Indeed, our
model predicts that the stellar time in the halo and the orbit are more important than the dark
matter sub-halo time which as we have shown §3.1.3 is not always correlated.
Moreover, our model can explain the inconsistencies of Fig. 1.3. Indeed, as the graph binned by
mass, some (we will claim most) of the dense quenched galaxies are remnants of bigger galaxies
that were quenched and later stripped from their outer stellar sphere, keeping only their dense
core to orbit the halo. Indeed we showed that the stellar component could decrease by 10%-90%
and continue in orbit as a very compact stellar galaxy.
Finally, our model predicts that SGs with a mass ratio above 1010.5 should quench as central,
which is confirmed by (Gabor & Davé, 2014; Wang, Wang, Mo, Lim, et al., 2018).
41


CH
AP
TE
R
5ORIGINS OF SATELLITE GALAXY QUENCHING
What are the causes of the quenching of satellite galaxies? We will explore the main
driving forces acting on satellites (see §5.1) followed by some case studies (see §5.2) and
analysis in different regimes (as a function of time in §5.3 and as a function of distance
to the central galaxy in §5.4 ). We will propose an explanation to “starvation” (§5.5), which is the
halt of gas accretion, and review additional quenching causes (§5.6), illustrating why they are
sub-dominant. Later, the results of this work are later compared to observations (§5.7).
5.1 Main Quenching Causes
Let’s begin by listing all the possible mechanisms operating on a SG: the gravitational force (both
self-gravity and the tidal force), environmental gas flow forces (ram-pressure, Kelvin-Helmholtz
instability, shock or gas turbulence), starvation – i.e. the lack of gas accretion –, feedback (gas
outflows due to radiation, SNs, etc), gas depletion by star formation and the influence of magnetic
fields.
We will focus in this section on the tidal force, ram-pressure and self-gravity assuming that
starvation is a mechanism active at all time and that the other mechanisms are sub-dominant. We
will later justify those assumptions with the starvation “Pac-Man” model (§5.5) and an analysis
of possible SG quenching mechanisms (§5.6). We wish to emphasize that since starvation is an
active mechanism, no new gas enters the SG; therefore, the quenching process depends only on
the gas inside the SG. This means we only need to find a mechanism to remove the gas out of the
SG: once the gas is outside the SG, the SG will not accrete it again because of starvation.
If we wish to choose one dominating quenching mechanism out of those three proposed
43

CHAPTER 5. ORIGINS OF SATELLITE GALAXY QUENCHING
mechanisms, the answer is clear. In §4, we showed that the gas, and specifically the cold gas, of
any SG is vanishing rapidly after entering the halo (in relation with the pericenter) while the
stellar mass of the SG is kept for a much longer time. This indicates that the primary mechanism
affecting the SG is acting only on the gas component. Amongst the two possible sources, one
is related to gravity (the tidal force) and the other to pressure on gas (ram-pressure), so there
are not many options left —- the dominant force quenching the SG needs to be ram pressure
stripping.
We now wish to quantify the different mechanisms: when, where and to what extent are they
active. We will describe the forces following a method described in §3.3. As the VELA central
galaxies halos are approximately isothermal, we will approximate the tidal force as an isothermal
tidal force. Using the Dekel et al. (2003) model, this means that α, the average density slope is
α= 2 and that the maximum outward force is equal to the maximum inward force. From now on,
we will use subscripts s, h, and g to refer to quantities pertaining respectively to the satellite, to
the halo, and to the cold gas.
Following the derivations from §3.3 we have
P ≡ fram(rg
)= ρg, h ·u2
Σg,s(rg
) = ρg,h(R) ·u2
ρg,s(rg) · 43 r
(5.1)
T ≡ ftidal(rg
)≈ GMh, R · rR3 = V 2
R2 · rg(5.2)
G ≡ fself gravity(rg
)= GMs, rg
r2g
= v2
rg(5.3)
where
• R is the distance from the central galaxy to the SG (previously noted Rorbit),
• rg the radius of the cold gas,
• u, the orbital velocity of the SG (vorbit),
• ρg, h(R) (resp. Σg,h) the local density (resp. surface density) of the cold, halo gas at R,
• ρg, s (resp. Σg,s) the average cold gas density (resp. surface density) in the SG,
• V and v the halo and satellite circular velocities at R and r respectively,
• Mh,R, Ms,r the total mass enclosed in spheres of radii R and r respectively,
• and G the gravitational constant.
The second step between (5.2) and (5.3) uses the virial theorem, V 2 = GMR .
44
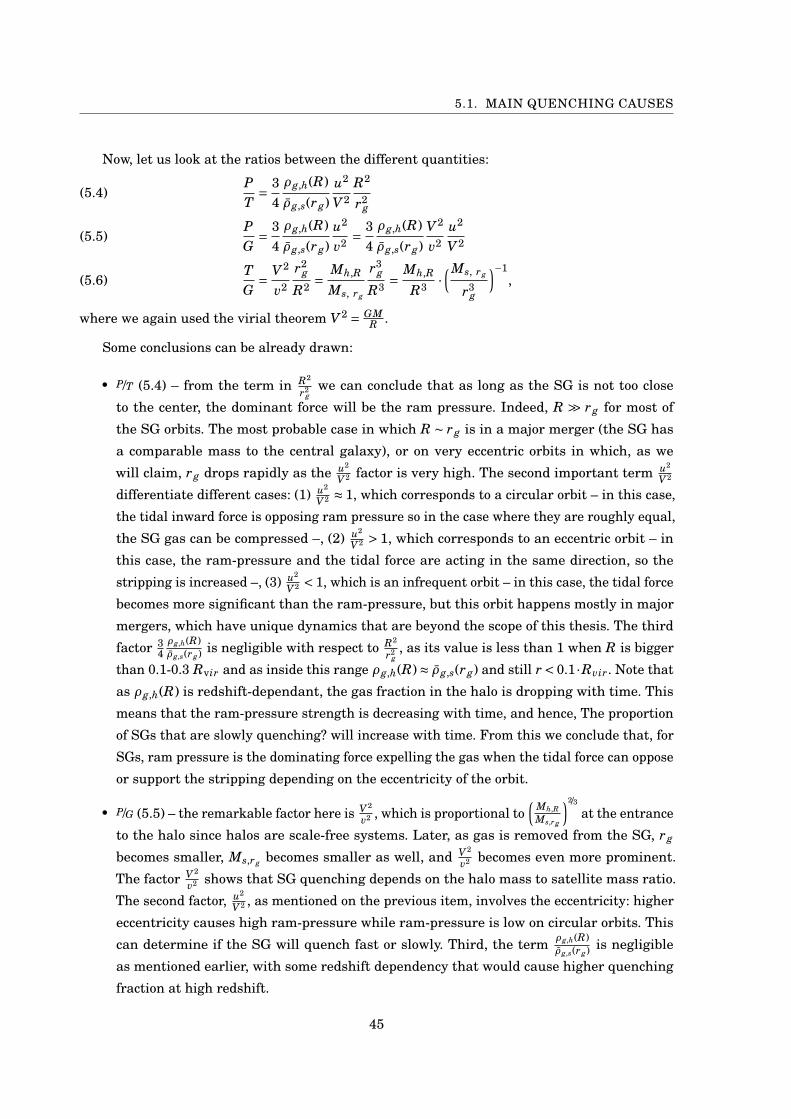
5.1. MAIN QUENCHING CAUSES
Now, let us look at the ratios between the different quantities:
PT
= 34ρg,h(R)ρg,s(rg)
u2
V 2R2
r2g
(5.4)
PG
= 34ρg,h(R)ρg,s(rg)
u2
v2 = 34ρg,h(R)ρg,s(rg)
V 2
v2u2
V 2(5.5)
TG
= V 2
v2
r2g
R2 = Mh,R
Ms, rg
r3g
R3 = Mh,R
R3 ·( Ms, rg
r3g
)−1,(5.6)
where we again used the virial theorem V 2 = GMR .
Some conclusions can be already drawn:
• P/T (5.4) – from the term in R2
r2g
we can conclude that as long as the SG is not too close
to the center, the dominant force will be the ram pressure. Indeed, R À rg for most of
the SG orbits. The most probable case in which R ∼ rg is in a major merger (the SG has
a comparable mass to the central galaxy), or on very eccentric orbits in which, as we
will claim, rg drops rapidly as the u2
V 2 factor is very high. The second important term u2
V 2
differentiate different cases: (1) u2
V 2 ≈ 1, which corresponds to a circular orbit – in this case,
the tidal inward force is opposing ram pressure so in the case where they are roughly equal,
the SG gas can be compressed –, (2) u2
V 2 > 1, which corresponds to an eccentric orbit – in
this case, the ram-pressure and the tidal force are acting in the same direction, so the
stripping is increased –, (3) u2
V 2 < 1, which is an infrequent orbit – in this case, the tidal force
becomes more significant than the ram-pressure, but this orbit happens mostly in major
mergers, which have unique dynamics that are beyond the scope of this thesis. The third
factor 34ρg,h(R)ρg,s(rg) is negligible with respect to R2
r2g, as its value is less than 1 when R is bigger
than 0.1-0.3 Rvir and as inside this range ρg,h(R)≈ ρg,s(rg) and still r < 0.1 ·Rvir. Note that
as ρg,h(R) is redshift-dependant, the gas fraction in the halo is dropping with time. This
means that the ram-pressure strength is decreasing with time, and hence, The proportion
of SGs that are slowly quenching? will increase with time. From this we conclude that, for
SGs, ram pressure is the dominating force expelling the gas when the tidal force can oppose
or support the stripping depending on the eccentricity of the orbit.
• P/G (5.5) – the remarkable factor here is V 2
v2 , which is proportional to(
Mh,RMs,r g
)2/3at the entrance
to the halo since halos are scale-free systems. Later, as gas is removed from the SG, rg
becomes smaller, Ms,rg becomes smaller as well, and V 2
v2 becomes even more prominent.
The factor V 2
v2 shows that SG quenching depends on the halo mass to satellite mass ratio.
The second factor, u2
V 2 , as mentioned on the previous item, involves the eccentricity: higher
eccentricity causes high ram-pressure while ram-pressure is low on circular orbits. This
can determine if the SG will quench fast or slowly. Third, the term ρg,h(R)ρg,s(rg) is negligible
as mentioned earlier, with some redshift dependency that would cause higher quenching
fraction at high redshift.
45

CHAPTER 5. ORIGINS OF SATELLITE GALAXY QUENCHING
• T/G (5.6) – we can see here that there is a dependency between two “average densities”: the
halo density at R and the SG density at rg (The same analysis can also be done for rs, the
stellar component radius). If the SG is in a region where the halo density is higher than
the SG density, the tidal force will be stronger than gravity. However, as the SG is denser
in most of its orbit region, gravity is stronger than the tidal force. Therefore, stripping
occurs mainly (1) during major mergers for which both of the densities are equal, (2) for
diffuse SG, which have lower densities – for example when a UDG enters the halo or after
a SG becomes a UDG due to tidal heating at the pericenter –, (3) for SGs that are in very
eccentric orbits and therefore enter the very dense region of the central galaxy. We have
shown that ram-pressure is stronger than the tidal force in these cases, which means that
this effect acts mostly on stars. It explains why dense SGs survive more the diffused SG as
shown in §4.6.
5.2 Case Studies of Satellite Galaxy Force Evolution
The following figures highlight three case studies of SGs seen in 4.2.
The “Fast Quenching” case shown in Fig. 5.1 demonstrates the analytic development we have
shown earlier. Until the first pericenter, ram-pressure and the tidal force are smaller than the
self-gravitational force, which keeps the cold gas inside the SG and enables it to continue to form
stars. At the pericenter, there is a steep rise in ram-pressure and tidal force that expells all the
gas from the SG. As can be seen, ram-pressure is the dominating force in this quenching process.
Later on, at the pericenters, we can see stellar mass stripping as the tidal force becomes active.
Our calculation does not exactly apply at pericenter in this example, which means that at the
pericenter itself, ram-pressure and the tidal force are more dominant relative to the self-gravity,
which keeps the same intensity.
The “Slow Quenching”, “Dark-matter loss” and “eCg formation” quenching case study shown
in Fig. 5.2, This SG shows a very different behaviour than before: at the first pericenter, the ram
pressure and the tidal force acting on the SG have approximately the same magnitude and are
smaller than the SG self-gravity. This means that the tidal force along the velocity of the SG acts
against ram-pressure. Because that in the isothermal regime, the maximum tidal force outwards
equals to the force inwards as the satellite velocity is perpendicular to the distance of the SG to
the central galaxy. Hence the tidal force inward component is acting in the opposite direction
to the ram-pressure. This case causes compaction of the SG gas, enhancing star-formation and
keeping the gas inside the SG.
As can be seen, this SG orbit is mostly circular so the SG continues to form stars. Looking at
the apocenter one can see that even though the tidal force and ram-pressure are much smaller
than the self-gravity, there is a loss of gas. This can be a result of star formation or of assuming
only one spherical gas component, which is not the case of SG.
46

5.2. CASE STUDIES OF SATELLITE GALAXY FORCE EVOLUTION
Figure 5.1: Satellite galaxy 07-041 forces evolution: Each plot depicts a satellite property againstthe time or against the distance, and splits to two columns; the left column focuses on SG gas propertiesenclosed in a sphere of R0.9 cold gas radius; the right column focuses on SG stellar properties inside Rsat.The first row describes basic galactic parameters over time in the halo: Rorbit (blue), Rvir,0.1Rvir (dashedlines); on the right panel (gas properties) the total mass (black), the sSFR (orange), and the cold gasmass (light green): on the left panel (stellar properties) the total mass (black), the stellar mass (red),the surface density (dark red) and the concentration (pink). The second row describes the forces relatedparameters: in addition to the Rorbit and Rvir over time in halo, there is also the ram-pressure force (lightblue), the tidal force (purple), and the self-gravitational force (black). The last row describe significantquenching and stripping parameters depending on the distance to the central galaxy normalized bytheir amount while entering Rvir: the ram-pressure, the tidal force, the self-gravity and the stellar mass(with the same coloring as before). This figure is completing Fig. 4.2 and shows the “Fast Quenching”case: ram-pressure and tidal force become stronger as the SG orbit is closer to the central galaxy; at thepericenter, ram-pressure becomes the dominant force and quench the SG. On the left side we can see thetidal force effect on the system which is active on the edges of the SG: the tidal force heats the SG andstrips the stellar mass.
47

CHAPTER 5. ORIGINS OF SATELLITE GALAXY QUENCHING
Figure 5.2: Satellite galaxy 22-004 forces evolution: Similar structure and colors as in Fig. 5.1.This figure is completing fig 4.3 and presents the “Slow Quenching”, “Dark-matter loss” and “eCg formation”.We can see that since the SG orbit is circular, ram-pressure and the tidal force are of the same order atfirst peri-center, which keeps the cold gas inside the SG due to the compression resulting from the twoforces. Later on, the SG is quenched, and again the dominating force is ram-pressure. We can also see thatthe dark matter component is lost due to tidal forces as expected.
Later in the SG evolution, a clear case of ram-pressure gas removal at the second peri-center
occurs when ram-pressure becomes again the dominating force. We can further see a powerful
tidal force at second and third peri-centers, which is responsible for stripping the stellar and dark
matter components of the SG, leaving only the SG kernel after the third peri-center.
The “Fast Quenching” and “Starvation” case study is shown in Fig. 5.3. As in the first case
study, we can see a clean gas stripping at first peri-center. The interesting part here is later
on, at tin halo ≈ 1.3, where the SG encounters cold gas. However, as the ram-pressure is higher
48

5.2. CASE STUDIES OF SATELLITE GALAXY FORCE EVOLUTION
Figure 5.3: Satellite galaxy 23-007 forces evolution: Similar structure and colors as in Fig. 5.1.This figure is completing fig 4.4 and presents a “Fast Quenching” and “Starvation” case study. As inFig. 5.1, we can see a clean gas stripping at the first peri-center with ram-pressure being the dominatingforce. Moreover, we can observe at tin halo ≈ 1.3 that the SG encounters cold gas in its orbit, but there is nogas accretion due to the ram-pressure as suggested in our “Pac-Man” model in §5.6.
than self-gravity, the SG does not accrete gas so there is no new gas in the SG and hence no
star-formation. This illustrates the “Pac-Man” model discussed in §5.6. In addition, we can see
that the satellite puffing up stage is indeed due to the tidal force acting on the SG at the last
peri-center.
49

CHAPTER 5. ORIGINS OF SATELLITE GALAXY QUENCHING
Figure 5.4: Force evolution by tin halo - A stacked plot of the complete satellite sample by time in thehalo. Bold lines represent the median while the upper and lower shade boundaries correspond to 16% and84% of the sample. All the values are normalized to the value at entrance to the halo. The left columndescribes the evolution of forces acting on the gas component and the right column describes the evolutionof forces on stellar component. The upper row shows the evolution of the forces: ram-pressure (blue), tidalforce (purple) and self-gravity (black). The lower row show in dashed lines the ratios between ram-pressureand the tidal force (green), between ram pressure and self-gravity(blue) and between the tidal force andself-gravity (purple) This figure shows, following the green dashed line, that along time, ram-pressureis bigger than tidal force. Additionally, looking at the blue dashed line we can see that after a short delayin the halo, of about 0.5 Gyr, ram-pressure becomes the dominating mechanism in the SG evolution. Weremind that the 0.5 Gyr is identified as the averaged peri-center point and therefore, the ram-pressurebecome dominating at the peri-center region.
5.3 Force Evolution as a Function of Time
This section continues the study of the combined SGs evolution by time at §5.3. We will now focus
on the forces acting on SGs as a function of time.
The main result from the following figures is the apparent dominance of ram-pressure as
the dominating force over tidal force while the SG is in the halo – at peri-centers, apo-centers
and between them. On the meaning of the activation of the ram-pressure, it is bigger than the
self-gravity as expected, at the peri-center region but not much before. In Fig. 5.4 we identify the
peri-center at 0.5 Gyr, as the tidal force and ram-pressure peak and as we know that the tidal
force is most active at the minimum distance to the central galaxy.
Stacking as a function of td yn as shown in Fig. 5.5 can organize our understanding better. We
can notice that the peri-center to ram pressure correlation, which can be seen by the peaks of the
ram-pressure that occurs exactly at the peri-centers (td yn = 0,2). The ram-pressure correlation
50

5.4. FORCE EVOLUTION AS A FUNCTION OF DISTANCE TO THE CENTRAL GALAXY
Figure 5.5: Force evolution by tdyn (peri, apo) - A stacked plot of the complete satellite sample bydynamical time as defined on §3.4. Colors and methods are similar to Fig. 5.4. Reminder: t=0 correspondsto the first peri-center and t=1 to the first apo-center so t=2 would be around the second peri-center anso on. This figure shows the dominating region for quenching is the peri-center. A sharp peak in theforces is visible at the first and second peri-centers (t=0,2). Again, the green dashed line shows dominanceof the ram-pressure at all times.
establishes our understanding that the ram-pressure controls the gas stripping mechanism. It
is the dominant force relative to self-gravity and the tidal force in most of the events while
at apo-centers the tidal force and ram pressure are roughly the same. Later we see that the
tidal force rises relatively to self-gravity. However, the tidal force is always smaller or equal
to the SG self-gravity as it is computed at the SG stellar component radius. The tidal force
becomes significant around the second peri-center. This is probably due to tidal heating at the
first peri-center, which lowers the potential well, as can be seen by the fact that self-gravity
decreases over time, making gas and stars less bound over time.
5.4 Force Evolution as a Function of distance to the centralgalaxy
This section continues the study of the combined SGs evolution by distance to the central galaxy
at §4.4. We will now focus on the forces acting on SGs as a function of distance.
Fig. 5.6 presents the main feature: the closer the SG is to the central galaxy, the higher the
tidal and ram-pressure forces are. We can see that ram-pressure is again always larger than
the tidal force and becomes significant relatively to the self-gravity at about 0.3−0.4Rvir. We
51

CHAPTER 5. ORIGINS OF SATELLITE GALAXY QUENCHING
Figure 5.6: Force evolution by Rorbit/Rvir - A stacked plot of the complete satellite sample byRorbit/Rvir. This is a stacked plot of the complete satellite sample. Colors and methods are similarto Fig. 5.4 This figure shows, the closer the SG is to the central galaxy, the higher the tidal andram-pressure forces are. ram-pressure is dominant also here. Note the scatter, showing hidden parameterin the quenching process which is here the velocity of the SG.
also see that the scatter in ram pressure is higher, which happens mostly because ram-pressure
depends on velocity, indicating that a secondary parameter, the orbit eccentricity, is also essential
for quenching. These conclusions are in agreement with the analytic study presented in §5.1.
Moreover, we can see in Fig. 5.7 that until the first peri-center, the forces grow bigger but
are still smaller than self-gravity, this time with a smaller scatter in ram-pressure, indicating
that the velocities and the peri-center itself are essential to the quenching process, as galaxy
can be at the same distance from the center without quenching as seen here. Another important
point when comparing the plots are the regions where the tidal force is significant: before the
first peri-center, the tidal force is smaller than self-gravity at all distances, while in Fig. 5.6 we
can notice that the tidal force is stronger below 0.2Rvir, showing that SGs suffer more from tidal
effects of heating and stellar stripping at later time.
5.5 Starvation
Gas starvation, that is a stop of gas accretion onto the SG, can be an important quenching
mechanism. In case gas accretion resumes at any moment, the new gas can reignite star formation.
van de Voort et al. (2016) show in their cosmological SPH simulation that there is no gas accretion
to the SGs. We have seen in §4.3 and §4.4 that there was no measured gas addition in the
52

5.5. STARVATION
Figure 5.7: Force evolution by Rorbit/Rvir until first peri-center - A stacked plot of the complete satellitesample by Rorbit/Rvir. Colors and methods are similar to Fig. 5.4 The forces here are at most equals tothe self-gravity, showing that distance from the center alone is not enough to produce high ram-pressureto quench a SG. Another component is needed which is the velocity.
VELA SGs. We will now show this result is robust, and that SGs starvation is an active process
throughout the lifetime of SGs in the halo.
Let us take a look on the case where a halo SG meets cold gas – akin to a Pac-Man eating
points.
“Pac-Man” accretion: In order to accrete gas from the halo the gas velocity relative to the SG
should be lower then the escape velocity of the SG. Assuming the gas in the halo is at rest, while
the SG moves in its orbital velocity. We will get:
√GMhalo
Rhalo= vorbit < vesc =
√GMsatellite
racc=⇒ 1< Msatell ite
Mhalo· Rhalo
racc∝ r2
acc
R2halo
(5.7)
Where the first step uses the virial theorem, V 2 = GMR . Also, the last step uses the Mh ∝ R3
hrelation.
Since racc ¿ Rhalo, it is hard or even impossible to accrete gas in this way: this kind of
accretion is irrelevant.
The fact that a SG can not accrete gas by encounter in the halo means that in order for a
SG to accrete gas, the gas has to move with the SG. The case occurs only when a SG enters the
53

CHAPTER 5. ORIGINS OF SATELLITE GALAXY QUENCHING
halo inside a cold gas stream from a filament to the central galaxy, which leads to the following
mechanism.
“Wrapped Pac-Man” accretion: We assume that a SG accretes all the gas in its gravitational
potential well. The well of a satellite inside a halo can be described by the tidal radius, which is
the radius at which the self-gravity of the satellite is equal to the gravity of the halo:
rtidal =(12
Ms
Mh
)1/3Rorbit =
Ms
ρall, halo
1/3.(5.8)
Therefore, a spherical accretion gives us:
Macc = 4π3
r3tidal ·ρgas, filament =
2π3
Ms ·ρgas, filament
ρall, halo
Macc
Ms= 2π
3· ρgas, filament
ρall, halo(5.9)
In The VELA suite, ρall,halo is ranging between 105.3to107.5 with a mean value of 106±0.5M /kpc3
[by private correspondence with Dr. Nicolas Cornuault] so ρgas, f ilament ∼ 103 M¯kpc3 In those cases,
MaccMs
≈ 10−3! This is a negligible amount since gas is around 2% of the mass of a normal galaxy.
Please notice that in this approximation, we did not include the fast decrease of the tidal radius,
which in fact will leave most of the surrounding gas outside of the satellite (as we saw in our
examples, the tidal radius is becoming smaller than the stellar radius after the first peri-center).
We thus conclude that gas accretion inside the halo for a SG is an extremely rare case.
5.6 Sub-Dominant Quenching Causes
SGs are affected by many mechanisms. We should ask what is the influence on quenching of
those mechanisms and what are their evolution compared to tidal forces and ram pressure.
First, environmental gas flow forces other than ram-pressure. It has been shown by Fillingham
et al. (2016); Zinger, Dekel, Kravtsov, and Nagai (2018) that Kelvin-Helmholtz instability, shock,
and gas turbulence can represent up to 50% of the original ram-pressure in SGs. These additional
changes to the ram-pressure are not necessary relevent in the regime studied here since we
approximate a “JellyFish”-shaped SG as spherical when computing the force. These changes
introduce a small correction to the ram-pressure, which we address as a constant times the
ram-pressure. This of course does not change the force comparison much.
Feedback (gas outflows due to radiation, SNs, and others) has a crucial role in galaxy forma-
tion. However, we find its role less significant for SG evolution. As mentioned before, the VELA
suit has lower feedback than other cosmological simulations. In the case of higher feedback, the
main change in the satellite evolution will probably be a shallower density profile profile, the
gas content of the satellite being both puffed up and lowered. In this case where rg is larger and
54

5.7. COMPARISON TO OBSERVATIONS
ρcold gas, satellite smaller, our ram-pressure calculation induces a stronger ram-pressure. Bus as
the primary mechanism of quenching is the ram pressure peak at the peri-center, the results
shouldn’t be that different. If there was a change, it would be through some earlier quenching
just before the peri-center. In some sense, this mechanism is similar to the first environmental
gas flow dynamics and we can take it into account as a factor times the ram-pressure. This result
is consistent with (Emerick, Low, Grcevich, & Gatto, 2016).
For gas depletion via star-formation, we can see that it does not happen within our samples.
The initial gas mass does not significantly turn into a young stellar mass. Moreover, the decrease
of gas mass is correlated to the ram-pressure force.
The last additional mechanism is the effect of the magnetic fields, which we address for
completion. It has been shown that galaxies have magnetic fields around them. These magnetic
fields mostly influence small plasma regions, causing turbulence in them. Hence, for a SG to be
affected by magnetic force, it should be very close to the central galaxy, and it will result in small
turbulences which will change the gas in the SG in a very negligible way.
5.7 Comparison to Observations
We have shown the significance of the SG distance to the central galaxy: the closer a SG is
to the central galaxy, the stronger ram-pressure is. This means that the probability of a SG
to be quenched should be correlated to its distance to the central galaxy. Note in this regard
that the bias of dense old SG presented in §4.6 might add an equal number of quenched SG
independent of the SG position, since there are SG with apo-centers above 0.6Rvir in our sample.
We nevertheless expect to observe a higher fraction of quenched SG closer to the central galaxy.
As shown in Fig. 5.8 and by (Woo et al., 2017; Wang, Wang, Mo, Lim, et al., 2018; Wang, Wang,
Mo, van den Bosch, et al., 2018), the percentage of quenched SG decreases with distance.
Another important observed phenomena is the dependence of quenched SG fraction to the
halo mass and SG mass. We have shown in §5.1 that there is a strong connection between ram
pressure and the halo to satellite mass ratio, meaning that at fixed SG size, the bigger the halo is,
the stronger the ram-pressure will be. Therefore, a higher quenched fraction of SGs is expected
to be observed on high mass haloes. Following Woo et al. (2012); Balogh et al. (2016); Woo et al.
(2017); Wang, Wang, Mo, Lim, et al. (2018); Wang, Wang, Mo, van den Bosch, et al. (2018) and as
shown in Fig. 5.8), it is indeed the case. The SG mass dependence is harder to show as a specific
analysis should be included to deal with the dense SG survivor population discussed in §4.6. Note
also that we did not have statistics on the ratio itself and therefore could not give a direct proof
of the ratio dependence.
The last factor to discuss is the decrease of the gas fraction fgas with time. This is a delicate
subject as the hot gas in the halo can affect the quenching process. We want to note that as the gas
55

CHAPTER 5. ORIGINS OF SATELLITE GALAXY QUENCHING
Figure 5.8: The distribution of satellite galaxies in the sSFR-Σ?, 1kpc plane in four panels Thepanels representing different environments, for two mass bins (A and B). “Near” and “Far” refer to logRproj lesser or greater than -0.6 (or Rproj ∼ 0.25Rvir). “Low Mh” and “High Mh” refer to haloes less or moremassive than 1013.5 Modot. The contours represent the logarithmic number density of the population ineach panel and are separated by 0.2 dex. The color scale is normalized such that dark red represents thehighest number density in that panel. The sample size of each panel is indicated in the bottom corner. Theshift of the GV bridge, the lowering of sSFR for the SF satellites and the extension of quenched satellitestoward lower Σ?, 1kpc compared with the field is driven by high Mh and low Rproj. By Wuyts et al.(2011), we can see the quenched SG fraction change depending on the halo mass scale and the distance tothe central galaxy scale.
fraction in the halo drops with time (Genel et al., 2014), and for molecular gas as notably observed
by (Tacconi et al., 2013; Tacconi et al., 2018; Spilker et al., 2018) , which is also reproduced in
the VELA simulations, the ram-pressure strength should also decrease by time. Therefore, at
later times, quenching can be slower or require more than one peri-center. This could explain the
evolution of the quenching timescales shown by (Guo et al., 2017) and the quenching through
starvation at higher masses discussed by (Fillingham et al., 2015) (since it takes more time to
quench SG at lower redshift).
56

CH
AP
TE
R
6SUMMARY AND CONCLUSIONS
We have presented a full description of satellite galaxy evolution track, summarized
at fig 4.9. We find that SG quenching evolves very differently then filed galaxies,
through a typical path in the diagram of specific star formation (sSFR) vs. inner
stellar surface density (Σ?,0.5kpc), with the inner surface density defined as the density within
0.5kpc from the center of mass of the SG. Three discrete phases characterize this path:1. Halt in gas accretion with SG compaction at high sSFR as the SG keeps formingstars 2. Gas removal and rapid drop in the sSFR at the peri-center of its orbit withinthe host halo 3. Stellar heating and stripping that may lead to coalesce with the halocenter, an ultra-diffuse galaxy (UDG), a compact elliptical galaxy (eCg) or a globularcluster (GC). These results are in contrast to previous articles which suggested a very different
mechanism (Woo et al., 2017). However, we show, that by the same observation we can see a
better agreement to the proposed evolution path.
The satellite evolution track was measured on satellite galaxies at the VELA cosmological
simulation at z<1. However, by analytic analysis and by observations, we suggest it describes
the broad SG quenching mechanism, until z=0 and to the extent of at least galaxy groups.
Hence, providing a completing term to the halo mass quenching mechanism and providing a
full comprehensive description of the galaxy quenching mechanism which can be seen
at fig 4.11.
we show that the SG evolution main drivers are ram-pressure stripping at the initial stages
and tidal forces at the final stages, aided by starvation, suppression of gas accretion. Other
processes: gas depletion by star formation or stellar feedback are secondary. These results are
consistent with an analytic model we have developed that successfully reproduces this SG
57

CHAPTER 6. SUMMARY AND CONCLUSIONS
evolution.
We find there is great importance to the SG orbit in order for a galaxy to quench, and it
depends on the eccentricity, peri-center. The quenching surprisingly does not depends on the
stellar mass of the SG as was suggested before but instead depends on the ratio of stellar SG
mass to the halo mass. Another change that was presented by (Balogh et al., 2016) is a change in
the mechanism around z 1. We suggest that for a quenching process depending on the fraction
of gas in the halo, a quantity which decreases by time, we resolve this observed change. We
also show that this halo gas fraction dependence driven from our calculation. These parameters
change the ratio of ram-pressure to self-gravity magnitudes, as ram-pressure is the dominating
quenching cause, These parameters control when and where the quenching would happen.
Another important mechanism is starvation, a halt in gas accretion to SGs. We show it is
improbable for a SG, or dark-matter sub-halo to accrete gas at the halo. Starvation can even reach
farther than the virial radius, which can also imply to conformity issues. This result is beneficial
to understand the SG evolution, but even more generally, it means dark-matter sub-halos which
did not accrete gas earlier to entering the halo, cannot accrete gas and later form stars in the
halo, therefore lowering the missing satellite problem, as some sub-halos would never accrete
gas.
Tidal force is also an important mechanism. We find the orbital eccentricity relates to the
“puffing up” of the SG. High eccentric orbits correlated with tidal heating, a process in which
the inner stellar surface density decrease. We find this change happens at peri-centers, with
some delay of relaxation of the SG, no change in stellar mass is visible until first peri-center, and
between apo-centers to the next pericenter. Except for tidal heating, we also see tidal stripping, a
process in which a material stripped out of the SG due to tidal forces. We find this force extremely
efficient in stripping dark-matter and less to the stellar matter, even though they are roughly at
the same mass resolution in the simulation. We explain this phenomenon, by the fact that stars
formed from a gas that has been cooled down in the center of the halo. Therefore stars which
formed in the halo, are on a lower energetic level compared to the dark matter particles which
have a higher energy level. This claim supported by (Chang et al., 2013; Macciò et al., 2017)
that showed a simulated model to show these dynamics and is first time seen in a cosmological
simulation on this MSc thesis. This scenario, suggests, that higher eccentric SG are more likely
to lose their dark matter component. We found at least 10% of our SG population to loses its dark
matter components. Moreover, this losing of dark matter can explain the observed lacking dark
matter ultra diffused galaxy (UDG), as UDGs in the halo are formed through an eccentric orbit,
causing them due to tidal heating to become diffused, therefore, we would expect UDG to with
less dark matter than other galaxies.
The lost of the dark matter component also explains the difficulties in the SGs simulation
study. Today, many of the studies use dark-matter follow up in order to resolve SG, as the dark
58

matter vanishes quickly, it is preferred to use stellar tracking. However, as we showed, a SG
can lose more than 90% of its mass to the central galaxy between two snapshots, therefore even
with a classical stellar tracking method, one would not resolve the right orbit and consider effect
as a merger. The tracking fly-bys is a systemic problem in nowadays merger tree algorithm as
described at (Srisawat et al., 2013). We propose a different method which traces the potential
well position of the galaxies by tracing the kernel of the galaxies, the densest star region in the
galaxy and later rebuild the galaxy from it, this method with other upgrades which solves other
SG systematic issues, help us resolve the total SG evolution path and deliver the results above.
Another product of this new merger tree is the finding of the formation of an elliptical compact
galaxy (eCg), from the formation at a filament, through the formation of stars in the core of the
galaxy, until an eCg flying around the central galaxy. We suggest that the same mechanism as
here is responsible also for globular clusters (GC) as the kernel, central part of the SG detach
from the galaxy and continues to fly around the central galaxy. This case as the two former cases,
losing dark matter and UDG are systematically vulnerable by the currently used merger trees,
and a solution like the proposed merger tree algorithm is needed.
We wish to emphasize the importance to compare good observations with our model. We made
an effort to compare the results, but some correlations should explicitly be tested: For example,
the difference of quenching by satellite to halo mass ratio or a broader analysis of SG densities,
age, orbit velocity and peri-center for different masses. We also provided SG quantities by time
and distance with to be compared at later studies. An urgent call is about the measurements of
dark matter at SG, as we have shown, from the tidal dynamics, SG has no NFW profile. There are
observed SG with small velocity dispersion, but a further study is needed to confirm or contradict
the question of dark matter in satellite dwarf galaxy, an important question which related to the
dark matter fundamental characteristics.
This study raises new questions: First, we see an existent of a bi-modal quenching process:
fast quenching at the first pericenter and slow quenching on the second pericenter, as we have
shown, it is the tidal force and the circular orbit that holds the cold gas in the SG for a longer
time. We tried to distinguish between them by a simple role, and we are on an ongoing study in
this field to find the different causes to the bi-modality in SG quenching. It is our notion that
an upgrade to the quenching model is needed. Most of the studies on SG assumes quasi-static
quenching process, while the quenching can be very rapid at the pericenter. We are developing a
pulse model to get a more accurate measurement.
Second, we have seen in our SG sample, and by other articles, that a unique star-burst is occurring
for some of the SG at its pericenters, we describe this event as the “Swansong”, as the SG in a
very rapid event forming a last burst of stars and later quenches. Our model shows that this is
an effect of tidal force vs. ram-pressure compression at the pericenter, a further study also awaits
here.
59

CHAPTER 6. SUMMARY AND CONCLUSIONS
Third, is the question of UDG, eCg and other formation in SG evolution, we would like to extend
our study also here especially as VELA is a very high-resolution simulation and the only one
currently which resolves eCg and other compact galaxies and has high resolution also for the
UDG.
Forth, at the introduction, we have discussed the importance of SG to quenching of the central
galaxy of the SG, we feel a further study is needed to explain why and which SG quench the
central galaxies. Dry or wet mergers? Circular or eccentric? Each one of these questions raises its
limitations, which we will address at a proper article.
Fifth, as we presented a SG with no dark matter, a question is raising, how much dark matter
less, baryon galaxies (BG) are identified in the VELA simulation, how are they form? How do
they evolve? We find six different mechanisms to form staying alive BGs. These results too should
be addressed.
All of the data above and more are ordered and used in our group in a fast, robust catalog
system using the pandas python library for data science. This extensive catalog is a new infras-
tructure for further studies on the VELA and other simulations.
60

REFERENCES
Agertz, O., Kravtsov, A. V., Leitner, S. N., & Gnedin, N. Y. (2013, June). Toward a Complete Ac-
counting of Energy and Momentum from Stellar Feedback in Galaxy Formation Simulations.
Astrophysical Journal, 770, 25. doi: 10.1088/0004-637X/770/1/25
Aubert, D., Pichon, C., & Colombi, S. (2004, aug). The origin and implications of dark matter
anisotropic cosmic infall on ≈l? haloes. Monthly Notices of the Royal Astronomical Society,
352(2), 376–398. doi: 10.1111/j.1365-2966.2004.07883.x
Balogh, M. L., McGee, S. L., Mok, A., Muzzin, A., van der Burg, R. F. J., Bower, R. G., . . . Yee,
H. K. C. (2016, jan). Evidence for a change in the dominant satellite galaxy quenching
mechanism atz = 1. Monthly Notices of the Royal Astronomical Society, 456(4), 4364–4376.
doi: 10.1093/mnras/stv2949
Bardeen, J. M., Bond, J. R., Kaiser, N., & Szalay, A. S. (1986, May). The statistics of peaks of
Gaussian random fields. Astrophysical Journal, 304, 15-61. doi: 10.1086/164143
Behroozi, P. S., Wechsler, R. H., & Wu, H.-Y. (2012, dec). THE ROCKSTAR PHASE-SPACE
TEMPORAL HALO FINDER AND THE VELOCITY OFFSETS OF CLUSTER CORES. The
Astrophysical Journal, 762(2), 109. doi: 10.1088/0004-637x/762/2/109
Bryan, G. L., & Norman, M. L. (1998, mar). Statistical properties of x-ray clusters: Analytic and
numerical comparisons. Astrophysical Journal, 495(1), 80–99. doi: 10.1086/305262
c, K. K., Lilly, S. J., Knobel, C., Bschorr, T. J., Peng, Y., Carollo, C. M., . . . Pozzetti, L. (2013,
dec). zCOSMOS 20k: satellite galaxies are the main drivers of environmental effects in the
galaxy population at least to z ∼ 0.7. Monthly Notices of the Royal Astronomical Society,
438(1), 717–738. doi: 10.1093/mnras/stt2241
Cañas, R., Elahi, P. J., Welker, C., del P Lagos, C., Power, C., Dubois, Y., & Pichon, C. (2018, oct).
Introducing a new, robust galaxy finder algorithm for simulations. Monthly Notices of the
Royal Astronomical Society. doi: 10.1093/mnras/sty2725
Ceverino, D., Dekel, A., & Bournaud, F. (2010). High-redshift clumpy discs and bulges in
cosmological simulations. Monthly Notices of the Royal Astronomical Society, 404(4), 2151-
2169. doi: 10.1111/j.1365-2966.2010.16433.x
Ceverino, D., Dekel, A., Mandelker, N., Bournaud, F., Burkert, A., Genzel, R., & Primack, J. (2012,
March). Rotational support of giant clumps in high-z disc galaxies. Monthly Notices of the
Royal Astronomical Society, 420, 3490-3520. doi: 10.1111/j.1365-2966.2011.20296.x
61

CHAPTER 6. SUMMARY AND CONCLUSIONS
Ceverino, D., Dekel, A., Tweed, D., & Primack, J. (2015, March). Early formation of massive,
compact, spheroidal galaxies with classical profiles by violent disc instability or mergers.
Monthly Notices of the Royal Astronomical Society, 447, 3291-3310. doi: 10.1093/mnras/
stu2694
Ceverino, D., & Klypin, A. (2009, April). The Role of Stellar Feedback in the Formation of
Galaxies. Astrophysical Journal, 695, 292-309. doi: 10.1088/0004-637X/695/1/292
Ceverino, D., Klypin, A., Klimek, E. S., Trujillo-Gomez, S., Churchill, C. W., Primack, J., & Dekel,
A. (2014, August). Radiative feedback and the low efficiency of galaxy formation in low-mass
haloes at high redshift. Monthly Notices of the Royal Astronomical Society, 442, 1545-1559.
doi: 10.1093/mnras/stu956
Chabrier, G. (2003, July). Galactic Stellar and Substellar Initial Mass Function. Publications of
the ASP, 115, 763-795. doi: 10.1086/376392
Chang, J., Macciò, A. V., & Kang, X. (2013, apr). The dependence of tidal stripping efficiency
on the satellite and host galaxy morphology. Monthly Notices of the Royal Astronomical
Society, 431(4), 3533–3542. doi: 10.1093/mnras/stt434
Dekel, A., Devor, J., & Hetzroni, G. (2003). Galactic halo cusp-core: tidal compression in
mergers. Monthly Notices of the Royal Astronomical Society, 341(1), 326-342. doi: 10.1046/
j.1365-8711.2003.06432.x
Dekel, A., & Krumholz, M. R. (2013, June). Steady outflows in giant clumps of high-z disc galaxies
during migration and growth by accretion. Monthly Notices of the Royal Astronomical
Society, 432, 455-467. doi: 10.1093/mnras/stt480
Dekel, A., Lapiner, S., Freundlich, J., Ginzburg, O., Jiang, F., Kretschmer, M., . . . Primack, J.
(n.d.). Compaction to a blue nugget: a critical phase in galaxy evolution. (In preparation)
Dekel, A., & Silk, J. (1986, April). The origin of dwarf galaxies, cold dark matter, and biased
galaxy formation. Astrophysical Journal, 303, 39-55. doi: 10.1086/164050
Du, M., Debattista, V. P., Ho, L. C., Cote, P., Spengler, C., Erwin, P., . . . Caruana, J. (2018,
November). The Formation of Compact Elliptical Galaxies in The Vicinity of A Massive
Galaxy: The Role of Ram-pressure Confinement. ArXiv e-prints.
Emerick, A., Low, M.-M. M., Grcevich, J., & Gatto, A. (2016, jul). GAS LOSS BY RAM PRESSURE
STRIPPING AND INTERNAL FEEDBACK FROM LOW-MASS MILKY WAY SATELLITES.
Astrophysical Journal, 826(2), 148. doi: 10.3847/0004-637x/826/2/148
Ferland, G. J., Korista, K. T., Verner, D. A., Ferguson, J. W., Kingdon, J. B., & Verner, E. M. (1998,
July). CLOUDY 90: Numerical Simulation of Plasmas and Their Spectra. Publications of
the ASP, 110, 761-778. doi: 10.1086/316190
Fillingham, S. P., Cooper, M. C., Boylan-Kolchin, M., Bullock, J. S., Garrison-Kimmel, S., &
Wheeler, C. (2018). Environmental quenching of low-mass field galaxies. Monthly Notices
of the Royal Astronomical Society, 477(4), 4491-4498. doi: 10.1093/mnras/sty958
Fillingham, S. P., Cooper, M. C., Pace, A. B., Boylan-Kolchin, M., Bullock, J. S., Garrison-Kimmel,
62

S., & Wheeler, C. (2016, aug). Under pressure: quenching star formation in low-mass
satellite galaxies via stripping. Monthly Notices of the Royal Astronomical Society, 463(2),
1916–1928. doi: 10.1093/mnras/stw2131
Fillingham, S. P., Cooper, M. C., Wheeler, C., Garrison-Kimmel, S., Boylan-Kolchin, M., & Bullock,
J. S. (2015, oct). Taking care of business in a flash : constraining the time-scale for low-mass
satellite quenching with ELVIS. Monthly Notices of the Royal Astronomical Society, 454(2),
2039–2049. doi: 10.1093/mnras/stv2058
Gabor, J. M., & Davé, R. (2014, dec). Hot gas in massive haloes drives both mass quenching
and environment quenching. Monthly Notices of the Royal Astronomical Society, 447(1),
374–391. doi: 10.1093/mnras/stu2399
Genel, S., Vogelsberger, M., Springel, V., Sijacki, D., Nelson, D., Snyder, G., . . . Hernquist, L.
(2014, sep). Introducing the illustris project: the evolution of galaxy populations across
cosmic time. Monthly Notices of the Royal Astronomical Society, 445(1), 175–200. doi:
10.1093/mnras/stu1654
Gill, S. P. D., Knebe, A., & Gibson, B. K. (2004, June). The evolution of substructure - I. A new
identification method. Monthly Notices of the Royal Astronomical Society, 351, 399-409. doi:
10.1111/j.1365-2966.2004.07786.x
Gunn, J. E., & J. Richard, I. G. (1972, aug). On the infall of matter into clusters of galaxies and
some effects on their evolution. Astrophysical Journal, 176, 1. doi: 10.1086/151605
Guo, Y., Bell, E. F., Lu, Y., Koo, D. C., Faber, S. M., Koekemoer, A. M., . . . Santini, P. (2017).
Candels sheds light on the environmental quenching of low-mass galaxies. The Astrophysical
Journal Letters, 841(2), L22.
Haardt, F., & Madau, P. (1996, April). Radiative Transfer in a Clumpy Universe. II. The
Ultraviolet Extragalactic Background. Astrophysical Journal, 461, 20. doi: 10.1086/177035
Hartley, W. G., Conselice, C. J., Mortlock, A., Foucaud, S., & Simpson, C. (2015). Galactic
conformity and central/satellite quenching, from the satellite profiles of m* galaxies at 0.4
< z < 1.9 in the ukidss uds. Monthly Notices of the Royal Astronomical Society, 451(2),
1613-1636. doi: 10.1093/mnras/stv972
Hopkins, P. F., Kereš, D., Murray, N., Quataert, E., & Hernquist, L. (2012, December). Stellar
feedback and bulge formation in clumpy discs. Monthly Notices of the Royal Astronomical
Society, 427, 968-978. doi: 10.1111/j.1365-2966.2012.21981.x
jie Peng, Y., Lilly, S. J., Kovac, K., Bolzonella, M., Pozzetti, L., Renzini, A., . . . Scaramella, R.
(2010). Mass and environment as drivers of galaxy evolution in sdss and zcosmos and the
origin of the schechter function. Astrophysical Journal, 721(1), 193.
jie Peng, Y., Lilly, S. J., Renzini, A., & Carollo, M. (2012). Mass and environment as drivers
of galaxy evolution. ii. the quenching of satellite galaxies as the origin of environmental
effects. Astrophysical Journal, 757(1), 4.
Jost, J. (2002). Riemannian geometry and geometric analysis. Springer Berlin Heidelberg. doi:
63

CHAPTER 6. SUMMARY AND CONCLUSIONS
10.1007/978-3-662-04672-2
Kennicutt, R. C., Jr. (1998). Star Formation in Galaxies Along the Hubble Sequence. Annual
Review of Astron and Astrophys, 36, 189-232. doi: 10.1146/annurev.astro.36.1.189
Klypin, A., Kravtsov, A. V., Valenzuela, O., & Prada, F. (1999). Where are the missing galactic
satellites? Astrophysical Journal, 522(1), 82.
Knollmann, S. R., & Knebe, A. (2009, June). AHF: Amiga’s Halo Finder. Astrophysical Journal,
182, 608-624. doi: 10.1088/0067-0049/182/2/608
Komatsu, E., Dunkley, J., Nolta, M. R., Bennett, C. L., Gold, B., Hinshaw, G., . . . Wright,
E. L. (2009, February). Five-Year Wilkinson Microwave Anisotropy Probe Observations:
Cosmological Interpretation. Astrophysical Journal, Supplement, 180, 330-376. doi: 10.1088/
0067-0049/180/2/330
Kravtsov, A. V. (1999). High-resolution simulations of structure formation in the universe
(Unpublished doctoral dissertation). NEW MEXICO STATE UNIVERSITY.
Kravtsov, A. V. (2003, June). On the Origin of the Global Schmidt Law of Star Formation.
Astrophysical Journal, Letters, 590, L1-L4. doi: 10.1086/376674
Kravtsov, A. V. (2013). The size-virial radius relation of galaxies. The Astrophysical Journal
Letters, 764(2), L31.
Kravtsov, A. V., Klypin, A. A., & Khokhlov, A. M. (1997, July). Adaptive Refinement Tree: A
New High-Resolution N-Body Code for Cosmological Simulations. Astrophysical Journal,
Supplement, 111, 73-94. doi: 10.1086/313015
Krumholz, M. R., & Dekel, A. (2010, July). Survival of star-forming giant clumps in high-
redshift galaxies. Monthly Notices of the Royal Astronomical Society, 406, 112-120. doi:
10.1111/j.1365-2966.2010.16675.x
Krumholz, M. R., & Dekel, A. (2012, July). Metallicity-dependent Quenching of Star Formation
at High Redshift in Small Galaxies. Astrophysical Journal, 753, 16. doi: 10.1088/0004-637X/
753/1/16
Krumholz, M. R., & Thompson, T. A. (2012, December). Direct Numerical Simulation of Radiation
Pressure-driven Turbulence and Winds in Star Clusters and Galactic Disks. Astrophysical
Journal, 760, 155. doi: 10.1088/0004-637X/760/2/155
Lacey, C., & Cole, S. (1993, June). Merger rates in hierarchical models of galaxy formation.
Monthly Notices of the Royal Astronomical Society, 262, 627-649. doi: 10.1093/mnras/
262.3.627
Leitherer, C., Schaerer, D., Goldader, J. D., Delgado, R. M. G., Robert, C., Kune, D. F., . . .
Heckman, T. M. (1999, July). Starburst99: Synthesis Models for Galaxies with Active Star
Formation. Astrophysical Journal, Supplement, 123, 3-40. doi: 10.1086/313233
Macciò, A. V., Frings, J., Buck, T., Penzo, C., Dutton, A. A., Blank, M., & Obreja, A. (2017,
aug). The edge of galaxy formation – i. formation and evolution of MW-satellite analogues
before accretion. Monthly Notices of the Royal Astronomical Society, 472(2), 2356–2366. doi:
64

10.1093/mnras/stx2048
Mandelker, N., Dekel, A., Ceverino, D., DeGraf, C., Guo, Y., & Primack, J. (2016, sep). Giant clumps
in simulated high-zGalaxies: properties, evolution and dependence on feedback. Monthly
Notices of the Royal Astronomical Society, 464(1), 635–665. doi: 10.1093/mnras/stw2358
Mandelker, N., Dekel, A., Ceverino, D., Tweed, D., Moody, C. E., & Primack, J. (2014, October).
The population of giant clumps in simulated high-z galaxies: in situ and ex situ migration
and survival. Monthly Notices of the Royal Astronomical Society, 443, 3675-3702. doi:
10.1093/mnras/stu1340
Mo, H., van den Bosch, F., & White, S. (2010). Galaxy formation and evolution (No. 557).
Campbridge.
Moore, B., Ghigna, S., Governato, F., Lake, G., Quinn, T., Stadel, J., & Tozzi, P. (1999, October).
Dark Matter Substructure within Galactic Halos. Astrophysical Journal, 524, L19-L22. doi:
10.1086/312287
More, S., Kravtsov, A. V., Dalal, N., & Gottlöber, S. (2011). The overdensity and masses of
the friends-of-friends halos and universality of halo mass function. Astrophysical Journal
Supplement Series, 195(1), 4.
Murray, N., Quataert, E., & Thompson, T. A. (2010, January). The Disruption of Giant Molecular
Clouds by Radiation Pressure & the Efficiency of Star Formation in Galaxies. Astrophysical
Journal, 709, 191-209. doi: 10.1088/0004-637X/709/1/191
Omand, C. M. B., Balogh, M. L., & Poggianti, B. M. (2014, mar). The connection between galaxy
structure and quenching efficiency. Monthly Notices of the Royal Astronomical Society,
440(1), 843–858. doi: 10.1093/mnras/stu331
Press, W. H., & Schechter, P. (1974, February). Formation of Galaxies and Clusters of Galaxies
by Self-Similar Gravitational Condensation. Astrophysical Journal, 187, 425-438. doi:
10.1086/152650
Simon, J. D., & Geha, M. (2007). The kinematics of the ultra-faint milky way satellites: Solving
the missing satellite problem. The Astrophysical Journal, 670(1), 313.
Simpson, C. M., Grand, R. J. J., Gómez, F. A., Marinacci, F., Pakmor, R., Springel, V., . . . Frenk,
C. S. (2018, mar). Quenching and ram pressure stripping of simulated milky way satellite
galaxies. Monthly Notices of the Royal Astronomical Society, 478(1), 548–567. doi: 10.1093/
mnras/sty774
Slater, C. T., & Bell, E. F. (2014, aug). THE MASS DEPENDENCE OF DWARF SATELLITE
GALAXY QUENCHING. Astrophysical Journal, 792(2), 141. doi: 10.1088/0004-637x/792/2/
141
Somerville, R. S., Behroozi, P., Pandya, V., Dekel, A., Faber, S. M., Fontana, A., . . . van der Wel,
A. (2018, January). The relationship between galaxy and dark matter halo size from z ∼3 to the present. Monthly Notices of the Royal Astronomical Society, 473, 2714-2736. doi:
10.1093/mnras/stx2040
65

CHAPTER 6. SUMMARY AND CONCLUSIONS
Spilker, J., Bezanson, R., Barišic, I., Bell, E., del P. Lagos, C., Maseda, M., . . . Wu, P.-F. (2018, jun).
Molecular gas contents and scaling relations for massive, passive galaxies at intermediate
redshifts from the LEGA-c survey. The Astrophysical Journal, 860(2), 103. doi: 10.3847/
1538-4357/aac438
Srisawat, C., Knebe, A., Pearce, F. R., Schneider, A., Thomas, P. A., Behroozi, P., . . . Yi, S. K.
(2013, November). Sussing Merger Trees: The Merger Trees Comparison Project. Monthly
Notices of the Royal Astronomical Society, 436, 150-162. doi: 10.1093/mnras/stt1545
Tacchella, S., Carollo, C. M., Faber, S. M., Cibinel, A., Dekel, A., Koo, D. C., . . . Woo, J. (2017,
July). On the Evolution of the Central Density of Quiescent Galaxies. Astrophysical Journal,
Letters, 844, L1. doi: 10.3847/2041-8213/aa7cfb
Tacchella, S., Dekel, A., Carollo, C. M., Ceverino, D., DeGraf, C., Lapiner, S., . . . Joel, R. P. (2016,
feb). The confinement of star-forming galaxies into a main sequence through episodes of
gas compaction, depletion and replenishment. Monthly Notices of the Royal Astronomical
Society, 457(3), 2790–2813. doi: 10.1093/mnras/stw131
Tacchella, S., Dekel, A., Carollo, C. M., Ceverino, D., DeGraf, C., Lapiner, S., . . . Primack, J. R.
(2016, May). Evolution of density profiles in high-z galaxies: compaction and quenching
inside-out. Monthly Notices of the Royal Astronomical Society, 458, 242-263. doi: 10.1093/
mnras/stw303
Tacconi, L. J., Genzel, R., Saintonge, A., Combes, F., García-Burillo, S., Neri, R., . . . Weiss, A.
(2018, feb). PHIBSS: Unified scaling relations of gas depletion time and molecular gas
fractions. The Astrophysical Journal, 853(2), 179. doi: 10.3847/1538-4357/aaa4b4
Tacconi, L. J., Neri, R., Genzel, R., Combes, F., Bolatto, A., Cooper, M. C., . . . Weiner, B. (2013,
May). Phibss: Molecular Gas Content and Scaling Relations in z ˜ 1-3 Massive, Main-
sequence Star-forming Galaxies. Astrophysical Journal, 768, 74. doi: 10.1088/0004-637X/
768/1/74
Thompson, T. A., Quataert, E., & Murray, N. (2005, September). Radiation Pressure-supported
Starburst Disks and Active Galactic Nucleus Fueling. Astrophysical Journal, 630, 167-185.
doi: 10.1086/431923
Tweed, D., Devriendt, J., Blaizot, J., Colombi, S., & Slyz, A. (2009, aug). Building merger trees
from cosmological n-body simulations. Astronomy and Astrophysics, 506(2), 647–660. doi:
10.1051/0004-6361/200911787
van den Bosch, F. C., Aquino, D., Yang, X., Mo, H. J., Pasquali, A., McIntosh, D. H., . . . Kang, X.
(2008, jun). The importance of satellite quenching for the build-up of the red sequence of
present-day galaxies. Monthly Notices of the Royal Astronomical Society, 387(1), 79–91. doi:
10.1111/j.1365-2966.2008.13230.x
van den Bosch, F. C., Ogiya, G., Hahn, O., & Burkert, A. (2018). Disruption of dark matter
substructure: fact or fiction? Monthly Notices of the Royal Astronomical Society, 474(3),
3043-3066. doi: 10.1093/mnras/stx2956
66

van de Voort, F., Bahé, Y. M., Bower, R. G., Correa, C. A., Crain, R. A., Schaye, J., & Theuns,
T. (2016, dec). The environmental dependence of gas accretion on to galaxies: quenching
satellites through starvation. Monthly Notices of the Royal Astronomical Society, 466(3),
3460–3471. doi: 10.1093/mnras/stw3356
van Dokkum, P., Danieli, S., Cohen, Y., Merritt, A., Romanowsky, A. J., Abraham, R., . . . Zhang, J.
(2018, 03 28). A galaxy lacking dark matter. Nature, 555, 629 EP -.
Wang, E., Wang, H., Mo, H., Lim, S. H., van den Bosch, F. C., Kong, X., . . . Chen, S. (2018,
jun). The dearth of difference between central and satellite galaxies. i. perspectives on
star formation quenching and AGN activities. Astrophysical Journal, 860(2), 102. doi:
10.3847/1538-4357/aac4a5
Wang, E., Wang, H., Mo, H., van den Bosch, F. C., Lim, S. H., Wang, L., . . . Chen, S. (2018,
aug). The dearth of differences between central and satellite galaxies. II. comparison of
observations with l-GALAXIES and EAGLE in star formation quenching. Astrophysical
Journal, 864(1), 51. doi: 10.3847/1538-4357/aad554
Wetzel, A. R., Tinker, J. L., Conroy, C., & van den Bosch, F. C. (2013, apr). Galaxy evolution
in groups and clusters: satellite star formation histories and quenching time-scales in a
hierarchical universe. Monthly Notices of the Royal Astronomical Society, 432(1), 336–358.
doi: 10.1093/mnras/stt469
Wetzel, A. R., Tollerud, E. J., & Weisz, D. R. (2015). Rapid environmental quenching of satellite
dwarf galaxies in the local group. Astrophysical Journal Letters, 808(1), L27.
Wheeler, C., Phillips, J. I., Cooper, M. C., Boylan-Kolchin, M., & Bullock, J. S. (2014, jun).
The surprising inefficiency of dwarf satellite quenching. Monthly Notices of the Royal
Astronomical Society, 442(2), 1396–1404. doi: 10.1093/mnras/stu965
White, S. D. M., & Rees, M. J. (1978, May). Core condensation in heavy halos - A two-stage theory
for galaxy formation and clustering. Monthly Notices of the Royal Astronomical Society, 183,
341-358. doi: 10.1093/mnras/183.3.341
Woo, J., Carollo, C. M., Faber, S. M., Dekel, A., & Tacchella, S. (2017). Satellite quenching, galaxy
inner density and the halo environment. Monthly Notices of the Royal Astronomical Society,
464(1), 1077-1094. doi: 10.1093/mnras/stw2403
Woo, J., Dekel, A., Faber, S. M., Noeske, K., Koo, D. C., Gerke, B. F., . . . Yan, R. (2012, nov).
Dependence of galaxy quenching on halo mass and distance from its centre. Monthly Notices
of the Royal Astronomical Society, 428(4), 3306–3326. doi: 10.1093/mnras/sts274
Wuyts, S., Schreiber, N. M. F., van der Wel, A., Magnelli, B., Guo, Y., Genzel, R., . . . Tacconi,
L. (2011, nov). GALAXY STRUCTURE AND MODE OF STAR FORMATION IN THE
SFR-MASS PLANE FROMz∼ 2.5 TOz∼ 0.1. Astrophysical Journal, 742(2), 96. doi: 10.1088/
0004-637x/742/2/96
Zinger, E., Dekel, A., Kravtsov, A. V., & Nagai, D. (2018, jan). Quenching of satellite galaxies at
the outskirts of galaxy clusters. Monthly Notices of the Royal Astronomical Society, 475(3),
67

CHAPTER 6. SUMMARY AND CONCLUSIONS
3654–3681. doi: 10.1093/mnras/stx3329
68