the nutrition transition and adolescents diets in low- and ... · and the ones who remained in the...
TRANSCRIPT

The nutrition transition and adolescents’ diets in low- andmiddle-income countries: a cross-cohort comparison
Elisabetta Aurino1,2,*, Meena Fernandes1 and Mary E Penny31Partnership for Child Development, School of Public Health, Imperial College London, Norfolk Place, London W21NY, UK: 2Department of International Development, University of Oxford, Oxford, UK: 3Instituto de InvestigaciónNutricional, Lima, Peru
Submitted 24 December 2015: Final revision received 28 May 2016: Accepted 14 June 2016: First published online 29 July 2016
AbstractObjective: To investigate changes in dietary diversity and dietary compositionamong adolescents in four developing countries.Design: We analysed dietary diversity and consumption of seven food groups andfoods with added sugars as reported by adolescents from two cohorts growingup 8 years apart, when they were aged about 12 years.Setting: Ethiopia, India (Andhra Pradesh), Peru and Vietnam in 2006 and 2013.Subjects: Adolescents (n 3659) from the older cohort (OC) born in 1995/96 andadolescents (n 7422) from the younger cohort (YC) born in 2001/02 (N 11 081).Results: Controlling for other factors, dietary diversity increased in Peru (OC= 4·89,YC= 5·34, P< 0·001) and Ethiopia (OC= 3·52, YC= 3·94, P= 0·001). Dietarydiversity was stable in India (OC= 4·28, YC= 4·29, P= 0·982) and Vietnam(OC= 4·71, YC= 4·73, P= 0·814); however, changes in dietary composition wereobserved. YC adolescents were more likely to consume eggs (India: +32%,P= 0·038; Vietnam: +50%, P< 0·001) and milk and dairy (India: +12%, P= 0·029;Vietnam: +46%, P< 0·001). Other notable shifts included meat consumption inPeru (+72%, P< 0·001) and consumption of fruit and vegetables in Ethiopia(+36%, P< 0·001). Compared with OC, the prevalence of added sugarconsumption was greater among the YC in Ethiopia (+35%, P= 0·001) andVietnam (+44% P< 0·001). Between 2006 and 2013, disparities in dietary diversityassociated with household wealth and place of residence declined, although thisvaried by country. No marked gender disparities in dietary diversity were evident.Conclusions: We found significant changes over time in dietary diversity amongadolescents in four countries consistent with the hypothesis of the nutrition transition.
KeywordsAdolescents
Dietary diversityNutrition transition
Non-communicable diseasesLow- and middle-income countries
Cohorts
Recent studies highlight the increasing prominence ofnon-communicable diseases in the global burden ofdisease, and poor dietary quality as a key risk factor(1). Tenper cent of total global disability-adjusted life years lost in2013 were attributed to dietary risk factors and physicalinactivity(2). The widespread shift from communicableto non-communicable diseases is now concentrated inlow- and middle-income countries, and has been accom-panied by a global trend towards increased consumptionof energy-dense, processed foods, known as the nutritiontransition(3).
Recently, a study investigated dietary quality and trendsamong adults both within and across countries, butevidence on evolving dietary patterns for children andadolescents is lacking, particularly for low- and middle-income countries(4–6). Considering the global increase ofnon-communicable diseases such as type 2 diabetes andhypertension, and of overweight and obesity during
childhood and adolescence, this is a critical gap limitingeffective policy design(7–9).
Adolescence constitutes a key entry point for interven-tions aiming to build healthy diets over the life course, asevidence shows that dietary patterns ‘track’ to adult-hood(10–14). Such policies could potentially avert the onsetof non-communicable diseases. Additionally, as individualsunder 15 years of age constitute a quarter of the globalpopulation and almost half of the population in sub-SaharanAfrica, interventions that reduce non-communicablediseases may entail substantial cost savings for globalhealth systems(2,15).
The limited evidence on adolescents’ diets is mostlyattributable to scattered data availability and quality(5).Dietary intake studies are typically confined to onecountry and based on small cross-sectional samples,usually from urban populations, which limits compar-ability within and across countries, as well as over time.
Public Health Nutrition: 20(1), 72–81 doi:10.1017/S1368980016001865
*Corresponding author: Email [email protected] © The Authors 2016

A further challenge is the comparability of dietary assess-ment methods across studies(5,16).
The present study documents changes in dietarydiversity and dietary composition among adolescents inEthiopia, India, Peru and Vietnam between 2006 and 2013.We investigated the degree to which convergence indietary diversity occurred across countries as well aswithin countries along three dimensions: gender, urbanresidence and household wealth. The prevalence in theconsumption of foods with added sugars was alsoassessed.
The study is unique in that it draws from large-scale,cross-country data of the Young Lives study. Two cohortswere sampled and assessed using the same standardizedapproach in each country. Findings from the analysis caninform our understanding of the changes entailed by thenutrition transition and the speed at which they are takingplace among adolescents in developing countries.
Participants and methods
Young Lives StudyThe investigation draws on Young Lives, a longitudinalstudy of childhood poverty conducted in four countries:Ethiopia, India (Andhra Pradesh and Telangana), Peru andVietnam over 15 years (www.younglives.org.uk)(16). Amultistage sampling approach was used to select the studyparticipants. First, within each country, twenty ‘sentinelsites’ were selected in order to reflect the diversity ofgeographical, socio-economic and cultural contexts of thecountry, but which were not intended to be necessarilynationally representative. Second, within each sentinelsite, about 100 households with a child aged between 6and 18 months (younger cohort, YC) and about fiftyhouseholds* with a child aged between 7 and 8 years(older cohort, OC) were randomly selected(16). Therefore,the two cohorts are comparable in terms of both samplingapproach and the communities in which they live. Moreinformation on country-specific sampling procedures havebeen documented elsewhere(17–20).
Child, household and community survey data werecollected over four rounds (2001/02, 2006–2007, 2009–2010 and 2013–2014); a fifth round is planned. Our ana-lysis focused on Round 2 data from the OC collectedbetween January and July 2006, and Round 4 data fromthe YC collected between August 2013 and March 2014,when adolescents from both cohorts were about 12 yearsof age. In each round, informed consent was given by thecaregivers and assent obtained from the adolescents(16).
Following the FAO guidelines on individual dietarydiversity, a structured questionnaire probing foods eatenduring the past 24 h was developed and administered by
trained fieldworkers to both the OC and the YC(21). Thisallowed us to investigate cross-cohort changes in dietaryquality in two populations of 12-year-olds living in thesame communities at two different points in time.
Attrition in Young Lives is extremely low, both inabsolute terms and relative to similar studies conducted inlow- and middle-income countries(22): between Rounds 1and 2, an estimated 1·8% of the OC children were lost tofollow up (Ethiopia: 1·9%; India: 1·3%; Peru: 3·6%; Viet-nam: 0·7%), while the attrition (excluding deaths) of theYC between Rounds 1 and 4 was 3·7% (Ethiopia: 2·2%;India: 2·6%; Peru: 6·3%; Vietnam: 3·6%)(23–26). As thepresent study compares two cohorts at a specific point intime, attrition is only a concern to the degree that it isdifferential across cohorts and affects their comparabilityin terms of the sampling. For this reason, attrition patternswere examined for both cohorts by adolescent’s gender,caregiver’s education and household wealth index atRound 1 (see online supplementary material, Supple-mental Table 1). Consistent with previous research(22),overall differences between the children who dropped outand the ones who remained in the study were minimalalthough some non-random patterns of attrition werefound in the case of India and Vietnam OC (for which thenumber of dropped-out children was extremely low).
Study settingsThe four study countries vary greatly in terms of socio-economic development, urbanization and stage in thenutrition transition. Of the four countries, Ethiopia had thelowest per capita income and experienced the highest rateof economic growth over the period (Table 1). The othercountries also underwent significant economic develop-ment. Undernutrition and micronutrient deficiencies arewidespread in all the countries, while overweight andobesity are emerging concerns, particularly in Peru and inurban areas of India, Ethiopia and Vietnam(27–29).
Outcome measuresIndividual dietary diversity and consumption of specificfood groups were the outcome measures for the analysisand were derived from the dietary diversity module of theYoung Lives study. Dietary diversity was defined as thenumber of food groups eaten by the adolescent during thepast 24 h from a predefined list of food groups(30–33).
OC and YC adolescents were asked to describe all themeals and snacks they had eaten in the previous 24 h withfurther probing using country-specific lists of commonlyeaten foods in order to determine, for each food group,whether at least one food item had been eaten. Field-workers were specifically instructed to ask about theintervals between meals in order to accurately reconstructthe respondent’s dietary diversity during the previous dayand limit exclusion of meals, particularly snacks. Thespecific food items used as examples for the food groups
* In Peru, fifty or twenty-five OC children were selected depending on thesentinel site.
Cross-country trends in adolescent diets 73

were adapted in order to reflect the local diets in eachcountry. For example, items such as chapattis or injera,both common items in the ‘grains group’, were specificallymentioned in the India and Ethiopia versions of thequestionnaire, respectively.
The eleven and fifteen food groups listed in 2006 and2013 respectively were collapsed into seven food groups asfollows to construct individual dietary diversity scores(30,31):(i) grains, roots and tubers; (ii) fruits and vegetables;(iii) meat, offal and fish (generically called ‘meat and fish’);(iv) eggs; (v) pulses, legumes and nuts; (vi) milk and milkproducts; and (vii) food cooked in oil or fat. In the OC data,it was not possible to disaggregate between ‘vitamin A-richplant foods’ and ‘other fruits and vegetables’ and so onlyseven food groups, instead of eight, were generated toallow for comparability with the YC sample. Foods withadded sugars are not included in the dietary diversitymeasure as they do not contribute to healthy diets(30,31).Nevertheless, this food group was also analysed due to itsassociation with overweight and obesity(34).
Data cleaning and statistical analysisSome data cleaning was necessary in order to compute thedietary diversity scores. For the grains, roots and tubers foodgroup for Vietnam YC, the Round 3 responses were usedinstead of the Round 4 responses as rice was not translatedinto the local language during the Round 4 data collectionand therefore this food group was likely under-reported.*Consumption of meat, fish and eggs was coded as missingvalues in the raw data if the adolescent declared that he/she
was vegetarian. These values were recoded as zero ifthey were missing in the case of vegetarian adolescents.Most replacements were done in India, where forty andfifty-seven vegetarian adolescents were found in the OC andYC, respectively. Three OC and twelve YC adolescents werevegetarian in Ethiopia, while fifteen YC adolescents werevegetarian in Vietnam and were therefore replaced. Novegetarian adolescents were identified in Peru.
Dietary diversity scores could not be computed foradolescents who did not respond to any of the questionsin the module. After these exclusions and the above-mentioned cleaning, data on dietary diversity andconsumption of food groups were available for 978, 994,683 and 990 adolescents in the OC in Ethiopia, India, Peruand Vietnam, and for 1867, 1909, 1724 and 1891 adoles-cents in the YC in Ethiopia, India, Peru and Vietnam,respectively. The final analytic sample represented about99% of the original sample.
Descriptive statistics and the differences in covariates bycohort and country were assessed using t tests. Covariatesincluded the following: adolescent’s gender and age inmonths; main caregiver’s age, gender and years ofschooling; head of the household’s age and gender;household size and place of residence (urban/rural); and awealth index constructed on the basis of the household’saccess to services (sanitation, water, electricity, cookingfuel), quality of housing (number of rooms, quality ofroofing, walls and floors) and ownership of durableassets(17–20). The wealth index ranges from 0 to 1. Similarindices have been used in other studies from low-resourcesettings as a proxy for socio-economic status(35).
Descriptive statistics and the differences in the outcomevariables by cohort were estimated for each country usingt tests. For each country, multivariate linear regressionmodels on pooled cohort data were fitted by adjusting for
Table 1 Study settings: national data
Ethiopia India Peru Vietnam
2006 2013 2006 2013 2006 2013 2006 2013
GDP per capita, PPP 796 1336 3514 5244 7975 11395 3687 5125GDP per capita growth (annual %) 7·8 7·7 7·7 5·6 6·3 4·4 5·8 4·3Employment in agriculture (% of total employment)† 79·3 – 55·8 47·2 32·9 25·8 51·7 47·4Prevalence of stunting (% of children under 5 years)‡,§ 50·7 40·4 47·9 – 29·8 18·4 31·8 23·3Prevalence of overweight (% of children under 5 years)§,|| 5·1 2·6 1·9 – 9·1 7·2 3·1 4·6Prevalence of vitamin A deficiency in children ofpre-school age(%)¶
46 62 15 12
Average supply of protein of animal origin (g/capita per d)†† 7 8 11 12 24 26 24 26
GDP, gross domestic product; PPP, purchasing power parity.Data on GDP, GDP growth, employment in agriculture, stunting and overweight were retrieved from the World Bank(43); data on vitamin A deficiency weresourced from the WHO(44); and data on protein supply were sourced from the FAO(45).†Data for Ethiopia relate to 2005 (latest available), for India to 2005 and 2012, for Peru to 2006 and 2011, and for Vietnam to 2006 and 2012.‡Percentage of children under age 5 years whose height-for-age is below –2 SD from the median height-for-age of the WHO reference population of thecorresponding age.§Data for Ethiopia relate to 2005 and 2014, for India to 2006 (latest available), for Peru to 2005 and 2012, and for Vietnam to 2006 and 2010.||Percentage of children under age 5 years whose weight-for-height is more than 2 SD above the median weight-for-height of the international referencepopulation of the corresponding age.¶Latest data available: Ethiopia 1996–1997, India 2001–2003, Peru 2001, Vietnam 2001.††Data relate to the average 2005–2007 and 2009–2011 (latest available).
* The robustness of this imputation was checked by conducting the sta-tistical analyses on a dietary diversity score that excluded the cereals andgrains groups for Vietnam. There were no differences in the results basedon the two indices, which suggests that the imputation of the previousround of data for this food group does not hamper our findings.
74 E Aurino et al.

the covariates outlined above with clustered standard errorsat the sentinel site level. In addition, each model includeda cohort dichotomous variable and interactions betweenthis variable and adolescent gender, place of residenceand wealth index tertile. The interaction terms allowed usto model potentially non-linear relationships. Predictedmargins of the outcome variables for each country werethen computed to adjust for the covariates and uncondi-tional standard errors were assumed. Margins provide thepredicted value of dietary diversity (or consumption of thefood group) of the adolescent after adjusting for backgroundcharacteristics. In the case of the interactions (e.g. urban/rural), those adjusted predictions provide the value of diet-ary diversity for an ‘average’ adolescent living in an urbanarea and compare it with the value estimated for a ruraladolescent, after adjusting for all the other characteristics.We investigated differences by gender, place of residence(rural/urban) and household wealth. The statistical softwarepackage Stata version 13 was used for the analysis.
Results
How do the two cohorts compare in terms ofbackground characteristics?Table 2 presents the covariate means from each countryand cohort. The gender composition of the sample wascomparable across cohorts and within country, except forIndia, where more males were present. Statisticallysignificant differences by age between the cohorts werenoted. In all countries except Peru, the wealth indeximproved over the 2006–2013 period, suggesting improvedstandards of living (Table 1). The finding related to Perumay be a result of the sampling, as only twenty-fivehouseholds (instead of fifty) were recruited from some ruralsites in Round 1(19). In the other countries, the proportion ofurban households was fairly stable across the two cohorts.
Are there cross-cohort differences in dietarydiversity and consumption of food groups?Table 3 presents the predicted values of dietary diversityby cohort and country, as well as consumption of each ofthe food groups and added sugars, after adjusting for thecovariates (see online supplementary material, Supple-mental Table 2 for the raw means). Over the 8 years,dietary diversity increased in Ethiopia and Peru althoughdifferent food groups were responsible for the observedchange (P< 0·001). In Ethiopia, the YC had higher con-sumption of fruit and vegetables by +36% (P< 0·001) andfoods cooked in oil by +18% (P= 0·002) compared withthe OC at the same age. In Peru the YC consumed moreanimal-source foods, specifically meat and fish (+72%,P< 0·001) and milk and dairy products (+16%, P= 0·004)compared with the OC. Meat, rather than fish, drove thissignificant increase in the meat and fish group in the YC(result not shown). Ta
ble
2Des
criptivestatisticsforco
varia
tesus
edin
thean
alysis
andPva
lues
ofdiffe
renc
esin
mea
nva
lues
,by
coun
tryan
dco
hort,Yo
ungLive
sstud
y
Ethiopia
India
Peru
Vietnam
OC
–20
06(n
980)
YC
–20
13(n
1871
)OC
–20
06(n
994)
YC
–20
13(n
1914
)OC
–20
06(n
685)
YC
–20
13(n
1737
)OC
–20
06(n
990)
YC
–20
13(n
1900
)
Mea
nSD
Mea
nSD
Pva
lue
Mea
nSD
Mea
nSD
Pva
lue
Mea
nSD
Mea
nSD
Pva
lue
Mea
nSD
Mea
nSD
Pva
lue
Ado
lesc
ent’s
age(m
onths)
144·64
3·81
145·49
3·89
0·00
014
7·89
4·27
143·86
3·82
0·00
014
7·79
5·72
143·02
3·71
0·00
014
6·97
3·92
146·38
3·82
0·00
0Ado
lesc
entis
male
0·51
0·50
0·53
0·50
0·40
10·49
0·50
0·54
0·50
0·01
30·54
0·50
0·50
0·50
0·11
30·50
0·50
0·51
0·50
0·40
5Mainca
regive
r’sag
e(yea
rs)
39·33
9·52
42·05
9·55
0·00
034
·92
6·30
35·31
6·16
0·11
239
·60
8·51
38·80
7·90
0·02
839
·21
7·41
39·55
7·81
0·25
3Mainca
regive
ris
male
0·04
0·19
0·25
0·43
0·00
00·02
0·13
0·01
0·12
0·52
70·02
0·14
0·01
0·09
0·01
60·04
0·19
0·08
0·27
0·00
0Mainca
regive
r’sye
arsof
educ
ation
2·13
3·47
2·37
3·66
0·08
72·31
3·79
3·32
4·40
0·00
07·20
4·49
7·55
4·37
0·07
76·75
3·83
7·55
3·18
0·00
0Hou
seho
ldhe
ad’s
age(yea
rs)
46·58
11·41
46·79
10·60
0·62
342
·51
9·62
41·24
7·97
0·00
043
·66
10·54
43·12
10·07
0·23
942
·08
8·44
43·88
10·51
0·00
0Hou
seho
ldhe
adis
male
0·74
0·44
0·73
0·44
0·60
90·89
0·31
0·89
0·31
0·76
30·80
0·40
0·83
0·38
0·13
80·87
0·34
0·86
0·35
0·36
0Hou
seho
ldsize
6·50
2·05
8·22
2·63
0·00
05·20
1·83
6·99
3·12
0·00
05·58
1·99
7·73
3·08
0·00
04·90
1·38
6·00
2·33
0·00
0Wea
lthinde
x†0·30
0·17
0·38
0·18
0·00
00·47
0·20
0·56
0·16
0·00
00·50
0·22
0·48
0·16
0·00
10·51
0·17
0·64
0·26
0·00
0Urban
‡0·40
0·49
0·40
0·49
0·86
70·24
0·43
0·28
0·45
0·03
20·75
§0·43
0·47
0·50
0·00
00·20
0·40
0·20
0·40
0·72
4
OC,olde
rco
hort(born19
94/95);YC,yo
unge
rco
hort(born20
01/02).
†Wea
lthinde
xis
aco
mpo
site
asse
tinde
xwhich
rang
esfrom
0to
1.‡The
defin
ition
ofurba
n/ruralisba
sedon
each
coun
try’sNationa
lStatistical
Office
defin
ition
.§A
subs
tantivelylarger
prop
ortio
nof
theOC
inPeruis
urba
n,be
caus
eon
lytwen
ty-fivech
ildrenwererecruitedin
someof
theprov
incial
sitestowards
theen
dof
theen
rolm
entin
thefirst
roun
dof
thestud
y.
Cross-country trends in adolescent diets 75

While dietary diversity was stable across cohorts in Indiaand Vietnam, some significant changes by individual foodgroups occurred. As compared with the OC, a largerproportion of YC adolescents consumed eggs (India: +32%,P=0·038; Vietnam: +50%, P<0·001) and milk and dairyproducts (India: +12%, P=0·029; Vietnam: +46%, P<0·001).The YC in Vietnam was less likely to consume foods cookedin oil (−68%, P=<0·001), while in India YC consumption ofpulses, legumes and nuts decreased by 57% (P=0·02).
During the period considered, the intake of addedsugars grew substantially in Ethiopia (+35%, P< 0·001)and Vietnam (+44%, P< 0·001). Compared with thesecountries, the prevalence of consumption was higher inPeru and India and stable across the cohorts.
Are there subgroup differences in dietary shifts?Figures 1 to 3 present predicted values of dietary diversityby gender, household wealth, place of residence andcohort. There were no marked disparities by gender(Fig. 1). In contrast, dietary diversity varied significantly bytertile of household wealth for both cohorts (Fig. 2). In2006, Ethiopia and Vietnam exhibited the widest differ-ence between the top and the lowest wealth tertiles indietary diversity (inter-tertile gap, Ethiopia: 0·72, P< 0·001;Vietnam: 0·61, P< 0·001), followed by India (inter-tertilegap: 0·31, P= 0·004). Over the 2006–2013 period,inequalities in food consumption based on householdwealth tertiles disappeared in Ethiopia and India, anddecreased in the case of Vietnam (inter-tertile gap: 0·26,
P= 0·029). Finally, Fig. 3 presents disparities by place ofresidence. Urban/rural gaps in dietary diversity were notapparent in India and Ethiopia at either point in time.By contrast, pro-urban differences were evident in 2006and waned over time in Peru and Vietnam. In Peru, thisresult was driven by an increase in dietary diversity in bothurban and rural areas (P< 0·001, result not shown).
Which food groups drove within-country variationover time in dietary diversity?We investigated whether these overall shifts occurredhomogeneously across socio-economic groups withincountries. Figure 4 illustrates uneven trends in the con-sumption of the food groups that represent the principalsources of protein (pulses, legumes and nuts; meat andfish; eggs; and milk and dairy products) by wealth tertilesfor the four countries(5). In Ethiopia, predicted consump-tion of pulses, legumes and nuts among adolescentsfrom less wealthy households converged over time to theprevalence exhibited by adolescents from more affluenthouseholds, which remained relatively stable. Conver-gence was also noted in India for the same food group, butto a lower prevalence across all wealth tertiles for the YC(OC: 0·108, P= 0·025; YC: −0·006, P= 0·839). In Peru, theconsumption of meat and fish increased homogeneouslyacross wealth tertiles although a small gap betweenchildren belonging to the top and the lowest wealthtertiles was evident for the YC (OC: 0·114, P= 0·105;YC: 0·067, P= 0·011). In Vietnam, the inter-tertile disparity
*
**6
5
4
3
2
1
0
Ethiopia
2006
(O
C)
2006
(O
C)
2013
(Y
C)
2013
(Y
C)
2006
(O
C)
2006
(O
C)
2013
(Y
C)
2013
(Y
C)
2006
(O
C)
2006
(O
C)
2013
(Y
C)
2013
(Y
C)
2006
(O
C)
2006
(O
C)
2013
(Y
C)
2013
(Y
C)
India Peru Vietnam
Die
tary
div
ersi
ty (
adju
sted
val
ues)
Fig. 1 Differences in dietary diversity by adolescent gender ( , girls; , boys), country and cohort (OC, older cohort (born 1994/95);YC, younger cohort (born 2001/02)), Young Lives study. Predicted margins, with their standard errors represented by vertical bars,adjusted for adolescent’s gender and age in months, caregiver’s age, gender and educational level, head of the household’s ageand gender, household size, wealth tertile, urban residence, cohort, and interactions between cohort and gender, cohort and wealthtertiles, and cohort and urban residence. *P< 0·1, **P< 0·05.
76 E Aurino et al.

in milk consumption widened in favour of adolescents in theleast poor tertile (OC: 0·15, P=0·016; YC: 0·199, P<0·000).
Figure 5 presents differing patterns in the prevalence ofconsumption of added sugars by place of residence.
In Ethiopia, consumption increased in both rural and urbanareas while the urban–rural gap was maintained (OC: 0·18,P=0·041; YC: 0·197, P<0·000). A striking convergence wasobserved in Vietnamwhere added sugar consumption in rural
***
******
**
6
5
4
3
2
1
0
Ethiopia
2006
(O
C)
2006
(O
C)
2013
(Y
C)
2013
(Y
C)
2006
(O
C)
2006
(O
C)
2013
(Y
C)
2013
(Y
C)
2006
(O
C)
2006
(O
C)
2013
(Y
C)
2013
(Y
C)
2006
(O
C)
2006
(O
C)
2013
(Y
C)
2013
(Y
C)
India Peru Vietnam
Die
tary
div
ersi
ty (
adju
sted
val
ues)
Fig. 2 Differences in dietary diversity by household wealth ( , poorest tertile, equivalent to the lowest household wealth tertile; ,least poor tertile, equivalent to the highest household wealth tertile), country and cohort (OC, older cohort (born 1994/95); YC,younger cohort (born 2001/02)), Young Lives study. Predicted margins, with their standard errors represented by vertical bars,adjusted for adolescent’s gender and age in months, caregiver’s age, gender and educational level, head of the household’s ageand gender, household size, wealth tertiles, urban residence, cohort, and interactions between cohort and gender, cohort andwealth tertiles, and cohort and urban residence. **P< 0·05, ***P< 0·01
*** *****
6
5
4
3
2
1
0
Ethiopia
2006
(O
C)
2006
(O
C)
2013
(Y
C)
2013
(Y
C)
2006
(O
C)
2006
(O
C)
2013
(Y
C)
2013
(Y
C)
2006
(O
C)
2006
(O
C)
2013
(Y
C)
2013
(Y
C)
2006
(O
C)
2006
(O
C)
2013
(Y
C)
2013
(Y
C)
India Peru Vietnam
Die
tary
div
ersi
ty (
adju
sted
val
ues)
Fig. 3 Differences in dietary diversity by place of residence ( , rural; , urban), country and cohort (OC, older cohort (born 1994/95); YC, younger cohort (born 2001/02)), Young Lives study. Predicted margins, with their standard errors represented by verticalbars, adjusted for adolescent’s gender and age in months, caregiver’s age, gender and educational level, head of the household’sage and gender, household size, wealth tertiles, urban residence, cohort, and interactions between cohort and gender, cohort andwealth tertiles, and cohort and urban residence. **P< 0·05, ***P< 0·01
Cross-country trends in adolescent diets 77

areas was low relative to urban areas in 2006, but compar-able to urban areas in 2013 (OC: 0·26, P=0·003; YC: 0·037,P=0·477). In India and Peru, prevalence of sugar consump-tion decreased in urban areas while it increased in rural areas,resulting in narrower disparities based on location.
Discussion
The present study documents dramatic and rapid shiftsin diets among two comparable cohorts of adolescents
in Ethiopia, India, Peru and Vietnam that took placebetween 2006 and 2013. For example, dietary diversityamong 12-year-olds increased in Ethiopia and Peru whileinter-country disparities in overall dietary qualityremained, reflecting different stages of economic devel-opment and nutrition transition(36). Our results alsoprovide some indications that adolescents’ dietary diver-sity is converging across population subgroups withincountries, particularly with respect to household wealth.
While the dietary diversity score provides a goodindication of shifting diets across and within countries
EthiopiaLegumes
0.8
0.90.80.70.60.50.4
1.0
0.4
0.10.20.30.40.50.6
0.6
OC, 2006 YC, 2013Cohort
OC, 2006 YC, 2013Cohort
Line
ar p
redi
ctio
nLi
near
pre
dict
ion
Line
ar p
redi
ctio
n
0.10.20.30.40.50.6
Line
ar p
redi
ctio
n
OC, 2006 YC, 2013Cohort
OC, 2006 YC, 2013Cohort
IndiaLegumes
VietnamDairy
PeruMeat & fish
Fig. 4 (colour online) Heterogeneity in consumption of food groups contributing to protein consumption by household wealth (wealthtertiles defined based on household wealth, which was estimated as wealth index: , poorest tertile; , second tertile; ,least poor tertile), country and cohort (OC, older cohort (born 1994/95); YC, younger cohort (born 2001/02)), Young Lives study.Predicted margins, with their 95% confidence intervals represented by vertical bars, adjusted for adolescent’s gender and age inmonths, caregiver’s age, gender and educational level, head of the household’s age and gender, household size, wealth tertiles,urban residence, cohort, and interactions between cohort and gender, cohort and wealth tertiles, and cohort and urban residence
Ethiopia
0.98
1.02
1.00
0.7
0.6
0.5
0.4
0.3
0.2
0.94
0.6
0.7
0.8
0.9
1.0
0.96
OC, 2006 YC, 2013Cohort
OC, 2006 YC, 2013Cohort
Line
ar p
redi
ctio
nLi
near
pre
dict
ion
Line
ar p
redi
ctio
n
0.2
0.4
0.6
0.8
Line
ar p
redi
ctio
n
OC, 2006 YC, 2013Cohort
OC, 2006 YC, 2013Cohort
India
VietnamPeru
Fig. 5 (colour online) Heterogeneity in consumption of added sugars consumption by place of residence ( , rural; , urban),country and cohort (OC, older cohort (born 1994/95); YC, younger cohort (born 2001/02)), Young Lives study. Predicted margins,with their 95% confidence intervals represented by vertical bars, adjusted for adolescent’s gender and age in months, caregiver’sage, gender and educational level, head of the household’s age and gender, household size, wealth tertiles, urban residence,cohort, and interactions between cohort and gender, cohort and wealth tertiles, and cohort and urban residence
78 E Aurino et al.
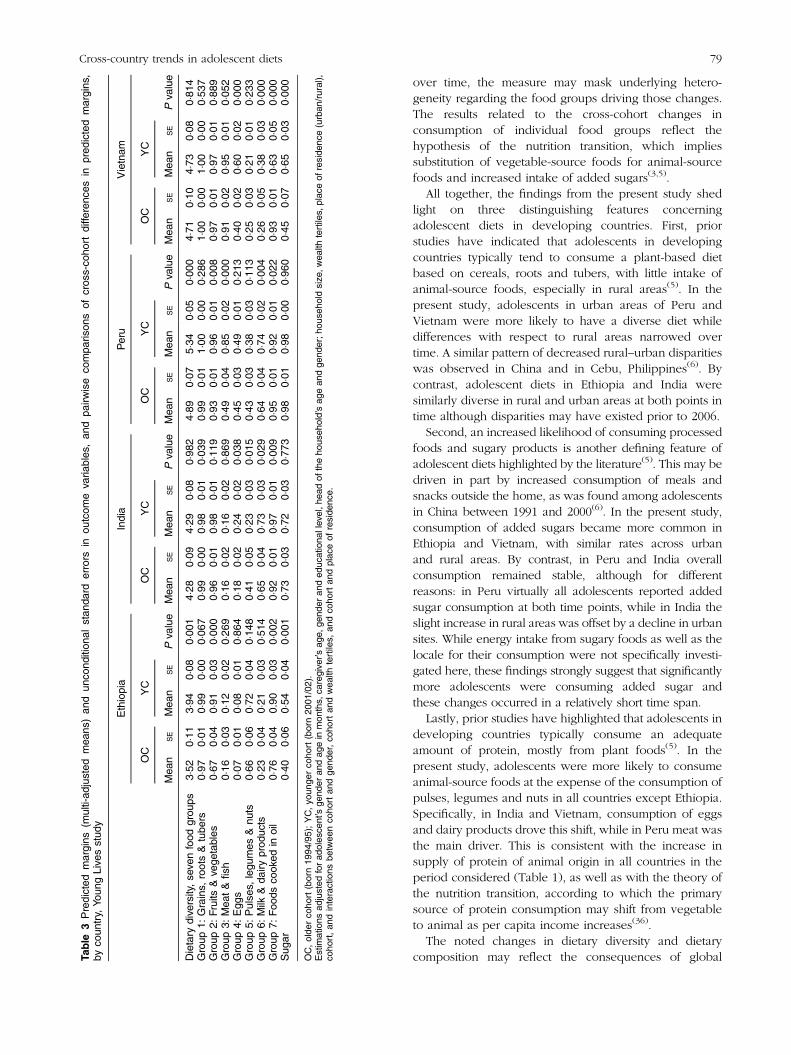
over time, the measure may mask underlying hetero-geneity regarding the food groups driving those changes.The results related to the cross-cohort changes inconsumption of individual food groups reflect thehypothesis of the nutrition transition, which impliessubstitution of vegetable-source foods for animal-sourcefoods and increased intake of added sugars(3,5).
All together, the findings from the present study shedlight on three distinguishing features concerningadolescent diets in developing countries. First, priorstudies have indicated that adolescents in developingcountries typically tend to consume a plant-based dietbased on cereals, roots and tubers, with little intake ofanimal-source foods, especially in rural areas(5). In thepresent study, adolescents in urban areas of Peru andVietnam were more likely to have a diverse diet whiledifferences with respect to rural areas narrowed overtime. A similar pattern of decreased rural–urban disparitieswas observed in China and in Cebu, Philippines(6). Bycontrast, adolescent diets in Ethiopia and India weresimilarly diverse in rural and urban areas at both points intime although disparities may have existed prior to 2006.
Second, an increased likelihood of consuming processedfoods and sugary products is another defining feature ofadolescent diets highlighted by the literature(5). This may bedriven in part by increased consumption of meals andsnacks outside the home, as was found among adolescentsin China between 1991 and 2000(6). In the present study,consumption of added sugars became more common inEthiopia and Vietnam, with similar rates across urbanand rural areas. By contrast, in Peru and India overallconsumption remained stable, although for differentreasons: in Peru virtually all adolescents reported addedsugar consumption at both time points, while in India theslight increase in rural areas was offset by a decline in urbansites. While energy intake from sugary foods as well as thelocale for their consumption were not specifically investi-gated here, these findings strongly suggest that significantlymore adolescents were consuming added sugar andthese changes occurred in a relatively short time span.
Lastly, prior studies have highlighted that adolescents indeveloping countries typically consume an adequateamount of protein, mostly from plant foods(5). In thepresent study, adolescents were more likely to consumeanimal-source foods at the expense of the consumption ofpulses, legumes and nuts in all countries except Ethiopia.Specifically, in India and Vietnam, consumption of eggsand dairy products drove this shift, while in Peru meat wasthe main driver. This is consistent with the increase insupply of protein of animal origin in all countries in theperiod considered (Table 1), as well as with the theory ofthe nutrition transition, according to which the primarysource of protein consumption may shift from vegetableto animal as per capita income increases(36).
The noted changes in dietary diversity and dietarycomposition may reflect the consequences of globalTa
ble
3Predicted
margins
(multi-ad
justed
mea
ns)an
dun
cond
ition
alstan
dard
errors
inou
tcom
eva
riables
,an
dpa
irwise
compa
rison
sof
cros
s-co
hort
diffe
renc
esin
pred
icted
margins
,by
coun
try,
Youn
gLive
sstud
y
Ethiopia
India
Peru
Vietnam
OC
YC
OC
YC
OC
YC
OC
YC
Mea
nSE
Mea
nSE
Pva
lue
Mea
nSE
Mea
nSE
Pva
lue
Mea
nSE
Mea
nSE
Pva
lue
Mea
nSE
Mea
nSE
Pva
lue
Dietary
dive
rsity,se
venfood
grou
ps3·52
0·11
3·94
0·08
0·00
14·28
0·09
4·29
0·08
0·98
24·89
0·07
5·34
0·05
0·00
04·71
0·10
4·73
0·08
0·81
4Group
1:Grains,
roots&
tube
rs0·97
0·01
0·99
0·00
0·06
70·99
0·00
0·98
0·01
0·03
90·99
0·01
1·00
0·00
0·28
61·00
0·00
1·00
0·00
0·53
7Group
2:Fruits
&ve
getables
0·67
0·04
0·91
0·03
0·00
00·96
0·01
0·98
0·01
0·11
90·93
0·01
0·96
0·01
0·00
80·97
0·01
0·97
0·01
0·88
9Group
3:Mea
t&fish
0·16
0·03
0·12
0·02
0·26
90·16
0·02
0·16
0·02
0·86
90·49
0·04
0·85
0·02
0·00
00·91
0·02
0·95
0·01
0·05
2Group
4:Egg
s0·07
0·01
0·08
0·01
0·86
40·18
0·02
0·24
0·02
0·03
80·45
0·03
0·49
0·01
0·21
30·40
0·02
0·60
0·02
0·00
0Group
5:Pulse
s,legu
mes
&nu
ts0·66
0·06
0·72
0·04
0·14
80·41
0·05
0·23
0·03
0·01
50·43
0·03
0·38
0·03
0·11
30·25
0·03
0·21
0·01
0·23
3Group
6:Milk
&da
iryprod
ucts
0·23
0·04
0·21
0·03
0·51
40·65
0·04
0·73
0·03
0·02
90·64
0·04
0·74
0·02
0·00
40·26
0·05
0·38
0·03
0·00
0Group
7:Foo
dsco
oked
inoil
0·76
0·04
0.90
0·03
0·00
20·92
0·01
0·97
0·01
0·00
90·95
0·01
0·92
0·01
0·02
20·93
0·01
0·63
0·05
0·00
0Sug
ar0·40
0·06
0·54
0·04
0·00
10·73
0·03
0·72
0·03
0·77
30·98
0·01
0·98
0·00
0·96
00·45
0·07
0·65
0·03
0·00
0
OC,olde
rco
hort(born19
94/95);YC,yo
unge
rco
hort(born20
01/02).
Estim
ations
adjusted
forad
oles
cent’sge
nder
andag
ein
mon
ths,
caregive
r’sag
e,ge
nder
anded
ucationa
llev
el,h
eadof
theho
useh
old’sag
ean
dge
nder;h
ouse
hold
size
,wea
lthtertiles,
plac
eof
reside
nce(urban
/rural),
coho
rt,an
dinteractions
betwee
nco
hortan
dge
nder,co
hortan
dwea
lthtertiles,
andco
hortan
dplac
eof
reside
nce.
Cross-country trends in adolescent diets 79

economic forces on food systems(37). Within-countrydisparities however may be exacerbated or reduced,depending on how these forces interact with thesocio-economic and political context(37). Changes andconvergence in diets can be particularly pronounced foradolescents, who may be more exposed to and influencedby food environmental factors related to the nutritiontransition such as food advertising and promotion(4,37). Theresults suggest that the four countries could be placed alongthe continuum of the nutrition transition as follows: Ethiopia(earlier stage), India (intermediate stage), Vietnam (inter-mediate stage) and Peru (later stage). This assessment caninform the design of policies and strategies to avert thenegative consequences of the nutrition transition(38).
Some limitations merit discussion. Individual dietarydiversity is considered a proxy for the macro- and micro-nutrient adequacy of the diet for different age groupsincluding adolescents and is associated with individualnutrient adequacy(30,32,33). Nevertheless, research in this areais still ongoing and, except for women of reproductive ageand infants and young children, there are no definiteguidelines on which food groups should be included in thescore for different sex/age groups(21,39,40). In contrast tonutrient intake assessments, this measure is less burdensometo collect and simpler to analyse. However, the measure didnot include quantities or nutritional quality of the reportedfoods, including consumption of ultra-processed foodswhich can have significant impacts on energy and nutrientintakes(41). Other shortcomings of the data were as follows.The data are based on a description of meal content over24h. There may have been some inaccuracy and possiblerecall bias in reporting all foods consumed but care wastaken to reconstruct everything eaten from waking in themorning to sleeping at night in order to avoid missing snacksbetween meals. Alternatively, willingness to report fromadolescents may be affected by psychosocial factors relevantto this age group, such as concerns related to body image(5).The covariate analysis in Table 2 illustrates socio-demographic differences between the two cohorts, an issuethat has been highlighted in other cross-cohort studies(42).The multivariate estimation of predicted margins sought touncover trends that could not be ascribed to the differingsociodemographic profiles of the cohorts. More research onother factors that may underlie changing diets, such aschanges in preferences, tastes and food environments, isneeded. Finally, the data were not nationally representative.Despite this, analysis of key living standards indicatorsfrom Young Lives suggests that the type of variation foundin Young Lives data is comparable with nationallyrepresentative surveys from the same countries(16).
Conclusions
The current study presents new evidence regarding thenutrition transition and dietary composition among
adolescents in four very different low- and middle-incomecountries. Dietary diversity increased for most countrieswhile indications of intra-country convergence by householdwealth and place of residence were observed. However,care should be taken in drawing general conclusions givensignificant heterogeneity of diets both across and withincountries. Regardless of this, the speed in which diets aretransforming clearly signals the urgent need for global,regional and context-specific policies to avert negative andcostly consequences for health-care systems and societalwell-being. For children and adolescents in particular,school-based policies and interventions hold promise forpromoting healthy diets over the life course.
Acknowledgements
Acknowledgement: The authors would like to acknowledgethe Young Lives study for providing them with preferentialaccess to the data. Financial support: This research receivedno specific grant from any funding agency in the public,commercial or not-for-profit sectors. E.A. received partialsupport from The Sackler Institute for Nutritional Science.Young Lives is funded from 2001 to 2017 by UK Aid from theDepartment for International Development (DFID) andco-funded by Irish Aid from 2014 to 2015. None of thefunders had a role in the design, analysis or writing of thisarticle. The views expressed are those of the authors. Theyare not necessarily those of, or endorsed by, Young Lives,the University of Oxford or DFID. Conflict of interest: M.E.P.has received research funding from the food industry forunrelated studies. The other authors declare no competinginterests. Authorship: E.A. formulated the research questions,had access to the data in the study, analysed the data andprepared the results. M.F. contributed to develop theresearch questions. E.A. and M.F. wrote the report.M.E.P. contributed to the design of the survey instrumentsand to the draft and revisions of the report. Ethics of humansubject participation: This study was conducted according tothe guidelines laid down in the Declaration of Helsinki. Theethics committee of Oxford University approved the study.
Supplementary material
To view supplementary material for this article, please visithttp://dx.doi.org/10.1017/S1368980016001865
References
1. Lozano R, Naghavi M, Foreman K et al. (2012) Global andregional mortality from 235 causes of death for 20 age groupsin 1990 and 2010: a systematic analysis for the Global Burdenof Disease Study 2010. Lancet 380, 2095–2128.
2. Forouzanfar MH, Alexander L, Anderson HR et al. (2015)Global, regional, and national comparative risk assessmentof 79 behavioural, environmental and occupation, and
80 E Aurino et al.

metabolic risks or clusters of risks in 188 countries, 1990–2013: a systematic analysis for the Global Burden of DiseaseStudy 2013. Lancet 386, 2287–2323.
3. Popkin BM (1998) The nutrition transition and its healthimplications in lower-income countries. Public Health Nutr1, 5–21.
4. Imamura F, Micha R & Khatibzadeh S (2015) Dietary qualityamong men and women in 187 countries in 1990 and 2010:a systematic assessment. Lancet Glob Health 3, e132–e142.
5. Ochola S & Masibo PK (2015) Dietary intake of school-children and adolescents in developing countries. Ann NutrMetab 64, Suppl. 2, 24–40.
6. Adair L & Popkin B (2005) Are child eating patterns beingtransformed globally? Obes Res 13, 1281–1299.
7. Wang Y & Lim H (2012) The global childhood obesityepidemic and the association between socio-economic sta-tus and childhood obesity. Int Rev Psychiatry 24, 176–188.
8. Farsani SF, van der Aa MP, van der Vorst MM et al. (2013)Global trends in the incidence and prevalence of type 2diabetes in children and adolescents: a systematic reviewand evaluation of methodological approaches. Diabetologia56, 1471–1488.
9. Ng M, Fleming T, Robinson M et al. (2014) Global, regional,and national prevalence of overweight and obesity inchildren and adults during 1980–2013: a systematic analysisfor the Global Burden of Disease Study 2013. Lancet 384,766–781.
10. Sawyer SM, Afifi RA, Bearinger LH et al. (2012)Adolescence: a foundation for future health. Lancet 379,1630–1640.
11. Patton GC, Coffey C, Cappa C et al. (2012) Health of theworld’s adolescents: a synthesis of internationallycomparable data. Lancet 379, 1665–1675.
12. Dufour DL, Goodman AH & Pelto GH (2012) NutritionalAnthropology: Biocultural Perspectives on Food andNutrition, 2nd ed. New York: Oxford University Press.
13. Dunn JE, Liu K, Greenland P et al. (2000) Seven-yeartracking of dietary factors in young adults: theCARDIA study. Am J Prev Med 18, 38–45.
14. Mikkilä V, Räsänen L, Raitakari O et al. (2005) Consistentdietary patterns identified from childhood to adulthood: theCardiovascular Risk in Young Finns Study. Br J Nutr 93,923–931.
15. Population Reference Bureau (2012) 2012 World PopulationData Sheet. http://www.prb.org/pdf12/2012-population-data-sheet_eng.pdf (accessed September 2015).
16. Barnett I, Ariana P, Petrou S et al. (2012) Cohort profile: theYoung Lives study. Int J Epidemiol 42, 701–708.
17. Alemu T, Asgedom G, Liebenberg J et al. (2003) Young LivesPreliminary Country Report: Ethiopia. Oxford: Young Lives.
18. Galab S, Reddy MG, Antony P et al. (2003) Young LivesPreliminary Country Report: Andhra Pradesh, India.Oxford: Young Lives.
19. Escobal J, Lanata C, Madrid S et al. (2003) Young LivesPreliminary Country Report: Peru. Oxford: Young Lives.
20. Tuan T, Lan PT, Harpham T et al. (2003) Young Lives Pre-liminary Country Report: Vietnam. Oxford: Young Lives.
21. Kennedy G, Ballard T & Dop MC (2010) Guidelines forMeasuring Household and Individual Dietary Diversity.Rome: FAO.
22. Outes-Leon, I & Dercon S (2008) Survey Attrition andAttrition Bias in Young Lives. Young Lives Technical Noteno. 5. Oxford: Young Lives.
23. Young Lives (2014) Young Lives Survey Design andSampling in Ethiopia. Oxford: Young Lives.
24. Young Lives (2014) Young Lives Survey Design andSampling in India. Oxford: Young Lives.
25. Young Lives (2014) Young Lives Survey Design andSampling in Peru. Oxford: Young Lives.
26. Young Lives (2014) Young Lives Survey Design andSampling in Vietnam. Oxford: Young Lives.
27. Chaparro MP & Estrada L (2012) Mapping the nutritiontransition in Peru: evidence for decentralized nutritionpolicies. Rev Panam Salud Publica 32, 241–244.
28. Amare B, Moges B, Moges F et al. (2012) Nutritional statusand dietary intake of urban residents in Gondar, NorthwestEthiopia. BMC Public Health 12, 752.
29. Bishwajit G, Ide S, Hossain MA et al. (2014) Trade liberal-ization, urbanization and nutrition transition in Asiancountries. J Nutr Health Food Sci 2, 5.
30. Ruel MT (2003) Operationalizing dietary diversity: a reviewof measurement issues and research priorities. J Nutr 133,11 Suppl. 2, 3911S–3926S.
31. Swindale A & Bilinsky P (2005) Household Dietary DiversityScore (HDDS) for Measurement of Household Food Access:Indicator Guide. Version 2. Washington, DC: Food andNutrition Technical Assistance III Project (FANTA).
32. Steyn NP, Nel JH, Nantel G et al. (2006) Food variety anddietary diversity scores in children: are they good indicatorsof dietary adequacy? Public Health Nutr 9, 644–650.
33. Mirmiran P, Azadbakht L, Esmaillzadeh A et al. (2004)Dietary diversity score in adolescents – a good indicator ofthe nutritional adequacy of diets: Tehran lipid andglucose study. Asia Pac J Clin Nutr 13, 56–60.
34. World Health Organization (2015) Guideline: Sugars Intakefor Adults and Children. Geneva: WHO.
35. Di Cesare M, Bhatti Z, Soofi S et al. (2015) Geographical andsocioeconomic inequalities in women and children’s nutri-tional status in Pakistan in 2011: an analysis of data from anationally representative survey. Lancet Glob Health 3,e229–e239.
36. Drewnowski A & Popkin BM (1997) The nutrition transition:new trends in the global diet. Nutr Rev 55, 31–43.
37. Hawkes C (2006) Uneven dietary development: linking thepolicies and processes of globalization with the nutritiontransition, obesity and diet-related chronic diseases.Glob Health 2, 4.
38. Popkin BM (2002) The shift in stages of the nutritiontransition in the developing world differs from past experi-ences! Public Health Nutr 5, 205–214.
39. Food and Agriculture Organization of the United Nations &FHI 360 (2016) Minimum Dietary Diversity for Women.A Guide for Measurement. Rome: FAO.
40. World Health Organization (2008) Indicators for AssessingInfant and Young Child Feeding Practices. Part I: Defini-tions. Geneva: WHO.
41. Monteiro CA, Bertazzi Levy R, Moreira Claro RG et al. (2011)Increasing consumption of ultra-processed foods and likelyimpact on human health: evidence from Brazil. PublicHealth Nutr 14, 5–13.
42. Dearth-Wesley T, Gordon-Larsen P, Adair LS et al. (2012)Longitudinal, cross-cohort comparison of physical activitypatterns in Chinese mothers and children. Int J Behav NutrPhys Act 9, 39.
43. World Bank (2015) World Development Indicators. http://data.worldbank.org/ (accessed September 2015).
44. World Health Organization (2009) Global prevalence ofvitamin A deficiency in populations at risk, 1995–2005.WHO Global Database on Vitamin A Deficiency. http://www.who.int/vmnis/vitamina/en/ (accessed September2015).
45. Food and Agriculture Organization of the United Nations(2015) Food security indicators. http://faostat.fao.org(accessed September 2015).
Cross-country trends in adolescent diets 81