the observer xt quick start guide human.vp
TRANSCRIPT

The ObserverÒ XT
Quick Start Guide
Using The Observer XT
for studying human behavior

Information in this document is subject to change without notice and does notrepresent a commitment on the part of Noldus Information Technology b.v. Thesoftware described in this document is furnished under a license agreement. Thesoftware may be used or copied only in accordance with the terms of the agreement.
Copyright © 2009 Noldus Information Technology b.v. All rights reserved. No part ofthis publication may be reproduced, transmitted, transcribed, stored in a retrievalsystem, or translated into any other language in whole or in part, in any form or by anymeans, without the written permission of Noldus Information Technology b.v.
Documentation: Fabrizio Grieco, Patrick Zimmerman.
The Observer is a registered trademark of Noldus Information Technology b.v. Otherproduct names are trademarks of their respective companies.
June 2009
Noldus Information Technology b.v.
International headquarters
Wageningen, The Netherlands
Phone +31-317-473300
Fax +31-317-424496
E-mail [email protected]
For addresses of our other offices and support, please see our web sitewww.noldus.com

Table of Contents
1 Up and Running quickly.................................................5
2 Getting Started ..............................................................6Work ing with Pro jects ............................................................6Cre at ing a Pro ject ..................................................................7Us ing The Ob server from start to fin ish ................................9
3 Setting up your project ................................................10Pro ject setup ........................................................................10De fin ing the Cod ing Scheme...............................................11Sub jects................................................................................12Be hav iors..............................................................................13Be hav ior Mod i fi ers...............................................................15Check ing your Cod ing Scheme............................................17In de pend ent Vari ables.........................................................17
4 Carrying out an observation.........................................18Ob ser va tion Set tings............................................................18Scor ing the events ...............................................................18Re cord ing phys i o log i cal data...............................................23
5 Selecting data ..............................................................25
6 Visualizing data ...........................................................28
7 Calculating statistics ....................................................30
8 Lag sequential analysis ................................................32
9 Reliability analysis........................................................33
10 Managing data and results...........................................35
Quick Start Guide 3


1 Up and Running quickly
Thank you for purchasing The Observer XT. You are now the owner of a highlyadvanced system for the collection, management and analysis of observationaldata. We hope that you enjoy using the system and that you will benefit from itin your research.
Using this Quick Start Guide
Before you start using this Quick Start Guide, we would like to point out thefollowing:
· We assume that you are familiar with the basic operations of Windows XP orVista.
· Only the most basic features of The Observer XT are addressed in this guide.Inevitably, some features that may be vital to your application are notdiscussed. Where possible, a reference to the Reference Manual is given foradditional information.
You can also access the printed documentation from yourcomputer desktop. The Quick Start Guide and the ReferenceManual are stored as PDF files on your PC, if you installed them(see Section 2.2 of The Observer XT 9.0 Reference Manual).
To access the PDF files, from the Windows Start menu select AllPrograms, Noldus, The Observer XT 9.0 and thenDocumentation.
In The Observer XT, from the Help menu, select Video Tutorial.Watch the tutorial to learn about how to set up an observationalstudy in The Observer XT 9.0.
Quick Start Guide 5
Up and Running quickly

2 Getting Started
Working with ProjectsA project is the container of all information related to an experimental setup. Aproject contains a coding scheme and independent variables, but can have more than one observation.
You can create as many projects as you want. You can open one project at atime. Once you have opened your project, you can view its content in the Project Explorer (see Figure 1 below).
6 The Observer XT
Section 2
Figure 1. The main window of The Observer XT. The Project Explorer on the leftcontains the main items Setup, Observations and Analysis. The Components view (grey area) contains the Project Setup menu.
Creating a Project
1 When you start The Observer, click The Observer XT project under Create anew project in the window that appears.
2 Give your project a name.
3 Click the Browse button to specify a location on your PC where you want theproject to be stored, or accept the default location.
4 Click the OK button. The New Project box closes and the project is displayedin the Project Explorer.
5 The Project window shows the main components: Setup, Observe andAnalyze.
· For more information about projects, see Chapters 4 and 15 of The ObserverXT 9.0 Reference Manual.
· To import an existing project from The Observer 4/5 versions, see Section12.1 of The Observer XT 9.0 Reference Manual.
The sample projects
The sample projects are stored on the Observer XT Sample Projects DVD forhuman research that came with the software. Nine of them are about humanbehavior (from the field of psychology, usability and ergonomy):
· A bad day in the office — In this project we see an office worker sufferingfrom a badly designed system, which leads to frustration, and in his case,aggression. It is meant as an illustration of the importance of user-centereddesign, a design methodology that places the needs of the user in the center of the system design process.
· Greeting rituals — In this sample project we are observing people greetingeach other in the arrivals hall of an international airport.
· Kids at play — This sample project concerns the behavior of two children,Suzanne and Erin, observed at different ages.
· Parent-child interaction — This sample project shows the interactionbetween a 6-year old girl, Suzanne, and her father. Suzanne is offered a chest of drawers full of toys. Her behavior is videotaped and her heart rate ismeasured using a Polar heart rate monitor.
· Discussion — This sample projects shows a discussion between an employee and her boss how to best deal with a personal problem of the employee. The body language (both body postures and gestures) of both the boss and theemployee has been coded in detail.
Quick Start Guide 7
Getting Started

· RSI Research — This sample project illustrates the use of detailed videoanalysis for the study of complex and rapid behaviors. The case studyconcerns an experimental setup designed for systematic observation ofmovements of wrist, elbow and shoulder joints that are liable to causerepetitive strain injury (RSI).
· Chat application — This sample project consists of a simulated usability testof a software applications Windows Messenger and Skype. The movie fileshows the captured image of the participant’s computer, with a close-up ofthe participant’s face displayed in an insert window. The screen capture wasproduced with the Screen Capture Module, a software-based tool thatgenerates a digital media file directly from the screen display. uLog was usedto log keyboard-related behaviors.
· Usability testing of cars — This project illustrates how you can use TheObserver XT to code and analyze the behavior of a driver. The accompanyingvideo footage has been taken from a camera and an eye-tracking device thatthe driver was wearing during the test. The gaze point of the driver was thensuperimposed on the video image to help the observer record manuallywhere the driver is looking at. This way one can combine gazing behaviorwith route characteristics, driving behavior and other data like car speed thatcan be imported in The Observer.
· Car race game — This project is an example of the use of The Observer ingaming research. It focuses on quantifying performance of computer gameplayers in relation for example to their gaming experience or age. Each player is asked to play an online car race game a number of times. The observer can score data from two video files, one showing the computer screen with aclose-up of the participant’s face displayed in an insert window, and the other displaying the gaze point recorded with a eye-tracking device. Computerevents like key presses are also recorded with uLog, and imported asseparate event logs within the observation. Furthermore, ECG is measuredfrom each player, so it is possible to relate player’s behavior to changes inECG activity.
For more information on the sample projects, see the Description of SampleProjects of The Observer XT on the Sample Projects DVD for human research.
Keep in mind that there are many ways to create a coding scheme, select dataand analyze them. A sample project is only an example of the many possibilities,all of which depend on the needs of your research.
8 The Observer XT
Section 2

Using The Observer from start to finish
1 Set up the project to specify whether you observe a live scene or from video,how you record data, and other options.
è page 10
2 Design your coding scheme and define the independent variables importantfor your study.
è page 11
3 Start an observation and collect data.
è page 18
If necessary, refine your coding scheme by adding elements orchanging their properties. For example, add a behavior you hadnot considered when designing the coding scheme.
4 Select data to create a data profile. The data profile is shown in form of asequence of selection filters (see Section 7.1 of the Reference Manual).
è page 25
5 Visualize your data in the form of charts, tables, and video highlights.
è page 28
6 Carry out analysis.
è page 30
7 If necessary, export the data and analysis result to other programs for furtheranalysis, or to add them to a presentation.
è page 35
Quick Start Guide 9
Getting Started

3 Setting up your project
Before you begin working with a project, you can customize The Observer inseveral ways. For more information, see Section 4.1 of The Observer XT 9.0Reference Manual.
When you create a new project, the Project window appears. The three tabs inthe Project window guide you through project settings. You start with setting theProject setup. Next, use the navigation pane at the bottom of the screen to move through the Project settings.
Project setupClick Set up project in the Project window or Project Setup in the ProjectExplorer.
In the Project Setup, you specify:
· The Observation source (Live or From video). In this section you alsospecify whether you record additional data (for example, physiological data)or video as you observe, and whether you want other programs to worktogether with The Observer XT.
If you plan to record video from a video camera connected to your computer or capture the screen of another computer, connect the video device before starting The Observer XT. Select Live, andselect the video device. We advise you to record video to DivXformat.
· The Observation method (Continuous sampling, Instantaneous sampling ora combination of the two methods).
· With continuous sampling, the event scored receives theactual time at which it has been entered.
· With Instantaneous sampling, the event scored receives thetime code of the sample point it belongs to.
· You can combine the two methods by scoring one or few focal subjects with Continuous sampling, and others withInstantaneous sampling.
· The Observation duration (open ended or limited by a maximum duration).
For more information about the Project Setup, see Section 4.3 of The Observer XT 9.0 Reference Manual.
10 The Observer XT
Section 3

Defining the Coding SchemeIn the coding scheme you define the behaviors and events you want to scoreand the subjects who perform those behaviors. For example:
Child Smiles.
You define Child as a Subject, and Smile as a Behavior.
· For a proper scientific study, the best practice is to use a pre-defined codingscheme. You can alter a coding scheme whilst designing an experiment, butyou should not compare data across observations made with different coding schemes.
· Contrary to The Observer 5, in The Observer XT the coding scheme is notnecessary to carry out an observation. You can record data by typing free textin the Comments column of the Event Log (see Section 5.4 of The ObserverXT 9.0 Reference Manual). However, remember that The Observer does notcalculate statistics on such data!
How to define a coding scheme
1 If you score events for two or more individuals during an observation, listthem in your project and assign key codes to them in the Subjects view (seebelow).
If you score behaviors of one individual in each observation, youdo not need to define Subjects. When you score data, it is implicitthat all events belong to that subject. However, remember todefine an independent variable (see page 19) that specifies thename of the individual for each observation.
2 List the behaviors and assign key codes to them in the Behaviors view. If two or more behaviors are related to each other, you can put them in a Behaviorgroup (see page 13).
3 If a behavior requires modifiers (that is, attributes that can change during anobservation, for example some detail to be added to the behavior), click thebutton in the Modifiers column (see page 15), and define modifiers for thatbehavior.
4 Check the coding scheme for errors and correct errors if there are any (seepage 17).
Quick Start Guide 11
Setting up your project

SubjectsAll possible individuals that perform a behavior must be defined as Subjects.
1 In the Project setup window, from the Setup menu, click Coding Scheme.
2 Click the Add Subject button, enter its Name and a Start key code.
If you only have one subject per observation, you do not needto use subjects in your coding scheme.
If you combine the Continuous recording method with theInstantaneous sampling method, you can assign subjects toeither methods, for example a focal subject to Continuous andother subjects to Instantaneous sampling.
If you score behaviors for two or more subjects in one observation, creatingseparate Subjects is not strictly necessary. To distinguish behaviors initiated bydifferent individuals, you could define behavior categories specific for differentindividuals. For example, if your research involves studying the interactionbehaviors between a parent and child (see Figure 2 above), you can define thefollowing behaviors Parent picks up object, Child picks up object, Parentsmiles, Child smiles, etc., This way Parent and Child do not need to be definedas Subjects, making scoring more efficient.
In general, you can choose between two strategies to code subjects andbehaviors:
· Define subjects, as many as there are individuals in an observation session.For example, Parent, Child 1, Child 2. For each behavior type define abehavior (see the below).
· For each behavior type, define as many behaviors as individuals in anobservation session, and give them unique names. For example, Child 1talks and Child 2 talks. Do not define subjects.
12 The Observer XT
Section 3
Figure 2. Defining subjects in the Subjects view.Two Subjects have been defined in this example.

The second strategy has the main advantage that you reduce the number of keypresses necessary to score an event. On the other hand, it increases the numberof behaviors in your coding scheme.
Whatever strategy you decide to apply, you probably wish to identify individualsin each observation session. For example, you want to know the names of thetwo or more children in a certain observation. Define as many independentvariables (see page 19) as individuals in a single observation session, forexample Name of Child 1 and Name of Child 2 for two children in yourobservation. Then you can enter the names for every observation.
Behaviors
1 To open the Coding Scheme, in the Project Explorer, click Coding Scheme.
2 If you have chosen the Continuous sampling method, in the Behaviors view,click the Add Behavior group button. In the New behavior group window,you can select either:
· Mutually exclusive states — Use this type of group to definebehaviors that cannot occur at the same time. A behaviorgroup with mutually exclusive elements corresponds to aBehavioral Class in The Observer 4/5.
· Start-stop states — Behaviors in this group can occur at thesame time. You have to manually stop a behavior.Choose this option also if all the behaviors of this group arePoint events (that is, with no duration).
If you have chosen the Instantaneous sampling method, in the Behaviorsview, click the Add sample group button.
If you have chosen to combine Continuous sampling and Instantaneoussampling, click the Add Behavior group button.
3 Next to Group name, enter the name of the behavior or sample group.
4 Under Behaviors, add the behaviors (or samples) that form the group. ForContinuous sampling, specify whether each behavior is an Initial StateEvent, a State event or a Point event (see the next page).If you use Instantaneous sampling, all samples are considered automaticallyas State events with duration equal to the sample interval.
5 When ready, click Create group. You can now assign the start and/or stopcode for each behavior, if necessary.
Quick Start Guide 13
Setting up your project

Types of behaviors
You can define three types of behaviors:
· State Events — Behaviors that take a period of time and therefore have aduration. For example, Typing. For State Events you can define a Start keycode and a Stop key code. If a State Event belongs to a group ofmutually-exclusive behaviors, you only need a Start key code, because thestart of a subsequent behavior automatically stops the previous behavior.
· Point Events — A behavior that only takes an instant in time, or whoseduration is not important. For example, Hit a key on the keyboard. For PointEvents you only define a Start key code, not a Stop key code.
If you want a state behavior from a mutually exclusive to bescored automatically at the start of the observation, select Initial State Event as Type.
· Sample — When scoring data with the Instantaneous sampling, behaviors are assumed to last as long as the current sample interval. For samples you candefine a Start keycode. The start of a new sample automatically stops thecurrent sample (unless you have scored the same behavior at subsequentsample points).
To create a new behavior in an existing group, click Add behavior or Addsample (depending on the observation method).
14 The Observer XT
Section 3
Figure 3. The Behaviors view from the Sample project A bad day in theoffice.

Examples of Behavior groups· Example 1 — To score interactions between two individuals and their body
language, you might have the following behavior groups:
· Gesture — With hands together, hand pointing, etc.
· Posture — With upright, leaning forward, etc.
· Gaze — With Looking to, Looking away, etc.
· Example 2 — In a study of usability testing of cars, you might have thefollowing behavior groups:
· Turns — With behaviors turn right and turn left.
· Driver's gaze — With behaviors gaze at left mirror, gaze atright mirror, gaze at dashboard, etc.
· Car motion— With behaviors in motion, still.
If two or more behaviors can occur simultaneously, put them (a) in separate behavior groups or (b) in a start-stop behaviorgroup.
· Example 3 (for Instantaneous sampling) — To quickly record the gazebehavior of two subjects, you might have the sample group Gaze withsamples Gaze at other subject, Gaze at table, Gaze at book, and Gaze atanywhere else.
Behavior ModifiersUse Modifiers to specify attributes of a behavior that can change during theobservation. Modifiers are optional. You can attach one or more modifiers to abehavior, in such a way that when you score a behavior you can also score oneor more modifiers.
1 To open the Coding Scheme, in the Project Explorer, click Coding Scheme.
To add a modifier, you need to have the Modifiers view open: to open theModifiers view, in the View Settings pane, select the Modifiers checkbox.
2 In the Modifiers view, click the Add Modifier group button.
3 Enter the name of the Modifier group, add Modifiers, link the Modifiergroup to one or more Behaviors and click Create group.
Quick Start Guide 15
Setting up your project

You can now change the start code, if necessary.
Example of Behavior modifiers
To record what type of play behavior a child exhibits, define the behavior Play.Then, in the Modifiers view, add a nominal Modifier group 'Type of play' andadd all relevant types of play (see Figure 4 for an example). Next, in the Link toBehaviors table, select the behavior Play and click Create group. In theBehaviors view, the Modifier group Target is now listed in the Modifierscolumn.
If you create modifiers, you need more key presses to score a complete event.You can prevent this by re-formulating the behaviors in such a way that theydescribe all possible combinations between the previous behaviors and theirmodifiers. For example, instead of defining the behavior Gaze at and itsmodifiers Keyboard, Monitor and Colleague, define the behaviors Gaze atKeyboard, Gaze at Monitor and Gaze at Colleague.
For more information on behaviors, see Behaviors in Section 4.4 of The Observer XT 9.0 Reference Manual.
16 The Observer XT
Section 3
Figure 4. Nominal Modifier group for the behavior Play from the Sample projectKids at play. The modifiers in this group are mutually exclusive, nominal and are not required to be scored when you score behavior Play.

Checking your Coding SchemeLet The Observer check the validity of your coding scheme, for example to verifythat all behaviors have a unique key code. From the Setup menu, select CheckCoding Scheme… .
For more information on correcting coding scheme errors, see Checking yourCoding Scheme in Section 4.4 of The Observer XT 9.0 Reference Manual.
Independent VariablesIndependent Variables can potentially influence the observation, and areassumed to remain constant for a certain subject (like a person's gender) or anobservation session (like temperature). Define the variables that are importantfor your study (for example, the location or the social group size).
1 From the Setup menu, select Independent Variables. The IndependentVariables List window appears.
2 Click Add User-defined Variable in the top-left corner of that window.
3 Specify Name, Description (optional), Type, Format, Predefined Values(optional), Scope and Value Update for the new variable. Repeat steps 2-3 to add more variables (see Figure 5 for an example).
You can also add system variables, that is, variables automatically provided by the program, like the start time of an observation. Click Show IndependentVariables and select the system variables you require.
Quick Start Guide 17
Setting up your project
Figure 5. The user-defined variables Name of operator, Gender, Age and Workstation from the Sample project RSI Research.

For more information on independent variables, see Section 4.5 of The ObserverXT 9.0 Reference Manual.
4 Carrying out an observation
Before you carry out an observation, you can adjust the Observation Settings.
Observation SettingsObservation Settings help you customize the way you record data: for example,you can automatically generate keycodes, set keycodes to required, pauseplayback of video when scoring, etc.
To open Observation Settings, from the Setup menu, select ObservationSettings.
For more information on Observation Settings, see Section 5.2 of The ObserverXT 9.0 Reference Manual.
Scoring the eventsThe following section refers to scoring events with the Continuous Recordingmethod. If you score events with the Instantaneous sampling method, see page21.
1 Create a new observation by doing one of the following:
· In the Project window, in the Observe tab, click Create newobservation.
· From the Observe menu select Observation, then New.
· Press ALT+F6.
You can also open an existing observation that you scored fromvideo (tape or media file). Simply click the observation in theProject Explorer.
2 If you have specified Offline observation in the Project setup (see page 10),the Video Selection window appears. Select the video file(s) you want touse, and click Open.
18 The Observer XT
Section 4

If you have the Video Support module, you can score from up totwo video files simultaneously. With the Multiple Videoextension, you can score from a maximum of four video filessimultaneously.
3 The Event Log only shows the columns that apply to your coding scheme andthe Comment column. If you want to hide the Comment column during theobservation, right-click one of the column titles and de-select Comment.
If some behaviors have been defined as Initial State Event (seepage 14), these are scored automatically at time 0, so you do notneed to score them again.
For more information on initializing subjects, see Section 5.3 ofThe Observer XT 9.0 Reference Manual.
4 Start the observation: click the Start Observation button in the Playbackcontrol window.
5 In the Enter User Defined Variable values window, enter the values of theindependent variables for that observation session.
6 When an event occurs, score data by either clicking the coding schemeelements in the Codes window, or pressing the keyboard keys corresponding to the codes. Score the sequence Subject - Behavior - Modifiers (ifapplicable). The way you score data depends on whether behaviors aredefined as State Events or Point Events; see the notes below.
Scoring State events· If State behaviors in a group are mutually exclusive, scoring one excludes all
others. This means that when you score a behavior, the behavior of the same group that is currently active is stopped automatically. For example, when achild in a playground starts Climbing, click the Start code or press thecorresponding key(s) .
Quick Start Guide 19
Carrying out an observation

Pay attention to when the next behavior starts. Press the key for the newstate (in this example, Walking, see below) or click the corresponding Startcode. If none of the codes apply to the new state of the subject, define anadditional state in the coding scheme.
Result — In the Event Log window, The Observer adds a Start line for thestate Climbing (marked by a green triangle), and next a Start line for thenew state Walking.
· If State behaviors are Start-Stop, click the Start code or press thecorresponding key(s).
Pay attention to when the behavior ends. On that moment, press the stopkey(s) for that behavior, or click the Stop code.
Result — A Stop line (indicated by a red square) is added for the behaviorjust ended.
Scoring Point events
To score point events, press the corresponding key(s) or click the Start code.You do not need to stop a Point event.
20 The Observer XT
Section 4

7 When the observation is finished, click the Stop Observation button in thePlayback control window. The observation is saved automatically after eachevent line. Do not stop the observation if you just want to re-position the video. To doso, simply operate the Playback buttons.
Scoring events with Instantaneous sampling
1 Create a new observation and select a video file (when applicable).
2 Start the observation.
3 A sound marks the start of the first sample interval. A number of rows appearbelow the Start row. These show each combination between a subject and abehavior group.
4 In each row, score the state of the subject for the corresponding behaviorgroup, by either clicking the coding scheme elements in the Codes window,or pressing the keyboard keys corresponding to the codes.
For example, score the state Silent for the subject Mother and the behaviorgroup Vocal communication. Next, score the state Neutral for the subjectMother and the behavior group Emotion. The name of the state is displayedunder Behavior.
Quick Start Guide 21
Carrying out an observation

5 When the next sample comes, a new group of rows appears below. Score the states as in the previous step. If the state of the subject has not changed from the last sample, score thestate anyway.
If you do not want to score the state of the subject for thatsample, click another cell under Behavior to score the state foranother subject/behavior group.
6 When the observation is finished, click the Stop Observation button in thePlayback control window.
You can also score data combining Instantaneous sampling with Continuousrecording. See Section 4.3 of The Observer XT 9.0 Reference Manual.
Controlling the video
If you use video files, operate the black buttons on the Playback control windowto play back and forward the video, at the speed you require.
Finding events
You can search for specific events, events that share some elements (forexample, the same subject), or free text entered in the Comments column of the event log. To search for events, press Ctrl+F.
Adding elements to the coding scheme as you observe
Click Add Behavior... at the bottom of the codes window.
In the Add Behavior window (Figure 6), you can enter the name and thekeycode of the new element, and select the type of Behavior and to which group you want to add the behavior.
You can also create a new subject, a new behavior group, a newmodifier or modifier group while observing.
To modify an existing coding scheme element, you first need tostop the observation; then click the Coding Scheme in the Project Explorer.
22 The Observer XT
Section 4

For more information, browse The Observer XT 9.0 Reference Manual:
· For creating/opening observations and score data — See Section 5.3.
· For changing the coding scheme, correcting scoring errors, creating moreevent logs in the same observation — See Section 5.4.
· For customizing the observation screen — See Section 5.5.
· For additional functions like quickly reviewing sections of video, suspendingand resuming observations, playing back data, see Section 5.6.
Recording physiological dataWith The Observer XT you can associate observational data scored manually withphysiological or any other type of data acquired with a Data Acquisition (DAQ)system, for example, the EEG data of a human or driving speed data from a car.This can be done by collecting observational data on the Observer computerwhile the DAQ system acquires the external data and stores them on a secondcomputer. The external data can then be imported into the Observer.Observational data and external data can be synchronized automatically, so youcan analyze them as if they were a single data set.
General procedure
1 Connect your DAQ system to the Observer computer and its dedicatedcomputer.
Quick Start Guide 23
Carrying out an observation
Figure 6. The Add Behavior window.

You can also use DAQ systems that are not physically connected to the Observer computer. In such cases, you need to import theexternal data in The Observer and synchronize them manuallywith the scored events (see Section 6.2 of The Observer XT 9.0Reference Manual).
2 In the Observer, select Live observation in the Project setup and select DAQSettings. Click Edit Settings and specify the acquisition settings you require.
3 Create a new observation (see page 18).
4 Start the observation. At that moment, The Observer starts sending asynchronization signal to the DAQ system. This signal will be used by theprogram when you import the external data (see below). Score data as usual(see Section 5).
5 When you are done, stop the observation as usual and import the externaldata (from the File menu, select Import and then External Data...).
For more information on recording external data, see Section 5.7 and Chapter 6of The Observer XT 9.0 Reference Manual.
24 The Observer XT
Section 4
5 Selecting data
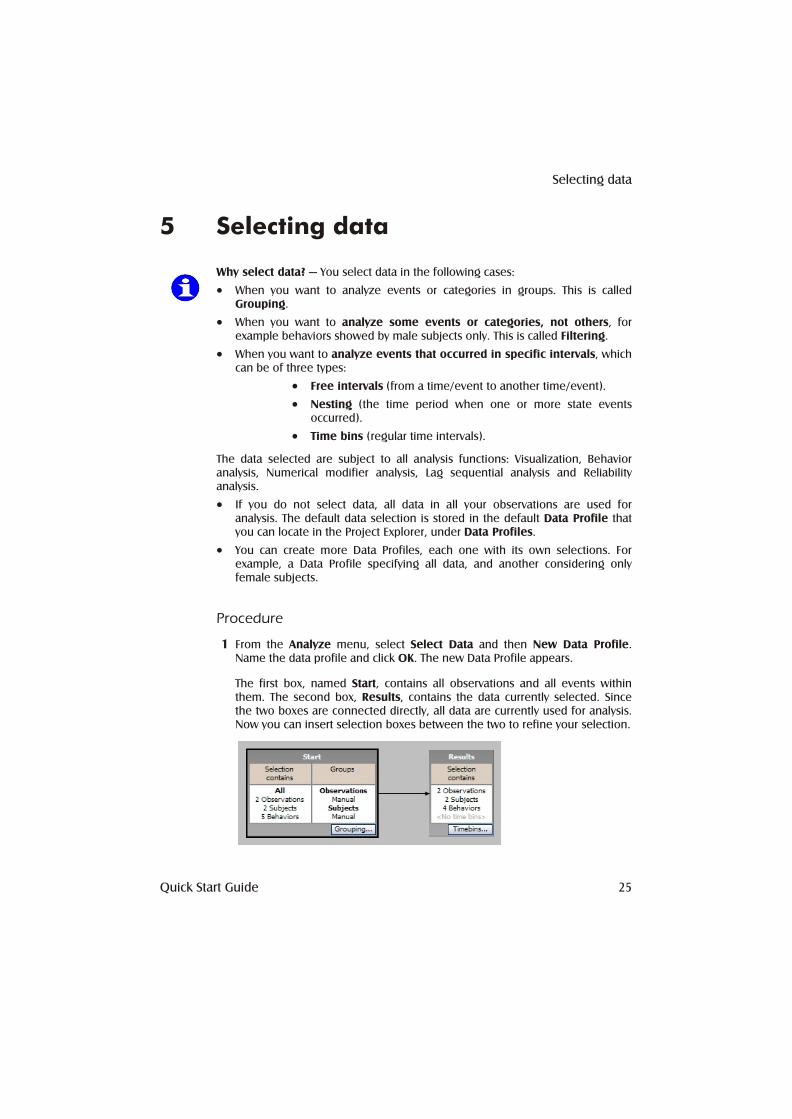
Why select data? — You select data in the following cases:
· When you want to analyze events or categories in groups. This is calledGrouping.
· When you want to analyze some events or categories, not others, forexample behaviors showed by male subjects only. This is called Filtering.
· When you want to analyze events that occurred in specific intervals, which can be of three types:
· Free intervals (from a time/event to another time/event).
· Nesting (the time period when one or more state eventsoccurred).
· Time bins (regular time intervals).
The data selected are subject to all analysis functions: Visualization, Behavioranalysis, Numerical modifier analysis, Lag sequential analysis and Reliabilityanalysis.
· If you do not select data, all data in all your observations are used foranalysis. The default data selection is stored in the default Data Profile thatyou can locate in the Project Explorer, under Data Profiles.
· You can create more Data Profiles, each one with its own selections. Forexample, a Data Profile specifying all data, and another considering onlyfemale subjects.
Procedure
1 From the Analyze menu, select Select Data and then New Data Profile.Name the data profile and click OK. The new Data Profile appears.
The first box, named Start, contains all observations and all events withinthem. The second box, Results, contains the data currently selected. Sincethe two boxes are connected directly, all data are currently used for analysis.Now you can insert selection boxes between the two to refine your selection.
Quick Start Guide 25
Selecting data
2 Do one or more of the following:
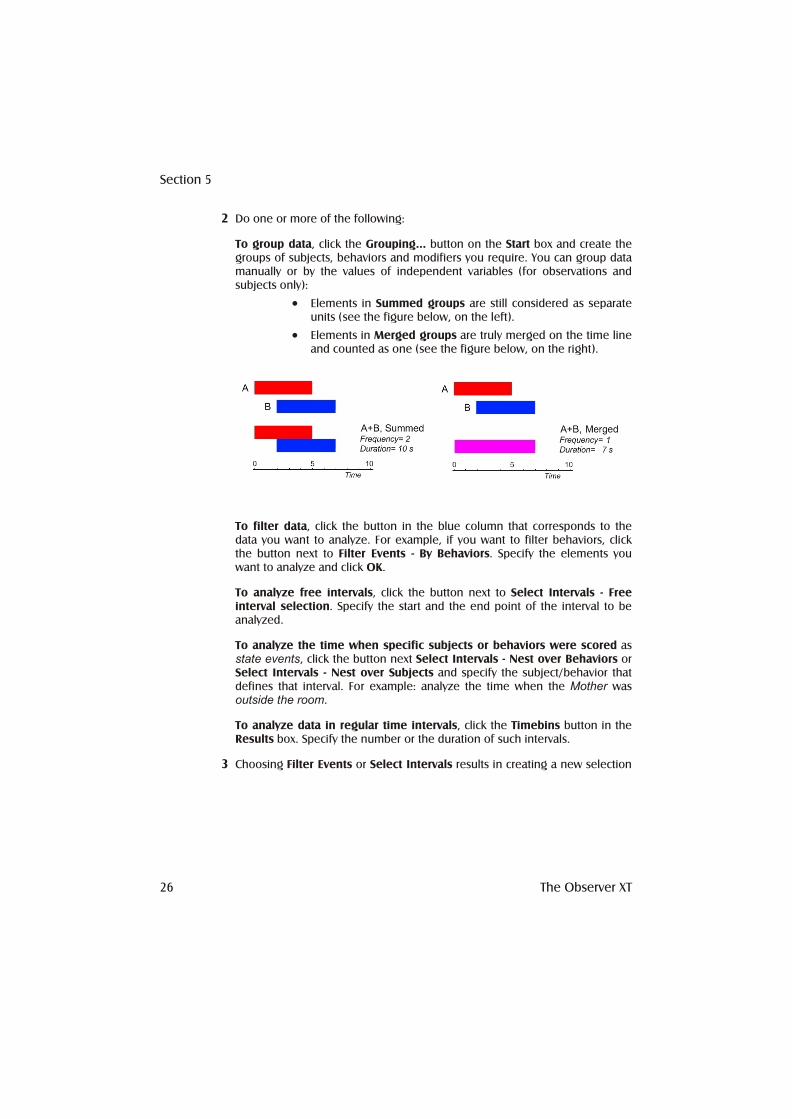
To group data, click the Grouping... button on the Start box and create thegroups of subjects, behaviors and modifiers you require. You can group datamanually or by the values of independent variables (for observations andsubjects only):
· Elements in Summed groups are still considered as separateunits (see the figure below, on the left).
· Elements in Merged groups are truly merged on the time lineand counted as one (see the figure below, on the right).
To filter data, click the button in the blue column that corresponds to thedata you want to analyze. For example, if you want to filter behaviors, clickthe button next to Filter Events - By Behaviors. Specify the elements youwant to analyze and click OK.
To analyze free intervals, click the button next to Select Intervals - Freeinterval selection. Specify the start and the end point of the interval to beanalyzed.
To analyze the time when specific subjects or behaviors were scored asstate events, click the button next Select Intervals - Nest over Behaviors orSelect Intervals - Nest over Subjects and specify the subject/behavior thatdefines that interval. For example: analyze the time when the Mother wasoutside the room.
To analyze data in regular time intervals, click the Timebins button in theResults box. Specify the number or the duration of such intervals.
3 Choosing Filter Events or Select Intervals results in creating a new selection
26 The Observer XT
Section 5

box. Click the title of that new box and drag it over the arrow that connectsthe two original boxes.
Example:
Always put green Nest boxes before all your Filter boxes,otherwise you will filter out the events before you specify theinterval based on those events.
4 Run the analysis you require (see the next sections).
For more information on data selection, see Chapter 7 of The Observer XT 9.0Reference Manual.
Quick Start Guide 27
Selecting data
Figure 7. An example of data selection combining Nesting (second box fromthe left) and Filtering (third box from the left).

6 Visualizing data
Before you choose one of the options below, make sure that the Data Profilecontaining the data you want to visualize is highlighted in blue in the ProjectExplorer. If not, click the Data Profile.
Creating a chart· A chart plots the scored events relative to time.
From the Analyze menu, select Visualize Data. Select the observation you wantto visualize and click OK.
Data are shown in the form of colored bars (horizontal for state events, verticalfor point events). You can play the event sequence back together with thecorresponding video.
Creating a table of the events (Episode selection)
You can create a table listing all the events or those selected in a Data Profile.From the Analyze menu, select Episode Selection, then select New EpisodeSelection, then New From Current Data Profile.
28 The Observer XT
Section 6
Figure 8. Visualization of event data and video.

Data are shown in the form of a table where each row corresponds to an event.Events that are part of the same event log or interval are grouped in Episodes.Each episode is marked by its own title row (in orange).
You can edit the Episode Selection by adding, removing and sorting events andexport it to a text file.
Making a highlight video clip
You can play back the events in the Episode Selection and create a video clip that shows those events. Create a new episode selection (see above). To generatethe corresponding video clip, from the Analyze menu, select Episode Selection,then Generate Media File.... Select MainConcept MPEG-4 Video Encoder andclick Generate.
For more information on Data Visualization, see Chapter 8 of The Observer XT 9.0 Reference Manual.
Quick Start Guide 29
Visualizing data
Figure 9. Table of events in an Episode Selection. During playback of the EpisodeSelection, the corresponding video is highlighted in red.
7 Calculating statistics
Before calculating statistics, make sure that the Data Profile containing the datayou want to analyze is highlighted in blue in the Project Explorer. If not, click theData Profile.
Behavior Analysis
With Behavior analysis you calculate for example the average duration or thetotal frequency of behaviors.
1 From the Analyze menu, select Behavior Analysis, then New.
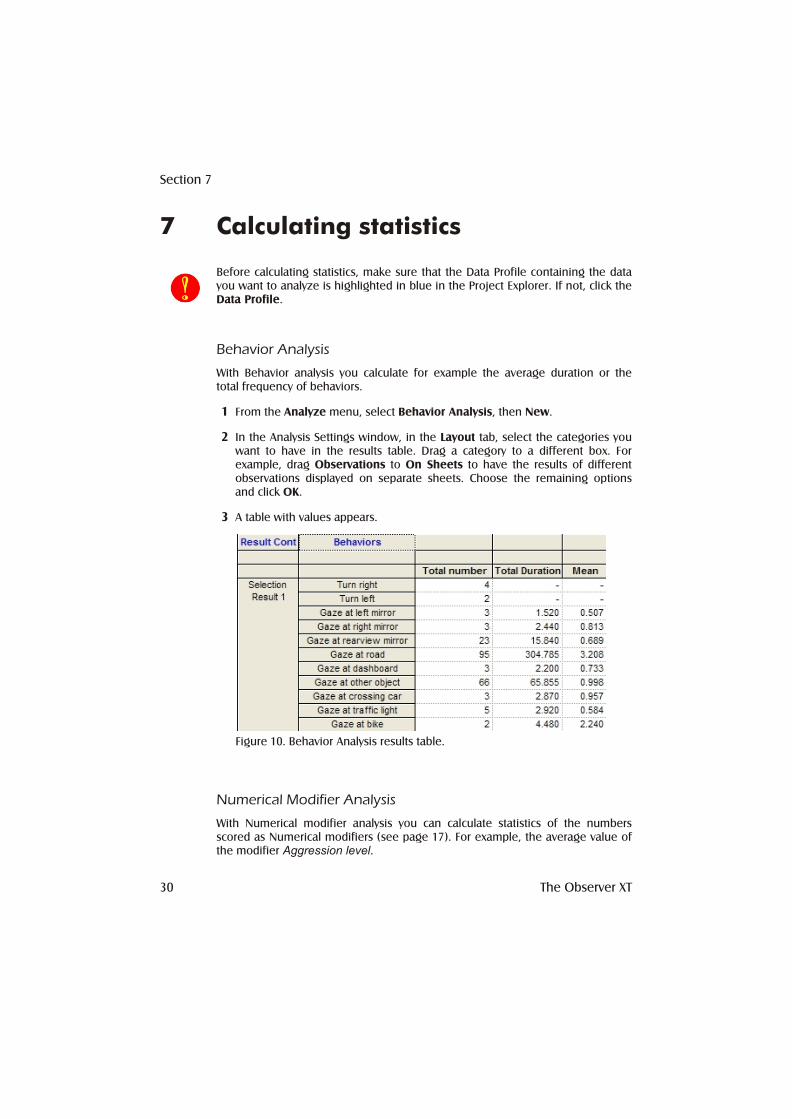
2 In the Analysis Settings window, in the Layout tab, select the categories youwant to have in the results table. Drag a category to a different box. Forexample, drag Observations to On Sheets to have the results of differentobservations displayed on separate sheets. Choose the remaining optionsand click OK.
3 A table with values appears.
Numerical Modifier Analysis
With Numerical modifier analysis you can calculate statistics of the numbersscored as Numerical modifiers (see page 17). For example, the average value ofthe modifier Aggression level.
30 The Observer XT
Section 7
Figure 10. Behavior Analysis results table.

1 From the Analyze menu, select Numerical Analysis then New.
2 Under Layout, select the categories you want to have in the results table.Drag a category to a different box for example drag Subjects to On Columnsto have the results of different subjects displayed on separate columns.Choose the remaining options and click OK.
3 The results table with values appears.
Tips· To re-arrange the layout of the table, click the Layout button on the results
window.
· To save the results within the project, click the Archive Results button onthe results window.
· To export the results, click the Export button on the results window.
· You can also analyze the numerical modifiers as nominal modifiers in thebehavior analysis, for example to calculate how often '2' was scored.
For more information on Calculating Statistics, see Chapter 9 of The Observer XT9.0 Reference Manual. For an example of numerical modifiers, open the sampleproject 'Usability testing of cars XT80' available on the Sample Projects DVD.
Hypothesis testing
The Observer XT does not make any statistical test like t-test or ANOVA. Toanalyze data in such a way, first export your observational data or results (seepage 34) and then import them into your statistical package.
Quick Start Guide 31
Calculating statistics

8 Lag sequential analysis
With Lag sequential analysis you calculate frequencies of transitions betweenpairs of events within a certain lag, in a time series. It helps you answerquestions like:
· In the interaction between a Boss and an Employee, how often was theevent Lean backward followed by Looking away from other person orLooking at other person?
· How likely was the event Boss Talking to followed by Employee Lookingaway?
The lag can be either a state lag or a time lag:
· State lag — To calculate transitions between events that are separated by afixed number of events. For example, the transitions from an event to thenext (state lag =+1), or the second next (state lag=+2) etc. Lag order can befrom -9 to +9. The time interval between events does not influence thecalculations.
· Time lag — To calculate transitions between events that are separated by less than a specific time (time lag). For example, the transitions from an eventand those occurring in the next 10 seconds. The order in which events occurwithin the time lag does not influence the calculations.
Before running an analysis, make sure that the Data Profile containing the datayou want to analyze is highlighted in blue in the project Explorer. If not, click theData Profile.
1 From the Analyze menu, select Lag Sequential Analysis, then New.
2 Under Analysis Settings, select whether you want to perform state lag ortime lag analysis, and choose the remaining options. Under Layout, specifyhow you want the table to look like (for example, to collapse the data acrossobservations). Next, click OK.
3 A table appears on your screen. Each cell contains the frequency (orprobability, depending on what you have chosen in the Analysis Settings) ofthe transitions from the event of the corresponding row and the event of thecorresponding column.
For more information on Lag Sequential Analysis, see Chapter 10 of The Observer XT 9.0 Reference Manual.
32 The Observer XT
Section 8

9 Reliability analysis
When comparing two observations (or groups of), reliability determines howconsistently the behavior was measured. You can check your own consistencyover time, or that between researchers.
In Reliability analysis, the observations are paired and events are compared,producing a Comparison list:
The Reliability Result calculates the following statistics:
· Number of agreements and disagreements.
· Proportion of agreement.
· Cohen's Kappa (and its statistical significance).
· Pearson's Rho (and its statistical significance).
Before running an analysis, make sure that the Data Profile containing the datayou want to analyze is highlighted in blue in the Project Explorer. If not, click theData Profile.
1 From the Analyze menu, select Reliability Analysis, then New.
2 In the Settings tab, choose the observations you want to compare from thelist. If you want to compare more than two observations, create a new pair by clicking Add pair. Specify the Tolerance window (the maximum acceptable
Quick Start Guide 33
Reliability analysis
Figure 11. This example has been taken from the sample project Discussion which you canfind on the Sample Projects DVD. The observation contains data of a discussion between aBoss and one of his Employees. The observations focuses on body language: body postureand gestures. To know how the behavior of the Boss affects the body language of theEmployee, Lag sequential analysis with state lag order= +1 has been carried out.

discrepancy between timing of events for these to be considered anagreement). Choose the remaining options and click OK.
3 A table appears on your screen. Click the buttons Statistics, ConfusionMatrix, Comparison List to view the results.
For more information on Reliability Analysis, see Chapter 11 of The Observer XT9.0 Reference Manual.
34 The Observer XT
Section 9
Figure 12. Reliability analysis result - Comparison List. The example was taken from thesample project Kids at play. A copy of the observation Erin 3 years old has been edited tomake it slightly different and saved as Erin 3 years old_edited. In Erin 3 years old, theobserver scored Gaze object at 7.96 s and Gaze object at 35.6 s, while in Erin 3 yearsold_edited this was changed to Gaze elsewhere and Gaze adult, respectively. This resultsin two disagreements (see first column).

10 Managing data and results
See the following sections to create copies of your projects, import data andexport data, analysis results and episode selections to your favorite spreadsheetor statistics package.
Backing up a project
You can copy an entire project by making a backup file. A backup file is like a ZIPfile containing your project files, including data and analysis results. It provesvery handy when you want to move your data to another computer or send it viaemail to a collaborator.
We advise you to make a backup of your projects at least once a day. Copy the backup to a secure medium like a network drive.
1 From the File menu select Save As.
2 From the Save in list choose the folder in which you want to save the copy,then type a name in the File name field and choose The Observer XTProject Backup (*.vpb) from the Save as type list. Next, click Save.
To re-open the project from a Backup file, from the File menu select OpenProject, and choose The Observer XT Project Backup (*.vpb) from the Files oftype list. Click the Change directory button to specify where to save the project.
Project backups do not contain the video files used to scorethe data.
Importing and exporting projects
You can also import/export projects of previous Observer versions (4 / 5 / XT 6.x / XT 7.x / XT 8.0).
To import and export observations to/from projects, see the next page.
For more information, see Section 12.1 of The Observer XT 9.0 ReferenceManual.
Quick Start Guide 35
Managing data and results

Using projects with multiple coding stations
You can set an Observer XT project in such a way that data can be shared withmultiple computers working as coding stations.
You define a project with a coding scheme on the main computer. Each codingstation receives a copy of this project, where one can record events but notchange the coding scheme (read-only project). You can then import the datafrom the coding stations to perform analysis.
For more information, see Creating a multiple coding station configuration inSection 12.1 in The Observer XT 9.0 Reference Manual.
Exporting observational data
To export your data (including independent variables and optionally media filesand physiological data):
1 From the File menu select Export Observational Data. Choose theobservations you want to export and click Next.
2 Choose a name for your export file, select the format (*odx), specify whetheryou want to include media files and external (physiological) data togetherwith the observational data, and click Export.
To export data of a single observation, right-click the observationin the Project Explorer and select Export. You can also exportevent log data as ASCII (*.txt) files.
For more information, see Section 12.2 of The Observer XT 9.0 ReferenceManual.
Importing observational data
You can import data files of previous Observer versions (3/4/5) or any otherbehavioral data in ASCII format.
1 From the File menu select Import, then Observational data.
2 Click Custom Import Profiles and then Create New if you want to importdata of format other than Observer 3/4/5. If the data to import are stored in a ODX file, make sure ODX FIle (*.odx) is selected from the Files of type list.
For more information, see Section 12.3 of The Observer XT 9.0 ReferenceManual.
36 The Observer XT
Section 10
Exporting analysis results to a file
1 Make sure that the analysis result you want to export is open on your screen.If necessary, adjust the layout of the result table to suit the importrequirements of your statistical package (see page 31).
2 From the Analyze menu, select Export Analysis Results, or click the Exportbutton in the results window.
3 Choose a name for your file, specify the format (XML or text) and click Export.
When exporting to text, results displayed on each sheet will be exported to aseparate file.
Copying and pasting to other programs
To quickly export an analysis result to other programs, such as Excel, select thewhole table (from the Edit menu select Select All) or part of it, then from theEdit menu select Copy. In the other program, from the Edit menu select Paste.
For more information, see Section 12.5 of The Observer XT 9.0 ReferenceManual.
Exporting episode selections
To export all your episode selections:
1 From the Analyze menu, select Episode Selection and then Export.
2 Enter a base filename for your files and click Export. Your files are saved inASCII format.
To export a single episode selection, right-click that episodeselection in the Project Explorer and select Export EpisodeSelection.
For more information, see Section 12.6 of The Observer XT 9.0 ReferenceManual.
Exporting physiological data
If your observation includes physiological data, you can export them togetherwith your behavioral data, using an episode selection.
1 Make a data profile that filters the observation (see Section 6, page 26) andthen an episode selection that includes both the behavioral and physiological data (see Section 7, page 28).
Quick Start Guide 37
Managing data and results

2 Export the episode selection: From the Analyze menu, select EpisodeSelection and then Export… .
For more information, see Section 12.6 of The Observer XT 9.0 ReferenceManual.
38 The Observer XT
Section 10