the oceanography society | the oceanography …148 oceanography | vol.24, no.3 due to the arrival of...
TRANSCRIPT

CITATION
McLaughlin, F., E. Carmack, A. Proshutinsky, R.A. Krishfield, C. Guay, M. Yamamoto-Kawai,
J.M. Jackson, and B. Williams. 2011. The rapid response of the Canada Basin to climate forcing:
From bellwether to alarm bells. Oceanography 24(3):146–159, http://dx.doi.org/10.5670/
oceanog.2011.66.
COPYRIGHT
This article has been published in Oceanography, Volume 24, Number 3, a quarterly journal of
The Oceanography Society. Copyright 2011 by The Oceanography Society. All rights reserved.
USAGE
Permission is granted to copy this article for use in teaching and research. Republication,
systematic reproduction, or collective redistribution of any portion of this article by photocopy
machine, reposting, or other means is permitted only with the approval of The Oceanography
Society. Send all correspondence to: [email protected] or The Oceanography Society, PO Box 1931,
Rockville, MD 20849-1931, USA.
OceanographyTHE OFFICIAL MAGAzINE OF THE OCEANOGRAPHY SOCIETY
DOWNLOADED FROM WWW.TOS.ORG/OCEANOGRAPHY
Oceanography | Vol.24, No.3146
T h e C h a N g i N g a r C T i C O C e a N |
S p e C i a l i S S u e O N T h e i N T e r N aT i O N a l p O l a r Y e a r ( 2 0 0 7 –2 0 0 9)
The rapid response of the Canada Basin to Climate Forcing
FrOm BellweTher TO alarm BellS
B Y F i O N a m c l a u g h l i N , e d d Y C a r m a C k ,
a N d r e Y p r O S h u T i N S k Y, r i C h a r d a . k r i S h F i e l d ,
C h r i S T O p h e r g u aY, m i C h i Y O Ya m a m O T O - k a w a i ,
J e N N i F e r m . J a C k S O N , a N d B i l l w i l l i a m S
aBSTr aC TSea ice extent in the Arctic Ocean diminished significantly during the first decade of the 2000s, most particularly in the Canada Basin where the loss of both multiyear and first-year ice was greater than in the other three subbasins. Using data collected during basin-wide surveys conducted from 2003–2010 together with data collected during the 1990s and 2000s at one station in the southern Canada Basin, we inves-tigate the response of the Canada Basin water column to this significant decrease in ice cover. Changes were evident from the surface down to the Atlantic layer: some changes were the result of Beaufort Gyre forcing on regional processes, others were the result of Arctic Ocean atmospheric forcing on a hemispheric scale and large-scale advection. These changes have troubling consequences for the ecosystem.
iNTrOduC TiONSituated north of North America, the Canada Basin is the largest of the four subbasins of the Arctic Ocean. It is separated from the Makarov Basin by the Alpha Cordillera, and from the Amundsen and Nansen Basins by the Lomonosov Ridge (Figure 1). The Canada Basin is ringed by continental shelves on three sides: they are shallow and broad to the west and include the East Siberian and Chukchi Sea shelves, narrow along the Beaufort Shelf to
the south, and slightly broader to the southeast and northeast along the edge of the Canadian Arctic Archipelago. Several canyons (Herald, Barrow, and Mackenzie) score these shelves and provide two-way communication with the basin via shelf outflow and shelf-break upwelling (Shimada et al., 2005; Weingartner et al., 2005; Williams et al., 2006). The complex topography between the Chukchi Plateau and the Northwind Ridge adds additional constraints to basin circulation. The basin’s deepest
part, the Canada Abyssal Plain where depths reach over 3,800 m, is situated to the east of the Northwind Ridge.
The general circulation and composi-tion of Canada Basin waters are unique within the Arctic Ocean in several respects. First, the atmospheric Beaufort High forces circulation, making it the only Arctic subbasin where the motion of sea ice and upper ocean is clockwise and convergent. In the past, this motion meant that sea ice remained longer within the Beaufort Gyre, where it became thicker and more ridged than sea ice elsewhere that was transported more rapidly by the Transpolar Drift toward Fram Strait (Rigor and Wallace, 2004). Second, the halocline, defined as a gradient in salinity where fresher water overlies more saline water, is more strongly stratified and has a higher nutrient content in the Canada Basin than the three other subbasins. This is because it is the only subbasin to receive
Oceanography | Vol.24, No.3146

Oceanography | September 2011 147
inflow directly from the relatively fresh and nutrient-rich Pacific Ocean through the shallow (~ 50 m depth) Bering Strait. The halocline also receives a significant volume of freshwater from the Mackenzie River, the largest northward-flowing river in North America. Third, the Canada Basin is the final subbasin to receive inflow from the relatively warm and saline Atlantic Ocean that enters via the Nordic seas and then flows in a generally counterclockwise direction following the shelf-break topography. Atlantic waters enter the Arctic Ocean via two pathways. One pathway through Fram Strait transports warm saline Atlantic waters and called Fram Strait Branch (FSB) waters. The second pathway crosses the Barents Sea Shelf and delivers colder and fresher Atlantic waters, modified during transit and called Barents Sea Branch (BSB)
waters, into the Nansen Basin. Thus, two components of the Atlantic layer are evident in most of the Arctic Ocean, with FSB waters overlying the denser BSB. Together with outflow from the three upstream subbasins, Canada Basin waters feed the return flow of the global thermohaline circulation, the large-scale ocean circulation driven by density gradients caused by surface fluxes of heat and freshwater (cf. Mauritzen, 1996).
Until 1990, the Arctic Ocean was described as a quiet ocean in near steady state (see Carmack, 1990, and Jones et al., 1990, for reviews). The first evidence to the contrary was observed in 1990 when FSB Atlantic waters ~ 1°C warmer than the historical record were found in the Nansen Basin (Quadfasel et al., 1991) and then further downstream in 1993 in the Makarov Basin (Carmack et al., 1995). A shift also occurred in the boundary
between Atlantic and Pacific waters that, according to historical US and Russian data, was located above the Lomonosov Ridge (cf. Pounder, 1986). The shift was recognized first by the absence of the Atlantic/Pacific boundary at the North Pole in 1991 (Anderson et al., 1994), and by its presence above the Mendeleyev Ridge in 1993 (McLaughlin et al., 1996; Morison et al., 1998). Basin-wide changes in the Atlantic/Pacific boundary and Atlantic water temperatures were confirmed across the western Canada and central Makarov Basins during the 1994 Arctic Ocean Section, the first scientific crossing of the Arctic Ocean via the North Pole by Canadian and US icebreakers (Carmack et al., 1997; Swift et al., 1997). The BSB component of the Atlantic layer was also fresher and more ventilated in 1995 in the southern Canada Basin than in previous years
Figure 1. (a) Time series of the arctic Ocean Oscillation (aOO). under a positive aOO, the circulation is in a clockwise direction (anticyclonic) and convergent, and under a negative aOO, the circulation is in a counter-clockwise direction (cyclonic) and divergent. in the Canada Basin, fresh-water accumulates in the Beaufort gyre region when the aOO is positive and is released when the aOO is negative. (b and c) maps of the age of multiyear (mY) and first-year (FY) ice in the arctic Ocean, produced from a model based on buoy data for September 1995 (b) and September 2009 (c). Open water is indicated by dark blue, and the color scales to the right indicate the age of the ice, with the oldest being white. Note the age of mY ice is in years and the age of FY ice is in months. Figure courtesy of Ignatius Rigor, APL, University of Washington (d) inset map of the Canada Basin study area. red dots indicate stations occupied in 2009, and the location of Station a, occupied from the 1990s and discussed in the text, is identified.

Oceanography | Vol.24, No.3148
due to the arrival of a large outflow of cold dense water from the Barents Sea (McLaughlin et al., 2002). Re-analysis of the 1948–1993 US and Russian Arctic Ocean data archive on an annual resolu-tion scale, however, showed that the Arctic Ocean had not been in steady state prior to the 1990s. For example, the Atlantic/Pacific boundary shift occurred in the mid-1980s, some five years earlier than observed, and a weaker warm temperature anomaly was observed in the late 1950s (Swift et al., 2005).
All the 1990s oceanic changes were associated with a major shift in the atmospheric pressure field in 1989 toward a more counterclockwise circula-tion (Proshutinsky and Johnson, 1997; Thompson and Wallace, 1998). A record minimum in ice extent, recorded in the 1990s (Serreze et al., 1995), was accompanied by a significant increase in ice melt (Macdonald et al., 1999). Remarkable changes in ice conditions were observed during the 1997 Study of the Heat Energy Budget of the Arctic (SHEBA), when a ship, frozen into the ice for a year, unexpectedly provided a “drifting” survey across much of the Canada Basin because of increased ice mobility (cf. Perovich et al., 1999). Data
collected during SHEBA showed that: Mackenzie River water was present offshore in the basin interior in 1997 (Macdonald et al., 2002); the Pacific halocline varied in thickness across the Canada Basin due to the advance-ment of the Atlantic/Pacific boundary (McLaughlin et al., 2004); and the 1990s warm temperature anomaly (WTA) Atlantic water, observed upstream in the Nansen Basin, had arrived down-stream near the Chukchi Plateau in 1998 (Shimada et al., 2004).
These observations illustrate a close coupling between atmospheric forcing and the ocean. Interannual variability of this forcing can be seen in two indices: the Arctic Oscillation (AO), which is the leading empirical orthogonal func-tion (principal component analysis) of winter sea level pressure in the Northern Hemisphere (Thompson and Wallace, 1998); and the Arctic Ocean Oscillation (AOO), which is the leading empirical orthogonal function of annual simu-lated Arctic Ocean sea surface heights, generated by atmospheric winds in an idealized wind-driven coupled ice-ocean circulation model (Proshutinsky and Johnson, 1997; Proshutinsky et al., 1999). The times-series record of the AOO
(Figure 1a) is used here because it takes into account atmospheric forcing, ocean configuration (bathymetry and coast-line), sea ice conditions, river runoff, and sea level difference between the Pacific and Atlantic Oceans (Proshutinsky and Johnson, 2010). The AOO became negative and divergent (i.e., counter-clockwise or cyclonic circulation) in 1989 and, in 1997, shifted to be positive and convergent (i.e., clockwise or anticy-clonic circulation), where it has mostly remained until 2010. Under positive and convergent AOO conditions, fresh-water accumulates in the Beaufort Gyre region; under negative and divergent AOO conditions, freshwater is released and exported from the Arctic Ocean (cf. Proshutinsky et al., 2002). The AOO is validated by observations of Great Salinity Anomalies (GSA), large near-surface pools of fresher water carried by ocean currents in a counterclockwise manner around the North Atlantic and associated with large outflows of seawater from the Arctic Ocean (Belkin et al., 1998). The AOO was negative from 1978–1984, prior to the 1980s GSA, and negative again from 1989–1996, prior to the 1990s GSA.
The T weNT Y-FirST CeNTurYSea ice cover diminished significantly in the Arctic Ocean during the first decade of the 2000s, with the first, second, and third lowest sea ice extents observed on satellite images in the summers of 2007, 2008, and 2010, respectively (National Snow and Ice Data Center, 2010). The oldest and generally thickest ice (five years or older) disappeared almost entirely from the Arctic in 2010, and the total coverage of multiyear ice was the third lowest on record (National Snow
Fiona McLaughlin ([email protected]) is Senior Researcher Emeritus,
Fisheries and Oceans Canada, Institute of Ocean Sciences, Sidney, BC, Canada.
Eddy Carmack is Senior Researcher Emeritus, Fisheries and Oceans Canada, Institute
of Ocean Sciences, Sidney, BC, Canada. Andrey Proshutinsky is Senior Scientist, Woods
Hole Oceanographic Institution, Woods Hole, MA, USA. Richard A. Krishfield is Senior
Research Specialist, Woods Hole Oceanographic Institution, Woods Hole, MA, USA.
Christopher Guay is President, Pacific Marine Sciences and Technology LLC, Oakland,
CA, USA. Michiyo Yamamoto-Kawai is a chemical oceanographer, Tokyo University
of Marine Science and Technology, Tokyo, Japan. Jennifer M. Jackson is Postdoctoral
Fellow, Department of Oceanography, University of Cape Town, Cape Town, South Africa.
Bill Williams is a physical oceanographer, Fisheries and Oceans Canada, Institute of Ocean
Sciences, Sidney, BC, Canada.
Oceanography | September 2011 149
and Ice Data Center, 2010). Comparison of first-year and multiyear ice distribu-tions in 1995 and 2009 (Figure 1b,c) illustrates the size and scale of these changes and clearly indicates that the greatest loss of both ice types occurred in the Canada Basin.
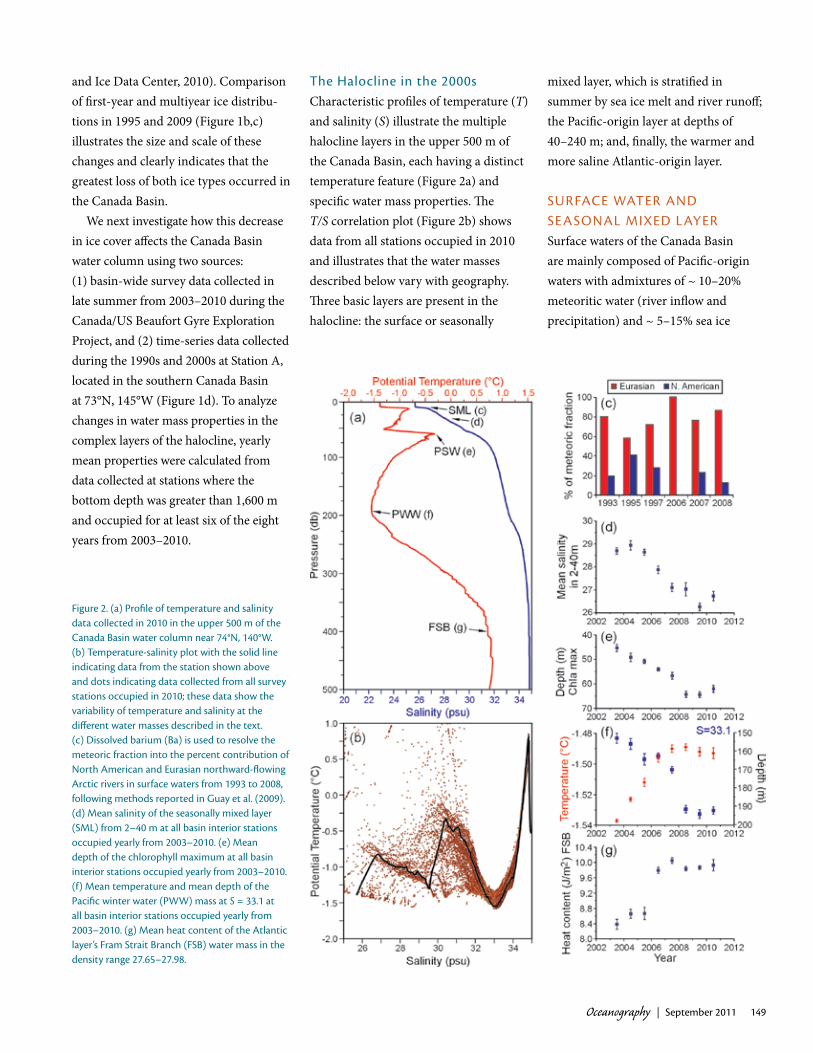
We next investigate how this decrease in ice cover affects the Canada Basin water column using two sources: (1) basin-wide survey data collected in late summer from 2003–2010 during the Canada/US Beaufort Gyre Exploration Project, and (2) time-series data collected during the 1990s and 2000s at Station A, located in the southern Canada Basin at 73°N, 145°W (Figure 1d). To analyze changes in water mass properties in the complex layers of the halocline, yearly mean properties were calculated from data collected at stations where the bottom depth was greater than 1,600 m and occupied for at least six of the eight years from 2003–2010.
The halocline in the 2000sCharacteristic profiles of temperature (T) and salinity (S) illustrate the multiple halocline layers in the upper 500 m of the Canada Basin, each having a distinct temperature feature (Figure 2a) and specific water mass properties. The T/S correlation plot (Figure 2b) shows data from all stations occupied in 2010 and illustrates that the water masses described below vary with geography. Three basic layers are present in the halocline: the surface or seasonally
mixed layer, which is stratified in summer by sea ice melt and river runoff; the Pacific-origin layer at depths of 40–240 m; and, finally, the warmer and more saline Atlantic-origin layer.
SurFaCe waTer aNd SeaSONal mixed l aYerSurface waters of the Canada Basin are mainly composed of Pacific-origin waters with admixtures of ~ 10–20% meteoritic water (river inflow and precipitation) and ~ 5–15% sea ice
Figure 2. (a) profile of temperature and salinity data collected in 2010 in the upper 500 m of the Canada Basin water column near 74°N, 140°w. (b) Temperature-salinity plot with the solid line indicating data from the station shown above and dots indicating data collected from all survey stations occupied in 2010; these data show the variability of temperature and salinity at the different water masses described in the text. (c) dissolved barium (Ba) is used to resolve the meteoric fraction into the percent contribution of North american and eurasian northward-flowing arctic rivers in surface waters from 1993 to 2008, following methods reported in guay et al. (2009). (d) mean salinity of the seasonally mixed layer (Sml) from 2–40 m at all basin interior stations occupied yearly from 2003–2010. (e) mean depth of the chlorophyll maximum at all basin interior stations occupied yearly from 2003–2010. (f) mean temperature and mean depth of the pacific winter water (pww) mass at S = 33.1 at all basin interior stations occupied yearly from 2003–2010. (g) mean heat content of the atlantic layer’s Fram Strait Branch (FSB) water mass in the density range 27.65–27.98.

Oceanography | Vol.24, No.3150
meltwater that vary by location and year (Yamamoto-Kawai et al., 2009a; Guay et al., 2009). Surface water salinity, inte-grated from 2 to 40 m, freshened from a mean salinity of S ~ 29 in the early 2000s to a mean salinity of S ~ 26.5 by 2010 (Figure 2d). The accumulation of this significant volume of freshwater is associated with an AOO that has been in a positive state since 1997, the longest in duration on record (Proshutinsky et al., 2009). The AOO shift to positive and convergent conditions, which in the past maintained a multiyear ice pack, served instead to bring multiyear ice southward in the Canada Basin where it melted (Kwok and Cunningham, 2010).
Maps of dynamic height at 30 m calculated relative to 800 m (an oceanographic equivalent of a meteo-rological pressure chart and expressed in meters), show that the Beaufort Gyre strengthened by ~ 25% during this time, primarily because of this freshening (Figure 3). The increase in dynamic height indicates that the gyre
is spinning faster and that freshwater continues to accumulate in the Canada Basin (McLaughlin and Carmack, 2010). Dynamic height data also show that the Beaufort Gyre position varies. For example, the center has shifted progres-sively westward in 2009 and 2010, and the area under the influence of the gyre increased in 2010, spreading both to the north and the west.
Sources contributing to this fresh-water accumulation are identified using geochemical data that are able to distinguish between meteoric and sea ice meltwater components. Assuming that a surface seawater sample is a mixture of three end members (sea ice meltwater (SIM), meteoric water (MW), and a saline water mass), mass balance equations are applied to salinity, oxygen isotope ratio, and alkalinity data to calculate fractions of SIM and MW (cf. Yamamoto-Kawai et al., 2009a). Similarly, dissolved barium (Ba), a quasi-conservative tracer (Guay and Falkner, 1997; Taylor et al., 2003;
Cooper et al., 2008), is used to resolve the meteoric fraction into North American and Eurasian rivers compo-nents, assuming the meteoric fraction is composed entirely of river runoff and that Ba behaves conservatively (cf. Guay et al., 2009).
Interannual variability in surface water composition is substantial, as shown in maps of SIM and MW fractions and Ba values (Figure 4). The difference in spatial distribution of MW and SIM at the surface is due to their sources: river inputs come from the south and east, and ice melt occurs at the ice edge and in the deeper basin. High MW fractions and Ba values higher than 70 nM (Figure 4a,b) were found in 1997, 2003–2005, 2007, and 2008 in the southern part of the basin, reflecting Mackenzie River inflow that spread northward into the basin interior. This plume was absent in 2006 and also in 2009 (applying the method used by Yamamoto-Kawai et al. [2009a] to 2009 alkalinity data; results not shown). These maps show sizeable
Figure 3. maps of salinity and dynamic height at 30 m in the Canada Basin, 2007–2010. The color scale on the right indicates salinity values, and the black contour lines show dynamic height in meters, calculated using 800 m as the reference depth. Black dots indicate station loca-tions where data were collected, and data between stations are interpolated.

Oceanography | September 2011 151
year-to-year variability in the distribution of Mackenzie River waters within the Beaufort Sea. Whether the plume spreads northward across the shelf into the basin interior or gets trapped tightly along the coast and steered eastward thus depends on local-scale atmosphere and ice forcing on relatively short time scales because the larger-scale AOO has remained constantly positive from 1996 to 2009. The Ba data also indicate that MW composition has been mainly Eurasian river water, varying from 60–100% (Figure 2c). Although the fraction of
North American river water may be underestimated due to the noncon-servative drawdown of Ba observed in summer inflow through Bering Strait, the values are comparable to the values calculated using alkalinity instead of Ba as a tracer in the mass balance equa-tion (cf. Yamamoto et al., 2009a). When data (not shown) are compared for 2006 and 2009—years when Mackenzie River water was absent from the basin interior—the fraction of MW increased from 0.12 in 2006 to 0.14 in 2009, and this 20% increase is associated with
enhanced gyre circulation. The fraction of SIM in the central
basin increased significantly in 2006 and in subsequent years (Figure 4c). A comparison with 1997 data, when changes in ice dynamics were first observed, shows that the fraction of SIM increased fivefold by 2008, from 0.02 to more than 0.10. By 2008, the distribu-tion of SIM greater than 0.10 covered much of the southeastern central basin, and this area shifted to the west in 2009 (not shown). This increase is associ-ated with the significant retreat in ice
Figure 4. maps of (a) the fraction of meteoric water (mw) in surface seawater, (b) barium values in surface seawater, and (c) the fraction of sea ice meltwater (Sim) in surface seawater. The color scales under each figure indicate the frac-tion or concentration, the black dots indicate station locations where data were collected, and data between stations are inter-polated. The surface sample was collected within the upper 5 m of the water column.
b
a
c

Oceanography | Vol.24, No.3152
extent and the decrease in the amount of multiyear ice.
Below the surface water lies the seasonal mixed layer, which is bounded below by a near-surface halocline at ~ 10–20 m depth in summer; in winter, the mixed layer deepens to ~ 40 m because of cooling, ice formation and brine rejection, and convective mixing. Data from ice-tethered drifting buoys suggest the average winter mixed-layer depth has become shallower, from ~ 50 m in the 1980s to ~ 25 m in the 2000s (Toole et al., 2010). These data, however, were collected in ice-covered northern regions of the Canada Basin, whereas ship survey data were collected farther south in both open and ice-covered waters. The mean salinity of the seasonal mixed layer, as noted above, decreased during the 2000s. A near-surface temperature maximum (NSTM) also appeared, due to the penetration of solar radiation through thinner sea ice (Jackson et al., 2010). As Figure 2a shows, the NSTM is found at ~ 25–35 m depth and lies above the remnant of the previous winter’s mixed layer (rWML). During the 2000s, the temperature of NSTM and rWML increased by 1.5°C and 0.5°C, respectively, and salinity decreased by 4 and 2, respectively, due to sea ice melt and increased solar absorp-tion (Jackson et al., in press).
pacific-Origin watersBelow the seasonal mixed layer lies Pacific waters that have entered the Canada Basin through Bering Strait as a result of wind forcing and the global-scale sea level difference between the Pacific and Arctic Oceans (see Stigebrandt, 1984). During passage across the Bering and Chukchi Seas, Pacific waters are transformed according
to season and pathways (Coachman et al., 1975; Weingartner et al., 1998; Woodgate et al., 2005a), and they take two forms within the Canada Basin: the fresher Pacific summer water (PSW) and the more saline Pacific winter water (PWW).
PSW, characterized by a local tempera-ture maximum, has two varieties and three pathways: fresher Alaskan Coastal Current water that enters from the eastern side of the Chukchi Shelf and Barrow Canyon, more saline summer water that enters from the western Chukchi Shelf and Herald Canyon, and a mixture that enters via the Central Channel of the Chukchi Shelf (Shimada et al., 2001; Steele et al., 2004; Weingartner et al., 2005). Within the Canada Basin, the spreading pathway of both PSW varieties is influenced by eddy formation that takes place to the east of Barrow Canyon (Nikolopoulos et al., 2009) and also by variability in sea ice motion and forcing (Shimada et al., 2006). In 2007, the heat flux through Bering Strait was twice that of 2001 due to increases in both temperature and volume transport (Woodgate et al., 2010). These source water properties appear to vary interannually. For example, PSW temperatures in the Canada Basin, normally more than 0.5°C, were less than 0.5°C in 2009. Such variations under-score the importance of understanding both source and pathway conditions as well as the potential for interannual heat loss in winter. In addition, the PSW salinity range in the Canada Basin also freshened from 30 < S < 32 in the 1990s to 28 < S < 32 by the late 2000s (Jackson et al., in press), again likely due to the retreat and melting of sea ice.
PWW is also comprised of two vari-eties. The first and largest volume of PWW is characterized by a temperature
minimum and nutrient maximum at S = 33.1 (Coachman et al., 1975). The second and more saline volume of PWW is the result of mixing with underlying Atlantic water (Woodgate et al., 2005b) or the result of brine-enrichment in coastal polynyas and characterized by salinities > 33.8 and higher oxygen concentrations (Weingartner et al., 1998; Pickart et al., 2005; Shimada et al., 2005). Data from 2002–2003 surveys showed that lower-oxygen PWW was found in the northern Canada Basin and higher-oxygen PWW, associated with regional polynyas, was found in the southern Canada Basin (Shimada et al., 2005). Maps of oxygen on a horizontal surface of S = 33.1 illustrate the interannual vari-ability and distributions of PWW mode water (Figure 5a). In 2004 and 2006, high-oxygen waters were evident in the south as far east as 130°W, but were absent in 2008 and 2009. Instead, high-oxygen waters were found farther north (> 74°N) in 2008 and 2009, suggesting the pathway had changed from an along-shelf eastward flow to a northward flow. The mean temperature of PWW at S = 33.1 within the basin increased slightly (~ 0.05°C) from 2003 to 2007 and then remained constant until 2010 (Figure 2f). During the 2000s, PWW depth in the basin interior increased from 150 to 200 m (Figures 2f, 5b) due to the increased coupling between atmosphere and ocean in a reduced ice environment and downwelling within the Beaufort Gyre (McLaughlin and Carmack, 2010; cf. Proshutinsky et al., 2009; Yang, 2009).
atlantic-Origin watersBelow PWW, where Pacific waters overlie and mix with Atlantic and upstream shelf waters, is the lower

Oceanography | September 2011 153
halocline (LH) (cf. Woodgate et al., 2005b). The LH was first character-ized by an oxygen minimum near S = 34.0–34.4 of shelf-derived Atlantic water (Jones and Anderson, 1986). The T/S plot (Figure 2b), however, shows much variability in temperature at this salinity range, suggesting diverse pathways and sources. Observations from surveys in 2002–2003 showed that oxygen concentrations at S = 34.3 in the northern region of the Canada Basin were higher than in the south, and the origin of the higher concentrations was attributed to changes in the eastern Arctic Ocean (Shimada et al., 2005). Maps of oxygen on S = 34.3 show low oxygen values (~ 6 mL L–1) were present only along the western Chukchi Slope
in 2004, 2008, and 2009, and along the southwestern Beaufort Sea slope in 2008 (Figure 5c). Waters with higher oxygen values (~ > 6.6 mL L–1) were observed in the north or northwest in every year except 2009. Waters in the north were much lower in oxygen (~ 6.2 mL L–1) in 2009 than in the past, perhaps signifying another change in upstream eastern Arctic source water. These maps suggest that the pathway of along-slope low-oxygen water is variable and that delivery into the southeastern Canada Basin is intermittent.
Below LH is the Atlantic layer, which is comprised of two overlying water masses. A temperature maximum near 400 m depth within the Canada Basin characterizes the upper component, the
Fram Strait Branch (FSB) waters. Lower temperatures and higher oxygen values characterize the lower component, the Barents Sea Branch (BSB) waters. The arrival of warm temperature anomaly (WTA) FSB water, first observed upstream in the Nansen Basin during the early 1990s, reached the Northwind Ridge along the western reaches of the Canada Basin in 2002 (Shimada et al., 2004), and subsequently spread across the Chukchi Borderland (Woodgate et al., 2007) and most of the southern basin interior by 2007 (McLaughlin et al., 2009). Replacement of the “classic” 1990s and earlier Canada Basin FSB water by the influx of WTA water was almost complete by 2010, with tempera-tures increasing from ~ 0.45°C to
Figure 5. property maps of pacific winter water (pww core at S = 33.1) and lower halocline (lh core at S = 34.3). (a) Oxygen values (ml l–1) at S = 33.1. (b) depth (m) at salinity S = 33.1, (c) Oxygen values (ml l–1) at S = 34.3. Values are indicated by the color scale on the right of each figure. The black dots indicate station locations where data were collected, and data between stations are interpolated.

Oceanography | Vol.24, No.3154
> 0.7°C over most of the Canada Basin (Figure 6). FSB heat content, calculated over the density range 27.65 < σ < 27.98, increased more than 14% between 2005 and 2010, rising from 8.6 J m–2 to 9.8 J m–2 (Figure 2g). Temperatures along the eastern shelf were over 0.6°C in 2010, and when this warmer and fresher FSB water (McLaughlin et al., 2009) leaves the Arctic Ocean its lower density may reduce the Denmark Strait overflow in 15 to 25 years and affect European climate (Karcher et al., 2011).
halOCliNe ChaNgeS: 1990–2010Comparing data collected at Station A between 1990 and 2010 encapsulates the changes that have occurred in the Canada Basin over the past two decades. The T and S profiles, together with the T/S plots (Figure 7a–d), show that
changes have occurred in all water mass layers of the water column since 1990. The surface layer freshened in the 2000s. A near-surface temperature maximum appeared in the mixed layer in the 2000s. PWW deepened in the 2000s. The FSB of the Atlantic layer freshened in the 1990s and subsequently warmed in the 2000s. Also, the BSB of the Atlantic layer fresh-ened in the 1990s.
Chemistry data reveal additional changes. For example, nitrate profiles (Figure 7e) illustrate Pacific winter water between 200–260 m depth was replaced by the inflow of fresher, lower-nutrient and oxygenated LH water in the 1990s. Oxygen profiles (Figure 7f) similarly show that the “classic” low-oxygen LH water was ventilated by these inflows. The oxygen-salinity plot indicates that ventilation occurred in all Atlantic-origin waters. The major
change in ventilation occurred in the 1990s as no discernible change was manifest in the 2000s.
halOCliNe ChaNgeS: 1970–2010Freshwater and heat content calculations illustrate the broad-scale changes that have taken place in the Canada Basin since the 1970s. The height of freshwater content is calculated relative to a refer-ence salinity of S = 34.8 (~ 400–440 m) and the heat content is calculated rela-tive to the freezing temperature, first to the depth where S = 32.4 (~ 120 m) and second to a depth of 1,000 m. The 1970s data are derived from the Arctic Climatology Project 1997, 1998. Maps of freshwater content show remarkable similarity in the 1970s and 2004, with the height of freshwater in the Canada Basin being ~ 18 m, although in 2004,
Figure 6. maps of the Fram Strait Branch (FSB) potential temperature maximum 1993–2010. The temperature (°C) is referenced to the color bar at the bottom, the black dots indicate station locations where data were collected, and data between stations are interpolated.

Oceanography | September 2011 155
a height of 21 m was evident in a small area in the southeast part of the basin (Figure 8a). This dome of 21 m grew in size by 2006, spreading to the west and the north. In 2008, the maximum height of freshwater reached 27 m. In addition, the height of the large region where the accumulated freshwater was ~ 18 m in 2004 increased to ~ 21 m in 2008 and then to ~ 24 m in 2010. This greater than 30% increase in freshwater height in six years is due to the melting of multiyear ice, entrainment of Eurasian river water, freshening of Pacific summer water, and the freshening of FSB Atlantic water, in conjunction with Beaufort Gyre accel-eration and increased Ekman pumping.
Heat content maps show the loca-tion and magnitude of changes due to increasing temperatures in two regions of the water column since the 1970s. Heat content integrated from the surface to depth where S = 32.4 (Figure 8b) includes warming due to ice retreat and the absorption of solar energy by open water, the appearance of the NSTM, and changes in Pacific summer water temperature. Heat content integrated from the surface to 1,000 m (Figure 8c) includes warming in all water masses down to and including the FSB of the Atlantic layer. This heat is associated with the arrival of 1990s warm temperature anomaly water, topographic steering of the boundary current, and the clockwise influence of the Beaufort Gyre on the advection of thermohaline intrusions (McLaughlin et al., 2009). Note that in Figure 8 the heat content scales are different: 0–1.6 J m–2 for heat content to S = 32.4, and 0–12 J m–2 for heat content to 1,000 m, illustrating that Atlantic water is the major source of heat in the water column. The distribu-tion of heat to S = 32.4, confined to a
small area near Barrow Canyon in the 1970s, was higher in the basin interior in the early 2000s. The distribution was variable, spreading eastward along the Chukchi Slope in 2004 and northward along the Northwind Ridge in 2006. By 2008, however, the heat content of
the upper water column doubled, with values reaching 0.8 J m–2 in most of the southwestern region of the Canada Basin where the ice had disappeared. By 2010, the heat content doubled again to 1.6 J m–2 near the Chukchi Slope, likely reflecting inflow of Chukchi Sea water
Figure 7. physical and chemical property profiles and plots at Station a 1992–2010. (a) potential temperature. (b) Salinity. (c) potential temperature-salinity plot. (d) expanded scale potential temperature-salinity plot. (e) Nitrate. (f) Oxygen with oxygen-salinity plot inset.

Oceanography | Vol.24, No.3156
warmed by reduced albedo and increased solar absorption. Maps of heat content to 1,000 m trace the arrival of warm temperature anomaly waters during the 2000s, having increased from ~ 7 J m–2 in the 1970s to 8 J m–2 in the 2010. Most notably, the contribution of heat from the upper water column became evident in 2010 with values reaching over 10 J m–2 north of the eastern Chukchi Shelf. This 18% increase in heat content will likely impact ice conditions in 2011 and
beyond. It also signals the significance of recent warming in the upper water column in response to sea ice retreat and the subsequent reduced albedo and increased solar absorption feedback loop (cf. Rampal et al., 2009).
eCOSYSTem impliCaTiONS aNd glOBal warmiNg All components of the Canada Basin—from atmosphere to sea ice to water column—show a system in sharp
transition to a much more dynamic state during the first part of the twenty-first century. Given that the Arctic has been accurately portrayed in the literature since the 1990s as a bellwether of climate change, recent observations should ring alarm bells for governments and policymakers around the world because they signal in undeniable ways the harsh onset of global warming.
Some of the most important observa-tions noted earlier in the paper merit
Figure 8. maps of (a) the height (m) of freshwater from the surface to S = 34.8, (b) heat content (J m–2) from the surface to the depth where S = 32.4, (c) heat content (J m–2) from the surface to 1,000 m. Note the ranges of the color scales for the heat content figures are different: the range for (b) is 0–1.6 J m–2 and for (c) is 0–12 J m–2. The height of freshwater is calculated using a reference salinity of S = 34.8, and the heat content is calculated rela-tive to the freezing temperature.

Oceanography | September 2011 157
restatement and, admittedly, the brief discussion of these observations and their consequences is far from exhaus-tive. For example, projections made only three years ago (IPCC, 2007) that the Arctic Ocean would be ice-free in summer in 2030–2050 already appear to underestimate the rate of change in the Arctic Ocean, given the recent and immense decline of multi-year ice and ice volume (Kwok et al., 2009). Ice-free conditions in summer will obviously affect Arctic animals near the top of the food chain and will, to provide but one example, prevent polar bears from hunting seals from ice floes. The advent of an earlier and longer melt season (Markus et al., 2009) in coastal regions will also impact animals such as caribou that have traditionally migrated across sea ice between the North American continent and the Canadian Arctic Archipelago. Northern peoples who use sea ice for subsistence hunting of seals, walrus, and whales will also be greatly affected as the ice becomes thinner, more mobile to winds, and far more dangerous to traverse (Fienup-Riordan and Carmack, 2011, in this issue).
Ice-free open-water conditions in summer are likely to prompt new biolog-ical regimes. For example, upwelling-favorable winds will transport nutrient-bearing Pacific winter water onto continental shelves and thereby increase biological production in shelf regions (Carmack and Chapman, 2003; Nishino et al., 2011). In contrast, increased Ekman pumping and downwelling in the Beaufort Gyre (Proshutinsky et al., 2009; Yang, 2009) has already deepened the nutricline and underlying chlorophyll maximum (Figure 2e) in the basin inte-rior (McLaughlin and Carmack, 2010), thus decreasing biological production
(cf. Nishino et al., 2011). Nutrient reduc-tion, nitrate in particular, has already affected the food web, as shown by a shift between 2001 and 2008 in phyto-plankton cell size from nanoplankton to the smaller picoplankton (Li et al., 2009). In short, changes will produce biological winners (shelves) and losers (basin inte-riors), as well as changes in the size and structure of the food web.
The magnitude of sea ice meltwater is also reshaping the Canada Basin ecosystem. Global ocean acidification has been exacerbated in the Canada Basin by the accumulation of sea ice meltwater because meltwater has low values of carbonate ions, ions that affect the solu-bility of calcium carbonate and, therefore, the ability of marine calcifying organisms to produce calcium carbonate shells or skeletons. In effect, surface water shifted from an environment that enabled shell formation to an environment in which shells dissolve in 2008 (Yamamoto-Kawai et al., 2009b). This change, in particular, affects organisms such as the larvae of shell-forming pteropods like Limacina helicina that are concentrated in the upper 50 m. Pacific winter water properties are also corrosive, due to the remineralization of organic matter on the Bering/Chukchi shelves, and, therefore, increased upwelling of these corrosive waters onto the shelf will negatively affect benthic communities of mussels and clams (Yamamoto-Kawai et al., 2009b).
Two other changes deserve mention because of their potential conse-quences. First, Canada Basin outflow, now warmer and significantly fresher, along with outflow from the three other Arctic subbasins, will impact the global thermohaline circulation and climate because both are conditioned by changes in surface heat and freshwater
fluxes. Thus, Canada Basin outflow will affect the outflow region of the Arctic Ocean and further downstream (Dickson et al., 2008). In 15–25 years, the outflow of warmer and fresher Fram Strait Branch waters may conceivably reduce the Denmark Strait Overflow, thereby affecting the climate in Europe (Karcher et al., 2011).
Second, an exceptional volume of freshwater has been accumulating in the Canada Basin for more than a decade (Proshutinsky et al., 2009), and this volume of freshwater is unlikely to be contained within the Beaufort Gyre indefinitely. If released rapidly into either the Labrador or Greenland Seas, this large reservoir of freshwater will have critical downstream implications for global thermohaline circulation and climate, as well as for fisheries and ecosystems sensitive to sudden changes in salinity or temperature.
aCkNOwledgemeNTSWe acknowledge support from Fisheries and Oceans Canada, the US National Science Foundation Office of Polar Programs (grant OPP-0424864), and the Canadian International Polar Year office. We are grateful to our colleagues Koji Shimada and Motoyo Itoh from the Japan Agency for Marine-Earth Science and Technology and Sarah Zimmerman from IOS for collecting high-quality data on programs aboard R/V Mirai and CCGS Louis St. Laurent, respectively. We thank our dedicated science teams, and the captains and crews of both vessels. We also thank the two reviewers and the editor for their helpful sugges-tions. Several figures were produced using Ocean Data View: R. Schlitzer at http://www.awi-bremerhaven.de/GEO/ODV, 2001.
Oceanography | Vol.24, No.3158
reFereNCeSAnderson, L.G., G. Bjork, O. Holby, E.P. Jones,
G. Kattner, K.P. Koltermann, B. Liljeblad, R. Lindegren, B. Rudels, and J.H. Swift. 1994. Water masses and circulation in the Eurasian Basin: Results from the ODEN 91 expedition. Journal of Geophysical Research 99:3,273–3,283, http://dx.doi.org/10.1029/93JC02977.
Belkin, I.M., S. Levitus, J. Antonov, and S.-A. Malmberg. 1998. “Great Salinity Anomalies” in the North Atlantic. Progress in Oceanography 41:1–68, http://dx.doi.org/10.1016/S0079-6611(98)00015-9.
Carmack, E.C. 1990. Large-scale physical ocean-ography of polar oceans. Pp. 171–222 in Polar Oceanography, Part A: Physical Science. W.O. Smith Jr., ed., Academic Press, San Diego.
Carmack, E., and D.C. Chapman. 2003. Wind-driven shelf/basin exchange on an Arctic shelf: The joint roles of ice cover extent and shelf-break bathymetry. Geophysical Research Letters 30, 1778, http://dx.doi.org/10.1029/2003GL017526.
Carmack, E.C., K. Aagaard, J.H. Swift, R.W. Macdonald, F.A. McLaughlin, E.P. Jones, R.G. Perkin, J.N. Smith, K.M. Ellis, and L. Kilius. 1997. Changes in tempera-ture and tracer distributions within the Arctic Ocean: Results from the 1994 Arctic Ocean Section. Deep-Sea Research Part II 44:1,487–1,502, http://dx.doi.org/10.1016/S0967-0645(97)00056-8.
Carmack, E.C., R.W. Macdonald, R.G. Perkin, F.A. McLaughlin, and R.J. Pearson. 1995. Evidence for warming of Atlantic water in the southern Canadian Basin of the Arctic Ocean: Results from the Larsen-93 expedition. Geophysical Research Letters 22:1,061–1,064, http://dx.doi.org/10.1029/95GL00808.
Coachman, L.K., K. Aagaard, and R.B. Tripp. 1975. Bering Strait: The Regional Physical Oceanography. University of Washington Press, Seattle, WA.
Cooper, L.W., J.W. McClelland, R.M. Holmes, P.A. Raymond, J.J. Gibson, C.K. Guay, and B.J. Peterson. 2008. Flow-weighted tracer content (δ18O, DOC, Ba, alkalinity) of the six largest Arctic rivers. Geophysical Research Letters 35, L18606, http://dx.doi.org/10.1029/2008GL035007.
Dickson, R.R., J. Meincke, and P. Rhines. 2008. Arctic-subarctic ocean fluxes: Defining the role of the Northern Seas in climate, a general introduction. Pp. 1–13 in Arctic-Subarctic Ocean Fluxes: Defining the Role of the Northern Seas in Climate. R.R. Dickson, J. Meincke, and P. Rhines, eds, Springer Netherlands, Dordrecht.
Fienup-Riordan, A., and E. Carmack. 2011. “The ocean is always changing”: Nearshore and farshore perspectives on Arctic coastal seas. Oceanography 24(3):266–279, http://dx.doi.org/10.5670/oceanog.2011.78.
Guay, C.K., and K.K. Falkner. 1997. Barium as a tracer of Arctic halocline and river waters. Deep-Sea Research Part II 44:1,543–1,569, http://dx.doi.org/10.1016/S0967-0645(97)00066-0.
Guay, C.K., F.A. McLaughlin, and M. Yamamoto-Kawai. 2009. Differentiating fluvial components of upper Canada Basin waters on the basis of measurements of dissolved barium combined with other physical and chemical tracers. Journal of Geophysical Research 114, C00A09, http://dx.doi.org/10.1029/2008JC005099.
IPCC (Intergovernmental Panel on Climate Change). 2007. The Physical Science Basis. Contribution of Working Group I to the Fourth Assessment Report of the Intergovernmental Panel on Climate Change. S.D. Solomon, D. Qin, M. Manning, Z. Chen, M. Marquis, K.B. Averyt, M. Tignor, and H.L. Miller, eds, Cambridge University Press, Cambridge, UK.
Jackson, J.M., S.E. Allen, F.A. McLaughlin, R.A. Woodgate, and E.C. Carmack. In press. Changes to the near-surface waters in the Canada Basin, Arctic Ocean from 1993–2009: A basin in transition. Journal of Geophysical Research, http://dx.doi.org/10.1029/2011JC007069.
Jackson, J.M., E.C. Carmack, F.A. McLaughlin, S.E. Allen, and R.G. Ingram. 2010. Identification, characterization and change of the near-surface temperature maximum in the Canada Basin, 1993–2008. Journal of Geophysical Research 115, 05021, http://dx.doi.org/10.1029/2009JC005265.
Jones, E.P., and L.G. Anderson. 1986. On the origin of the chemical properties of the Arctic Ocean halocline. Journal of Geophysical Research 91:10,759–10,767, http://dx.doi.org/10.1029/JC091iC09p10759.
Jones, E.P., D.M. Nelson, and P. Treguer. 1990. Chemical oceanography. Pp 406–476 in Polar Oceanography, Part A: Physical Science. W.O. Smith Jr., ed., Academic Press, San Diego.
Karcher, M., A. Beszczynska-Möller, F. Kauker, R. Gerdes, S. Heyen, B. Rudels, and U. Schauer. 2011. Arctic Ocean warming and its conse-quences for the Denmark Strait overflow. Journal of Geophysical Research, 116, C02037, http://dx.doi.org/10.1029/2010JC006265.
Kwok, R., and G.F. Cunningham. 2010. Contribution of melt in the Beaufort Sea to the decline in Arctic multiyear sea ice coverage: 1993–2009. Geophysical Research Letters 37, L20501, http://dx.doi.org/10.1029/2010GL044678.
Kwok, R., G.F. Cunningham, M. Wensnahan, I. Rigor, H.J. Zwally, and D. Li. 2009. Thinning and volume loss of the Arctic Ocean sea ice cover: 2003–2008. Journal of Geophysical Research 114, C07005, http://dx.doi.org/10.1029/2009JC005312.
Li, W.K.W., F.A. McLaughlin, C. Lovejoy, and E.C. Carmack. 2009. Smallest algae thrive as the Arctic Ocean freshens. Science 326:539, http://dx.doi.org/10.1126/science.1179798.
Macdonald, R.W., E.C. Carmack, F.A. McLaughlin, and K.K. Falkner. 1999. Connections among ice, runoff and atmospheric forcing in the Beaufort Gyre. Geophysical Research Letters 26:2,223–2,226, http://dx.doi.org/10.1029/1999GL900508.
Macdonald, R.W., F.A. McLaughlin, and E.C. Carmack. 2002. Fresh water and its sources during the SHEBA drift in the Canada Basin of the Arctic Ocean. Deep-Sea Research Part I 49:1,769–1,785, http://dx.doi.org/10.1016/S0967-0637(02)00097-3.
Markus, T., J.C. Stroeve, and J. Miller. 2009. Recent changes in sea ice melt onset, freezeup and melt season length. Journal of Geophysical Research 114, C12024, http://dx.doi.org/10.1029/2009JC005436.
Mauritzen, C. 1996. Production of dense overflow waters feeding the North Atlantic across the Greenland-Scotland Ridge. Part 1: Evidence for a revised circulation scheme. Deep-Sea Research Part I 43:769–806, http://dx.doi.org/10.1016/0967-0637(96)00037-4.
McLaughlin, F.A., and E.C. Carmack. 2010. Deepening of the nutricline and chlorophyll maximum in the Canada Basin interior, 2003–2009. Geophysical Research Letters 37, L24602, http://dx.doi.org/10.1029/2010GL045459.
McLaughlin, F.A., E.C. Carmack, R.W. Macdonald, and J.K.B. Bishop. 1996. Physical and geochem-ical properties across the Atlantic/Pacific water mass front in the southern Canadian Basin. Journal of Geophysical Research 101:1,183–1,197, http://dx.doi.org/10.1029/95JC02634.
McLaughlin, F.A., E.C. Carmack, R.W. Macdonald, H. Melling, J.H. Swift, P.A. Wheeler, B.F. Sherr, and E.B. Sherr. 2004. The joint roles of Pacific and Atlantic-origin waters in the Canada Basin, 1997–1998. Deep-Sea Research Part I 51:107–128, http://dx.doi.org/10.1016/ j.dsr.2003.09.010.
McLaughlin, F., E. Carmack, R. Macdonald, A.J. Weaver, and J. Smith. 2002. The Canada Basin, 1989–1995: Upstream events and far-field effects of the Barents Sea. Journal of Geophysical Research 107, C7, http://dx.doi.org/10.1029/2001JC000904.
McLaughlin, F.A., E.C. Carmack, W.J. Williams, S. Zimmermann, K. Shimada, and M. Itoh. 2009. Joint effects of boundary currents and thermohaline intrusions on the warming of Atlantic water in the Canada Basin, 1993–2007. Journal of Geophysical Research 114 C00A12, http://dx.doi.org/10.1029/2008JC005001.
Morison, J., M. Steele, and R. Anderson. 1998. Hydrography of the upper Arctic Ocean measured from the nuclear submarine USS Pargo. Deep-Sea Research Part I 45:15–38, http://dx.doi.org/10.1016/S0967-0637(97)00025-3.
National Snow and Ice Data Center. 2010. Arctic sea ice falls to third-lowest extent; Downward trend persists. http://nsidc.org/news/press/20101004_minimumpr.html, Boulder, CO.
Nikolopoulos, A., R.S. Pickart, P.S. Fratantoni, K. Shimada, D.J. Torres, and E.P. Jones. 2009. The western Arctic boundary current at 152°W: Structure, variability, and transport. Deep-Sea Research Part I 56:1,164–1,181, http://dx.doi.org/10.1016/j.dsr2.2008.10.014.
Nishino, S., T. Kikuchi, M. Yamamoto-Kawai, Y. Kawaguchi, T. Hirawake, and M. Itoh. 2011. Enhancement/reduction of biological pump

Oceanography | September 2011 159
depends on ocean circulation in the sea-ice reduction regions of the Arctic Ocean. Journal of Oceanography 67:305–314, http://dx.doi.org/10.1007/s10872-011-0030-7.
Perovich, D.K., E.L. Andreas, J.A. Curry, H. Eiken, C.W. Fairall, T.C. Grenfell, P.S. Guest, J. Intrieri, D. Kadko, R.W. Lindsay, and others. 1999. Year on ice gives climate insights. Eos, Transactions, American Geophysical Union 80:481, 485–486.
Pickart, R.S., T.J. Weingartner, S. Zimmermann, D.J. Torres, and L.J. Pratt. 2005. Flow of winter-transformed water into the western arctic. Deep-Sea Research Part II 52:3,175–3,198, http://dx.doi.org/10.1016/j.dsr2.2005.10.009.
Pounder, E.R. 1986. Physical oceanography near the North Pole. Journal of Geophysical Research 91:11,763–11,773, http://dx.doi.org/10.1029/JC091iC10p11763.
Proshutinsky, A.Y., and M.A. Johnson. 1997. Two circulation regimes of the wind-driven Arctic Ocean. Journal of Geophysical Research 102:12,493–12,514, http://dx.doi.org/10.1029/97JC00738.
Proshutinsky, A.Y., and M. Johnson. 2010. Decadal variability of Arctic climate: Cyclonic and anticyclonic circulation regimes. American Geophysical Union Fall Meeting, San Francisco, CA, December 13–17, 2010, Abstract GC12B-09.
Proshutinsky, A., R.H. Bourke, and F.A. McLaughlin. 2002. The role of the Beaufort Gyre in Arctic climate variability: Seasonal to decadal climate scales. Geophysical Research Letters 29:2,100–2,105, http://dx.doi.org/10.1029/2002GL015847.
Proshutinsky, A., R. Krishfield, M.-L. Timmermans, J. Toole, E. Carmack, F. McLaughlin, W.J. Williams, S. Zimmermann, M. Itoh, and K. Shimada. 2009. Beaufort Gyre freshwater reservoir: State and variability from observations. Journal of Geophysical Research 114, C00A10, http://dx.doi.org/10.1029/2008JC005104.
Proshutinsky, A.Y., I.V. Polyakov, and M.A. Johnson. 1999. Climate states and vari-ability of Arctic ice and water dynamics during 1946–1997. Polar Research 18:135–142, http://dx.doi.org/10.1111/j.1751-8369.1999.tb00285.x.
Quadfasel, D., A. Sy, D. Wells, and A. Tunik. 1991. Warming in the Arctic. Nature 350:385, http://dx.doi.org/10.1038/350385a0.
Rampal, P., J. Weiss, and D. Marsan. 2009. Positive trend in the mean speed and deformation rate of Arctic sea ice. Journal of Geophysical Research 114, C05013, http://dx.doi.org/10.1029/2008JC005066.
Rigor, I., and J.M. Wallace. 2004. Variations in the age of Arctic sea-ice and summer sea-ice extent. Geophysical Research Letters 31, L09401, http://dx.doi.org/10.1029/2004GL019492.
Serreze, M.C., J.A. Maslanik, J.R. Rey, and R.F. Kokaly. 1995. Diagnosis of the record minimum in Arctic sea ice area during 1990 and associated snow cover extremes. Geophysical Research Letters 22:2,183–2,186, http://dx.doi.org/10.1029/95GL02068.
Shimada, K., E.C. Carmack, K. Hatakeyama, and T. Takizawa. 2001. Varieties of shallow tempera-ture maximum waters in the Western Canadian Basin of the Arctic Ocean. Geophysical Research Letters 28:3,441–3,444, http://dx.doi.org/10.1029/2001GL013168.
Shimada, K., M. Itoh, S. Nishino, F. McLaughlin, E. Carmack, and A. Proshutinsky. 2005. Halocline structure in the Canada Basin of the Arctic Ocean. Geophysical Research Letters 32, L03605, http://dx.doi.org/10.1029/2004GL021358.
Shimada, K., T. Kamoshida, M. Itoh, S. Nishino, E. Carmack, F. McLaughlin, S. Zimmermann, and A. Proshutinsky. 2006. Pacific Ocean inflow: Influence on catastrophic reduction of sea ice cover in the Arctic Ocean. Geophysical Research Letters 33, L08605, http://dx.doi.org/10.1029/2005GL025624.
Shimada, K., F. McLaughlin, E. Carmack, A. Proshutinsky, S. Nishino, and M. Itoh. 2004. Penetration of the 1990s warm temperature anomaly of Atlantic Water in the Canada Basin. Geophysical Research Letters 31, L20301, http://dx.doi.org/10.1029/2004GL020860.
Steele, M., J. Morison, W. Ermold, I. Rigor, M. Ortmeyer, and K. Shimada. 2004. Circulation of summer Pacific halocline water in the Arctic Ocean. Journal of Geophysical Research 109, C02027, http://dx.doi.org/10.1029/2003JC002009.
Stigebrandt, A. 1984. The North Pacific: A global-scale estuary. Journal of Physical Oceanography 14:464–470, http://dx.doi.org/10.1175/1520-0485(1984) 014<0464:TNPAGS>2.0.CO;2.
Swift, J.H., K. Aagaard, L. Timokhov, and E.G. Nikiforov. 2005. Long-term variability of Arctic Ocean waters: Evidence from a reanalysis of the EWG data set. Journal of Geophysical Research 110, C03012, http://dx.doi.org/10.1029/2004JC002312.
Swift, J.H., E.P. Jones, K. Aagaard, E.C. Carmack, M. Hingston, R.W. Macdonald, F.A. McLaughlin, and R.G. Perkin. 1997. Waters of the Makarov and Canada basins. Deep-Sea Research Part II 44:1,503–1,529, http://dx.doi.org/10.1016/S0967-0645(97)00055-6.
Taylor, J.R., K.K. Falkner, U. Schauer, and M. Meredith. 2003. Quantitative considerations of dissolved barium as a tracer in the Arctic Ocean. Journal of Geophysical Research 108, 3374, http://dx.doi.org/10.1029/2002JC001635.
Thompson, D.W.J., and J.M. Wallace. 1998. The Arctic Oscillation signature in the wintertime geopotential height and temperature fields. Geophysical Research Letters 25:1,297–1,300, http://dx.doi.org/10.1029/98gl00950.
Toole, J.M., M.-L. Timmermans, D.K. Perovich, R.A. Krishfield, A. Proshutinsky, and J.A. Richter-Menge. 2010. Influences of the ocean surface mixed layer and thermoha-line stratification on Arctic sea ice in the central Canada Basin. Journal of Geophysical Research 115, C10018, http://dx.doi.org/10.1029/2009JC005660.
Weingartner, T., K. Aagaard, R. Woodgate, S. Danielson, Y. Sasaki, and D. Cavalieri. 2005. Circulation on the north central Chukchi Sea shelf. Deep-Sea Research Part II 52:3,150–3,174, http://dx.doi.org/10.1016/j.dsr2.2005.10.015.
Weingartner, T.J., D.J. Cavalieri, K. Aagaard, and Y. Sasaki. 1998. Circulation, dense water formation, and outflow on the north-east Chukchi shelf. Journal of Geophysical Research 103:7,647–7,661, http://dx.doi.org/10.1029/98jc00374.
Williams, W.J., E.C. Carmack, K. Shimada, H. Melling, K. Aagaard, R.W. Macdonald, and R.G. Ingram. 2006. Joint effects of wind and ice motion in forcing upwelling in Mackenzie Trough, Beaufort Sea. Continental Shelf Research 26:2,352–2,366, http://dx.doi.org/10.1016/j.csr.2006.06.012.
Woodgate, R.A, K. Aagaard and T. Weingartner. 2005a. A year in the physical oceanography of the Chukchi Sea. Moored measure-ments from autumn 1990–1991. Deep-Sea Research Part II 52:3,116–3,149, http://dx.doi.org/10.1016/ j.dsr2.2005.10.016.
Woodgate, R.A., K. Aagaard, J.H. Swift, K.K. Falkner, and W.M. Smethie. 2005b. Pacific ventilation of the Arctic Ocean’s lower halocline by upwelling and diapycnal mixing over the continental margin. Geophysical Research Letters 32, L18609, http://dx.doi.org/10.1029/2005GL023999.
Woodgate, R.A., K. Aagaard, J.H. Swift, W.M. Smethie Jr., and K.K. Falkner. 2007. Atlantic water circulation over the Mendeleev Ridge and Chukchi Borderland from thermo-haline intrusions and water mass properties. Journal of Geophysical Research 112, C02005, http://dx.doi.org/10.1029/2005JC003416.
Woodgate, R.A, T. Weingartner, and R. Lindsay. 2010. The 2007 Bering Strait oceanic heat flux and anomalous Arctic sea-ice retreat. Geophysical Research Letters 37, L01602, http://dx.doi.org/10.1029/2009GL041621.
Yamamoto-Kawai, M., F.A. McLaughlin, E.C. Carmack, S. Nishino, K. Shimada, and N. Kurita. 2009a. Surface freshening of the Canada Basin, 2003–2007: River runoff versus sea ice meltwater. Journal of Geophysical Research 114, C00A05, http://dx.doi.org/10.1029/2008JC005000.
Yamamoto-Kawai, M., F.A. McLaughlin, E. Carmack, S. Nishino, and K. Shimada. 2009b. Aragonite undersaturation in the Arctic Ocean: Effects of ocean acidification and sea ice melt. Science 326:1,098–1,100, http://dx.doi.org/10.1126/science.1174190.
Yang, J. 2009. Seasonal and interannual variability of downwelling in the Beaufort Sea. Journal of Geophysical Research 114, C00A14, http://dx.doi.org/10.1029/2008JC005084.