the official web site for the state of new jersey - water levels … · 2009. 5. 1. · new jersey...
TRANSCRIPT


New Jersey Geological Survey
Open-File Report 88-3
Water Levels in the Principal Aquifers ofAtlantic County and Vicinity, New Jersey, 1985-86
byJeffrey S. Clark and Gary N. Paulachok
U.S. Geological Survey - Water Resources DivisionWest Trenton, New Jersey
Prepared by the United States Geological Surveyin cooperation with the
New Jersey Department of Environmental ProtectionDivision of Water Resources
New Jersey Department of Environmental ProtectionDivision of Water Resources
Geological SurveyCN-029
Trenton, New Jersey 08625
1989

Open-Rle Reportsare published by the New JerseyGeologicalSurvey,CN-029, Trenton,NJ 08625, This reportmay be reproduced in whole orpartprovidedthat suitablereferenceto the soumeof thecopied materialis provided.Additionalcopiesof this andother reports may be obtainedfrom:
Maps and PublicationsSales OfficeBureauof RevenueCN-402Trenton,NJ08625
A pricelistis availableon request.
Use of brand, commercial, or trade names is for identificationpurposesonly anddoes notconstituteendorsementby the NewJerseyGeologicalSurvey.

CONTENTS
Page
Abstract .......................................................... I
Introduction ...................................................... 2
Overview ....................................................... 2
Purpose and scope .............................................. 2
Description of study area ...................................... 2
Previous investigations ........................................ 4Methods of data collection ..................................... 5
Well-numbering system .......................................... 7
Acknowledgments ................................................ 7
Hydrogeologic framework ........................................... 7
Kirkwood-Cohansey aquifer system ............................... 7
Atlantic City 800-foot sand .................................... I0Ground-water levels ............................................... i0
Kirkwood-Cohansey aquifer system ............................... i0Water table, December 1985 .................................. i0
Depth to water table, December 1985 ......................... 15
Water-table fluctuations .................................... 15
Atlantic City 800-foot sand .................................... 27
Potentiometric surface, April 1986 .......................... 27
Potentiometric surface, September 1986 ...................... 27
Potentiometric change ....................................... 29Water-level fluctuations .................................... 29
Possible uses of this report ...................................... 30
Summary ........................................................... 30References cited .................................................. 32
ILLUSTRATIONS
Page!
Plate l.--Map showing altitude of the water table in
Atlantic County, New Jersey, December
1985 ................................................ in pocket2.--Map showing depth to the water table in
Atlantic County, New Jersey, December
1985 ................................................ in pocket
3.--Maps and graphs showing water levels in theAtlantic City 800-foot sand of the Kirkwood
Formation: .......................................... in pocket
a. Potentiometric surface, April 1986 ................
b. Potentiometric surface, September 1986 ............
c. Potentiometric change, April to September1986 ............................................
d. Hydrographs for selected wells, 1985-86 ...........
iii
ILLUSTRATIONS--Continued
Page
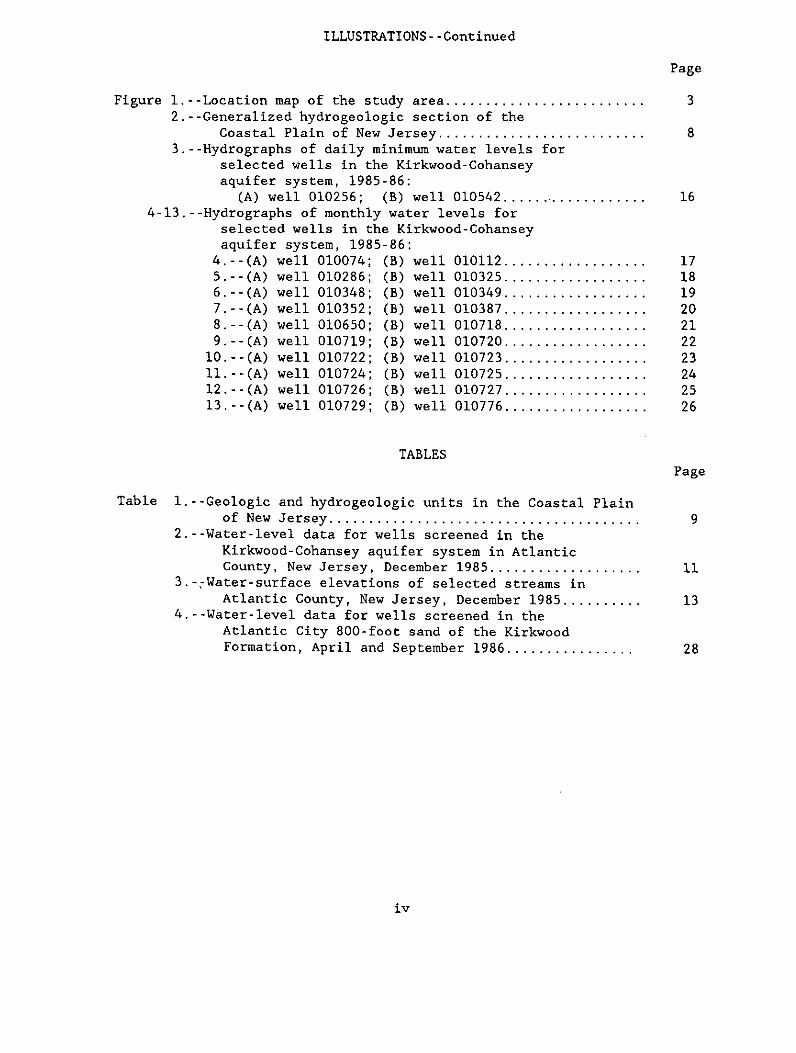
Figure 1.--Location map of the study area ......................... 3
2.--Generalized hydrogeologie section of the
Coastal Plain of New Jersey .......................... 8
3.--Hydrographs of daily minimum water levels forselected wells in the Kirkwood-Cohansey
aquifer system, 1985-86:
(A) well 010256; (B) well 010542 ................... 16
4-13.--Hydrographs of monthly water levels for
selected wells in the Kirkwood-Cohanseyaquifer system, 1985-86:
4_--(A) well 010074; (B) well 010112 .................. 17
5.--(A) well 010286; (B) well 010325 .................. 18
6.--(A) well 010348_ (B) well 010349 .................. 19
7.--(A) well 010352; (B) well 010387 .................. 20
8.--(A) well 010650; (B) well 010718 .................. 21
9.--(A) well 010719; (B) well 010720 .................. 22
10.--(A) well 010722: (B) well 010723 .................. 23
II.--(A) well 010724; (B) well 010725 .................. 24
12.--(A) well 010726; (B) well 010727 .................. 25
13.--(A) well 010729; (B) well 010776 .................. 26
TABLES
Page
Table l.--Geologic and hydrogeologic units in the Coastal Plain
of New Jersey ....................................... 92.--Water-level data for wells screened in the
Kirkwood-Cohansey aquifer system in Atlantic
County, New Jersey, December 1985 ................... ii3.-cWater-surface elevations of selected streams in
Atlantic County, New Jersey, December 1985 .......... 134.--Water-level data for wells screened in the
Atlantic City 800-foot sand of the Kirkwood
Formation, April and September 1986 ................ 28
iv

CONVERSION FACTORS AND ABBREVIATIONS
Data in this report are in inch-pound units. To convert inch-pound units to
metric (International System) units, use the following factors:
Multiply inch-pound unit By To obtain metric unit
inch (in.) 25.4 millimeter (mm)
foot (ft) 0.3048 meter (m)
mile (mi) 1.609 kilometer (km)
foot per mile (ft/mi) 0.189 meter per kilometer (m/km)
square mile (mi 2) 2.590 square kilometer (km 2)
million gallons per day 0.04381 cubic meter per second
(Mgal/d) (m3/s)
Temperature Conversion
Temperature in degrees Celsius (°C) is converted to degrees Fahrenheit
(°F) by the equation: °F = (9/5)0C + 32
Sea level: In this report, "sea level" refers to the National Geodetic
Vertical Datum of 1929 (NGVD of 1929)-- a geodetic datum derived from a.general adjustment of the first-order level nets of both the United States
and Canada, formerly called "Sea Level Datum of 1929."
V
WATER LEVELS IN THE PRINCIPAL AQUIFERS OF ATLANTIC COUNTYAND VICINITY, NEW JERSEY, 1985-86
By Jeffrey S. Clark and Gary N. Paulachok
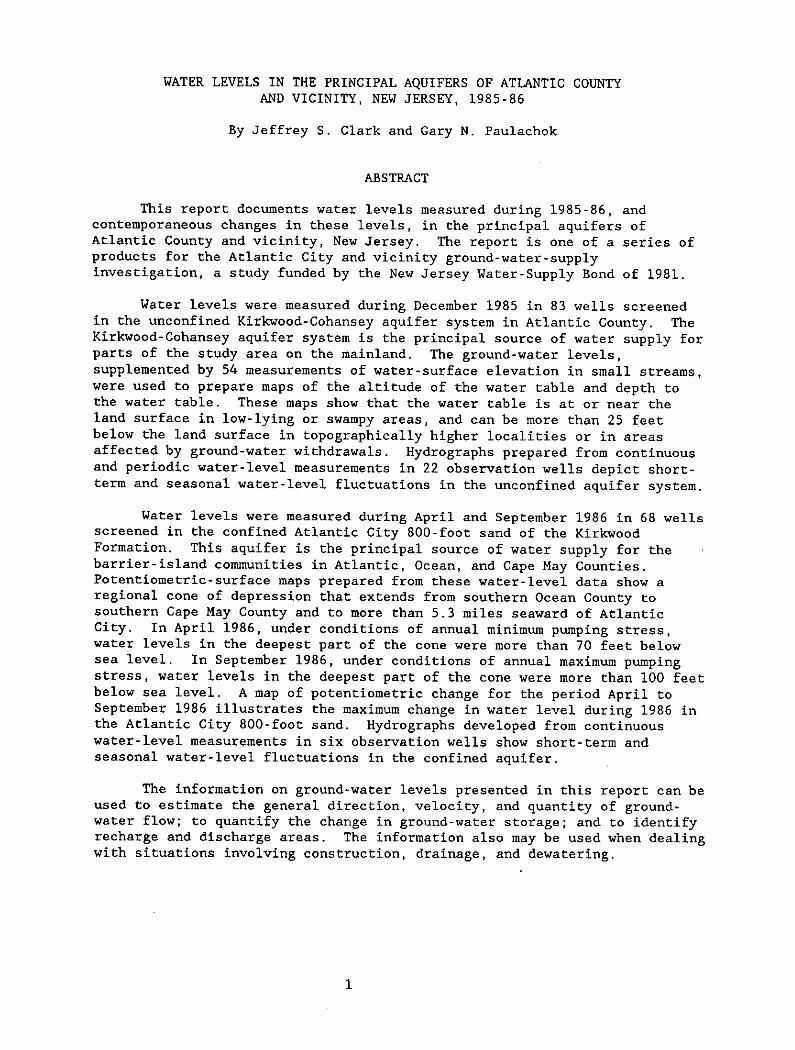
ABSTRACT
This report documents water levels measured during 1985-86, and
contemporaneous changes in these levels, in the principal aquifers ofAtlantic County and vicinity, New Jersey. The report is one of a series of
products for the Atlantic City and vicinity ground-water-supply
investigation, a study funded by the New Jersey Water-Supply Bond of 1981.
Water levels were measured during December 1985 in 83 wells screened
in the unconfined Kirkwood-Cohansey aquifer system in Atlantic County. The
Kirkwood-Cohansey aquifer system is the principal source of water supply forparts of the study area on the mainland. The ground-water levels,
supplemented by 54 measurements of water-surface elevation in small streams,
were used to prepare maps of the altitude of the water table and depth tothe water table. These maps show that the water table is at or near the
land surface in low-lying or swampy areas, and can be more than 25 feet
below the land surface in topographically higher localities or in areas
affected by ground-water withdrawals. Hydrographs prepared from continuous
and periodic water-level measurements in 22 observation wells depict short-
term and seasonal water-level fluctuations in the unconfined aquifer system.
Water levels were measured during April and September 1986 in 68 wells
screened in the confined Atlantic City 800-foot sand of the Kirkwood
Formation. This aquifer is the principal source of water supply for the
barrier-island communities in Atlantic, Ocean, and Cape May Counties.Potentiometric-surface maps prepared from these water-level data show a
regional cone of depression that extends from southern Ocean County tosouthern Cape May County and to more than 5.3 miles seaward of Atlantic
City. In April 1986, under conditions of annual minimum pumping stress,water levels in the deepest part of the cone were more than 70 feet below
sea level. In September 1986, under conditions of annual maximum pumpingstress, water levels in the deepest part of the cone were more than I00 feet
below sea level. A map of potentiometric change for the period April to
September 1986 illustrates the maximum change in water level during 1986 inthe Atlantic City 800-foot sand. Hydrographs developed from continuouswater-level measurements in six observation wells show short-term and
seasonal water-level fluctuations in the confined aquifer.
The information on ground-water levels presented in this report can be
used to estimate the general direction, velocity, and quantity of ground-water flow; to quantify the change in ground-water storage; and to identify
recharge and discharge areas. The information also may be used when dealing
with situations involving construction, drainage, and dewatering.
INTRODUCTION
Overview
Ground water is the principal source of water supply for Atlantic
County and vicinity, New Jersey, and, in many parts of this area, it is an
abundant resource. However, large withdrawals in the coastal-resort
communities have resulted in declining ground-water levels (May, 1985,
p. 8), and have increased the potential for water-supply shortages and for
contamination of freshwater aquifers by encroaching saltwater. The
Statewide Water-Supply Master Plan (New Jersey Department of Environmental
Protection, 1981) indicates that a steady increase in ground-water
withdrawals, as well as contamination of fresh ground-water supplies by
saltwater, will likely accompany the redevelopment of Atlantic City and
vicinity. This redevelopment began in 1977 with the introduction of
legalized gambling in Atlantic City (fig. i).
Purpose and Scope
The purpose of this report is to present information on ground-water
levels and their fluctuations in the principal aquifers of Atlantic Countyand vicinity, New Jersey. This information may be of particular interest to
agencies and individuals concerned with ground-water resources development
and management. Synoptic measurements of water level during 1985-86 were
used to prepare maps of altitude of the water table, depth to the water
table, potentiometric surface, and potentiometric change. Continuous orperiodic measurements of water levels in observation wells were used to
develop hydrographs showing short-term and seasonal fluctuations. Water-
level data also are given in tabular form. This report was prepared in
cooperation with the New Jersey Department of Environmental Protection,
Division of Water Resources. It is one of a series of products originating
from the Atlantic City and vicinity ground-water-supply investigation, a
study funded by th_ New Jersey Water-Supply Bond of 1981. For additional
information on the objectives, approach, and anticipated products of this
investigation, the interested reader is referred to the report by Leahy andothers (1987).
Description of Study Area
Atlantic County, an area of approximately 565 mi 2 (square miles), is
in the southeastern part of New Jersey (fig. i); it is the focal area of
this report. Atlantic County and vicinity, as used in this report, occupies
about 1,200 mi 2 and includes all of Atlantic County and parts of adjoining
Ocean, Burlington, Cumberland, and Cape May Counties (fig. i). The studyarea is bounded on the east by the Atlantic Ocean.
Atlantic County and adjoining counties are in the Coastal Plain
physiographic province. The unconsolidated sediments that comprise the
Coastal Plain form broad areas of low relief. In Atlantic County, the land
surface slopes gener'ally eastward toward the coast, and, consequently,surface drainage ultimately is to the Atlantic Ocean. Land-surface
altitudes in Atlantic County range from about 150 ft (feet) above sea level
near Hammonton (fig. i) to sea level along the coast.

75°30 ' 75 ° 74o30 '
\l ___ / /
_ "_J MONMOUTH
. ERCER
_ ._',.
400 - _'_ /' OCEAN-.-_ )/
J--./'/ ;amden BURLINGTON \
Approximate updip limit of the
confining bed overlying the
_'q _"-''k_.-@(OC'o_'6_'_,9 _ AtlantiCHammontonCity800-foot sand
SALEM
(" \ ATLANTI( O
BERLAND llantic City
A'
• /EXPLANATION _ x__
_ Study Area
A--A' Line of section0 10 MILES
39 ° _ shown in figure 2. I = I _O 10 KILOMETERS
I I I
Figure l.--Location of the study area.

The climate of the study area is considered to be of the warm-
temperate type. It is influenced substantially by the Atlantic Ocean, and
is characterized by large annual temperature ranges and ample precipitation.
Generally, temperatures in the area are moderate, and the normal mean annual
air temperature for the period 1951-80 is approximately 12 degrees Celsius.
Precipitation also is moderate, and the normal mean annual total is about 42
in. (inches). Precipitation is distributed fairly evenly throughout the
year, with maximum amounts during the late summer months. Much of the
summer rainfall is due to thunderstorms; consequently, amounts throughout
the study area may be quite variable during a particular summer (Ludlum,
1983).
According to the Federal Census of 1980 (U.S. Department of Commerce,
1982), the resident population of Atlantic County was 194,119, or
approximately 350 persons per square mile. Most of the population is
concentrated in the eastern part of the county. Atlantic City, with 40,199
inhabitants, has the largest population of any urban area in the county.
The population of the study area increases greatly during the summer months
because of the influx of tourists to the coastal resorts.
In 1981, wooded acreage accounted for approximately 61 percent of the
total area of Atlantic County; wetlands, 14 percent; residential areas, I0
percent; and farmland, 9 percent. In order of decreasing percentage of
total, the remainder of the area was used for commercial, recreation,
public, and industrial purposes (John Brennan, Atlantic County Department of
Regional Planning and Development, oral eommun., 1986).
Previous Investigations
Reports by Woolman (1890-1902) on artesian wells in New Jersey
recorded much of the earliest information on ground-water levels in the
study area. Several of these reports contain data on the original static or
pumping water levels in wells. Usually, no subsequent measurements were
made in the same wells. Since 1923, the U.S. Geological Survey, in
cooperation with various state agencies concerned with water-supply matters,
has conducted numerous studies of the ground-water resources of New Jersey.The regular measurement of water levels in observation wells was and
continues to be an important aspect of many of these investigations. The
principal reports on several such investigations in Atlantic County andvicinity are summarized below.
Thompson (1928), who reported on the ground-water supplies of the
Atlantic City region, elaborated on water-level fluctuations in the Atlantic
City 800-foot sand of the Kirkwood Formation (herein commonly referred to as
the 800-foot sand), and displayed hydrographs for several wells tapping that
aquifer. Barksdale and others (1936) defined the ground-water hydrology of
the Atlantic City region, presented water-level data for selected wells, and
related withdrawals from the 800-foot sand to water-level fluctuations
therein. Gill (1962) described the availability and quality of ground water
in Cape May County; this report contains records of selected wells and gives
water-level data for many of those wells. Rush (1962), in a report on
records of wells and ground-water quality in Burlington County, provided
data on water levels in selected wells. Clark and others (1968) presented a
general summary of the geohydrology of Atlantic County; a well table that
4

includes water-level data is a major part of that report. Anderson and
Appel (1969) described the geology and ground-water resources of Ocean
County, and listed construction details and water levels for wells tapping
the principal aquifers_ Walker (1983), and Eekel and Walker (1986), mapped
synoptic potentiometric surfaces during 1978 and 1983, respectively, in the
principal aquifers of the New Jersey Coastal Plain.
Several data-tabulation reports present additional information on
water levels in observation wells in the study area. Annual summaries of
water-level data for 1935-74 are given in the following U.S. GeologicalSurvey Water-Supply Papers (WSP):
Calendar WSP Calendar WSP Calendar WSP
year no. year no. year no.
1935 777 1944 1016 1953 1265
1936 817 1945 1023 1954 1321
1937 840 1946 1071 1955 1404
1938 845 1947 1096 1956-57 1537
1939 886 1948 1126 1958-62 1782
1940 906 1949 1156 1963-67 1977
1941 936 1950 1165 1968-72 2140
1942 944 1951 1191 1973-74 2164
1943 986 1952 1221.
Since 1975, water levels in observation wells in the Atlantic drainage
basin of New Jersey have been published annually by the U.S. Geological
Survey in the report "Water Resources Data for New Jersey, Volume I,
Atlantic Slope Basins, Hudson River to Cape May." Since 1979, water levels
in observation wells in the study area have been tabulated in these annual
reports. Although data on water levels during 1975-78 in wells in the study
area have not been published, they are available for public inspection at
the District office of the U.S. Geological Survey, West Trenton, New Jersey.
Methods of Data Collection
For this study, water levels were measured during three short periods.
In early December 1985, water levels in 83 wells screened in the Kirkwood-
Cohansey aquifer system and 54 water-surface elevations in small streams
were measured in Atlantic County. In mid- to late-April 1986, and again inSeptember 1986, water levels in 68 wells screened in the confined Atlantic
City 800-foot sand of the Kirkwood Formation were measured in Atlantic
County and vicinity. Data on water levels in observation wells werecollected from June 1985 to November 1986.
Wells selected for water-level measurements were chosen on the basis
of areal distribution, aquifer tapped, and ease of measurement. Most wells
measured for water levels in the Kirkwood-Cohansey aquifer system are used
for irrigation, public-supply, industrial, commercial, or domestic purposes_For this study, ii small-diameter wells were installed in this aquifer

system in parts of Atlantic County where water-level data were sparse or
unavailable. Measured wells in the Atlantic City 800-foot sand are used
chiefly for public-water supply. Water levels in these wells, and in
observation wells in the unconfined and confined aquifer systems, comprise
much of the database for this report.
To standardize the data-collection procedure and to reduce localized
drawdown effects caused by pumping, pumps on wells used for water-level
measurements, along with those on all high-capacity wells within a I/2-mile
radius of the well being measured, were shut down for at least 1 hour prior
to measurement. Successive measurements were made to insure that the rate
of waUer-level recovery was negligible. In most high-capacity wells in the
study area, the rate of recovery was insignificant after about 1 hour of
pump shutdown.
Depending on conditions in a particular well, water levels were
measured using either a wetted-steel tape, an electric tape (water-level
finder), or an airline. Because of the ease and accuracy of the technique,
the wetted steel-tape method was preferred and was used wherever possible.
Although slightly less accurate than the steel-tape method, electrlc-tapemeasurements were more effective in some wells where measurements with a
steel tape through a pump were difficult. In wells where access was
extremely difficult or impossible with a steel tape or an electric tape,
water levels were estimated by airline measurements. The latter technique
is the least accurate of those implemented.
Water levels in two marine-observation wells, located 1.9 mi (miles)
and 5.3 mi offshore of Atlantic City, were determined with differential
pressure transducers permanently installed in each well. Measurements were
made by retrieving peripheral connections stored on the seafloor, attaching
them to a frequency counter aboard ship, and monitoring the downholetransducers for information on water levels.
Water-surface elevations in streams were determined by measuring with
a surveyor's tape the vertical distance between the water surface and a
nearby land-surface reference point of known altitude. These measurements
were made during low streamflow, when the flow consisted almost entirely of
ground-water discharge or baseflow. Water depths in these streams ranged
typically from 1 to 2 ft.
Except for those in the marine wells, water levels were referenced to
the land-surface datum at each measuring site. Levels in the marine wells
were referenced to a temporary datum at each drilling site. Altitudes of
the land surface and the temporary datums are based on sea level, and were
used to compute the altitude of the water level (head) in each well. Most
land-surface altitudes were estimated from U.S. Geological Survey 7h-
minute topographic quadrangle maps and are considered to be accurate to
within 5 ft (one-half of the contour interval). Several altitudes,
including those of the temporary datums at the marine-drilling sites, were
determined by leveling surveys, and generally are accurate to within 1 ft.
Data from continuous recorders were used to prepare the water-level
hydrographs of several wells. These hydrographs are based on the daily
minimum water level for the period September 1985 to October 1986. Other

hydrographs, chiefly those of wells tapping the Kirkwood-Cohansey aquifer
system, are based on water-level measurements made once-monthly from June1985 to November 1986.
Weli-Numberin_ System
The well-numbering system in this report is that used since 1978 in
New Jersey by the U.S. Geological Survey. The well number consists of a
county code number and a sequential number assigned at the time the well was
inventoried originally. County codes presented in this report include
Atlantic (01), Cape May (09), and Ocean (29). For example, well number
010037 represents the 37th well inventoried in Atlantic County.
Acknowledgments
The authors acknowledge the cooperation of various firms and
individuals who kindly permitted the measurement of water levels in theirwells, particularly, the many water-company superintendents who authorized
periodic measurements and who were inconvenienced temporarily by the
shutdown of their production wells. Appreciation is extended to Joseph M.
Oschwald, formerly of the U.S. Geological Survey, who_eonducted the initial
work on the water-table map that is part of this report.
HYDROGEOLOGIC FRAMEWORK
The study area is in the Coastal Plain of New Jersey, which consists
of unconsolidated deposits of gravel, sand, silt, and clay. The area is
underlain by two principal freshwater aquifers--the surfieial Kirkwood-
Cohansey aquifer system and the Atlantic City 800-foot sand of the Kirkwood
Formation. The Rio Grande water-bearing zone of the Kirkwood Formation is
situated approximately midway within the confining unit that separates the
Kirkwood-Cohansey aquifer system from the 800-foot sand. Throughout most of
the study area, however, the Rio Grande is an aquifer of minor importance.
Near Atlantic City, aquifers deeper than the 800-foot sand have not been
developed for water supply, as they may contain brackish or saline water.
A generalized hydrogeologic section (fig. 2) shows the principal
aquifers and confining units of the New Jersey Coastal Plain. Table i
presents information on the lithology and hydrologic characteristics of
these aquifers and confining units, and shows the relations between geologic
units and hydrogeologic units.
Kirkwood-Cohansey Aquifer System
In the study area, the upper part of the Kirkwood Formation, together
with the overlying Cohansey Sand, both of Miocene age, form the Kirkwood-
Cohansey aquifer system (table I). Although these two units are components
of this composite aquifer system, for this study they have not been
differentiated individually because of their similar geologic and hydrologic
properties. The Kirkwood-Cohansey aquifer system thickens toward the
southeast, and, near Atlantic City, it is approximately 400 ft thick

Camden Hammonton Egg Harbor City Atlantic CityA A'
Sea I Sea
level I aquifer system level
,
-_, _/,
Potomac-Raritan-
t_ Magothy
EXPLANATION , _ aquifer system"" 7'
_ COMPOSITE CONFINING LAYERAND MINOR AQUIFER "
__CONFINING LAYER _ _s
WBZ: water-bearing zone
Not to scale Modified from Walker. 1983
Figure 2.--Generalized hydrogeologic section of the Coastal Plain of
New Jersey. (line of section shown on figure i).

Tabte 1 --Geo o_1c and hydro_eotoqic units in the Co•star Ptain of Ne_ Jersey
SVST[N SEItES _EOL¢_I¢ Ltt_OCCGY NTDI_OtOGJ¢ i NYOeCLOGIC •HARA_1£RIST[¢S
AIt_-_et Sand, I(L(, and bLiCk mud.depestt S
Surf aria{ r_terJaL ¢o_nOnLy h'tdrauticalLyH°tc<ene |lie h _nd sand r•Z light CoLored medium to ¢¢_lrse- Undtffere_- ¢o_¢ted to Liner y ng _J eel.
_Jaterr_ry _ Ilrlvet ira 'n4_, p4_ y. " tiitld LOClt ty" $¢¢_ _lnitl rely act i|¢on({nin9 units. ThicKer sa_ • •¢_LI of yielding Lar_* ¢K*_ntJ¢te•
ptlllTC¢lnll CapeFolrlmMtl_gn of k_lter.
penllUken 5end c_lrtl tlg_¢ Col•re_ heCerogefloulForlut_ • lyly* p4_b y.
IridgetonFOPmlt t_
KJrk_*ood. • mJor ae_Jiflr system.
Ccnara,¥ Grouted racer occurs generltty• el•on q_tt GPBvIL, _t_lr•z, t_Oht cetored, sa_dy, i_j_fe r _re_eP _•ter-¢lble ¢onditJo_.
: GraveL Iyl[tl _ [n Cape Hay County the¢_h.r_ey Sa_d Jl ¢¢1¢_r8¢t ISil_ COnd_t IDnl.
C¢_sey Slnd Sand, qua.._.ptz tlght-cot•Pi¢l I_¢iium to ¢¢*lrse-9rlined, riChLy; o¢i •Lay _._s.
NJ_Clnl
Conf {ning unitT1_1¢1¢d[l[O_lCeCMS •tly _ Occurs
I[0 G_ IL_ Coast _ for • shortTlrtliry _lter bearing ¢llsTl_:e ihtl_d. & thin _•tir.
• b_ir_t _ sl_d is p_e_[ in theK_tk_cd $i_e_ _pt_ 9rl_ II_ tin _1_ f_ne.To, Z°_B ili_dt e of _h_l un_L
FOrlmtJ_n _i¢_rl_r_c¢ lll¢lCeo_l _ d_rk, Conf(ning unit¢o[orl_ d_atom_cec_s ¢{iy.
At{l,n¢_c C(Ty A nlljo_ I_J_flp I[¢_1g •he ¢OlSt.I00- foot ssnd
Po_r{y perl_l_le ledimen•s.
Ot %goceoePiney Poln¢
FOrl_tl°n _ _uBr¢I a_l 9lt_ca_tte fill-to _(r_ t _oi_t y_lLds mO_rl(I 4_J44_[itierl ot _klar,
¢carse.grl t_ed. _ a_ji f er_¢¢ e_e hlrk _lvll
HI_414Uln Clay I(Ity Ind llndy O!l_:on([l¢ _._, P_rlY perl_lblll le_dJmts.F@PIm_on grly Ird br_, f_ne.gralned q_lrtl .
-- ec_Jifer
$1nd rt[ _rlly _ _re_n f{ne-lo ¢c4r1•- ¢
V_n¢_nt¢_._ 9rlt'ne_4, 9tlucon_¢i¢, in_ bro_ clayey very _ V_n•ent_ y_etds mtt ¢o i_lrlt• ¢_l]l_t_tlilForn_ltic_ _l_i_iferoul (lIl_con_ti Ind C_lr•z of vl_lP _n and P•ir i¢& ou¢cropPit•_ef_ cl ¢•rl_ tll. i_•l.
_:orr_rst_m _¢1, ¢lsyey qIIL_lt_¢ dark grl_n f_eSand |O ¢oerse-grlined.
t In¢_n $_nd
hi.to •carla-grained, ¢ aye*F, • •KI_I*
II_ll_dSIm_ tJlLdl _l_Lt _tltJ es of vatlrled hnkIn Ir_ heir ]¢• _Jt©r_ irel_
lll_l_k _ ¢_l silty OIlucan]tio grlen andForl_tion b 4¢{, _Y_.to ¢olrn.Grl _d. P_rty perme•bLe sediments.
P_mt Laurel Samd quartz b¢cvn encl gray fir_.¢o k_a*h-$ar, d c_arse.grl ned, • g_tty 9Ll_J¢On t ©. Na_nt LmJreL A i_or Ilk(far.
I_J_ far
$1n_ _lry f_,_4-to flrvl-greined, 9ray IndFor_lt_¢n brovn, silty, • ght y 9(I.J¢on t ¢.
Nip&hit _t_-
Vi_Onah _ {Itl_{y ¢c_flnlng U_¢.con/( nl_g unit
Har_laLtt_ C[•y I_tty d_rk gr_il_n _r•y
_p_er [r_tllhtovn 9r I _ ¢¢1 ¢ ly _4_. [ngt]sh(°_• riti•etO_ FO_I_tI_ _ rtz tin l_d rw, fir_*¢o IWd_LI_- i_jifir I IMjo_ I_lJ]fl_. lk_ slnd unit• inlylt_ Honm_Qth _ O¢llk3 codntill.
V•e¢l_ry Ctly Ctly, _PIly Irld btKt, 4q_cKIt_JS SiLLem or ¢o_finl re(C. L_<_tty*
Rer•hl, ntvi_le* the _er•hlntv ?_e F_T_on lly COntain¢lly 9tl_¢onl¢l¢, I(C_C_ gray Ind _ • thin _•tir.belr{ng
¢_'4t[1'¢1_ p.e¢¢_l_tv_Lte btK_. t_llt_, _W ftne-9rlmecl ¢_,lltt_ ¢c_f(rtir_g unit ita_l.FC*rllllt]¢_ Ind _l_ll_:oni[I¢ lind.
HIg°_hY rlf'_.a_d rtl t_ght-t_irey line-to coarse*FO*'ll[i•el L¢¢J beds o dlrk.grl*y gn ¢ c UppercLly. I_Ji f •r
A m OP I_J(f_# inorthern C_llt i_'lp Llin_" tntttltheu_lr
Reriten 9rile, _(y arkol_¢ ---_ ijt1_1 I_JIf el" (i I_Jlvlt*mt ¢¢ the
FOI_g_I_I v•ri|llllt/ ¢ Iy, Nil_ll e _ifll¢ I| _l¥il_ to th_
iI:_lfer Farri_gt_ _l_er. In th• D•{_are_ll,,,_r VlIL_ _h¢_ _ltelfer• Ice
_._ ....l u_t _ _'r are _ er_t lied*
Cret•¢_ Gr__tflr
9

(Zapecza, 1984, p. 34). This aquifer system is the principal source of
water supply in parts of the study area on the mainland. However, on the
barrier islands and along the coastal fringe, the system contains brackish
or salty water and cannot be used as a source of water supply.
In most areas, the Kirkwood-Cohansey aquifer system is highly
permeable and unconfined. The system is recharged chiefly by precipitation.
Natural recharge to the Cohansey Sand averages about 0.95 million gallons
per day per square mile (Rhodehamel, 1970, p. 18). Water is discharged from
the aquifer system by evaporation, transpiration, withdrawals through wells,
flow to underlying geohydrologic units, and seepage to surface-water bodies.
Atlantic City 800-Foot Sand
The Atlantic City 800-foot sand of the Kirkwood Formation is a highly
permeable confined aquifer. It is interbedded midway between an overlying,thick massive confining unit, and an underlying, relatively thin confining
unit (fig. 2). At Atlantic City, the overlying confining unit isapproximately 300 ft thick, the 800-foot sand is more than 150 ft thick, and
the underlying confining unit is about 125 ft thick (Zapecza, 1984). The
overlying confining unit thins with distance inland; northwest of Egg HarborCity (fig. i), it grades into the gravel and sand deposits of the Kirkwood-
Cohansey aquifer system. This lithologic change is accompanied by a change
from confined to unconfined ground-water conditions. The 800-foot sand is,
with few exceptions, the sole source of water supply for the barrier-island
communities in the study area. This aquifer is recharged directly by
precipitation on the outcrop area of the Kirkwood Formation (fig. 2) and
where the aquifer is connected hydraulically to the Kirkwood-Cohanseyaquifer system. Leakage of water from adjacent hydrogeologic units also is
an important source of recharge. Loss of water from the 800-foot sand
chiefly is through wells and by seepage to the Atlantic Ocean.
GROUND-WATER LEVELS
Kirkwood-Cohansey Aquifer System
Water Table, December 1985
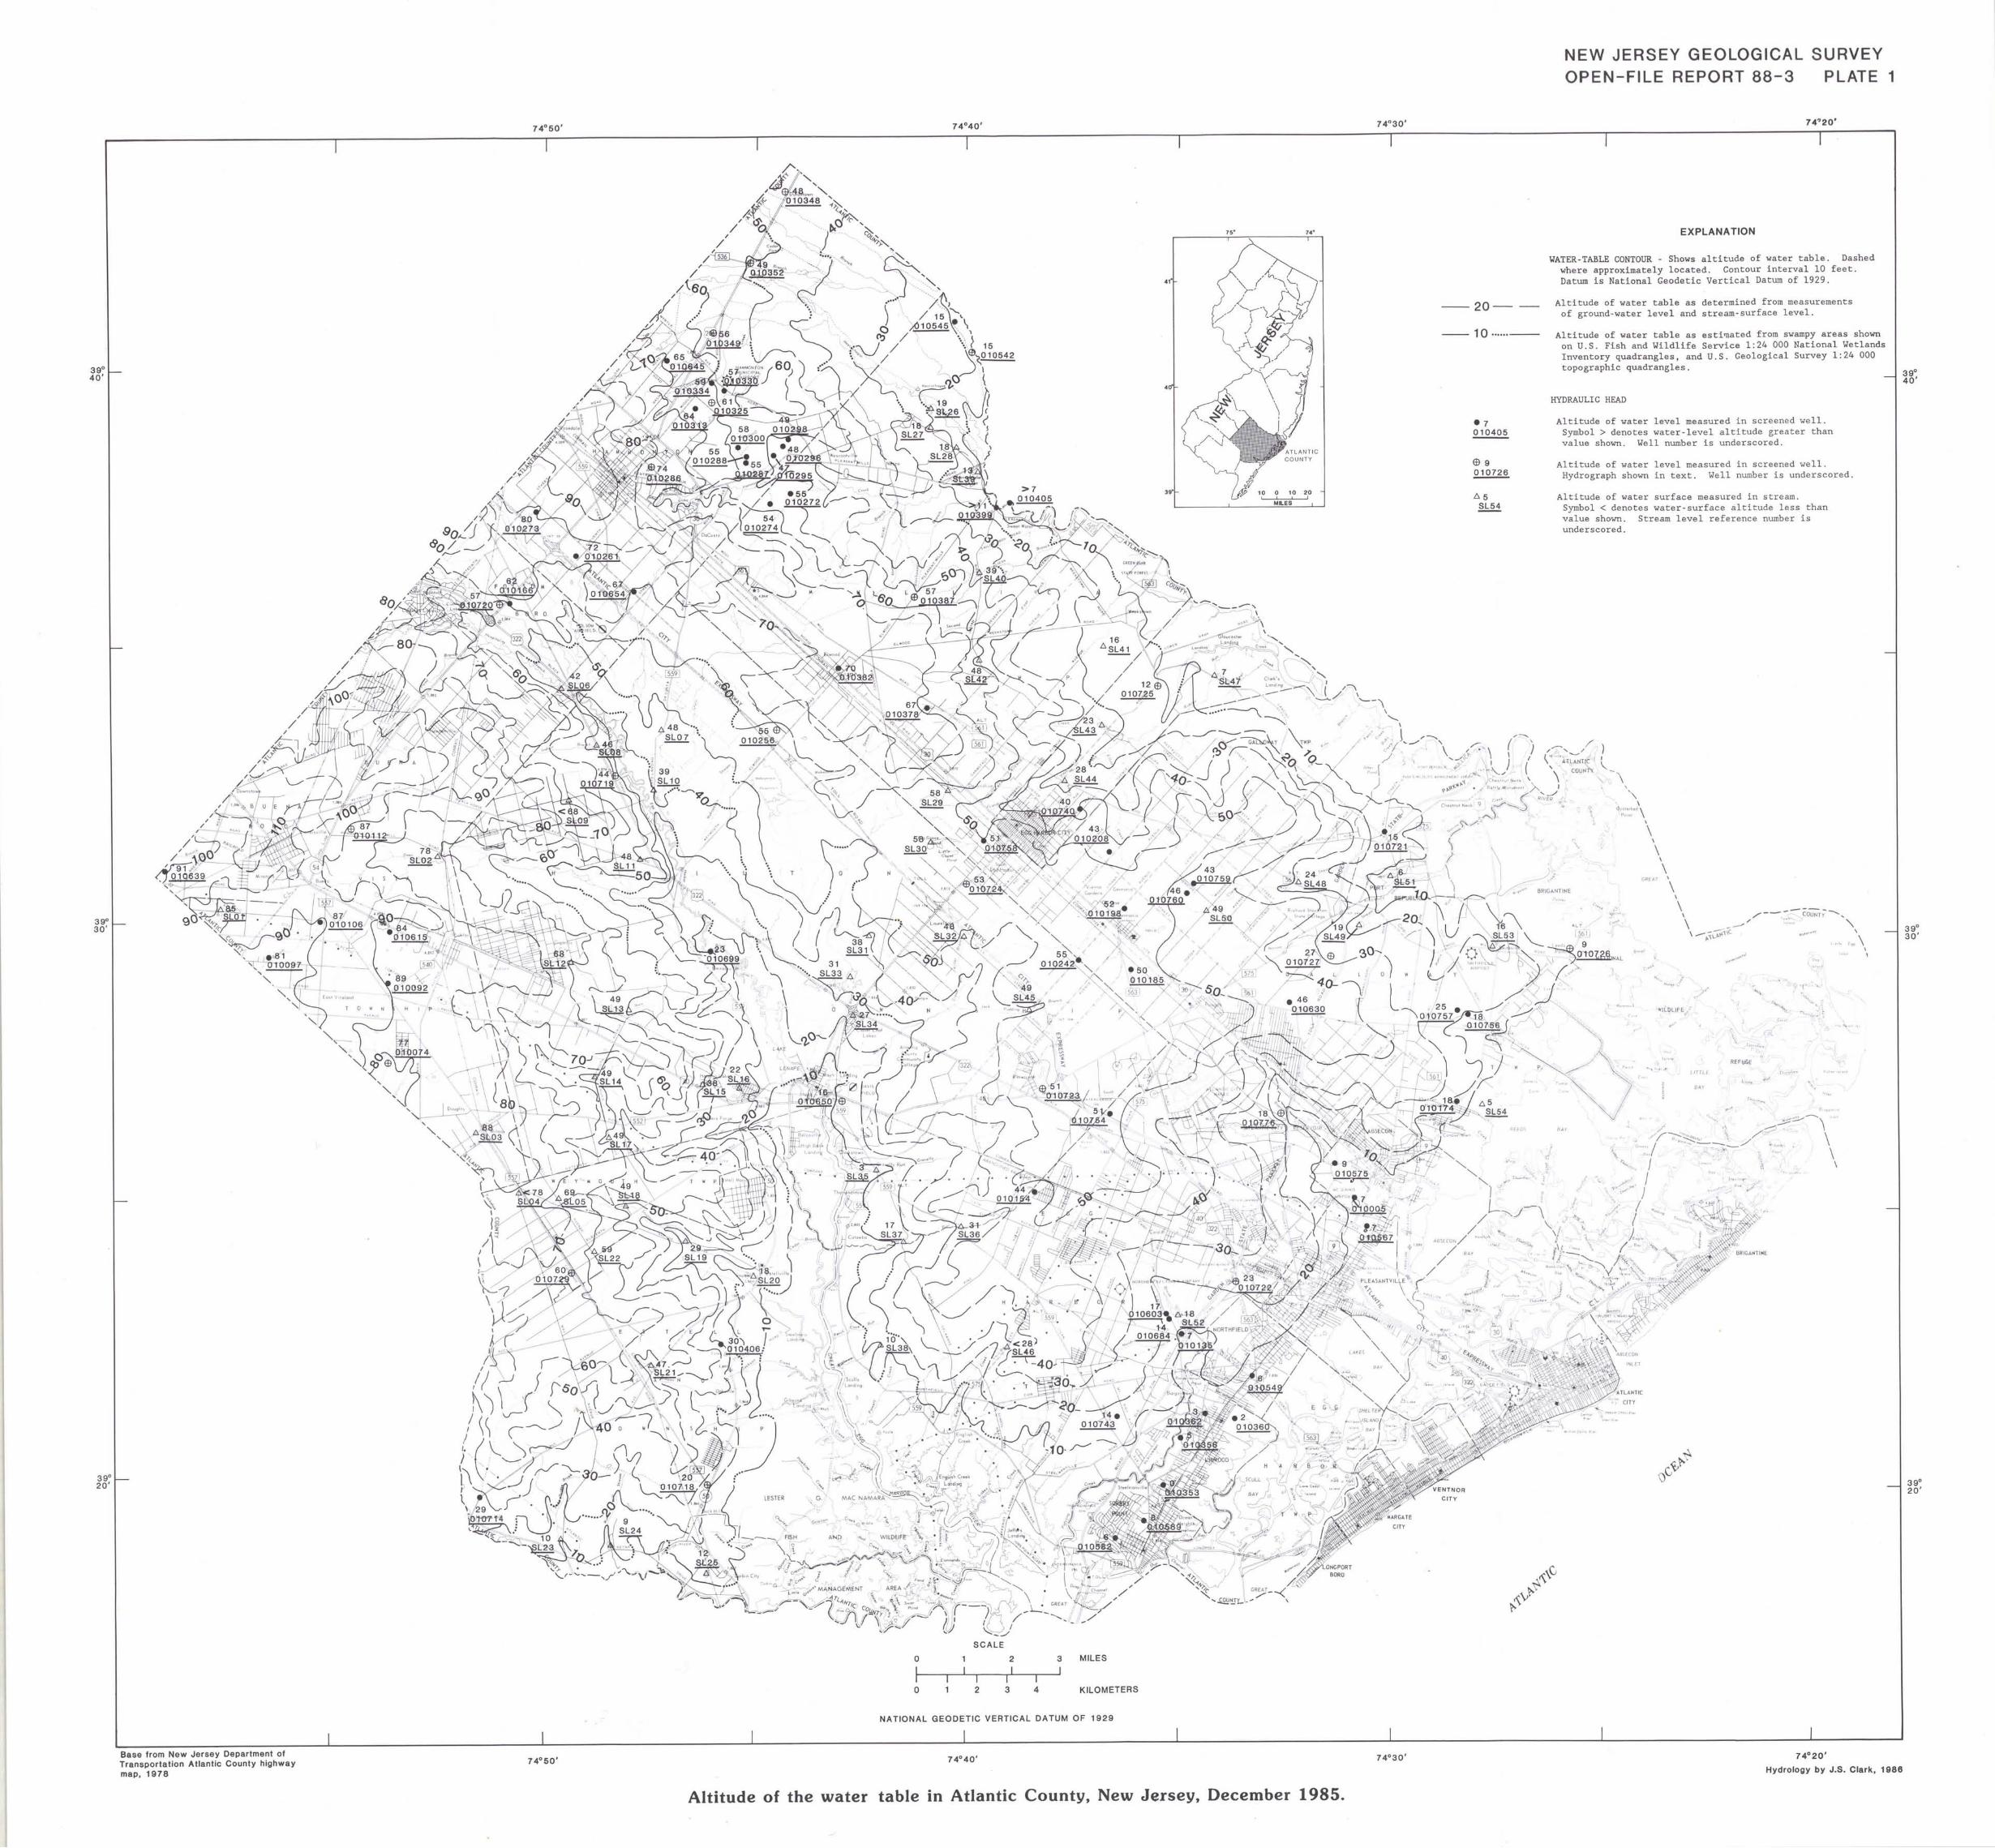
Plate i shows the altitude of the water table in Atlantic County inDecember 1985. The water-table contours are based on water-level
measurements made in 83 wells and 54 streams. In addition to water-level
data, table 2 lists information on owner, location, land-surface altitude,
and depth of the wells measured. Table 3 presents data on location andwater-surface elevation of the streams measured.
The water table in Atlantic County is the upper surface of the ground-
water reservoir in the Kirkwood-Cohansey aquifer system. The shape of this
surface depends primarily on aquifer hydraulic properties, the location of
recharge and discharge areas, and the magnitude of the recharge and
discharge fluxes. In unstressed ground-water systems, the water table
generally is a subdued replica of the land-surface topography. Commonly,
the altitude of the water table is highest under topographic highs, andlowest under topographic lows, where intersections of the water table with
the land surface are manifested as streams, swamps, lakes, and ponds. In
i0

Table 2.--Water-level data for wells screened in the Kirkwoed-Cohansey aquifer system in Atlantic
County, New Jersey, Decengoer 1985
DEPTH DATEALTITUDE DEPTH TO OFOF LAND OF HYDRAULIC WATER WATER"
WELL LATITUDE LONGITUDE SURFACE WELL HEAD 1 TABLE LEVELNUMBER OUNER (DEGREES) (DEGREES) (FEET) 1 (FEET) 2 (FEET) (FEET) 2 MEASUREMENT
010005 ATLANTIC CITY MUA 392511 743052 8 210 7 0.64 12/11/85010074 LEVAR], NICK 392731 745305 80 194 77 3.24 12/11185010092 CASAZZA, L 392857 745337 98 90 89 8.96 12/11/85010097 SIKKING BROS 392925 745629 82 75 81 0.81 12/11/85010106 LEVARI, PETER JR 393003 745513 94 98 87 7.32 12/11/85
010112 PUZZUTILLO, C 393141 745428 93 24 87 5.68 12/10/85010135 NJ WATER CO 392244 743455 20 127 7 12.50 12/10/85010137 TUBOLO, CARMAN 392248 743544 35 146 19 15.84 12/09/85010138 NJ WATER CO 392254 743434 15 123 4 10.50 12/10/85010154 S JERSEY GAS CO 392515 743824 55 157 44 10.69 12/11/85
010166 INGEMI, H 393548 745048 69 70 62 7.06 12/10/85010174 SEAVIEW C C 392653 742825 35 232 18 16.52 12/13/85010175 SEAV[EW C C 392702 742826 49 250 14 35.10 12/11165010177 SEAVIEW C C 392659 742823 40 253 -6 46.38 12/11185010185 LENOX INC 392919 743605 66 173 50 16.04 12/11/85
010198 SOHN, EMMA 393025 743615 67 136 52 14.91 12/12/85010208 KERTZ, JOHN 393123 743638 44 63 43 1.13 12/12/85010242 EATON, BRIT 392927 743722 64 43 55 8.65 12/10/85010256 SCNOLLER BROS 393333 744424 93 275 55 37.47 12/11/85010261 MORTELLITE, G 393639 744915 77 99 72 4.99 12/12/85
010272 BERTINO, JOHN 393746 744413 60 62 55 4.80 12/10/85010273 JACOBS, SALVATORE 393728 745008 85 101 80 4.56 12/10/85010274 BERTINO, JOHN 393738 744437 64 86 54 10.26 12/10/85010286 BROWN, JAMES 393815 744728 87 100 74 13.11 12/09/85010287 DERTINO, JOHN 393823 744515 57 60 55 1.59 12/10/85
010288 BERTINO, JOHN 393828 744519 57 58 55 1.85 12/10/85010295 BERTINO 8ROS 393835 744435 51 60 47 4.01 12/10/85010296 BERTINO DBOS 393842 744422 55 58 48 7.10 12/10/85010298 BRIDGE AVE FARM 393845 744414 58 120 49 9.30 12/10/85010300 BERTINO, JOHN 393837 744526 60 77 58 1.85 12/10/85
010313 COLUMBIA FARMS 393918 744624 66 65 64 2.44 12/09/85010325 COLUMBIA FARMS 393927 744602 62 65 61 2oD2 12/09/85010330 COLUMBIA FARMS 393943 744548 60 60 57 2.80 12/09/85010334 COLUMBIA FARMS 393950 744601 61 60 59 2.07 12/09/85010348 STATE OF NJ 394316 744415 50 15 48 2.36 12/09/85
010349 STATE OF HJ 394041 744604 58 150 56 2.52 12/09/85010352 STATE OF HJ 394156 744508 53 25 49 4.13 12/09/85010353 NJ WATER CO 392001 743522 10 71 0 10.44 12/10/85010356 PRUDENTIAL INS 392053 743455 10 258 5 4.56 12/11/85010360 LINtY:X30C C 392113 743341 20 165 2 18.48 12/11/85
010362 NJ WATER CO 392119 743424 17 165 3 14.14 12/10/85010378 FRANCESCHINI, R 393359 744056 75 176 67 8.39 12/10/85010382 MULLICA TWP 393441 744303 94 154 70 24.10 12/10/85010387 RAMBERG, RALPH 393557 744114 63 136 57 5.89 12/10/85010399 BIRDSALL, CLYDE 393736 743916 10 95 >11 <0 12/09/85
010405 PLSNT MILLS COMMH 393743 743859 5 67 >7 <0 12/09/85010542 US GEOL SURVEY 394028 744000 21 76 15 5.66 12/10/85010545 US GEOL SURVEY 394046 744010 20 23 15 5.30 12/10/85010549 NJ WATER CO 392157 743317 24 152 6 18.23 12/10/85010567 ATLANTIC CITY MUA 392440 743035 7 208 7 0.52 12/11/85
010575 ATLANTIC CITY tJO 392548 743119 9 195 9 0.35 12/11/85010582 NJ WATER CO 391906 743629 17 99 6 11.47 12/10/85010589 NJ WATER CO 391924 743550 22 159 8 16.37 12/10/85010603 NJ WATER CO 392304 743515 26 95 17 8.83 12/tD/85010615 GRECO, JOSEPH 392954 745334 100 IOD 84 15.58 12/11/85
010630 ATL C MEDICAL 392841 743225 68 176 46 21.70 12/13/85010639 VAL, PETER 393059 745850 100 160 91 8.88 12/10/85010645 LA MONACA, MUGH 394007 744726 71 90 65 5.79 12110/85010650 HAMILTON TWP lid 392653 744254 19 380 16 3.34 12/10/85010654 kIJILLERM]R, EDWARD 393600 744750 74 120 67 7.49 12/10165
iI

Table 2.--Water-level data for welts screened in the Kirkwood-Cohansey aquifer system in Atlantic
County, New Jersey, December 1985--Continued
DEPTH DATEALTITUDE DEPTH TO OFOF LAND OF HYDRAULIC WATER WATER"
WELL LATITUDE LONGITUDE SURFACE WELL HEAD TABLE LEVELNUMOER OWNER _DEGREES_ (DEGREES) (FEET) 1 (FEET_2 (FEET) 1 (FEET) 2 MEASUREMENT
010684 NJ WATER CO 392302 743515 24 130 14 10.03 12/10/85010699 US GEOL SURVEY 392933 744604 40 160 23 17.26 12/11/85010714 US GEOL SURVEY 391946 745125 41 73 27 14.03 12/10/85010718 ,US GEOL SURVEY 391957 744657 33 26 20 12.60 12/10/85010719 US GEOL SURVEY 393241 744818 67 38 44 23.28 12/10/85
010720 US GEOL SURVEY 393549 745059 65 22 57 5.72 12/10/85010721 US GEOL SURVEY 393145 743009 30 25 15 15.03 12/11/85010722 US GEOL SURVEY 392339 743337 42 36 23 19.42 12/10/85010723 US GEOL SURVEY 392704 743818 75 41 51 24.10 12/11/85010724 US GEOL SURVEY 393049 743958 61 23 53 8.22 12/11/85
010725 US GEOL SURVEY 393418 743537 20 23 12 7.60 12/11/85010726 US GEOL SURVEY 392938 742543 29 31 9 19.58 12/11/85010727 US GEOL SURVEY 392931 743125 40 22 27 12.58 12/11/85010729 US GEOL SURVEY 392346 744916 72 31 60 11.82 12/10/85010740 EGG HARBOR CITY 393210 743717 41 25 40 21.10 12/12/85
010743 BROWNINGFERRIS CO 392133 743641 30 40 14 15.75 12/11/85010754 WINZINGER, ROBERT 392640 743715 72 32 51 21.10 12/12/85010756 GALLOWAY TWP 392830 742812 30 34 18 11.82 12/11/85010757 GALLOWAy TWP 392834 742826 41 32 25 16.23 12/11/85010758 GALLOWAY TWP 393139 743935 53 9 51 1.91 12/12/85
010759 GALLOWAY TWP 393050 743441 55 19 43 11.88 12/12/85010760 GALLOWAY TWP 393047 743443 54 17 46 8.46 12/12/85010776 ATLANTIC CITY MUA 392639 743232 38 93 18 20.47 12/11/85
Notes: 1Datum is see level
2Datum is tand surface
i2
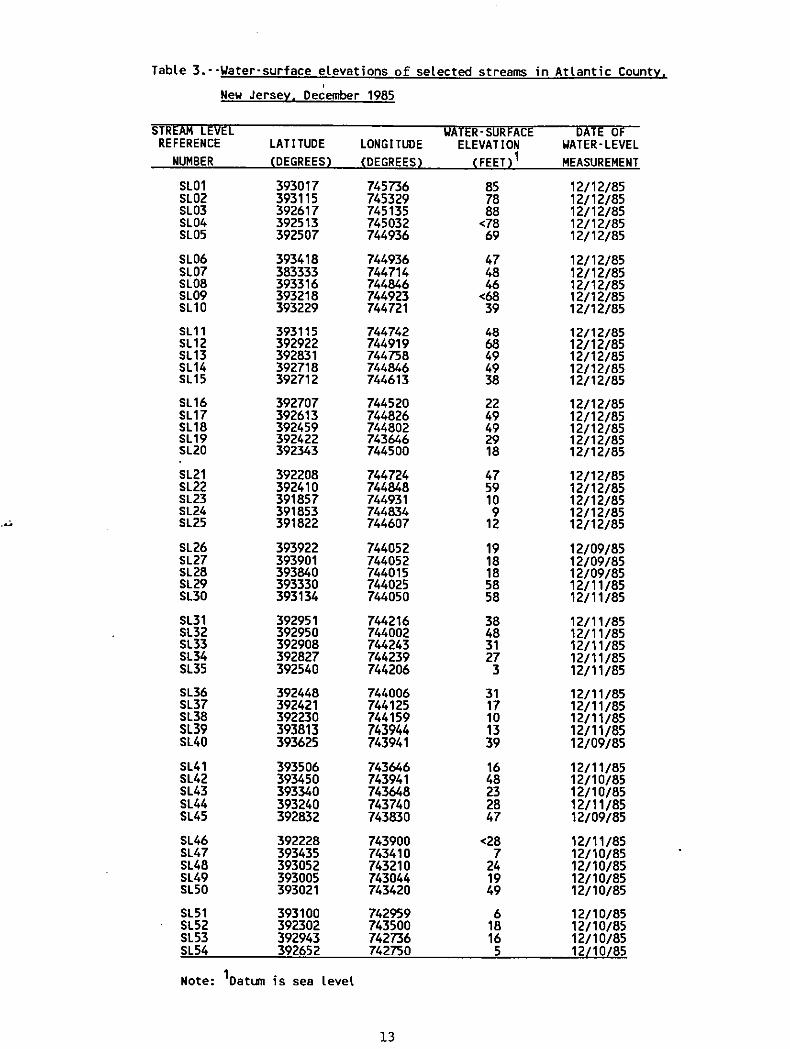
Tabte 3.--Water-surface etevations of setected streams in Attantic County,=
New Jersey. December 1985
STREAMLEVEL WATER-SURFACE DATE OFREFERENCE LATITUDE LONGITUDE ELEVATION WATER-LEVEL
NUMBER (DEGREES) _DEGREES_ (FEET) 1 MEASUREMENT
BL01 393017 745736 85 12/12/85BL02 393115 745329 78 12/12/85SL03 392617 745135 88 12/12/85SL04 392513 745032 <78 12/12/85SL05 392507 744936 69 12/12/85
SL06 393418 744936 47 12/12/85SL07 383333 744714 48 12/12/85SL08 393316 744846 46 12/12/85SL09 393218 744923 <68 12/12/85$LI0 393229 744721 39 12/12/85
SL11 393115 744742 48 12/12/85SL12 392922 744919 68 12/12/85SL13 392831 744758 49 12/12/85BL14 392718 744846 49 12/12/85SL15 392712 744613 38 12/12/85
B116 392707 744520 22 12/12/85BL17 392613 744826 49 12/12/85BL18 392459 744802 49 12/12/85SL19 392422 743646 29 12/12/85SL2O 392343 744500 18 12/12/85
SL21 392208 744724 47 12/12/85$L22 392410 744848 59 12/12/85SL23 391857 744931 10 12/12/85SL24 391853 744834 9 12/12/85BL25 391822 744607 12 12/12/85
5L26 393922 744052 19 12/09/85SL27 393901 744052 18 12/09/85SL28 393840 744015 18 12/09/85SL29 393330 744025 58 12/11/85SL30 393134 744050 58 12/11/85
SL31 392951 744216 38 12/11/855L32 392950 744002 48 12/11/85SL33 392908 744243 31 12/11/85SL34 392827 744239 27 12/11/85SL35 392540 744206 3 12/11/85
SL36 392448 744006 31 12/11/85SL37 392421 744125 17 12/11/85SL38 392230 744159 10 12/11/858L39 393813 743944 13 12/11/85SL40 393625 743941 39 12/09/85
SL41 393506 743646 16 12/11/85SL42 393450 743941 48 12/10/85SL43 393340 743648 23 12/10/85S144 393240 743740 28 12/11/858L45 392832 743830 47 12/09/85
$L46 392228 743900 <28 12/11/85BL47 393435 743410 7 12/10/85SL48 393052 743210 24 12/10/85SL49 393005 743044 19 12/10/85SL50 393021 743420 49 12/10/85
SL51 393100 742959 6 12/10/85SL52 392302 743500 18 12/10/85SL53 392943 742736 16 12/10/85SL54 392652 742750 5 12/10/85
Note: IDatum is sea [eve(
I3

December 1985_ at the time of the measurements, the water table in the
Kirkwood-Cohansey aquifer system was recovering gradually from its annual
lowest level (during September and October, on the average) toward its
annual highest level (during March and April), Accordingly, the water-table
map represents conditions intermediate between these two extremes.
The water-table map of Atlantic County was prepared by contouring
primarily to measured water levels and by considering the distance of a
particular measuring site from principal discharge areas. The topographic
contours were used to establish the general shape and placement of the
water-table contours. In several areas, contours of the water table were
estimated by considering the boundaries of swamps. These boundaries weredetermined from the most recent editions of the U.S. Fish and Wildlife
Service 7h-minute National Wetlands Inventory quadrangles and the U.S.
Geological Survey 7h-minute topographic quadrangles. The placement of the
water-table contours is such that, in areas not affected materially by
pumping, water-table levels can be expected to be accurate to within one-half of the contour interval.
Except where diverted by wells, water in the Kirkwood-Cohansey aquifer
system flows naturally from recharge areas toward discharge areas. A
recharge area is that part of the flow system in which the net saturated
flow of ground water is directed away from the water table. In a recharge
area, there is a downward component to the direction of shallow ground-water
flow. For example, data on water-table levels in clustered shallow
observation wells, finished at various depths at the Atlantic C{ty Airport
(plate i), indicate significant components of downward flow. A discharge
area is that part of the flow system in which the net saturated flow of
ground water is directed toward the water table. In a discharge area, there
is an upward component to the direction of shallow ground-water flow. For
example, water-table levels in the discharge area along the Mullica River
near Sweetwater (plate i) indicate substantial upward-flow components, and
deeper wells in this area flow freely throughout the year. The local
hydrogeologic framework also controls to some degree the location of areas
in which flowing wells occur. In this report, water levels in the Kirkwood-
Cohansey aquifer system are assumed to represent points on the regional
water table. No attempt has been made to delineate areas of significantvertical flow.
Ground water flows from regions of higher head to regions of lower
head, in a direction that is perpendicular to the water-table contours. In
the central and western parts of Atlantic County, regional flow in the
Kirkwood-Cohansey aquifer system mostly is toward the Great Egg Harbor
River. Water-table gradients commonly range from 20 to 40 ft/mi (feet per
mile) in the western parts of this river basin and from 15 to 20 ft/mi in
the eastern parts. In unstressed areas, these gradients are controlled
chiefly by the slope of the land surface. Regional flow in the northern
phrt of the county generally is toward the Mullica River. Gradients in this
basin are on the order of 20 to 50 ft/mi. Regional ground-water flow in the
eastern part of the county is toward tidal streams and marshes; gradients in
this area are about 5 to 20 ft/mi.
14

Depth to Water Table, December 1985
Plate 2 shows depths to the water table in Atlantic County in December
1985. This map was prepared by discretizing with a square grid (each grid
cell encompassed about 0.25 mi =) the water-table and topographic-contour
maps of Atlantic County. An average value of water-table and land-surface
altitude was estimated for each grid cell. The difference between these two
values, the depth to the water table, was then computed and contoured
manually. Additional control for contouring was provided by water-level
measurements in 83 wells throughout the county, surface-water features, and
topography.
Depths to the water table range from 0 ft in swamps and along streamchannels to more than 25 ft in areas of high topographic relief or where the
water table has been lowered by pumping. In swampy, low-lying, and forestedparts of the county, the water table generally is shallow. Such areas
usually are undeveloped and are not affected by pumping. Localities where
the land surface is higher tend to be more developed and support a largerpopulation. In several developed areas, such as Hammonton, Absecon,
Pleasantville, and Somers Point (locations shown on plate 2), withdrawals
for public supply from the Kirkwood-Cohansey aquifer system have caused the
water table to decline, resulting in a greater depth to the water table. In
agricultural areas, mostly in the western part of Atlantic County,
withdrawals for irrigation cease by autumn and water levels begin to recover
gradually. The recovery period generally lasts until early spring.
Accordingly, plate 2 represents conditions intermediate between maximum andminimum depth to the water table.
Water-Table Fluctuations
Hydrographs of 22 wells (figs. 3-13) illustrate water-table
fluctuations in various parts of Atlantic County. These fluctuations are
caused mainly by changes in ground-water storage, which arise because ofimbalances between recharge and discharge. Natural changes in storage
generally give rise to gradual changes in water levels. The Kirkwood-
Cohansey aquifer system is recharged chiefly by precipitation; peaks on the
hydrographs of daily minimum water levels (figs. 3A and B) reflect such
events. Water from the unconfined aquifer system discharges to surface-
water bodies, to deeper aquifers, and to the atmosphere by evaporation and
transpiration. Water also is withdrawn from the aquifer system through
wells. The hydrographs of daily minimum and once-monthly water levels
(figures 3-13) show that the water table recedes during summer and autumn
when discharge of water from the aquifer system generally exceeds recharge,
and recovers during winter and spring when recharge exceeds discharge. The
maximum observed annual water-table fluctuation is about 5 ft (fig. 13B); on
the average, however, annual fluctuations commonly are less than 4 ft.
15

A
57.0 I I I L I t _ I _ I I I I 36.0I--<tOLU
56.5 36.5 (3uJ <t=> u.uJ CE
<_ COLU 56.0 37.0 O03 Z03 <E
OV- 55.5 37.5 --J<_a LU
P: I.-UJ LULU LULL 54.5 38.0 LL
z z_
<t UJLU =>3: 55.0 38.5 uJ
.J
CcLUF-
54.0 , I 1 I I q I I 39.0
SEPT OCT NOV DEC I JAN FEE] MAR APR MAY JUNE JULY AUG SEPT OCTI
1985 1986
B
16.0 i i I i I I i t i t i i i 4.0 :EF-<_a
15.5 4.6 UJ"J (3LU=> <CLLUJ Q:
15.0 _ /_ 5.0 COLu60 o7co h i .,¢
i 14.5 5.5O.-I
E3 UJ14.0 ./_ 6.0 rn
W 7 I.-
LU LULL LU
LL
_Z 13,5 Hissing Record 6.5 Zd -tu w
w13.0 7.0 -J
, =kU1--
12.5 I I I I= I I I I I I I I I 7.5
SEPT OCT NOV DEC [ JAN FEB MAR APR MAY JUNE JULY AUG SEPT OCTI
1985 1986
Figure 3.--Hydrographs of daily minimum water levels for
selected wells in the Kirkwood-Cohansey aquifersystem, 1985-86: (A) 010256: (B) 010542.
16

A
80.0 I i I I _ I I I I i I I I i j I I I 0.0 F-
• Water-level measurement. Levels between measurements inferred. 0-J Ww 0> 79.0 <uJ 1.0 u--J I_
LU 03CO
203 78.0 2.0 <:
i--<: Oo LU
P: 77.0 3,0 mLULU I'-LL UJ
W_z u_o" z_<¢ 76.0 4.0 __LU uJ
IJJ-J
CCILl
75.0 I I I I I I zl J I I I I I I I I I I 5.0 D--JUNE JULY AUG SEPT OCT NOV DECIJ/_N FEB MAR APR MAY JUNE JULY AUG SEPT OCT NOV DEC <_
I1985 1986
90.0 I I I I I I I I ] I I I I I I I I ] 3.0 I--<_
• Water-level measurement. Levels between measurements inferred, a.j ILlUJ 0:> <:lU 89.0 4.0 u-
<E 03W03 a
Z
88.0 5.o <,
t-- 0
o tu
87.0 6.0 mLU I--LU UJLL LU
z u_z
< 86.0 7.0 --_LU UJ-I- _>
UJ.-I(3CILl
85.0 I I I I I I I I I 1 I I I I I I 1 8.0 V-
JUNE JULY AUG SEPT OCT NOV DEC JAN FEB MAR APR MAY JUNE JULY AUG SEPT OCT NOV DEC
1985 1986
Figure A.--Hydrographs of monthly water levels for selected
wells in the Kirkwood-Cohansey aquifer system,
1985-86: (A) 010074; (B) 010112.
17

A :_:3
77.0 I I I I I I I I I I I I I I I I I I I 10.0 I-
o
.j • Water-level measurement. Levels between measurements inferred. LULU 0
w 76.0 11,0 u..
IJJ co¢o oo3 z-- <{3; 75.0 12.0 .,J
I.-< 0E3 "JLu
IZ 74.0 mw 13.0 i.-u.i uJt,L UJZ _"-- Zd -< 73.0 14.0 JUJ uJ
I%:LU
72.0 I I I I I I I =] I I I I I ] I I I f I 15.0 }.-MAY JUNEJULY AUG SEPT OCT NOV DECIJAN FEB MAR APR MAY JUNEJULY AUG SEPT OCT NOV DEC <_
I1985 1986
B
62.0 I I I I I I I I I I I I I I I I L I I 0.0
0
.J OWater-level measurement. Levels between measurements inferred, wuJ O
uJ 61,0 1.0 u.-J 03
uJ cOcO O
eo.o 2.0 <,
< 0D "JLU
59.0 3.0 03uJ I--LU LUL_. W
z u.Z
58.0< 4.0 __uJ LUI ::>
LU..J
n-LU
57.0 t I I I I I I =t I I I I I I I I I I I 5.0 I--MAY JUNE JULY AUG SEPT OCT NOV OECIJAN FEB MAR APR MAY JUNE JULY AUG SEPT OCT NOV DEC <
I1985 1986
Figure 5.--Hydrographs of monthly water levels for selected
wells in the Kirkwood-Cohansey aquifer system,
1985-86: (A) 010286; (B) 010325.
18

50.0 I I I I I I 1 I I I I I I I I I I I I 0.0 I--<C
.j WUJ • Water-level measurement. Levels between measurements inferred. 0> <Cw 49.0 1.0 LL.U n"
< COLUCO _3
_ 48.0 2.0 _
b- 0
D w
:-: 47.0 _ 3.0
uJ _ I,-
LU I,ULL LU
LLZ- zO 46.0 4,0 "<: .JLU v _" ILl
LU.-J
45.0 I I I I I I I I I I I I I I I I I I I 5.0 uJ
MAY JUNEJULY AUG SEPT OCT NOV DEC JAN FEB MAR APR MAY JUNEJULY AUGSEPT OCT NOV DEC <_
1985 1986
B 3;
58.0 I I I L I I I I I I I I _ I I I I i I 0.0 <:
LU-u e Water-level measurement, Levels between measurements inferred. '0UJ:> <CuJ 57.0 1.0 u._j 0:
cOW
E3Z
-- 56.0 _ 2.0 .J'5
I- 0<C -J0 w
¢0
55.0 • 3.0 I--
LU "_ LLI
LU ILlt.l,. LL
_z • z
C_ 54.0 4.0 J<c LUUJ >
UJ..J
n"LU
53.0 I I I I I I I ,I I I J I I I [ I [ I I 5.0 I-MAY JUNEJULY AUG SEPT OCT NOV DECIJAN FEB MAR APR MAY JUNEJULY AUG SEPT OCT NOV OEC <_
I1985 1986
Figure 6.--Hydrographs of monthly water levels for selected
wells in the Kirkwood-Cohansey aquifer system,
1985-86: (A) 010348; (B) 0103A9.
19

5 1.0 I I I i _ i I _ i I _ I I I i i t I I 2.0 I-<a
.u UJUJ • Water-level measurement. Levels between measurements inferred. 0
w 50.0 3.0 u.
LU _OCOm z-- <
49.0 4.0 .u
I-- 0
C_ I11
48.0 5.0 mW I..-UJ I11u. LU
LL
z_ z47.0 6.0 j
tuI11 >"1" LU
.-I
46.0 I I I f ", I L I I f L I I I I I I I I [ 7.0 LUMAY JUNEJULY AUG SEPT OCT NOV DEC JAN FEB MAR APR MAY JUNEJULY AUGSEPT OCT NOV DEC <_
1985 1986
B 3;
80.0 i I I I I I i i I I I I I I I I I I I 3.0 I-,-CJt.u
-u • Water-level measurement. Levels between measurements inferred. 0LU' :> 59.5 3.5 <:
LU L_.n-
'< COLUO
CO 59.0 4.0 Z<
_; .-J
_ 0< 58.5 4.5 .-ro w
w i--w wu. 58.0 5.0 uJ
z u.-6 j< 57.5 5.5 uJtuZ >_J
,.J0:LU
57.0 I I I I I I I ml I I I I I I t I I I I 6.0 V-MAY JUNEJULY AUG SEPT OCT NOV DEC _JAn FEB MAR APR MAY JUNEJULY AUG SEPT OCT NOV DEC <_
I1985 1986
Figure 7.--Hydrographs of monthly water levels for selected
wells in the Kirkwood-Cohansey aquifer system,1985-86: (A) 010352; (B) 010387.
2O

1 7.0 2.0 F-I I [ I I I I i I I I I I I I I I I I <_
_3
.j LUuJ eWater-leve] measurement. Levels between measurements inferred. 0> 16.5 2.5 ,,<LU £_-J< 03W _3O_ 16.0 _a 3.0 Z
03 _ <C
_- 15.5 IX 3.5 O-J
Q _ LU03
LU LULU 15.0 4.0 LUU. U.
_z za" .J
14.5 4.5 ww >"F UJ
.J
14.0 } I I I I I I I I I I I I L I I I I I 5.0 UJMAY JUNE JULY AUG SEPT OCT NOV DEC JAN FEB MAR APR MAY JUNE JULY AUG SEPT OCT NOV DEC _
1985 1986
24.0 i I I i i i I i I I i i 9.0 F-£3LU
-J a Water-level measurement. Levels between measurements inferred. 0uJ <:> LLLU 23.0 10.0 a:
W " _m Z
m 22.0 1 1,0 -J
F- O<C -JC3 UJ03P: 21.0 12.0 __UJ UJuJ LUu- LL
_z _zd 20.0 13.0 ._"<C uJuJ >
uJ.-I
rrL.U
19.0 ,I I I I I I I I I I I I 14.0 F-DEC I JAN FEB MAR APR MAY JUNE JULY AUG SEPT OCT NOV DEC <[
1985 _ 1986
Figure 8,--Hydrographs of monthly water levels for selectedwells in the Kirkwood-Cohansey aquifer system,
1985-86: (A) 010650; (B) 010718.
21

A47.0 I I I I I I I I 1 I I I 20.0
,<0LU
-I • Water-level measurement. Levels between measurements inferred. OI.u> ,<w 46.0 21.0 u.j Ir
:D< cOILlCO 0
Z
¢n 45.0 22.0 -J
V.- 0_: .jE3 I.U
I'E 44.0 23.0 mLU I--LU LULL LU
LLZ--- Z
<C 43.0 24.0 .3uJ uJ3: >
IJJ.J(ZuJ
42.0 ,I I I I f I I I I I I I 25.0DEC I JAN FEB MAR APR MAY JUNE JULY AUG SEPT OCT NOV DEC <_
I1985 1986
D- i59.0 I I I I I I I I i I I I 4.0 .<
ILl
_j 58.5 • Water-level measurement. Levels between measarements inferred. 4.5 0u.
58.0, /_ D '
5.0 U) '"..0 ct ,
Z '
¢n 57.5 _.._ _ 5.5 '<
-J
57.0 06.0 ._1o uJ
56.5 6.5ILl
Z- 56.0 7.0 z
d .j-< ww >:z: 55.5 7.5 uJ
..J
iz55.0 I I I I I I I I I I I I 8.0 uJ
DEC JAN FEB MAR APR MAY JUNE JULY AUG SEPT OCT NOV DEC <
1985 1986
Figure 9.--Hydrographs of monthly water levels for selected
wells in the Kirkwood-Cohansey aquifer system,
1985-86: (A) 010719; (B) 010720.
22

A _E
26.0 _ f i i i i _ i i i i i 16.0 i-<c
LU"J • Water-level measurement. Levels between measurements inferred.uJ ¢)
uJ 25.0 17,0 LL.J rr
"¢ COLUCO QCO Z-- <t
24,0 18.0 "J
_ 0
o ulal
I-: 23.0 19.0 I--LULU UJLZ. LU
Z _.U"a C C<t 22.0 20,0 "_"LU UJ
LU.J
LU21.0 ,I I I I I I I I I I I I 21.0 C--
DEC I JAN FEE MAR APR MAY JUNE JULY AUG SEPT OCT NOV DECI
1985 1986
B :z
53.0 I i I i I i I I I I I I 22.0<[
.j uJuJ • Water-level measurement. Levels between measurements inferred. 0::> <_w 52.0 23.0 u,.J
<C COUJCO 0
Z-- <:CO 51.0 24.0 .._
P" 0
0 uJ
50.0 25.0 COuJ I--LU UJLL UJ
LLZ- _zt_
< 49.0 26.0 "J"uJ LU:Z :>
LU.J
?rLU
48.0 , I I I I I I I L 27.0 I--
DEC I JAN FEB MAR APR MAY JUNE JULY AUG 0EPT OCT NOV OECI1985 1986
Figure 10,--Hydrographs of monthly water levels for selected
wells in the Kirkwood-Cohansey aquifer system,
1985-86: (A) 010722; (B) 010723.
23

A
59.0 ] i t i i i i ] i i i i i 2.0
I E3
U.I"J 58.0 • Water-level measurement. Levels between measurements inferred. 3.0 'oLU>u/ (1_
< 57.0 4.0 ¢nLUZ
U) <[
:E 56.0 5.0_- O< -Jo uJ
55.0 6.0 p-uJ uJuJ LUEL LLZ 54.0 7.0 Z-.-=o j
LU[U-r 53.0 8,0 >uJ
.-i_E
52.0 I I I I I I I I I r [ I 9.0
DEC I JAN FEB MAR APR MAY JUNE JULY AUG SEPT OCT NOV DEC1985 1986
B :z
16.0 , I i i I L l I I i i I I 4.0 F-
_3uJ
"J • Water-level measurement. Levels between measurements inferred. 0UJ.> <:ELuJ 15.O 5.0.J .._<: U)uJm E3Z__ <"5 14.0 6.0 ..J
P- O<: -J
uJ
L_ 13.0 7.0 I-uJLU
EL Lz._" Z
Q< 12,0 8.0LU•"r >
UJ,-I
LU11.0 =1 I I I t I l I I I I I 9.0 I--
OEC I ,tAN FEe MAR APR MAY JUNE JUL_ Age SEPT OCT NOV OECI
1985 1956
Figure ll.--Hydrographs of monthly water levels for selected
wells in the Kirkwood-Cohansey aquifer system,
1985-86: (A) 010724; (B) 010725.
24

14.0 _ i ] J z i I 4 i i I i 15.0 k,-<c
.._1 LUuJ a Water-level measurement. Levels between measurements inferred. '0
,,-, <13.0 16.0 u..j r,-
"<' -- 03Z
-- 12.0 17.0 -J
a wm
11.0 8.01 I'-LU
u.
Z _Z
_" ,o.o 1o.o _"
uJ._1
9.0 I ! I I I I I I I I I I 20.0
DEC JAN FEB MAR APR MAY JUNE JULY AUG SEPT OCT NOV DEC
1985 1986
B :_
31.0 I I ) I I I I I I I I I 9.0 I--<Ea
_1 . ww •Water-level measurement. Levels between measurements inferred. '0
w 30.0 10.0 u...j Q:
<_ muJo_ E3
Z03 <c-- 29.0 11.0 ,-=
P" O
£3 uJ
28,0 12.0 P-LULU LUU. LUL_.
_z _zO'< 27,0 /e 13.0 -_
LU / LU_: ::>
UJ.-IO:IJJ
26.0 ,I I I I I I I I I I I I 14.0 v..DEC I JAN FEB MAR APR MAY JUNE JULY AUG SEPT OCT NOV DEC <_
I1985 1986
Figure 12,--Hydrographs of monthly water levels for selected
wells in the Kirkwood-Cohansey aquifer system,
1985-86: (A) 010726; (B) 010727.
25

A :_64.0 8.0
I I I I I I I I I l I I
Q
__ • Water-level measurement. Levels between measurements inferred. LUw 63.0 9.0 <c>' LLLU..j 0:'< COUJ
(:3CO 62.0 10.0 Z__ <
.-I:S
I- O<: 61.0 11.0Q LU
03
W UJ
u. 60.0 12.0 ,,uJ
z _z.-I
<C LUuJ 59.0 13.0 >,
W
58.0 I I I I I I I I I I I I 14.0 i-
I <DEC JAN FEB MAR APR MAY JUNE JULY AUG SEPT OCT NOV DEC
1985 1986
B23.0 I I I I I I I I I I I I I i I I i I i 15.0 i-<
o• Water-level measurement. Levels between measurements inferred, uJ
•.J 22.0 16.0LU <__> U-ILl
<: 21.0 17.0 COLUCO
zco 20.0 18.0 '<-- .--I
i- 0<c 19.0 19.0 ..J
uJizi
I-.: i.-w 18.0 20.0 wUJ UJU. LL
z z"_ 17.0 21.0 -a .<C _lLU IJJ
>.:3:16.0 22.0 W
,-J
ECtJJ
15.0 I I I I I I I ,I I I I I I I I I I I I 23.0 I--MAY JUNE JULY AUGaEPT OCT NOV DEC I JAN FEB MAR APR MAY JUNE JULY AUG $EPTOCT NOV DEC
I1985 1986
Figure 13.--Hydrographs of monthly water levels for selected
wells in the Kirkwood-Cohansey aquifer system,
1985-86: (A) 010729; (B) 010776.
26

Atlantic City 800-Foot Sand
Table 4 presents the watem-level data used to prepare the
potentiometric-surface maps of the 800-foot sand for April and September1986. Most of the water levels are for wells on the barrier islands in
Atlantic, Ocean, and Cape May Counties. Data for the two marine-observationwells also are included in this table; well 010710 is 5.3 mi offshore of
Atlantic City, and well 010711 is 1.9 mi offshore.
Contours on the potentiometric-surfaee maps were drawn manually,
compared to computer-generated contours, and then adjusted manually to
refine the representation of each surface. The computer-generated contours
were prepared by a universal-kriging algorithm. Kriging is a statistical
technique that furnishes unbiased estimates of parameter values (in this
case, water levels) over a region; these estimates are computed such that
the variance among values is minimized (Skrivan and Karlinger, 1980, p. 2).
Potentiometric Surface, April 1986
The map of the potentiometrie surface in April 1986 (plate 3a), which
represents conditions of annual minimum pumping stress on the 800-foot sand,
shows an elongated regional cone of depression that.extends from southern
Ocean County to southern Cape May County, and to more than 5.3 mi seaward of
Atlantic City. This cone is centered around Margate and Ventnor, Atlantic
County, where water levels were more than 70 ft below sea level. Withtransducers, the water level in marine well 010711 was measured at 65 ft
below sea level. Because of logistical problems, the level in marine well
010710 was not measured; however, in preparing the map, a water level of 50
ft below sea level was assumed. This value was estimated by considering
previously determined water-level gradients between the two wells, alongwith the water level measured in well 010711 in April 1986. The gradient in
September 1985 was 4.70 ft/mi, whereas the gradient in January 1986 was 3.82
ft/mi. Water levels in the localized cone of depression near Ship Bottom,
Ocean County, were more than 20 ft below sea level. The regional cone of
depression is shallowest in western parts of the study area, where water
levels were nearly 20 ft above sea level near Egg Harbor City, Atlantic
County.
Potentiometric gradients vary around the cone of depression because of
its elliptical shape. To the west of Margate and Ventnor, gradients were
approximately 5 ft/mi; to the north and east, 4 ft/mi; and to the south, 3.5
ft/mi. Maximum gradients in the localized cone of depression near Ship
Bottom were nearly 12 ft/mi.
Potentiometric Surface, September 1986
The map of the potentiometrie surface in September 1986 (plate 3b)
represents conditions of annual maximum pumping stress on the 800-foot sand.
Although the shape of the cone of depression is similar to the shape in
April 1986, the regional cone was much deeper in September. Near Margateand Ventnor, water levels were more than i00 ft below sea level, whereaswater levels in marine-observation wells 010711 and 010710 were measured at
84 ft and 68 ft, respectively, below sea level. Near Ship Bottom, water
27

Table 4.--Water-level data for wells screened in the Atlantic City 800-foot sand of the Kirkvo _--I
Formation, April and September= 1986
ALTITUDE DEPTH WATER WATER WATER-LEVELOF LAND OF LEVEL t LEVEL I CHANGE(FEET)
WELL LATITUDE LONGITUDE SURFACEI WELL p (FEET)" (FEET)" APRIL'SEPTNUMBER OWNER (DEGREES} (DECREES) {FEET}" (FEET)" APRIL 1986 SEPT 1986 1986
010015 PRESIDENT HOTEL 392058 742711 10 831 -63 -88 -25010037 ATLANTIC CITY WD 392152 742459 9 837 -60 -86 -26010039 BRIGANTINE WO 392329 742348 10 788 -51 -80 -29010040 BRIGANTINE WD 392342 742328 10 766 -51 -79 -28010041 BRIGANTINE gO 392451 742153 9 829 -54 -68 -14
010042 BRIGANTINE _ 392456 742121 10 788 -37 -59 -22010117 EGG HAR WTR WKS 393206 743836 40 432 18 17 -I010180 US GEOL SURVEY 392754 742701 30 570 -27 -37 -10010367 LONGPORT WD 391859 743122 10 800 -65 -92 -27010370 MARGATE CITY gO 391928 743055 10 804 -- -I01 --
010372 MARGATE CITY M) 391935 743058 10 800 -72 ....010376 MARGATE CITY WI) 392008 743017 10 791 -69 -I00 -31010578 US GEOL SURVEY 391826 743709 10 680 -44 -63 -19010593 VENTNOR CITY _ 392018 742945 9 790 -69 -99 -30010598 VENTNOR CITY WD 392032 742852 8 800 -82 -100 -18
010600 VENTNOR CITY WO 392045 742840 8 810 -68 -I01 -33010637 EGG HAR WTR WKS 393217 743823 40 428 17 15 -2010680 CARNIVAL CLUB 392120 742606 8 835 -64 -86 -22010682 RESORTS INTRNTL 392134 742521 10 840 -60 -87 -27010683 BRIGANTINE WD 392410 742227 20 775 -45 -67 -22
010702 US GEOL SURVEY 392032 743008 5 750 -74 -I00 -26010703 US GEOL SURVEY 392639 743232 30 570 -33 -43 -I0010704 US GEOL SURVEY 392232 742344 50 606 -27 -38 -11010706 US GEOL SURVEY 392933 743150 40 550_ -16 -22 -6010710 US GEOL SURVEY 391726 742221 -- 981 _ -50 -68 -18
010711 US GEOL SURVEY 391955 742507 -- 8353 -65 -84 -19090002 AVALON gl) 390420 744435 5 861 -46 -56 -10090004 AVALON WD 390528 744338 10 920 -37 -52 -15090008 AVALON WI) 390621 744248 10 925 -- -46 --090092 NJ WATER CO 390525 744851 15 791 -30 ....
090100 MIDDLE TWP WD 390647 744438 10 827 -34 -53 -19090106 NJ WATER CO 391343 743755 10 810 -39 -58 -19090109 NJ WATER CO 391535 743611 10 809 -47 -71 -24090110 NJ WATER CO 391604 743539 5 814 -55 -72 -17090116 NJ WATER CO 391638 743451 10 810 -57 -8] -26
090117 NJ WATER CO 391642 743447 10 798 "54 ....090121 NJ WATER CO 391649 743449 8 825 -51 -81 "30090122 NJ WATER CO 391710 743408 6 825 "48 -86 -38090124 NJ WATER CO 391712 743340 10 846 -92 --090125 NJ WATER CO 391726 743352 10 800 -59 ....
090126 SEA ISLE CITY WD 390747 744241 7 759 ,38 -55 -17090127 SEA ISLE CITY _D 390847 744200 10 830 "27 "52 -25090128 SEA ISLE CITY WD 390902 744153 7 870 -- -55 --090129 SEA ISLE CITY WD 390926 744131 10 861 -30 ....090132 STONE HARBORlid 390301 744545 10 _0 -29 -38 -9
090135 STONE HARBORWD 390323 744525 10 878 -30 ....090136 CORSONS INLET WC 391152 743927 10 834 -37 -55 -18090144 ATL CiTY ELEC 391703 743756 9 691 -46 -64 -18090148 ATL CITY ELEC 391707 743756 10 675 -49 -65 -16090161 E SHORE CNVLSO 390704 744750 16 654 -24 -35 -11
090166 STONE HARBORWO 390351 744504 5 860 -31 -50 -19090173 STONE HARBOR WO 390314 744532 10 862 -29 ....090185 US GEOL SURVEY 391621 744355 15 650 -27 -37 "10290009 BEACH HAVENWO 393346 741430 5 656 -23 -36 -13290012 BEACH HAVENWO 393346 741434 5 665 -- -34 --
290111 HARVEY CDRS gl) 394134 740832 10 500 -16 -38 -22290112 HARVEY CDRS gl) 394218 740808 10 493 -20 -34 -14290457 LONG BEACH WC 393510 741327 8 495 -18 -33 -15290461 LONG BEACH WC 393725 741150 9 615 -19 -38 -19290462 LITTLE EGG HMUA 393253 742308 10 564 -15 -23 -8
290464 LITTLE EGG HMUA 393428 742202 30 543 -8 -15 -7290544 SHIP BOTTOM WD 393839 741052 10 578 -26 -43 -17290549 SHIP BOTTOM _O 393848 741053 5 589 -25 -45 -20290557 STAFFORD TWP MUA 394042 741411 10 428 12 7 -5290560 SURF CITY WO 393938 741006 5 557 -25 ....
290564 TUCNERTONMUA 393610 742031 10 481 -2 -9 -7290597 TUCKERTON MUA 393610 742021 25 500 2 -6 "8290774 STAFFORD TWP MUA 394042 741411 10 484 14 I0 -4
Notes: 1Datum is sea level
2Datum is land surface, unless noted otherwise
3Datum is seal[Dot
28

levels were greater than 40 ft below sea level. In the vicinity of Egg
Harbor City, water levels remained essentially unchanged at about 20 ftabove sea level.
As the configuration of the potentiometric surface remains about the
same throughout the year, the general direction of ground-water flow remains
essentially unchanged. However, due to increased withdrawals during the
summer months, gradients increased to approximately 8 ft/mi to the west of
Margate and Ventnor and to 5 ft/mi on the north, east, and south. Near Ship
Bottom, gradients increased to a maximum of approximately 16 ft/mi. This
increase in gradient results in an increase in the rate of ground-water flowtoward pumping centers.
Potentiometric Change
The map of potentiometric change from April to September 1986 (plate
3c), shows the maximum water-level change in the Atlantic City 800-foot sandduring 1986. The map was prepared by discretizing with a square grid (each
grid cell encompassed about 2.5 mi =) the potentiometric-surfaee maps of
April and September 1986 (plates 3a and 3b, respectively), estimating the
water level at each grid node, and computing the value of change for each
node. The contours of equal potentiometric change were generated by krigingthese spatially discretized values. Computed values of change in 55 wellsmeasured both in April and September 1986 were used for additional control
and to refine the generalized contours.
The greatest potentiometric change occurs on the barrier islands in
Atlantic, Cape May, and Ocean Counties, due to increased ground-water
withdrawals associated with the summer tourist trade. In Margate, Ventnor,
and Ocean City, water levels declined about 30 ft. In marine wells 010711
and 010710, and at Ship Bottom, water levels declined nearly 20 ft. West of
the barrier islands, near the edge of the confining unit overlying the 800-
foot sand, withdrawals from the aquifer are relatively small and constant,
and there was no observable net potentiometric change between April andSeptember 1986.
Water-Level Fluctuations
Plate 3d shows hydrographs of six wells screened in the Atlantic City
800-foot sand in Atlantic and Cape May Counties. Each hydrograph depicts
I year of essentially continuous record for an individual well.
Water levels in the Atlantic City 800-foot sand fluctuate seasonally,
chiefly because of variations in ground-water withdrawals. An increase in
withdrawals during the warmer months causes water levels to decline. This
declining trend, which is greatest in coastal parts of the study area,
generally occurs from early spring until early autumn. Beginning in early
autumn and continuing into early spring, a reduction in withdrawals causeswater levels to recover. Data on withdrawals from the 800-foot sand
currently are not available for April and September 1986, the periods of
water-level measurement represented by plate 3. However, data for April and
September 1985 suggest that withdrawals in September are more than twice as
great as those in April (C.L. Quails, U.S. Geological Survey, writtencommun., 1987).
29
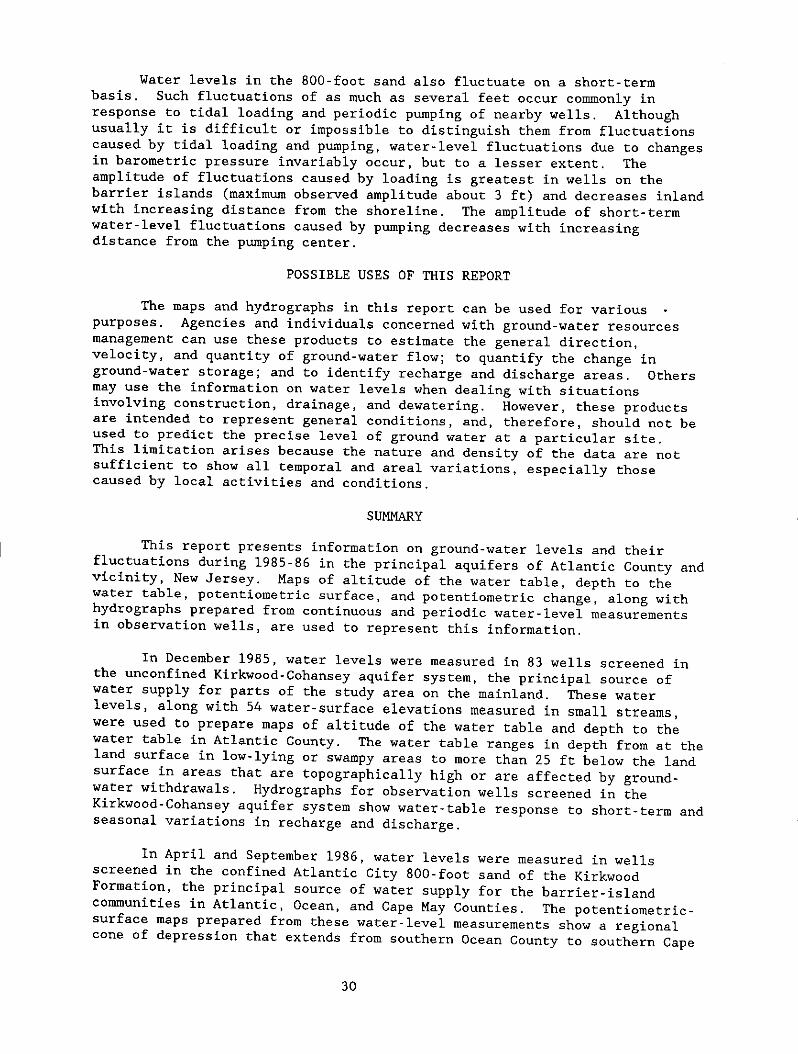
Water levels in the 800-foot sand also fluctuate on a short-term
basis. Such fluctuations of as much as several feet occur commonly in
response to tidal loading and periodic pumping of nearby wells. Although
usually it is difficult or impossible to distinguish them from fluctuations
caused by tidal loading and pumping, water-level fluctuations due to changes
in barometric pressure invariably occur, but to a lesser extent. The
amplitude of fluctuations caused by loading is greatest in wells on the
barrier islands (maximum observed amplitude about 5 ft) and decreases inland
with increasing distance from the shoreline. The amplitude of short-term
water-level fluctuations caused by pumping decreases with increasing
distance from the pumping center.
POSSIBLE USES OF THIS REPORT
The maps and hydrographs in this report can be used for various
purposes. Agencies and individuals concerned with ground-water resources
management can use these products to estimate the general direction,
velocity, and quantity of ground-water flow; to quantify the change in
ground-water storage; and to identify recharge and discharge areas. Others
may use the information on water levels when dealing with situations
involving construction, drainage, and dewatering. However, these products
are intended to represent general conditions, and, therefore, should not be
used to predict the precise level of ground water at a particular site.
This limitation arises because the nature and density of the data are not
sufficient to show all temporal and areal variations, especially those
caused by local activities and conditions.
SUMMARY
This report presents information on ground-water levels and their
fluctuations during 1985-86 in the principal aquifers of Atlantic County and
vicinity, New Jersey. Maps of altitude of the water table, depth to the
water table, potentiometrie surface, and potentiometric change, along with
hydrographs prepared from continuous and periodic water-level measurements
in observation wells, are used to represent this information.
In December 1985, water levels were measured in 83 wells screened in
the unconfined Kirkwood-Cohansey aquifer system, the principal source of
water supply for parts of the study area on the mainland. These water
levels, along with 54 water-surface elevations measured in small streams,
were used to prepare maps of altitude of the water table and depth to the
water table in Atlantic County. The water table ranges in depth from at the
land surface in low-lying or swampy areas to more than 25 ft below the land
surface in areas that are topographically high or are affected by ground-
water withdrawals. Hydrographs for observation wells screened in the
Kirkwood-Cohansey aquifer system show water-table response to short-term and
seasonal variations in recharge and discharge.
In April and September 1986, water levels were measured in wells
screened in the confined Atlantic City 800-foot sand of the Kirkwood
Formation, the principal source of water supply for the barrier-island
communities in Atlantic, Ocean, and Cape May Counties. The potentiometrie-
surface maps prepared from these water-level measurements show a regional
cone of depression that extends from southern Ocean County to southern Cape
3O
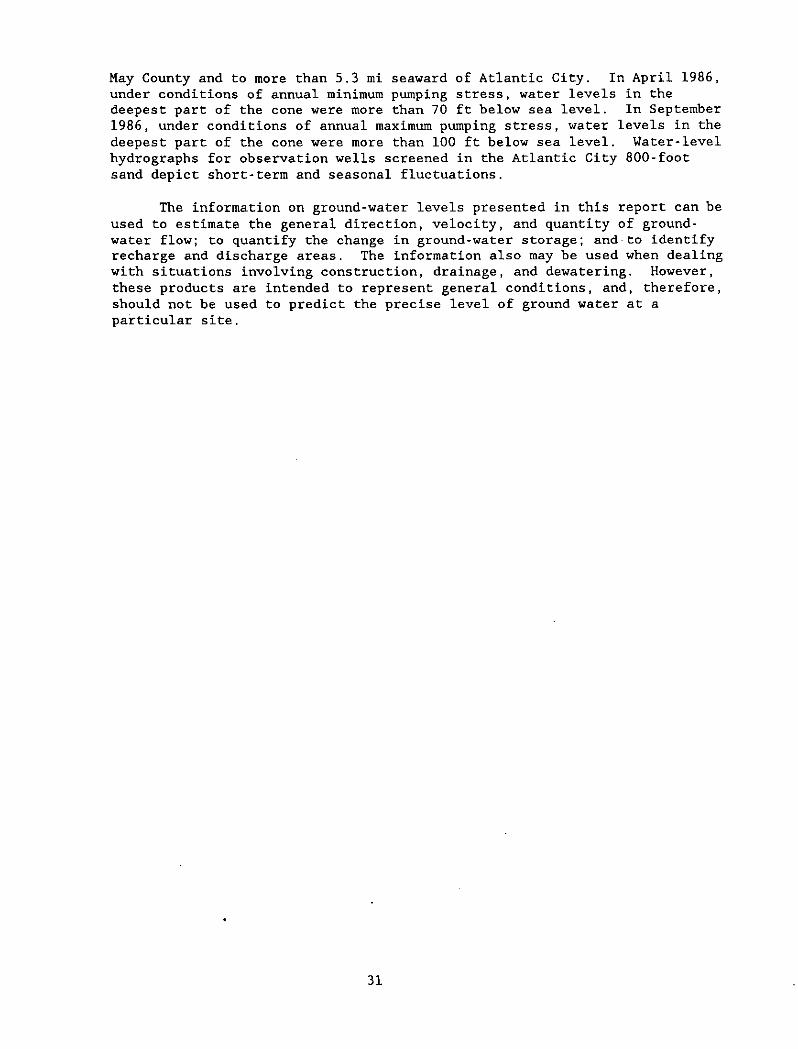
May County and to more than 5.3 mi seaward of Atlantic City. In April 1986,
under conditions of annual minimum pumping stress, water levels in the
deepest part of the cone were more than 70 ft below sea level. In September
1986, under conditions of annual maximum pumping stress, water levels in the
deepest part of the cone were more than I00 ft below sea level. Water-levelhydrographs for observation wells screened in the Atlantic City 800-foot
sand depict short-term and seasonal fluctuations.
The information on ground-water levels presented in this report can be
used to estimate the general direction, velocity, and quantity of ground-
water flow; to quantify the change in ground-water storage; and to identify
recharge and discharge areas. The information also may be used when dealing
with situations involving construction, drainage, and dewatering. However,
these products are intended to represent general conditions, and, therefore,
should not be used to predict the precise level of ground water at a
particular site.
31

REFERENCES CITED
Anderson, H.R., and Appel, C.A., 1969, Geology and ground-water resources of
Ocean County, New Jersey: New Jersey Department of Conservation and
Economic Development, Special Report 29, 93 p.
Barksdale, H.C., Sundstrom, R.W., and Brunstein, M.S., 1936, Supplementaryreport on the ground-water supplies of the Atlantic City region: New
Jersey State Water Policy Commission, Special Report 6, 139 p.
Clark, G.A., Meisler, Harold, Rhodehamel, E.C., and Gill, H.E., 1968,
Summary of ground-water resources of Atlantic County, New Jersey, with
special reference to public water supplies: New Jersey Department ofConservation and Economic Development, Water Resources Circular 18,
53 p.
Eekel, J.A. and Walker, R.L., 1986, Water levels in major artesian aquifers
of the New Jersey Coastal Plain, 1983: U.S. Geological Survey Water-
Resources Investigations Report 86-4028, 62 p.
Gill, H.E., 1962, Ground-water resources of Cape May County, N.J., salt-
water invasion of principal aquifers: New Jersey Department of
Conservation and Economic Development, Special Report 18, 171 p.
Leahy, P.P., Paulachok, G.N., Navoy, A.S., and Pucci, A.A., Jr., 1987, Plan
of study for the New Jersey Bond Issue ground-water supplyinvestigations: New Jersey Geological Survey Open-File Report 87-1,53 p.
Ludlum, D.M., 1983, The New Jersey Weather Book: New Brunswick, RutgersUniversity Press, 252 p.
May, J.E., 1985, Feasibility of artificial recharge to the 800-foot sand of
the Kirkwood Formation in the Coastal Plain near Atlantic City, New
Jersey: U.S. Geological Survey Water-Resources Investigations Report85-4063, 24 p.
New Jersey Department of Environmental Protection, 1981, The New Jersey
Statewide Water-Supply Master Plan: Trenton, New Jersey, 141 p.
Rhodehamel, E.C., 1970, A hydrologic analysis of the New Jersey Pine Barrens
region: New Jersey Department of Environmental Protection, WaterResources Circular 22, 35 p.
Rush, F.E., 1962, Records of wells and ground-water quality in Burlington
County, New Jersey--A preliminary report: New Jersey Department of
Conservation and Economic Development, Division of Water Policy andSupply, Water Resources Circular 7, 104 p.
Skrivan, J.A., and Karlinger, M.R., 1980, Semi-variogram estimation and
universal kriging program: U.S. Geological Survey Computer
Contribution, Program Number K603, 98 p.
32

REFERENCES CITED--Cont'd
Thompson, D.G., 1928, Ground-water supplies of the Atlantic City region:
New Jersey Department of Conservation and Development, Bulletin 30,138 p.
U.S. Department of Commerce, Bureau of the Census, 1982, Census of
population (1980), number of inhabitants: Washington, D.C., U.S.
Government Printing Office, 84 p.
U.S. Geological Survey, annually 1975 to date, Water resources data for New
Jersey, Volume I, Atlantic slope basins, Hudson River to Cape May.
Walker, R.L., 1983, Evaluation of water levels in major aquifers of the New
Jersey Coastal Plain, 1978: U.S. Geological Survey Water-Resources
Investigations Report 82-4077, 56 p.
Woolman, Lewis, annually 1890 through 1902, Report on artesian wells in
southern New Jersey, in Annual report of the State Geologist:
Geological Survey of New Jersey, Trenton, New Jersey.
Zapecza, O.S., 1984, Hydrogeologic framework of the New Jersey Coastal
Plain: U.S. Geological Survey Open-File Report 84-730, 61 p.
33

Water Levels in the Principal Aquifers of Atlantic County and Vicinity, New Jersey, 1985-86 ( New Jersey Geological Survey Open-File Report 88-3)