the open construction and building technology … open construction and building technology journal,...
TRANSCRIPT

The Open Construction and Building Technology Journal, 2009, 3, 127-140 127
1874-8368/09 2009 Bentham Open
Open Access
Stiffness-Strength-Ductility-Design Approaches for Crescent Shaped Braces
T. Trombetti, S. Silvestri*, G. Gasparini and I. Ricci
Department DISTART, University of Bologna, Bologna, Italy
Abstract: It is known that the seismic response of a structural system is highly influenced, in addition to the earthquake
input, by the dynamic characteristics of the system itself. This paper presents an approach for the identification of the
characteristics of the structural system resisting to horizontal loads which enables to satisfy given seismic performance
objectives. This is achieved by considering a total conceptual separation between the structural systems resisting to verti-
cal and horizontal loads. The proposed approach is first briefly developed in general within a Performance-Based Seismic
Design (PBSD) framework and then fully applied to the case study of a five-storey steel building structure. It is composed
of three basic steps: (1) identification of the fundamental characteristics which should be possessed by the horizontal re-
sisting system to satisfy a multiplicity of performance objectives, (2) development of a peculiar horizontal resisting sys-
tem composed of “crescent shaped braces” which are specifically calibrated to satisfy given performance objectives, (3)
verification, by means of appropriate time-history analyses, of the seismic performances achieved. In detail, the horizontal
resisting system is calibrated to satisfy a multiplicity of performance objectives through the identification of an "objec-
tives curve", in the Force-Displacement diagram, of the mechanical characteristics of the structure. The calibration is ob-
tained by methods/tools borrowed either from Direct Displacement-Based Design (DDBD) or Force-Based Design (FBD),
depending on the specific performance objective to be imposed. The applicative example has been carried out with refer-
ence to three performance objectives and has led to the identification of an horizontal resisting system composed of spe-
cial bracing elements capable of realizing a sort of properly-calibrated seismic isolation called crescent-shaped braces.
The results obtained through non-linear dynamic analyses have shown that the proposed approach leads to the congruity
between the imposed and the achieved seismic performances.
Keywords: Horizontal-resisting system, stiffness, strength, ductility, performance objectives, crescent-shaped braces.
1. INTRODUCTION
The design of building structures capable of providing given seismic performances represents a difficult task due to the complex characterization of the seismic action (not a single action but a set of possible actions of different strength and probability of occurrence) and of the structural response. A viable solution to this task may be found in the recently proposed methodologies that fall under the name of Performance Based Seismic Design (PBSD) [1-3].
The base of the PBSD resides in the capacity of defining and satisfying a multiplicity of performance objectives [2], i.e. in the capacity of guaranteeing (within the limits of engi-neering precision) that a given structural system will perform in a selected manner (performance level) under a given seis-mic input (earthquake design level). The international scien-tific community typically focuses on four different perform-ance levels (Fully Operational, Operational, Life Safety, Near Collapse) and on four earthquake design levels (Fre-quent, Occasional, Rare, Very Rare) [2].
As recently recalled by Priestley [4] in a keynote lecture given at the first “European Conference on Earthquake En-gineering and Seismology”, Geneve 2006, the emphasis on
*Address correspondence to this author at the University of Bologna, Viale
Risorgimento 2 , 40136 Bologna, Italy; Tel: ++39 051 2093258:
Fax: ++39 051 2093236; E-mail: [email protected]
PBSD has forced a re-examination of the methodologies employed in the seismic design of structures.
Typically, the traditional seismic design of the structures
is carried out through a Force-Based Design (FBD, borrowed
from the common approach used for static loads) and the
load-bearing system (designed for vertical loads) is “tuned”
in order to take the horizontal loads due to the seismic action
(i.e. a single structural system acts for both vertical and hori-
zontal actions) [5-10]. Thus, the dynamic response of struc-
tural system is somehow passively evaluated and not “gov-
erned” to optimise it (except in the case of use of seismic
protections systems such as base isolators [11] and dissipa-tive devices [12,13]).
On the other hand, many recent contributions in the field
of seismic engineering have opened up new possibilities for
the structural engineer in terms of conceiving and dimen-
sioning (i.e. designing) a structural system which offers pre-
determined seismic performances. Skipping all details, these
recent contributions may be summarized as follows: (i) the
PBSD approach [1-3] formalized the need of satisfying a
multiplicity of performance objectives, (ii) the Direct Dis-
placement-Based Design (DDBD) [14] introduced the dis-
placement analysis as a tool for seismic design of structures,
(iii) the wide use of special devices and techniques (e.g. un-
bonded braces, dampers [12,13], seismic isolators [11], etc.)
adopted for the mitigation of the seismic effects upon the

128 The Open Construction and Building Technology Journal, 2009, Volume 3 Trombetti et al.
structure, which allows the conceptual separation between
the structural systems resisting to vertical and horizontal loads.
This paper presents an approach for a full-controlled seismic design of structures which combines these recent contributions and overcomes the traditional design approach.
2. IDEA AND NEW ASPECTS
The idea behind the design approach here proposed lies:
• in the identification of the characteristics of the struc-tural system resisting to horizontal loads which en-ables to satisfy a multiplicity of seismic performance objectives (as required by the PBSD and as already faced in other research works [15-18]) by adapting and exploiting the complete DDBD approach [16].
The new aspects of this work lie:
• in the total separation between the structural system resisting to vertical loads (“vertical resisting system”) and the structural system resisting to horizontal loads (“horizontal resisting system”),
• in the development of a peculiar horizontal resisting system composed of “crescent shaped braces” which are specifically calibrated to satisfy multiple perform-ance objectives with reference to the case-study of a steel structure.
It is known that, in general, each structural ele-ment/system can be described in terms of its mechanical characteristics (e.g., stiffness, strength and ductility) on a Force-Displacement diagram. Focusing on the non-linear behaviour of the horizontal resisting elements of a given building structure, the secant stiffness approach [6] allows (in the words of Priestley [6]) “logical choices regarding the force distribution” between different horizontal resisting elements. In this work, we will investigate (through the de-velopment of a general design approach and its application to a specific case-study) how these logical choices concern-ing strength, stiffness and ductility of horizontal resisting elements can be rationally made ([6] page 9).
It is also known that a given structure displays different behaviours under different seismic actions. Every time, the structural behaviour may be influenced by stiffness, by strength and/or by ductility depending on the intensity level of the considered seismic action. For example, the maximum inter-storey drift under the seismic action corresponding to a Frequent Earthquake is influenced by the stiffness, whilst the structure collapse under the seismic action corresponding to a Rare Earthquake is typically controlled by strength and ductility.
On the one hand, in a PBSD approach [1-3], the perform-ance objectives may be expressed, from a practical point of view, in terms of maximum displacements, velocities and accelerations.
On the other hand, structural dynamics [19] teaches that the system response in terms of maximum displacements, maximum velocities and maximum accelerations is governed by the mechanical characteristics (stiffness, strength and ductility) of the system.
Consequently, the performance objectives become gov-erned by the mechanical characteristics of the system. It is thus clear that, in general terms, in order to achieve specific performances of a structural system the designer may act upon the stiffness, the strength, and the ductility of the sys-tem. Hence the name “stiffness-strength-ductility-design approach”.
It is here worth pointing out that the design approach pro-
posed in this paper is specifically calibrated to meet the
performance objectives which are only related to the seismic
action. However, the above-mentioned separation between
horizontal and vertical resisting systems allows the separate
handling of vertical and horizontal loads, so that the practical
aspects related to any vertical load do not interferes with the
aspects related to the seismic design, because the former can
be treated almost independently as far the vertical resisting
system is dimensioned. Also, the wind action, which is here
not explicitly considered, may lead to additional perform-
ance objectives to those related to the seismic action, which
can be implemented in the approach. Finally, the proposed
separation between horizontal and vertical resisting systems
leads also to a high flexibility in terms of structural concep-
tion and therefore may considerably help the designer to
meet all various functional requirements imposed by archi-
tects.
3. DESIGNER POSSIBILITY TO CONTROL THE
HORIZONTAL RESISTING SYSTEM
In general, the horizontal-resisting system (hereafter re-ferred to as HRS) of a given building structure can be seen as composed of a series of single horizontal resisting elements (hereafter referred to as “horizontal resisting components”, HRC), working together.
3.1. The Horizontal Resisting Component
The mechanical characterization of each component (be-ing either a shear wall, a bracing system or other) of the horizontal resisting system necessarily requires to capture both its elastic and inelastic behaviour. Without loss of gen-erality, the mechanical characterization of each elementary component can be assumed to be an elastic-perfectly plastic one or a bilinear one with hardening, as represented in Fig. (1) (a) and (b) [7], respectively.
Fig. (1). F constitutive models of the i-th HRC.
Fyi
δyi
δui
μi
ki
δ
F
Fyi
δyi
δui
μi
shri
ki
δ
F
(a) Elastic-perfectly
plastic model.
(b) Bilinear model with
hardening.

Stiffness-Strength-Ductility-Design Approaches For Crescent The Open Construction and Building Technology Journal, 2009, Volume 3 129
The Following six mechanical parameters can be recog-nized in Fig. (1) (b):
- ik = stiffness;
- yiF = strength;
- yi = yield displacement;
- ui = ultimate (i.e. maximum, in terms of capacity of the element) displacement;
- iμ = ductility;
- ishr = strain hardening ratio.
Subscript “i” indicating that these quantities refer to the i-th HRC of the HRS.
Out of these six quantities, the independent parameters, which are necessary to fully characterize the HRC behaviour, are only four. For sake of simplicity, let us assume as inde-pendent parameters the following ones:
- stiffness (secant at yield point) = the slope ik of the idealized elastic response, i.e. the mechanical parame-ter which relates forces and displacements of the HRC in linear-elastic field;
- strength (or yield force) = maximum force yiF which the HRC can withstand remaining approximately in linear-elastic field;
- ductility = ratio iμ between the ultimate and the yield displacements;
- strain hardening ratio = ratio ishr between the after-yielding stiffness and the elastic stiffness;
- with the other two parameters derived as follows:
yiyi
i
F
k= (1)
ui yi iμ= (2)
For sake of simplicity, in order to present the basic ideas of the design approach here proposed, in the following parts of this section 3, the elastic-perfectly plastic model has been assumed (shr = 0), so that the independent parameters are only three.
3.2. The Horizontal Resisting System of a Building Struc-ture
Without loss of generality, let us consider plane single-degree-of-freedom (SDOF) structural systems equipped with n elementary horizontal resisting components working in parallel (which is a correct schematisation under the com-mon assumption of building structures characterized by rigid in-plane floor systems), as the illustrative ones represented in Fig. (2).
The mechanical characterization of the whole horizontal resisting system, as composed of the n horizontal-resisting components working in parallel, can be directly obtained from the mechanical characterization of each single compo-nent.
Without loss of generality, let us focus on a HRS com-posed of three HRCs (i.e. let us assume 3n = ). The follow-
ing equations provide the relationships between the me-chanical characterisation of the HRS and those of the three HRCs which make up the whole system. The HRCs are numbered progressively following the magnitude of the yield displacement: the system with the smallest yield displace-ment is numbered as system 1, the system with the second smallest yield displacement is numbered as system 2, and so on. Consequently, the constitutive law of the HRS is given by:
( )
( ) ( )
( ) ( )
y1
1 1 y1 y2
1 2 1 2 y2 y3
1 2 1 3 2 y3 u,LRS
' for 0
' '' for
' '' ''' for
' '' ''' for
y y
y y y y
y y y y y
K
K K
FK K K
K K K
+
=
+ +
+ +
(3)
where:
3
1 2 3
1 1
'
n
i i
i i
K k k k k k
= =
= = = + + (4)
3
2 3
2 2
''
n
i i
i i
K k k k k
= =
= = = + (5)
3
3
3 3
'''
n
i i
i i
K k k k
= =
= = = (6)
( )u,LRS u1 u2 u3min , ,= (7)
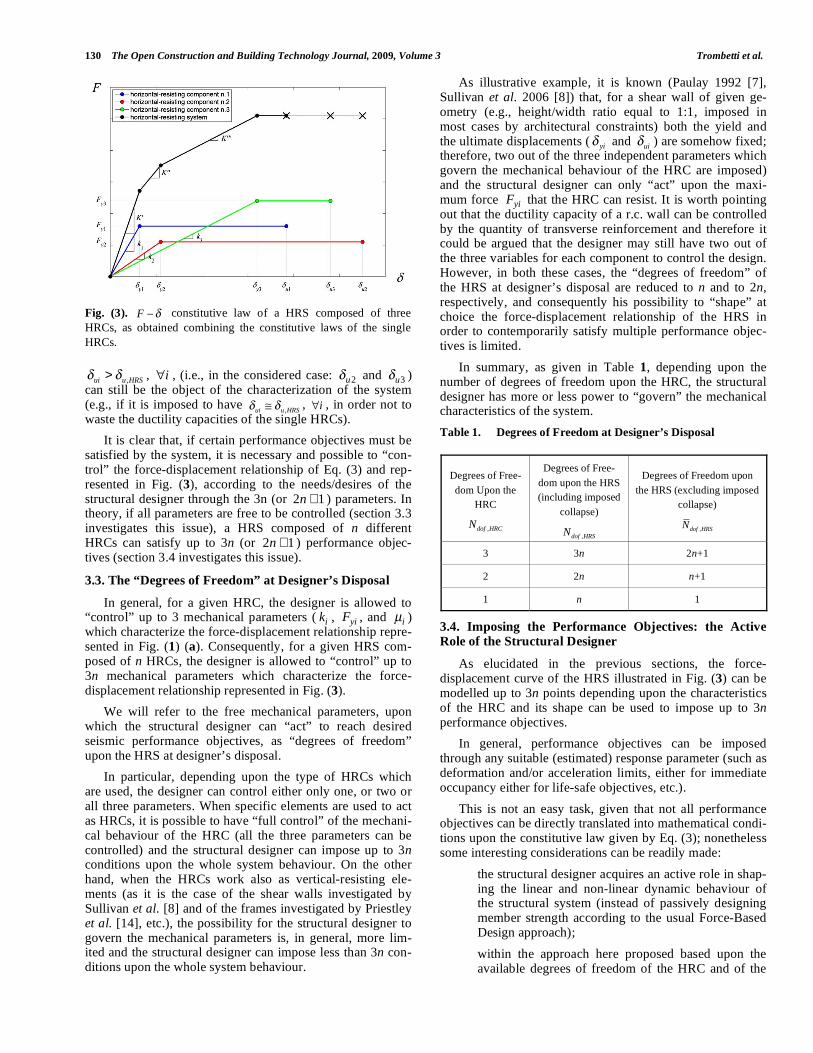
As illustrative example of the above equations, Fig.(3) represents the mechanical characterization of the HRS com-posed of three HRCs.
It can be observed that the overall mechanical behaviour of a HRS composed of n HRCs is controlled by 3n parame-ters, given that the mechanical behaviour of a single HRC is controlled by 3 parameters.
However, note that, in Fig. (3), the force-displacement curve of the HRS for 1u is represented as a dashed line. This is because the structural system should reach collapse for ( )1 , 1 2 3min , ,u u HRS u u u= = = , thus diminishing the number of parameters controlling the overall mechanical behaviour from 3n to 2 1n + ; nonetheless also parameters
Fig. (2). Different SDOF structural systems, each one composed of
three homogenous horizontal-resisting components.
130 The Open Construction and Building Technology Journal, 2009, Volume 3 Trombetti et al.
,ui u HRS> , i , (i.e., in the considered case: 2u and 3u ) can still be the object of the characterization of the system (e.g., if it is imposed to have
,ui u HRS, i , in order not to
waste the ductility capacities of the single HRCs).
It is clear that, if certain performance objectives must be satisfied by the system, it is necessary and possible to “con-trol” the force-displacement relationship of Eq. (3) and rep-resented in Fig. (3), according to the needs/desires of the structural designer through the 3n (or 2 1n + ) parameters. In theory, if all parameters are free to be controlled (section 3.3 investigates this issue), a HRS composed of n different HRCs can satisfy up to 3n (or 2 1n + ) performance objec-tives (section 3.4 investigates this issue).
3.3. The “Degrees of Freedom” at Designer’s Disposal
In general, for a given HRC, the designer is allowed to “control” up to 3 mechanical parameters ( ik , yiF , and iμ ) which characterize the force-displacement relationship repre-sented in Fig. (1) (a). Consequently, for a given HRS com-posed of n HRCs, the designer is allowed to “control” up to 3n mechanical parameters which characterize the force-displacement relationship represented in Fig. (3).
We will refer to the free mechanical parameters, upon which the structural designer can “act” to reach desired seismic performance objectives, as “degrees of freedom” upon the HRS at designer’s disposal.
In particular, depending upon the type of HRCs which are used, the designer can control either only one, or two or all three parameters. When specific elements are used to act as HRCs, it is possible to have “full control” of the mechani-cal behaviour of the HRC (all the three parameters can be controlled) and the structural designer can impose up to 3n conditions upon the whole system behaviour. On the other hand, when the HRCs work also as vertical-resisting ele-ments (as it is the case of the shear walls investigated by Sullivan et al. [8] and of the frames investigated by Priestley et al. [14], etc.), the possibility for the structural designer to govern the mechanical parameters is, in general, more lim-ited and the structural designer can impose less than 3n con-ditions upon the whole system behaviour.
As illustrative example, it is known (Paulay 1992 [7], Sullivan et al. 2006 [8]) that, for a shear wall of given ge-ometry (e.g., height/width ratio equal to 1:1, imposed in most cases by architectural constraints) both the yield and the ultimate displacements ( yi and ui ) are somehow fixed; therefore, two out of the three independent parameters which govern the mechanical behaviour of the HRC are imposed) and the structural designer can only “act” upon the maxi-mum force yiF that the HRC can resist. It is worth pointing out that the ductility capacity of a r.c. wall can be controlled by the quantity of transverse reinforcement and therefore it could be argued that the designer may still have two out of the three variables for each component to control the design. However, in both these cases, the “degrees of freedom” of the HRS at designer’s disposal are reduced to n and to 2n, respectively, and consequently his possibility to “shape” at choice the force-displacement relationship of the HRS in order to contemporarily satisfy multiple performance objec-tives is limited.
In summary, as given in Table 1, depending upon the number of degrees of freedom upon the HRC, the structural designer has more or less power to “govern” the mechanical characteristics of the system.
Table 1. Degrees of Freedom at Designer’s Disposal
Degrees of Free-
dom Upon the
HRC
,dof HRCN
Degrees of Free-
dom upon the HRS
(including imposed
collapse)
,dof HRSN
Degrees of Freedom upon
the HRS (excluding imposed
collapse)
,dof HRSN
3 3n 2n+1
2 2n n+1
1 n 1
3.4. Imposing the Performance Objectives: the Active
Role of the Structural Designer
As elucidated in the previous sections, the force-displacement curve of the HRS illustrated in Fig. (3) can be modelled up to 3n points depending upon the characteristics of the HRC and its shape can be used to impose up to 3n performance objectives.
In general, performance objectives can be imposed through any suitable (estimated) response parameter (such as deformation and/or acceleration limits, either for immediate occupancy either for life-safe objectives, etc.).
This is not an easy task, given that not all performance objectives can be directly translated into mathematical condi-tions upon the constitutive law given by Eq. (3); nonetheless some interesting considerations can be readily made:
• the structural designer acquires an active role in shap-ing the linear and non-linear dynamic behaviour of the structural system (instead of passively designing member strength according to the usual Force-Based Design approach);
• within the approach here proposed based upon the available degrees of freedom of the HRC and of the
Fig. (3). F constitutive law of a HRS composed of three
HRCs, as obtained combining the constitutive laws of the single
HRCs.

Stiffness-Strength-Ductility-Design Approaches For Crescent The Open Construction and Building Technology Journal, 2009, Volume 3 131
HRS, the structural engineer, before an always neces-sary numerical verification by means of time-history non-linear dynamic analyses of the final seismic be-haviour of the structure, may “guide” the overall “conceptual design” of the HRS and the “detailed de-sign” of each HRC in such a way the structure reaches the desired performance objectives;
• the operation of imposing performance objectives through the shaping of the constitutive law given by Eq. (3) may lead to new design strategies (e.g., it is clear that, in order to obtain an optimised behaviour of the HRS with respect to the ultimate limit state, the following condition must be satisfied by each HRC:
ui uj= , ,i j , which may be also rewritten as:
yi i yj jμ μ= , ,i j ).
4. THE PROPOSED DESIGN APPROACH
The previous considerations, which show how a back-bone curve can be developed and controlled, can be collected and formalised in a three-step seismic design approach which is aimed at identifying the characteristics of the struc-tural system resisting to horizontal loads which enables to directly satisfy given seismic performance objectives (with-out recurring to any trial-error processes).
It is composed of the following steps:
• Step 1: identification of the fundamental characteris-tics which should be possessed by the horizontal re-sisting system to satisfy a multiplicity of performance objectives (as required by the PBSD), by adapting and exploiting the DDBD tools,
• Step 2: development of a peculiar horizontal resisting system composed of “crescent shaped braces” which are specifically calibrated to satisfy multiple perform-ance objectives,
• Step 3: verification, by means of appropriate time-history analyses, of the seismic performances achieved.
In more detail, Step 1 includes the choice of the perform-ance objectives according to the PBSD framework and the translation of the performances into general and specific mathematical conditions to be imposed on the structure by using the tools of either the DDBD or the FBD approaches. In this step, quite strong assumptions (secant stiffness, no stiffness degradation, use of simplified response spectra, …) may be made and simple analyses may be used, given that the aim is to identify the order of magnitude of the salient features of an horizontal resisting system which allows to obtain a given selected general seismic behaviour of the structure.
In Step 2 the physical and geometrical characteristics of the peculiar single structural elements (crescent shaped braces) which constitute the horizontal resisting system are obtained taking into account also the mechanical properties along the horizontal direction of the vertical resisting system. In this step, appropriate methods should be used for accurate design of the horizontal resisting system.
In Step 3 the verification is carried out by comparing the actual achieved performances (results obtained through non-
linear time-history analyses under appropriate earthquake ground motion records) with the expected/imposed perform-ances. In this step, more sophisticated assumptions and more accurate analyses may be envisaged.
Note that a key-point of this approach is the clear distinc-tion between the conceptual phase (Step 1), the design phase (Step 2) and the verification phase (Step 3). This distinction allows to not fully develop the whole DDBD approach, but to take advantage of its tools in the first conceptual stage.
The approach is illustrated in detail in the following part of the paper with reference to an applicative example.
5. APPLICATIVE EXAMPLE: THE STRUCTURE CONSIDERED AND THE GENERAL SEISMIC
DESIGN STRATEGY
The applicative example is carried out with reference to a building structure composed of five-storey pendular steel frames (for sake of simplicity it is here assumed that there is no transmission of bending moments at the column-beam connections).
The total building mass is 62.7 10 kg. The building is as-sumed to be located in Bologna (Italy) on D.M. 14/01/2008 soil type C and on topographic surface S1. It is designed to meet the D.M. 14/01/2008 provisions [20].
The structure is characterized by the separation between the vertical resisting system (beams and columns) and the horizontal resisting system (special bracing system). It is clear that the response under seismic action is generally the result of a complex behaviour relying on a network system (beams, columns, braces, joints, …) and that in series and/or in parallel schematisations may appear as an over-simplification. However, these schematisations are only used in the conceptual phase (Step 1), while more sophisticated models are used in the design and verification phases (Step 2 and 3).
The vertical-resisting system is sized to support just the vertical loads. In particular, columns are made up with HEB 300 profiles and beams with HEB 340 profiles.
The horizontal resisting system is designed to display a controlled inelastic behaviour at the ground level and to be-have elastically from the second storey up. It is composed of: (1) special bracing elements, named “crescent-shaped braces” placed between the ground storey and the first sto-rey, (2) traditional diagonal bracing elements (following an “X” arrangement, as represented in Fig. (4)) from the second storey up (diagonals are made up with UPN 260 profiles). The horizontal resisting system, placed between the ground and the first storey, is calibrated, within a Performance-Based Seismic Design approach, to satisfy a multiplicity of performance objectives through the identification of a "ob-jectives curve", in the Force-Displacement diagram, of the mechanical characteristics of the structure. The horizontal resisting elements from the second storey up can be designed through a capacity design approach and will not be consid-ered in the following analyses.
Fig. (4) shows the geometry of one of the two perimeter pendular steel frames in both the North-South (NS) and the East-West (EW) directions.

132 The Open Construction and Building Technology Journal, 2009, Volume 3 Trombetti et al.
The seismic behaviour of the building along each direc-tion may be schematised as the one of a SDOF system char-acterized by a mass corresponding to that of the whole su-perstructure (second storey up) and by the lateral force-displacement relationship controlled by the HRSs composed of 12 HRCs and 8 HRCs along the NS and the EW direc-tions, respectively, together with the little contribution to the lateral resistance provided by the vertical resisting systems (which will be simply dimensioned in order to carry the ver-tical loads). In the following part of the paper, for sake of conciseness, only the seismic behaviour of the building along the NS direction will be considered.
Fig. (4). Schematic representation of the building structure consid-
ered.
6. APPLICATIVE EXAMPLE: IDENTIFICATION OF
THE F- OBJECTIVES CURVE (STEP 1)
With the aim of designing the horizontal resisting system, we refer to the Basic Objectives defined in the Vision 2000 document [1,2]. In particular, for the design of the horizon-tal-resisting system we impose on the structure the following Basic Objectives:
1) First Performance Objective (PO1): defined as the coupling of the Fully Operational performance level with the Frequent Earthquake Design Level;
2) Second Performance Objective (PO2): defined as the coupling of the Operational performance level with the Occasional Earthquake Design Level;
3) Third Performance Objective (PO3): defined as the coupling of the Life Safe performance level with the Rare Earthquake Design Level.
6.1. First Performance Objective (PO1)
General Performances (GP11 and GP12)
The first performance objective (PO1) requires that, as the Frequent Earthquake (30 years return period, according to Italian Code [16]) occurs, the structure is able to satisfy the following general performances:
• GP11. Limited inter-storey drifts in order to have no significant damage in the non-structural elements and in order to keep column’s stresses less than yield (elastic design).
• GP12. Structure is, at least, at its first yield, and there is no residual displacement.
Note that GPij indicates the j-th general performance corresponding to the i-th performance objective.
These performances can be translated in the following condi-tions:
GP11. Frequent FO (8)
GP12. Frequent y1 (9)
where:
Frequent is the Frequent Earthquake displacement demand;
FO is the displacement capacity of the structure “at the first performance objective” (i.e. maximum displace-ment allowed under Frequent Earthquake so that the structure remains Fully Operational). Its value may be assumed as the smallest one between the value which prevents damage to non-structural elements (5‰ h suggested by Priestley, Calvi e Kowalsky [14]) and the value which ensures elastic behaviour of the col-umns.
y1 is the structure yield displacement.
Specific Performances (SP11 and SP12)
For the structural system under consideration (h=350 cm), FO = 1.75 cm; hence the previous performances can be translated in the following conditions:
SP11. Frequent 1.75 cm (10)
SP12. Frequent y1 (11)
Note that SPij indicates the j-th specific performance cor-responding to the i-th performance objective.
Characteristics on the Structure Force-Displacement Dia-
gram (C11 and C12)
The Specific Performance SP11 represents the structure initial stiffness (associated to the corresponding displace-ment) on the structure Force-Displacement diagram (which translates, from a graphical point of view, into a range of possible points C11 in Fig. (6), depending on the choice of the displacement demand).
Note that Cij indicates the j-th characteristic on the struc-ture Force-Displacement diagram corresponding to the i-th performance objective.
Considering different values for the displacement de-mand, Frequent , the corresponding period, FrequentT , can be read from the selected displacement spectrum for a damping ratio of 5% Fig. (5). The lateral stiffness, FrequentK , corre-sponding to the displacement demands, can be found by in-verting the well-known equation of the period of a SDOF system, as:
2
FrequentFrequent
4 mK
T= (12)
Fig. (5). Displacement spectra (30 years return period, according to
Italian Code [11], damping ratio 5 %).

Stiffness-Strength-Ductility-Design Approaches For Crescent The Open Construction and Building Technology Journal, 2009, Volume 3 133
Fig. (6). First characteristic (possible points C11) on the structure Force-Displacement diagram.
The Specific Performances SP12, represent, on the
Force-Displacement diagram (C12 in Fig. (7)), a lower bound for the yield displacement of the structure (and, through FrequentK , also for the yield force of the structure).
Fig. (7). First (C11) and second (C12) characteristics on the struc-
ture Force-Displacement diagram.
Choice of the Frequent Earthquake Displacement Demand
Assuming that the displacement demand and the structure displacement capacity are the same, the previous Specific Performances become:
SP11. Frequent 1.75 cm= (13)
SP12. y11.75 cm (14)
The period and the stiffness corresponding to a displace-ment demand of 1.75 cm are 0.84 seconds and 151070 kN/m, respectively. Fig. (8) shows the first performance ob-jective on the structure Force-Displacement diagram.
6.2. Second Performance Objective (PO2)
General Performances (GP21 and GP22)
The second performance objective (PO2) requires that, as the Occasional Earthquake (50 years return period, according
to Italian Code [20]) occurs, the structure is able to satisfy the following general performances:
GP21. Limited inter-storey drifts in order to have no signifi-cant damage to non-structural elements.
GP22. Residual displacement must be limited.
These performances can be translated in the following conditions:
GP21. Occasional O
(15)
GP22. Occasional y1
(16)
where:
Occasional is the Occasional Earthquake displacement demand;
O is the structure displacement capacity at the second performance objective. Its value may be assumed as 1% h (intermediate value between the value 0.5% h suggested by Stephen A. Mahin [3] and the value 2% h suggested by Priestley, Calvi and Kowalsky [14]). It ensures that there are no significant damage to non-structural elements;
y1 is the structure yield displacement.
Specific Performances (SP21 and SP22)
For the structural system under consideration, (h=350 cm), O = 3.5 cm; hence the previous performances can be translated in the following conditions:
SP21. Occasional 3.5 cm (17)
SP22. Occasional y1
(18)
Characteristics on the Structure Force-Displacement
Diagram (C21 and C22)
The Specific Performances SP21 and SP22, represent, on the Force-Displacement diagram (C21 and C22 in Fig. 9), upper bounds for the yield displacement of the structure (and, through
FrequentK , also for the yield force of the struc-ture).
Choice of the Occasional Earthquake Displacement
Demand
Assuming that the displacement demand and the structure displacement capacity are the same, the previous Specific Performances became:
Fig. (8). First performance objective (PO1) on the structure Force-
Displacement diagram.

134 The Open Construction and Building Technology Journal, 2009, Volume 3 Trombetti et al.
Fig. (9). First (C21) and second (C22) characteristics on the struc-
ture Force-Displacement diagram.
SP21. Occasional 3.5 cm= (19)
SP22. Occasional y1
(20)
Fig. (10) shows the second performance objective on the structure Force-Displacement diagram.
Fig. (10). Second performance objective (PO2) on the structure
Force-Displacement diagram.
Structure yield displacement
With reference to SP12 and SP22, the structure yield dis-placement should be selected in the range of between 1.75 cm and 3.5 cm. The value of 2 cm is here assumed. Fig. (11) shows the first and the second performance objective and the yield point on the structure Force-Displacement diagram.
6.3. Third Performance Objective (PO3)
General Performances (GP31 and GP32)
The third performance objective (PO3) requires that, as the Rare Earthquake (475 years return period, according to Italian Code [20]) occurs, the structure is able to satisfy the following general performances:
GP31. Limited inter-storey drifts in order to have no col-umns’ crisis (either for reaching of their ultimate displace-
ment or for second order effects), no horizontal resisting components’ crisis and no contact between the structure con-sidered and its contiguous structures.
GP32. Limited acceleration in order to avoid damage to structure’s content.
These performances can be translated in the following conditions:
GP31. Rare LS
(21)
GP32. Rare LSa a (22)
where:
Rare is the Rare Earthquake displacement demand;
LS is the structure displacement capacity at the third per-formance objective. Its value may be assumed as the smallest one among the value which causes the crisis of the columns (either due to reaching of their ulti-mate displacement or due to second order effects), the value which causes the crisis of the horizontal resist-ing components and the value which provides the contact between the structure considered and possible adjacent structures. As reference, in order to keep lower of about one order of magnitude the column bending moment due to the second-order effects with respect to the bending moment due to a storey spec-tral acceleration hypothesised equal to 0.3g, a limit of 0.3% of the interstorey-height may be assumed for
LS , if no crisis is expected in the horizontal resisting components and no adjacent structures are present;
Rarea is the Rare Earthquake acceleration demand;
LSa is the structure acceleration capacity at the third per-formance objective. Its value may be assumed as 0.2g, which is a very penalising value for the storey spectral acceleration, to keep the design of the braces on the safe side, thus ensuring that there are no sig-nificant damage to the structure’s content.
Specific Performances (SP)
For the structural system under consideration the struc-ture displacement capacity and the acceleration capacity at the third performance objective are 10 cm and 0.2g, respec-
Fig. (11). First and second performance objective and the yield
point on the structure Force-Displacement diagram.

Stiffness-Strength-Ductility-Design Approaches For Crescent The Open Construction and Building Technology Journal, 2009, Volume 3 135
tively; hence the previous performances can be translated in the following conditions:
SP31. Rare 10 cm (23)
SP32. Rarea 0.2 g (24)
Characteristics on the Structure Force-Displacement
Diagram (C31 and C32)
The Specific Performances SP31 and SP32, translate, on the structure Force-Displacement diagram (C31 and C32 in Fig. (12)), into an upper bound for the Rare Earthquake dis-placement and an upper bound for the Rare Earthquake ac-celeration (i.e. force) demand, respectively.
Fig. (12). First (C31) and second (C32) characteristics on the struc-
ture Force-Displacement diagram.
Choice of the Rare Earthquake Displacement Demand
Considering the Rare Earthquake displacement demand,
Rare , variable between the value ( )LSa (Occasional Earthquake displacement demand corresponding to the ac-celeration capacity, considering an elastic behaviour for the structure) and the value LS , the corresponding period, RareT , can be read from the selected displacement spectrum (Fig. (13)) for a damping ratio, Rare , estimated from the expected ductility demand, Rareμ , with the following formula (sug-gested by Priestley, Calvi and Kowalsky in [14]):
Rare
Rare
Rare
10.05 0.577
μ
μ= + (25)
This formula has been used to take into account the in-crease in additional damping due to the hysteretic behaviour of the diagonal braces, which will be specifically designed to achieve the desired performances under the Rare Earthquake.
The lateral stiffness, RareK , corresponding to the Rare
Earthquake displacement demands, can be found by invert-ing the well-known equation of the period of a SDOF sys-tem, as:
2
Rare 2
Rare
4 mK
T= (26)
Fig. (14) shows (in yellow colour) the points which sat-isfy the specific performances SP31 and SP32. They are
characterized by a specific Rare Earthquake displacement demand and by specific corresponding lateral stiffness.
Fig. (14). Third performance objective (OP3) on the structure
Force-Displacement diagram. "Objectives curve" in the Force-
Displacement diagram.
Up to here, the reader may recognise strong use of the tools of the typical Priestley’s DDBD approach [14], such as the identification of the seismic demands by equating equivalent viscous damping and reading off an effective pe-riod from highly-damper displacement spectra. These tools have been as framed in a extended PBSD framework (three performances objectives are considered).
New original considerations follow which provide inter-esting design tools.
6.4. "Objectives Curve" in the Force-Displacement Diagram
Imposing on the considered structure, the previous per-formance objectives, the “objectives curve” in the Force-Displacement diagram has been obtained for the city of Bo-logna, for D.M. 14/01/2008 soil type C and for topographic surface S1 (Fig. (14)). The "objectives curve" provides the target points for an predetermined/controlled seismic behav-iour of the structure (performance objectives). It represents a
Fig. (13). Displacement spectra (475 years return period, according
to Italian Code [20], damping ratio Rare , estimated from the ex-
pected ductility demand, Rareμ .).
136 The Open Construction and Building Technology Journal, 2009, Volume 3 Trombetti et al.
designing tool, because it may allow to calibrate the horizon-tal resisting system to satisfy a multiplicity of performance objectives (PO1, PO2, PO3).
6.5. Identification of the Characteristics of Each Single Horizontal Resisting Component
In this section, the physical characteristics of the horizon-tal resisting system are obtained taking into account also the mechanical properties along the horizontal direction of the vertical resisting system.
Lateral Stiffness of the Vertical Resisting System
For the calibration of an horizontal resisting system ca-pable of satisfying the imposed performance objectives, we have to consider the contribution of the columns to the lat-eral stiffness.
For the case-study at hand, the lateral stiffness of the i-th generic column placed between the ground and the first sto-rey may be computed as:
y
i 3
kN1.7 710
m
EJk
h= = (27)
where E = 210000 MPa (Young modulus), J = 8563 cm4
(moment of inertia along the considered direction), and h = 3.5 m (inter-storey height).
Hence, the lateral stiffness (initial inclination of the force-displacement relationship) of the vertical-resisting sys-tem, as composed by 28 equal columns, is computed as:
28
VRS i
1
kN19960
mi
K k=
= = (28)
Elastic analysis gives a yield displacement of about 4.4 cm for an axial force of 1250 kN (Fig. (15)).
Non-linear analysis gives an ultimate displacement larger than 128 cm.
Fig. (15). Vertical resisting system Force-Displacement diagram.
Lateral Stiffness of the Horizontal Resisting System
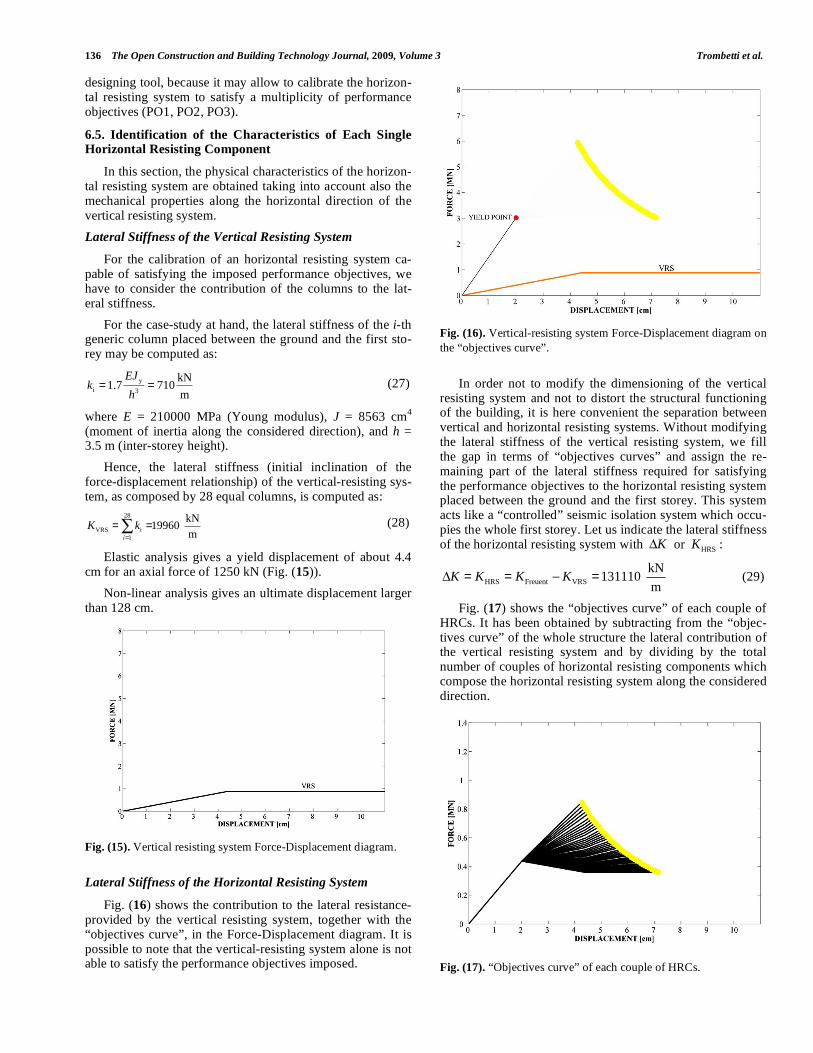
Fig. (16) shows the contribution to the lateral resistance-provided by the vertical resisting system, together with the “objectives curve”, in the Force-Displacement diagram. It is possible to note that the vertical-resisting system alone is not able to satisfy the performance objectives imposed.
Fig. (16). Vertical-resisting system Force-Displacement diagram on
the “objectives curve”.
In order not to modify the dimensioning of the vertical resisting system and not to distort the structural functioning of the building, it is here convenient the separation between vertical and horizontal resisting systems. Without modifying the lateral stiffness of the vertical resisting system, we fill the gap in terms of “objectives curves” and assign the re-maining part of the lateral stiffness required for satisfying the performance objectives to the horizontal resisting system placed between the ground and the first storey. This system acts like a “controlled” seismic isolation system which occu-pies the whole first storey. Let us indicate the lateral stiffness of the horizontal resisting system with K or HRSK :
HRS Freuent VRS
kN131110
mK K K K= = = (29)
Fig. (17) shows the “objectives curve” of each couple of HRCs. It has been obtained by subtracting from the “objec-tives curve” of the whole structure the lateral contribution of the vertical resisting system and by dividing by the total number of couples of horizontal resisting components which compose the horizontal resisting system along the considered direction.
Fig. (17). “Objectives curve” of each couple of HRCs.
Stiffness-Strength-Ductility-Design Approaches For Crescent The Open Construction and Building Technology Journal, 2009, Volume 3 137
7. APPLICATIVE EXAMPLE: DESIGN OF THE PECULIAR HORIZONTAL-RESISTING SYSTEM
COMPOSED OF “CRESCENT SHAPED BRACES”
(STEP 2)
In this section, the physical and geometrical characteris-tics of the peculiar structural element (crescent shaped brace) which constitutes the basis of the horizontal resisting system are sought.
Linear Elastic Analysis
The lateral stiffness of each couple of horizontal resisting components (one brace in compression + one brace in ten-sion) is 1/6 of the lateral stiffness of the horizontal resisting system (there are six crescent shaped braces on each face of the building in North-South direction):
HRS
2HRC
kN5465
6 m
KK = = (30)
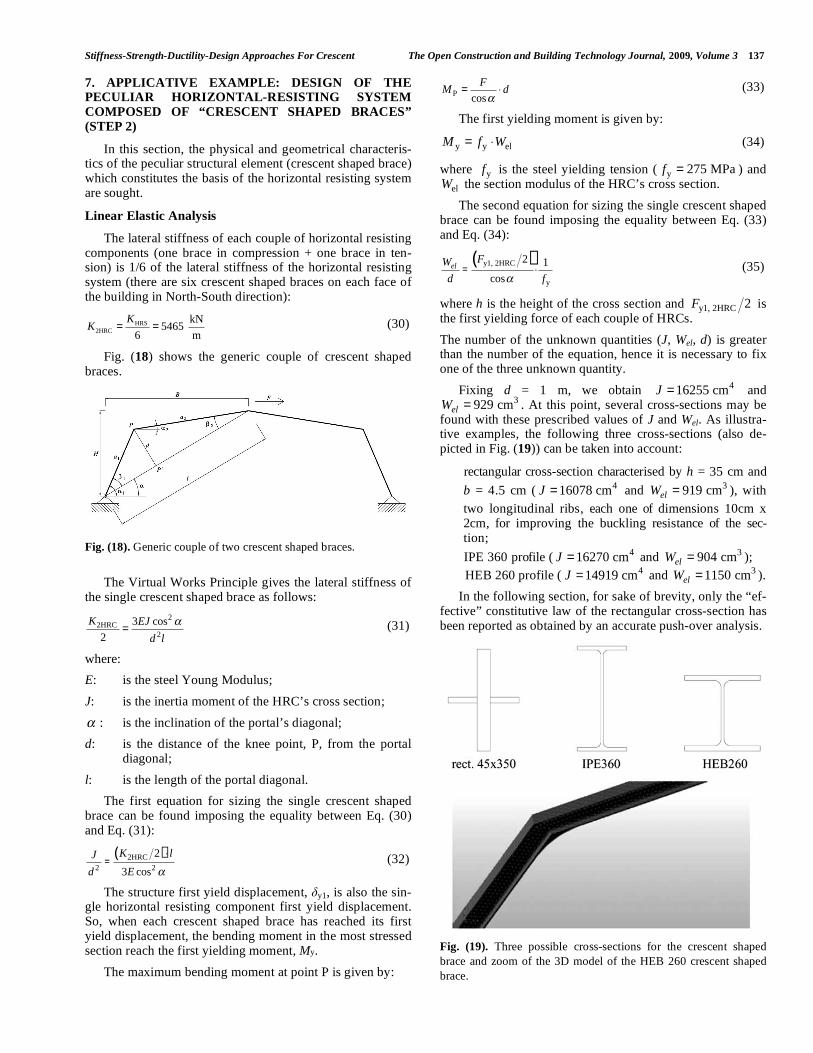
Fig. (18) shows the generic couple of crescent shaped braces.
Fig. (18). Generic couple of two crescent shaped braces.
The Virtual Works Principle gives the lateral stiffness of the single crescent shaped brace as follows:
22HRC
2
3 cos
2
K EJ
d l= (31)
where:
E: is the steel Young Modulus;
J: is the inertia moment of the HRC’s cross section;
: is the inclination of the portal’s diagonal;
d: is the distance of the knee point, P, from the portal diagonal;
l: is the length of the portal diagonal.
The first equation for sizing the single crescent shaped brace can be found imposing the equality between Eq. (30) and Eq. (31):
( )2HRC
2 2
2
3 cos
K lJ
d E= (32)
The structure first yield displacement, y1, is also the sin-gle horizontal resisting component first yield displacement. So, when each crescent shaped brace has reached its first yield displacement, the bending moment in the most stressed section reach the first yielding moment, My.
The maximum bending moment at point P is given by:
Pcos
FM d= (33)
The first yielding moment is given by:
y y elM f W= (34)
where yf is the steel yielding tension ( y 275 MPaf = ) and
elW the section modulus of the HRC’s cross section.
The second equation for sizing the single crescent shaped brace can be found imposing the equality between Eq. (33) and Eq. (34):
( )y1, 2HRC
y
2 1
cos
elFW
d f= (35)
where h is the height of the cross section and y1, 2HRC 2F is the first yielding force of each couple of HRCs.
The number of the unknown quantities (J, Wel, d) is greater than the number of the equation, hence it is necessary to fix one of the three unknown quantity.
Fixing d = 1 m, we obtain 416255 cmJ = and 3929 cmelW = . At this point, several cross-sections may be
found with these prescribed values of J and Wel. As illustra-tive examples, the following three cross-sections (also de-picted in Fig. (19)) can be taken into account:
• rectangular cross-section characterised by h = 35 cm and
b = 4.5 cm ( 416078 cmJ = and 3919 cmelW = ), with
two longitudinal ribs, each one of dimensions 10cm x 2cm, for improving the buckling resistance of the sec-tion;
• IPE 360 profile ( 416270 cmJ = and 3904 cmelW = );
• HEB 260 profile ( 414919 cmJ = and 31150 cmelW = ).
In the following section, for sake of brevity, only the “ef-fective” constitutive law of the rectangular cross-section has been reported as obtained by an accurate push-over analysis.
Fig. (19). Three possible cross-sections for the crescent shaped
brace and zoom of the 3D model of the HEB 260 crescent shaped
brace.

138 The Open Construction and Building Technology Journal, 2009, Volume 3 Trombetti et al.
Non-Linear Analysis
The constitutive law of each couple of HRCs has been obtained (Fig. (20)) with a non-linear static push-over analy-sis (displacement control). The couple of braces has been modelled in the STRAUS7 version 2.2.3 package using 2D plane-stress plate elements with the typical stress-strain curve for mild steel material (S275), considering both me-chanical and geometrical non-linearities.
Fig. (20). Constitutive law of each couple of HRCs.
Fig. (21) shows the constitutive law of each couple of HRCs as reported above the “objectives curve”, together with the contribution of the single column of the vertical resisting system, which may be considered negligible. In-spection of Fig. (21) also indicates that the system is far from the ultimate displacement capacities of both the columns (128 cm) and the crescent shaped braces (larger than 40 cm). It is clear that the single couple is able to satisfy the per-formance objectives, consequently, also the structure should be able to satisfy the imposed performance objectives. This will be verified in next Step 3. From Fig. (21), it can be noted that the imposed (designed) displacement under the Rare Earthquake is equal to 5 cm.
Fig. (21). The constitutive law and the “objectives curve” of each
couple of HRCs.
8. APPLICATIVE EXAMPLE: ANALYSIS AND
VERIFICATION (STEP 3)
In this phase, the analysis of the structure so obtained is carried out to verify if the actual structural behaviour is con-
gruent with the expected/imposed performances. It is clear that, in this verification phase, the more available sophisti-cated models (e.g. fibre-based discretization, three-dimensional models, …) and the more advanced analyses (time-history analyses which include both mechanical and geometrical non-linearities, …) may be used. However, in this applicative example, in order to keep low the computa-tional cost of the analyses, a plane model of the structure has been realized using the SAP2000 v14 package, and each crescent shaped brace has been modelled with a synthetic non-linear link element, characterised by a reasonable sche-matisation of the sophisticated constitutive law obtained in the previous Step 2.
Non-linear time-history dynamic analysis have then been developed on the structural model, using as earthquake ground motions, two groups of seven accelerograms. The first group is composed of seven accelerograms which are overall compatible with the design spectrum of the Italian code corresponding to the Frequent Earthquake (Fig. (22) (a)). The second group is composed of seven accelerograms which are overall compatible with the design spectrum of the Italian code corresponding to the Rare Earthquake (Fig. (22) (b)). Given that the choice of the design earthquake inputs is beyond the scope of this work, the accelerograms have been obtained using the program REXEL v 2.2 (beta) [21], without being worried if, in each group, one or more accelerograms, considerably deviate (being larger or smaller) from the ob-jective spectrum. On the contrary, the overall response to such scattered input may highlight the robustness of the pro-posed crescent shaped braces.
Tables 2 and 3 show the maximum displacements of the first storey caused by the seven accelerograms corresponding to the Frequent Earthquake and by the seven accelerograms corresponding to the Rare Earthquake, respectively. In these tables the average values of the these displacements are also reported.
Fig. (22). Compatible spectra.
The average values of the displacements of the first sto-
rey represent the average displacement demand required by the earthquakes. Comparing the average value of the dis-placement demand with the value of the displacement de-mand imposed in Step 1 for each performance objective, it is possible to note that the value are almost the same (1.82 cm vs. 1.75 cm, and 6.08 cm vs. 5 cm).
9. CONCLUSIONS
This paper presents a seismic design approach which al-lows to exploit at their best all the potentialities offered by

Stiffness-Strength-Ductility-Design Approaches For Crescent The Open Construction and Building Technology Journal, 2009, Volume 3 139
both the PBSD framework and the DDBD methodologies. This approach, which has been applied to the case study of a steel structure, leads to the identification of the characteris-tics of the structural system resisting to horizontal loads which enables to satisfy given seismic performance objec-tives. This is achieved by considering a total conceptual separation between the structural systems resisting to vertical and horizontal loads and by the use of peculiar crescent shaped braces as horizontal resisting system.
The original aspect of the proposed approach mainly re-lies in the combined use of the following recent contribu-tions in the field of seismic engineering:
• active role of the engineering process (the structural characteristics are obtained to drive the building to given seismic behaviour). The designer may im-pose/select the stiffness, the strength and the ductility of the structure at hand, in order to achieve the de-sired seismic performances;
• satisfaction of a multiplicity of performance objec-tives within a PBSD approach. The structural seismic performances being determined either upon strength and resistance or displacement capabilities of the
horizontal system, depending upon the limit state considered;
• methods/tools borrowed from both FBD and DDBD approaches (depending on the performance to be im-posed at hand). The approach here introduced thus al-lows to exploit at their best both the traditional force design method and the more recent direct displace-ment design method;
• conceptual separation between the structural systems resisting to vertical and horizontal loads. This opens the ground for new structural solutions for the seismic design of structures;
• design proposal of peculiar crescent shaped steel braces (that, even though widely used in specific me-chanical devices, have been rarely used as full braces).
To sum up, the use of “suited” crescent shaped braces in the case-study of a steel structure has allowed to apply the DDBD approach to effectively satisfy, according to the PBSD framework, a multiplicity of seismic performance objectives.
It is clear that additional analyses should be performed in order to extend, where possible, this design approach to other structural systems and to verify its reliability to real cases. However, this paper represent a first tentative of col-lecting and exploiting many recent contributions for a full-controlled seismic design of structures.
REFERENCES
[1] SEAOC Vision 2000 Committee. Performance-Based Seismic Engineering. Report prepared by Structural Engineers Association
of California: Sacramento, CA, 1995. [2] R. D. Bertero, and V. V. Bertero, “Performance-based seismic
engineering: the need for a reliable conceptual comprehensive ap-proach, Earthquake Engineering and Structural Dynamics, vol. 31,
no. 3, pp. 627-52, 2002. [3] Available from: http//peer.berkeley.edu/course_modules/eqrd/index.
htm?-c227top.htm&227cont.htm&DesPhil/desphil5.htm. [4] M. J. N. Priestley, “Seismological information for Displacement-
Based Design - A struturcal engineer’s wish list”, First European Conference on Earthquake Engineering and Seismology (a joint
event of the 13th ECEE & 30th General Assembly of the ESC), Ge-neva: Switzerland, 2006, pp. 3-8.
[5] M. J. N. Priestley, Myths and Fallacies in Earthquake Engineering, Revisited. The Mallet Milne Lecture, IUSS Press: Pavia, 2003, pp.
121. [6] M. J. N. Priestley, “Initial stiffness or secant stiffness for seismic
design which is more appropriate?”, First European Conference on Earthquake Engineering and Seismology (a joint event of the 13th
ECEE & 30th General Assembly of the ESC), Geneva: Switzerland, 2006, pp. 3-8.
[7] T. Paulay, and M. J. N. Priestley, Eds., Seismic Design of Rein-forces Concrete and Masonry Buildings, John Wiley & Sons: New
York, 1992. [8] T. J. Sullivan, M. J. N. Priestley, and G. M. Calvi, Seismic Design
of Frame-Wall Structures. Research Report No. ROSE-2006/02, IUSS Press: Pavia, 2006.
[9] L. Petrini, R. Pinho, and G. M. Calvi, Criteri di Progettazione Antisismica degli Edifici. IUSS Press: Pavia, 2004.
[10] M. Bruneau, C. M. Uang, and A. Whittaker, Ductile Design of Steel Structures, McGrow-Hill, New York, 1998.
[11] J. M. Kelly, “Base isolation: linear theory and design”, Earthquake Spectra, vol. 6, no. 2, pp. 223-244, 1997.
Table 2. Maximum Displacements and Average Value of the
First Storey Caused by the Seven Accelerograms
Corresponding to the Frequent Earthquake
Joint Displacements
Joint OutputCase CaseType StepType U1 U1
Text Text Text Text cm cm
20 DIN_NL_S1_FO NonDirHist Max 1.12
20 DIN_NL_S1_FO NonDirHist Min -1.22 1.22
20 DIN_NL_S2_FO NonDirHist Max 3.54
20 DIN_NL_S2_FO NonDirHist Min -2.70 3.54
20 DIN_NL_S3_FO NonDirHist Max 1.49
20 DIN_NL_S3_FO NonDirHist Min -1.72 1.72
20 DIN_NL_S4_FO NonDirHist Max 1.76
20 DIN_NL_S4_FO NonDirHist Min -1.66 1.76
20 DIN_NL_S5_FO NonDirHist Max 1.90
20 DIN_NL_S5_FO NonDirHist Min -2.06 2.06
20 DIN_NL_S6_FO NonDirHist Max 1.35
20 DIN_NL_S6_FO NonDirHist Min -1.58 1.58
20 DIN_NL_S7_FO NonDirHist Max 0.88
20 DIN_NL_S7_FO NonDirHist Min -0.78 0.88
1.82AVERAGE VALUE
Table 3. Maximum Displacements and Average Value of the
First Storey Caused by the Seven Accelerograms
Corresponding to the Rare Earthquake
Joint Displacements
Joint OutputCase CaseType StepType U1 U1
Text Text Text Text cm cm
20 DIN_NL_S1_LS NonDirHist Max 7.59
20 DIN_NL_S1_LS NonDirHist Min -9.71 9.71
20 DIN_NL_S2_LS NonDirHist Max 4.86
20 DIN_NL_S2_LS NonDirHist Min -2.82 4.86
20 DIN_NL_S3_LS NonDirHist Max 6.29
20 DIN_NL_S3_LS NonDirHist Min -2.56 6.29
20 DIN_NL_S4_LS NonDirHist Max 3.20
20 DIN_NL_S4_LS NonDirHist Min -5.26 5.26
20 DIN_NL_S5_LS NonDirHist Max 5.24
20 DIN_NL_S5_LS NonDirHist Min -4.58 5.24
20 DIN_NL_S6_LS NonDirHist Max 3.60
20 DIN_NL_S6_LS NonDirHist Min -4.44 4.44
20 DIN_NL_S7_LS NonDirHist Max 6.74
20 DIN_NL_S7_LS NonDirHist Min -5.71 6.74
AVERAGE VALUE 6.08
140 The Open Construction and Building Technology Journal, 2009, Volume 3 Trombetti et al.
[12] T. T. Soong, and G. F. Dargush, Eds., Passive Energy Dissipation
Systems in Structural Engineering, John Wiley & Sons, Baffins Lane, Chichester, West Sussex PO19 1UD, England, 1997.
[13] C. Christopoulos, and A. Filiatrault, Principles of Passive Supple-mental Damping and Seismic Isolation, IUSS Press: Pavia, Italy,
2006, p. 480. [14] M. J. N. Priestley, G. M. Calvi, and M. J. Kowalsky, Direct
Displacement-Based Seismic Design of Structures, IUSS Press: Pavia, 2007.
[15] M. Aschheim, and E. F. Black, “Yield point spectra for seismic design and rehabilitation”, Earthquake Spectra, vol. 16, no. 2, pp.
317-335, 2000. [16] Q. Xue, and C. C. Chen, “Performance-based seismic design of
structures: a direct displacement-based approach”, Engineering Structures, vol. 25, no. 14, pp. 1803-1813, 2003.
[17] M. Liu, S. A. Burns, and Y.K. Wen, “Multiobjective optimization for performance-based seismic design of steel moment frame struc-
tures”, Earthquake Engineering & Structural Dynamics, vol. 34,
no. 3, pp. 289-306, 2004. [18] T. A. Morgan, and S. A. Mahin, “Performance-based design of
seismic isolated buildings, considering multiple performance objec-tives”, International Journal of Smart Structures and Systems, vol.
4, no. 5, 655-666, 2007. [19] A. K. Chopra, Dynamics of structures, Theory and Applications to
Earthquake Engineering, Prentice Hall: Upper Saddle River, New Jersey, 2001.
[20] Norme Tecniche per le Costruzioni” accepted with D.M. (Ministe-rial Decree) 14/01/2008 and published in S.O. (Ordinary Supple-
ment) No. 30 to G.U. (Official Gazette) No. 29 on date 04/02/2008. [21] I. Iervolino, C. Galasso, and E. Cosenza, Selezione assistita di input
sismico e nuove Norme Tecniche per le Costruzioni, Atti del Con-vegno Valutazione e riduzione della vulnerabilità sismica di edifici
esistenti in c.a., Roma, 29-30 maggio 2008.
Received: April 06, 2009 Revised: September 27, 2009 Accepted: September 29, 2009
© Trombetti et al.; Licensee Bentham Open.
This is an open access article licensed under the terms of the Creative Commons Attribution Non-Commercial License (http://creativecommons.org/-
licenses/by-nc/3.0/) which permits unrestricted, non-commercial use, distribution and reproduction in any medium, provided the work is properly cited.