the open pharmacoeconomics & health economics...
TRANSCRIPT

Send Orders of Reprints at [email protected]
The Open Pharmacoeconomics & Health Economics Journal, 2013, 5, 1-10 1
1876-8245/13 2013 Bentham Open
Open Access
Discounts and Rebates Granted for Medicines for Hospital Use in Five European Countries
Sabine Vogler*,1, Nina Zimmermann1, Christine Leopold1, Claudia Habl1 and Jan Mazag2
1WHO Collaborating Centre for Pharmaceutical Pricing and Reimbursement Policies, Health Economics Department, Gesundheit Österreich GmbH/Österreichisches Bundesinstitut für Gesundheitswesen (GÖG/ÖBIG, Austrian Health Institute), Vienna, Austria 2Statny Ustav pre Kontrolu Lieciv (SUKL, State Institute for Drug Control), Bratislava, Slovakia
Abstract: Objective: The study aimed to survey price reductions such as discounts and rebates granted for medicines used in hospitals.
Methods: We collected official list prices and actual hospital prices of 12 medicines in 25 hospitals in European countries (Austria, the Netherlands, Norway, Portugal and Slovakia).
Results: In all five countries price reductions were granted for some of the medicines surveyed. They usually had the form of discounts; additionally, ex-post rebates were reported from Austria and Portugal. For oncology, anti-inflammatory diseases, neurology-multiple sclerosis and blood no price reductions or only minor discounts/rebates on medicines prices were surveyed, whereas discounts/rebates were routinely granted for cardiovascular medicines and medicines for immunomodulation. Price reductions of 100 percent were found in Austria, Portugal and Slovakia. With the exception of Slovakia, the extent of the discounts/rebates did not differ substantially among the hospitals of a country. The highest median price reductions were identified in Norway, followed by the Netherlands. Price reductions for medicines procured by central tendering tended to be higher than those obtained in decentralized procurement.
Conclusions: The study shows the existence of discounts and rebates granted for specific medicines for hospital use. The results suggest product-specific patterns. Hospitals appear to have little leeway to negotiate price reductions for medicines to which no therapeutic alternatives are available. High price reductions, including cost-free provision of medicines, tend to be granted for medicines whose treatment is likely to continue in primary care after discharge of the patient.
Keywords: Cost-free medicines, discounts, hospitals, medicine prices, pharmaceutical, price reduction, price survey, rebates.
INTRODUCTION
In the area of medicine prices, discounts and rebates have been playing an increasing role. They are used by stakeholders in the supply chain to compete on prices, particularly on generic medicines [1, 2]. Some countries regulate the maximum discounts and rebates in the supply chain: For instance, France limits discounts granted for reimbursable medicines by manufacturers and wholesalers to pharmacists by allowing a maximum discount of 2.5% to reimbursable originators and of 17% to reimbursable generics [3]. Studies suggest a loss of efficiency for public savings due to such discounts [4-6].
In addition to price reductions offered to private actors in the supply chain, discounts and rebates may also be granted to public payers, thus contributing to savings on the pharmaceutical bill. According to a survey [7], in 25 of 31
*Address correspondence to this author at the WHO Collaborating Centre for Pharmaceutical Pricing and Reimbursement Policies, Health Economics Department, Gesundheit Österreich GmbH/Österreichisches Bundesinstitut für Gesundheitswesen (GÖG/ÖBIG, Austrian Health Institute), Stubenring 6, A 1010 Vienna, Austria; Tel: + 43 1 51561/147; Fax: + 43 1 513 84 72; E-mail: [email protected]
surveyed European countries discounts and rebates were granted to public payers by pharmaceutical companies, of these, in 21 countries in the out-patient sector. The most common discounts and rebates identified were price reductions and refunds linked to sales volume but types such as in-kind support, price-volume and risk-sharing agreements are also in place. A mix of various types of discounts and rebates is common. Risk-sharing and further managed-entry agreements, which try to manage uncertainty, are on the rise in several European countries, e.g. in the UK (patient access schemes), in Italy, Poland and the Baltic States [8-10].
That survey [7] also provided an indication about the role of discounts and rebates in the in-patient sector: The existence of discounts and rebates granted to public payers for medicines used in the hospital sector was reported from 25 of the 31 surveyed European countries.
In the last decades the methodology for price analyses has considerably improved. European and international price surveys were undertaken by international institutions such as the Organization for Economic Co-operation and Development (OECD) [11] and the World Health Organization (WHO) [12, 13], commercial companies (e.g. IMS Health), academics [14-17] and public authorities: In
2 The Open Pharmacoeconomics & Health Economics Journal, 2013, Volume 5 Vogler et al.
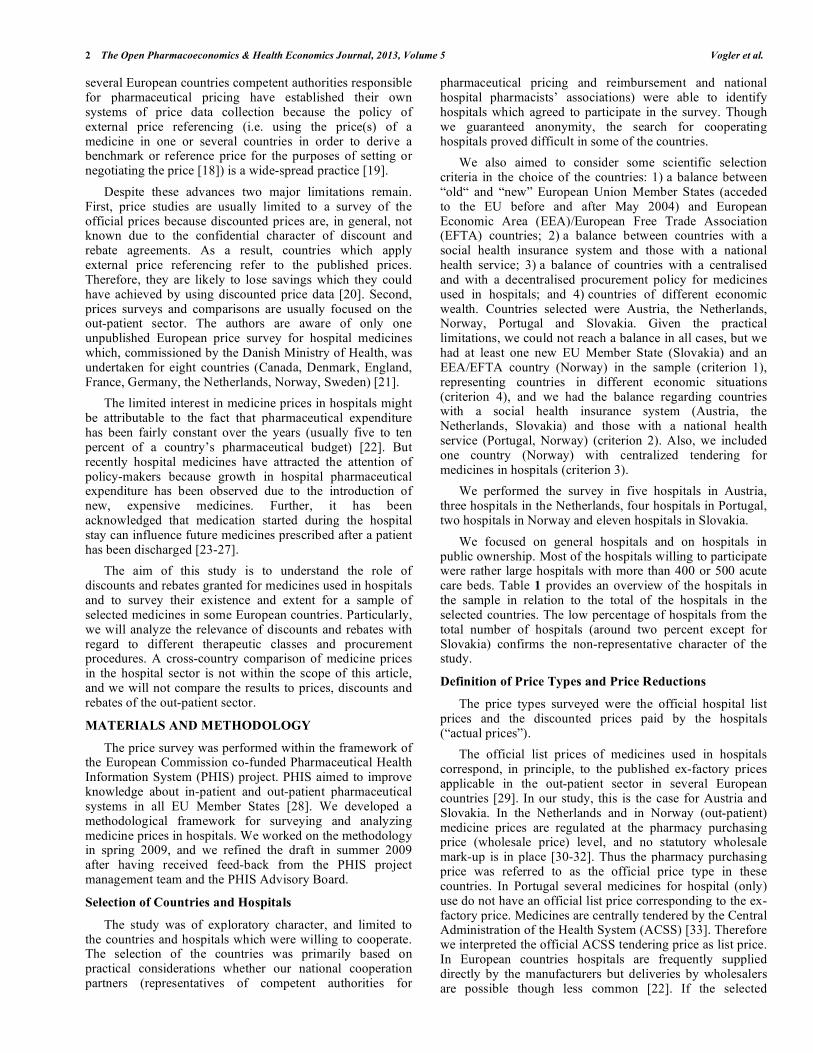
several European countries competent authorities responsible for pharmaceutical pricing have established their own systems of price data collection because the policy of external price referencing (i.e. using the price(s) of a medicine in one or several countries in order to derive a benchmark or reference price for the purposes of setting or negotiating the price [18]) is a wide-spread practice [19].
Despite these advances two major limitations remain. First, price studies are usually limited to a survey of the official prices because discounted prices are, in general, not known due to the confidential character of discount and rebate agreements. As a result, countries which apply external price referencing refer to the published prices. Therefore, they are likely to lose savings which they could have achieved by using discounted price data [20]. Second, prices surveys and comparisons are usually focused on the out-patient sector. The authors are aware of only one unpublished European price survey for hospital medicines which, commissioned by the Danish Ministry of Health, was undertaken for eight countries (Canada, Denmark, England, France, Germany, the Netherlands, Norway, Sweden) [21].
The limited interest in medicine prices in hospitals might be attributable to the fact that pharmaceutical expenditure has been fairly constant over the years (usually five to ten percent of a country’s pharmaceutical budget) [22]. But recently hospital medicines have attracted the attention of policy-makers because growth in hospital pharmaceutical expenditure has been observed due to the introduction of new, expensive medicines. Further, it has been acknowledged that medication started during the hospital stay can influence future medicines prescribed after a patient has been discharged [23-27].
The aim of this study is to understand the role of discounts and rebates granted for medicines used in hospitals and to survey their existence and extent for a sample of selected medicines in some European countries. Particularly, we will analyze the relevance of discounts and rebates with regard to different therapeutic classes and procurement procedures. A cross-country comparison of medicine prices in the hospital sector is not within the scope of this article, and we will not compare the results to prices, discounts and rebates of the out-patient sector.
MATERIALS AND METHODOLOGY
The price survey was performed within the framework of the European Commission co-funded Pharmaceutical Health Information System (PHIS) project. PHIS aimed to improve knowledge about in-patient and out-patient pharmaceutical systems in all EU Member States [28]. We developed a methodological framework for surveying and analyzing medicine prices in hospitals. We worked on the methodology in spring 2009, and we refined the draft in summer 2009 after having received feed-back from the PHIS project management team and the PHIS Advisory Board.
Selection of Countries and Hospitals
The study was of exploratory character, and limited to the countries and hospitals which were willing to cooperate. The selection of the countries was primarily based on practical considerations whether our national cooperation partners (representatives of competent authorities for
pharmaceutical pricing and reimbursement and national hospital pharmacists’ associations) were able to identify hospitals which agreed to participate in the survey. Though we guaranteed anonymity, the search for cooperating hospitals proved difficult in some of the countries.
We also aimed to consider some scientific selection criteria in the choice of the countries: 1) a balance between “old“ and “new” European Union Member States (acceded to the EU before and after May 2004) and European Economic Area (EEA)/European Free Trade Association (EFTA) countries; 2) a balance between countries with a social health insurance system and those with a national health service; 3) a balance of countries with a centralised and with a decentralised procurement policy for medicines used in hospitals; and 4) countries of different economic wealth. Countries selected were Austria, the Netherlands, Norway, Portugal and Slovakia. Given the practical limitations, we could not reach a balance in all cases, but we had at least one new EU Member State (Slovakia) and an EEA/EFTA country (Norway) in the sample (criterion 1), representing countries in different economic situations (criterion 4), and we had the balance regarding countries with a social health insurance system (Austria, the Netherlands, Slovakia) and those with a national health service (Portugal, Norway) (criterion 2). Also, we included one country (Norway) with centralized tendering for medicines in hospitals (criterion 3).
We performed the survey in five hospitals in Austria, three hospitals in the Netherlands, four hospitals in Portugal, two hospitals in Norway and eleven hospitals in Slovakia.
We focused on general hospitals and on hospitals in public ownership. Most of the hospitals willing to participate were rather large hospitals with more than 400 or 500 acute care beds. Table 1 provides an overview of the hospitals in the sample in relation to the total of the hospitals in the selected countries. The low percentage of hospitals from the total number of hospitals (around two percent except for Slovakia) confirms the non-representative character of the study.
Definition of Price Types and Price Reductions
The price types surveyed were the official hospital list prices and the discounted prices paid by the hospitals (“actual prices”).
The official list prices of medicines used in hospitals correspond, in principle, to the published ex-factory prices applicable in the out-patient sector in several European countries [29]. In our study, this is the case for Austria and Slovakia. In the Netherlands and in Norway (out-patient) medicine prices are regulated at the pharmacy purchasing price (wholesale price) level, and no statutory wholesale mark-up is in place [30-32]. Thus the pharmacy purchasing price was referred to as the official price type in these countries. In Portugal several medicines for hospital (only) use do not have an official list price corresponding to the ex-factory price. Medicines are centrally tendered by the Central Administration of the Health System (ACSS) [33]. Therefore we interpreted the official ACSS tendering price as list price. In European countries hospitals are frequently supplied directly by the manufacturers but deliveries by wholesalers are possible though less common [22]. If the selected
Discounts and Rebates Granted for Medicines in Hospitals The Open Pharmacoeconomics & Health Economics Journal, 2013, Volume 5 3
hospitals were supplied by wholesalers (we surveyed the information on the delivery chain), then we understood the pharmacy purchasing price (wholesale price) as the official hospital price. This occurred in the case of one hospital in Austria and all hospitals in Slovakia. In Slovakia the official list price contained the statutorily regulated wholesale mark-up for deliveries to hospitals which differs from the statutory wholesale mark-up applied for out-patient medicines [34].
Preliminary results of a mapping exercise about medicines management in hospitals in European countries [35] suggested different kinds of price reductions: The most common ones include discounts, ex-post rebates, cost-free products and bundling. Definitions for these types of price reductions are provided in Table 2 in accordance with the Glossary of the WHO Collaborating Centre for Pharmaceutical Pricing and Reimbursement Policies [18] and were applied in our study.
Selection of Medicines
We applied a multi-phase approach to select the medicines for the survey. As a first criterion, we focused on medicines which account for a comparatively high share within the hospitals’ budgets. Data about the active ingredients accounting for the highest expenditure in the in-patient sector in 2007 or 2008 were retrieved from PHIS Hospital Pharma Reports of the selected countries [33, 34, 36-38].
We created a draft sample and extended it by including medicines which were likely to impact the pharmaceutical bill of the countries due to high utilization (e.g. high volume products in the out-patient sector such as cardiovascular medicines). In this preliminary selection the following therapeutic groups were included: cardiovascular medicines, contrast media, hematology medicines, neurology medicines (especially for multiple sclerosis), nutrition (electrolyte), oncology medicines (breast, colon, leukemia), and transfusion medicines.
To ensure that we would not miss relevant medicines, we investigated which medicines had been included in other price surveys. Three price surveys were considered as relevant: the COWI report [21], the voluntary internal price exchange exercise INFOPRICE among EU Member States in the framework of the Transparency Committee [39] and an orphan medicines survey [40]. We aimed to achieve a balance between the on-patent and off-patent segments: Wherever generics were available, we intended to survey the prices of both originator medicines and generics. We excluded medicines with limited comparability, e.g. due to different dosage forms or bulk packages in the different countries. In a final stage, we also checked the availability of the medicines, and their commonly available dosage and pharmaceutical form, in the five countries in order to get an idea about frequently used presentations. We based the availability check on the Pharma Price Information (PPI) service of Gesundheit Österreich GmbH (Austrian Health
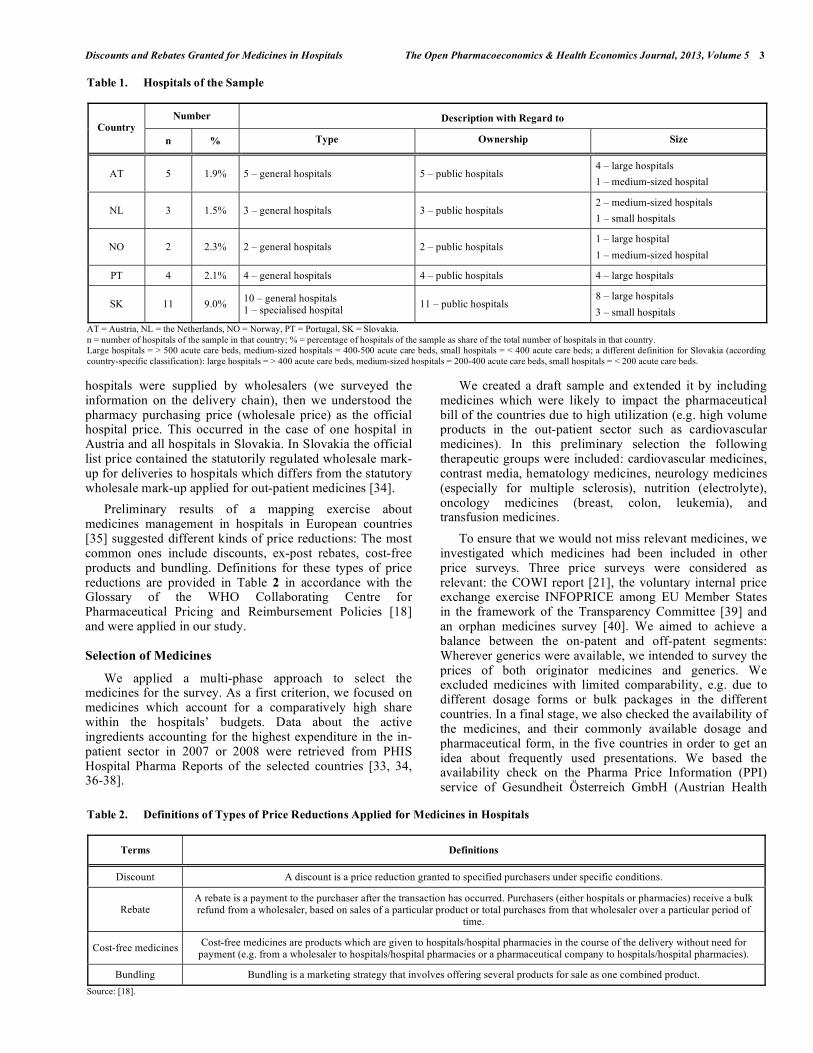
Table 1. Hospitals of the Sample
Number Description with Regard to Country
n % Type Ownership Size
AT 5 1.9% 5 – general hospitals 5 – public hospitals 4 – large hospitals
1 – medium-sized hospital
NL 3 1.5% 3 – general hospitals 3 – public hospitals 2 – medium-sized hospitals
1 – small hospitals
NO 2 2.3% 2 – general hospitals 2 – public hospitals 1 – large hospital
1 – medium-sized hospital
PT 4 2.1% 4 – general hospitals 4 – public hospitals 4 – large hospitals
SK 11 9.0% 10 – general hospitals 1 – specialised hospital
11 – public hospitals 8 – large hospitals
3 – small hospitals
AT = Austria, NL = the Netherlands, NO = Norway, PT = Portugal, SK = Slovakia. n = number of hospitals of the sample in that country; % = percentage of hospitals of the sample as share of the total number of hospitals in that country. Large hospitals = > 500 acute care beds, medium-sized hospitals = 400-500 acute care beds, small hospitals = < 400 acute care beds; a different definition for Slovakia (according country-specific classification): large hospitals = > 400 acute care beds, medium-sized hospitals = 200-400 acute care beds, small hospitals = < 200 acute care beds.
Table 2. Definitions of Types of Price Reductions Applied for Medicines in Hospitals
Terms Definitions
Discount A discount is a price reduction granted to specified purchasers under specific conditions.
Rebate A rebate is a payment to the purchaser after the transaction has occurred. Purchasers (either hospitals or pharmacies) receive a bulk refund from a wholesaler, based on sales of a particular product or total purchases from that wholesaler over a particular period of
time.
Cost-free medicines Cost-free medicines are products which are given to hospitals/hospital pharmacies in the course of the delivery without need for payment (e.g. from a wholesaler to hospitals/hospital pharmacies or a pharmaceutical company to hospitals/hospital pharmacies).
Bundling Bundling is a marketing strategy that involves offering several products for sale as one combined product.
Source: [18].
4 The Open Pharmacoeconomics & Health Economics Journal, 2013, Volume 5 Vogler et al.
Institute) which comprises, mainly out-patient, medicine prices of 30 European countries [41].
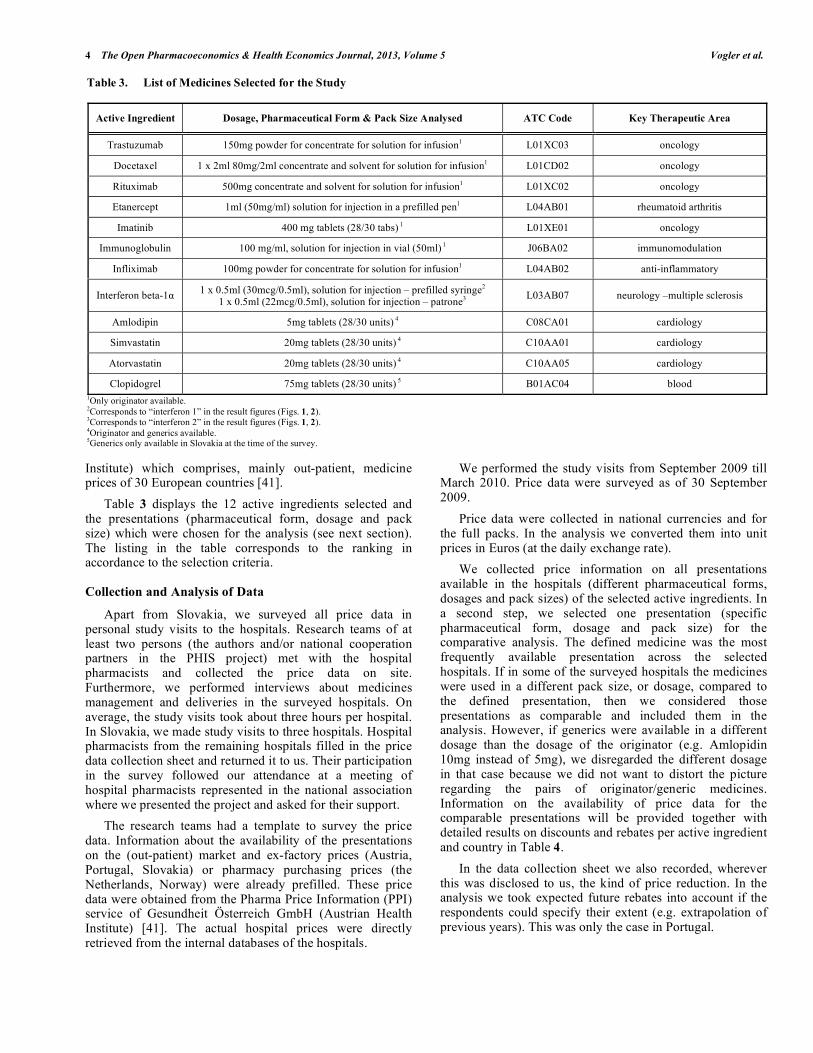
Table 3 displays the 12 active ingredients selected and the presentations (pharmaceutical form, dosage and pack size) which were chosen for the analysis (see next section). The listing in the table corresponds to the ranking in accordance to the selection criteria.
Collection and Analysis of Data
Apart from Slovakia, we surveyed all price data in personal study visits to the hospitals. Research teams of at least two persons (the authors and/or national cooperation partners in the PHIS project) met with the hospital pharmacists and collected the price data on site. Furthermore, we performed interviews about medicines management and deliveries in the surveyed hospitals. On average, the study visits took about three hours per hospital. In Slovakia, we made study visits to three hospitals. Hospital pharmacists from the remaining hospitals filled in the price data collection sheet and returned it to us. Their participation in the survey followed our attendance at a meeting of hospital pharmacists represented in the national association where we presented the project and asked for their support.
The research teams had a template to survey the price data. Information about the availability of the presentations on the (out-patient) market and ex-factory prices (Austria, Portugal, Slovakia) or pharmacy purchasing prices (the Netherlands, Norway) were already prefilled. These price data were obtained from the Pharma Price Information (PPI) service of Gesundheit Österreich GmbH (Austrian Health Institute) [41]. The actual hospital prices were directly retrieved from the internal databases of the hospitals.
We performed the study visits from September 2009 till March 2010. Price data were surveyed as of 30 September 2009.
Price data were collected in national currencies and for the full packs. In the analysis we converted them into unit prices in Euros (at the daily exchange rate).
We collected price information on all presentations available in the hospitals (different pharmaceutical forms, dosages and pack sizes) of the selected active ingredients. In a second step, we selected one presentation (specific pharmaceutical form, dosage and pack size) for the comparative analysis. The defined medicine was the most frequently available presentation across the selected hospitals. If in some of the surveyed hospitals the medicines were used in a different pack size, or dosage, compared to the defined presentation, then we considered those presentations as comparable and included them in the analysis. However, if generics were available in a different dosage than the dosage of the originator (e.g. Amlopidin 10mg instead of 5mg), we disregarded the different dosage in that case because we did not want to distort the picture regarding the pairs of originator/generic medicines. Information on the availability of price data for the comparable presentations will be provided together with detailed results on discounts and rebates per active ingredient and country in Table 4.
In the data collection sheet we also recorded, wherever this was disclosed to us, the kind of price reduction. In the analysis we took expected future rebates into account if the respondents could specify their extent (e.g. extrapolation of previous years). This was only the case in Portugal.
Table 3. List of Medicines Selected for the Study
Active Ingredient Dosage, Pharmaceutical Form & Pack Size Analysed ATC Code Key Therapeutic Area
Trastuzumab 150mg powder for concentrate for solution for infusion1 L01XC03 oncology
Docetaxel 1 x 2ml 80mg/2ml concentrate and solvent for solution for infusion1 L01CD02 oncology
Rituximab 500mg concentrate and solvent for solution for infusion1 L01XC02 oncology
Etanercept 1ml (50mg/ml) solution for injection in a prefilled pen1 L04AB01 rheumatoid arthritis
Imatinib 400 mg tablets (28/30 tabs) 1 L01XE01 oncology
Immunoglobulin 100 mg/ml, solution for injection in vial (50ml) 1 J06BA02 immunomodulation
Infliximab 100mg powder for concentrate for solution for infusion1 L04AB02 anti-inflammatory
Interferon beta-1 1 x 0.5ml (30mcg/0.5ml), solution for injection – prefilled syringe2 1 x 0.5ml (22mcg/0.5ml), solution for injection – patrone3
L03AB07 neurology –multiple sclerosis
Amlodipin 5mg tablets (28/30 units) 4 C08CA01 cardiology
Simvastatin 20mg tablets (28/30 units) 4 C10AA01 cardiology
Atorvastatin 20mg tablets (28/30 units) 4 C10AA05 cardiology
Clopidogrel 75mg tablets (28/30 units) 5 B01AC04 blood 1Only originator available. 2Corresponds to “interferon 1” in the result figures (Figs. 1, 2). 3Corresponds to “interferon 2” in the result figures (Figs. 1, 2). 4Originator and generics available. 5Generics only available in Slovakia at the time of the survey.

Discounts and Rebates Granted for Medicines in Hospitals The Open Pharmacoeconomics & Health Economics Journal, 2013, Volume 5 5
Both official hospital list prices and actual hospital prices were surveyed and analyzed as net prices, i.e. excluding the value added tax. Discounts were determined by calculating the difference between the official hospital list price and the actual hospital price; additional information on discounts and rebates (e.g. confidential agreements) was considered.
Since in Slovakia four of the eleven hospitals were in the metropolitan region under the same ownership and displayed identical data, we decided to merge their data and to interpret them as one hospital in the analysis.
RESULTS
In all five countries price reductions in the form of discounts, rebates or cost-free medicines were identified for some of the medicines surveyed.
Overall Picture on Price Reductions for the Surveyed Medicines
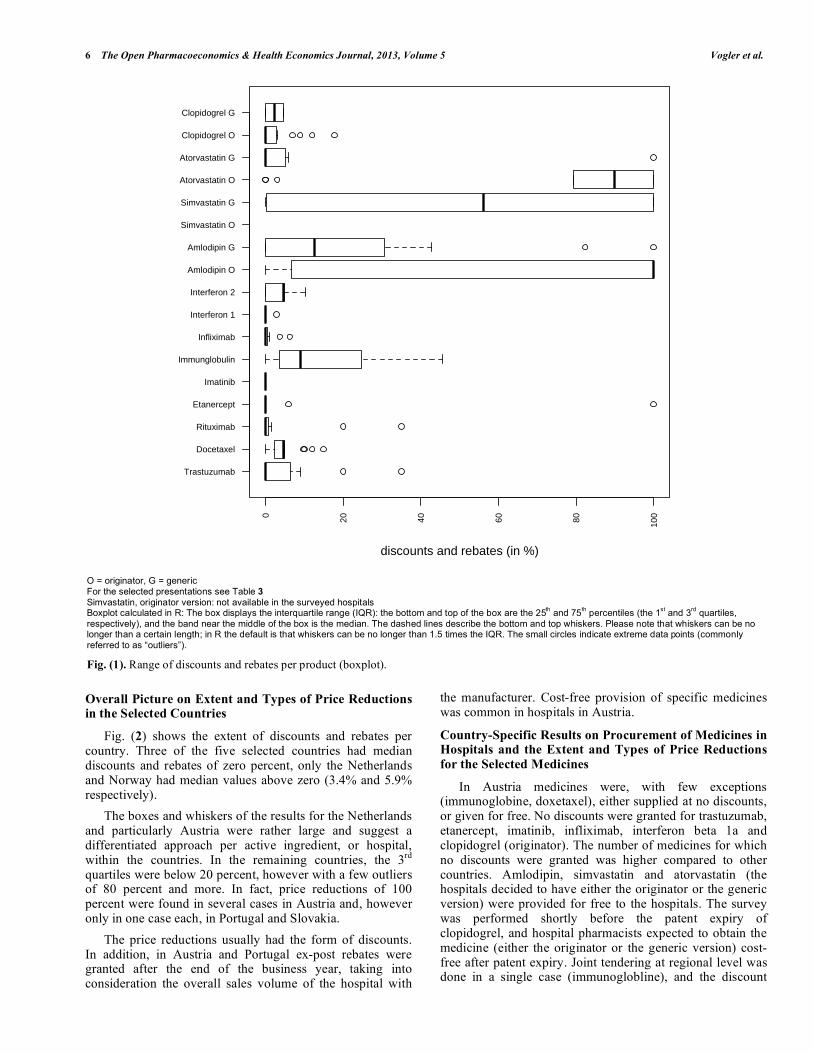
The existence and extent of the discounts and rebates varied across the different medicines (Fig. 1): The median price reduction was zero for several active ingredients
(trastuzumab, rituximab, etancerpt, imatinib, infliximab, interferon – prefilled syringe presentation, atorvastin/generic versions, clopidogrel/originator). While the whiskers of the boxes in the boxplot tended to be rather short for these products, there were cases of outliers for some of the medicines. Imatinib was the only medicine which was never provided at a reduced price in any of the hospitals. Most of these medicines for which no or only little discounts and rebates were granted were on-patent oncology medicines.
A major part of the remaining medicines in the sample were cardiovascular medicines, and most of them had generic alternatives available. For these products higher median discounts and rebates were observed, amounting to 50 percent and more, and the interquartile ranges and the whiskers were larger.
In the cases of originator and generics being available in all selected countries (these were only amlodipin and atorvastatin, since clopidogrel was off-patent in only one country at the time of the survey), discounts and rebates for the originator version were overall higher than for the generics.
Table 4. Price Reductions Granted for Medicines in Hospitals in Five European Countries, Minimum, Median and Maximum
Value Per Selected Presentation and Country
Medicines Austria (n=5) Netherlands (n=3) Norway (n=2*) Portugal (n=4) Slovakia (n=8**)
Min. (in %) – Max (in %), Median (in %), Number of Hospitals with the Defined Presentation Available
Trastuzumab 0.0 - 0.0; 0.0; 4 R 0.0 - 0.0; 0.0; 3 3.7 20.0 - 35.0; 27.5; 2 R 9.1 - 9.1; 9.1; 2
Docetaxel 4.7 - 4.8; 4.8; 4 R 2.0 - 3.1; 2.5; 3 9.8 10.0 - 12.0; 5.5; 2 4.4 - 15.0; 5.6; 6
Rituximab 0.0 - 0.0; 0.0; 5 0.0 - 0.0; 0.0; 3 1.6 20.0 - 35.0; 27.5; 2 R 0.0 - 0.0; 0.0; 1
Etanercept 0.0 - 0.0; 0.0; 4 n.a., n.a.; 0 5.9 0.0 - 0.0; 0.0; 4 R 100.0-100.0; 100.0; 1
Imatinib 0.0 - 0.0; 0.0; 4 0.0 - 0.0; 0.0; 1 0.0 0.0 - 0.0; 0.0; 4 R 0.0 - 0.0; 0.0; 1
Immunoglobulin 22.8 - 26.9; 24.4; 5 45.5 - 45.6; 45.5; 2 5.2 8.0 - 8.0; 8.0; 1 R 0.0 - 12.2; 4.3; 8
Infliximab 0.0 - 0.6; 0.1; 5 0.0 - 3.5; 1.6; 3 6.3 0.0 - 0.0; 0.0; 4 R 0.0 - 0.0; 0.0; 1
Interferon beta-1 – brand 1 0.0 - 0.0; 0.0; 4 0.0 - 0.0; 0.0; 1 0.0 n.k., n.k.; 1 0.0 - 2.9; 1.0; 3
Interferon beta-1 – brand 2 0.0 - 0.0; 0.0; 4 n.a., n.a.; 0 0.0 6.0 - 10.2; 5.5; 4 4.7 - 4.8; 4.7; 5
Amlodipin – O 100.0-100.0; 100.0; 4 n.a., n.a.; 0 13.6 0.0 - 0.0; 0.0; 1 R 0.0 - 0.0; 0.0; 1
Amlodipin – G 0.0 - 100.0; 100.0; 1 26.8 - 43.8, 34.7; 3 82.3 0.0 - 0.0; 0.0; 3 R 0.0 - 16.6; 7.4; 7
Simvastatin – O n.a., n.a.; 0 n.a., n.a.; 0 n.a. n.a., n.a.; 0 n.a., n.a.; 0
Simvastatin – G 100.0-100.0; 100.0; 5 53.2 - 66.0, 59.4; 3 86.4 0.0 - 25.0; 12.5; 2 R 0.1 - 8.1; 1.7; 5
Atorvastatin – O 100.0-100.0; 100.0; 5 89.5 - 90.0, 89.8; 3 79.2 0.0 - 100.0; 25,8; 4 R n.a., n.a.; 0
Atorvastatin – G n.a., n.a.; 0 n.a., n.a.; 0 0.0 n.a., n.a.; 0 0.0 - 100.0; 15.8; 7
Clopidogrel – O 0.0 - 0.0; 0.0; 4 R 3.2 - 17.8, 10.0; 3 7.0 0.0 - 12.0; 3.0; 4 R 0.0 - 2.8; 0.3; 8
Clopidogrel – G n.a., n.a.; 0 n.a., n.a.; 0 n.a. n.a., n.a.; 0 0.1 - 4.5; 2.3; 2
G = generic, n = number of hospitals in the country, n.a. = presentation not available in the hospital, n.k. = price/discount not known, O = originator, R = at least one hospital in the country reported on the existence of ex-post rebates (some hospitals specified the amount of rebates based on experience of the previous years; other did not). * Data were collected from two hospitals, but not documented separately. So the data need to be understood as for one hospital; thereof no minimum, maximum and average values are indicated. ** Data were collected from 11 hospitals, however four of them in the metropolitan region were under the same ownership. Since they displayed identical data, it was decided to merge the data. How to read this table: 0.0 = the hospital gets no discount and pays the full price; 22.8 = the hospital gets a discount of 22.8%; 100 = the hospital does not pay for the medicine (for different reasons: medicines might be supplied cost-free by the manufacturer, the procurement is done at central level and not by the individual hospital, a mix of discounts and rebates is provided which sums up to 100 percent). Data in italics: central/regional tendering: e.g. tendering by the central procurement agency LIS in Norway, regional tendering of immunoglobulin by one hospital in Austria, tendering of some high-cost medicines by the General Social Insurance in Slovakia.
6 The Open Pharmacoeconomics & Health Economics Journal, 2013, Volume 5 Vogler et al.
Overall Picture on Extent and Types of Price Reductions in the Selected Countries
Fig. (2) shows the extent of discounts and rebates per country. Three of the five selected countries had median discounts and rebates of zero percent, only the Netherlands and Norway had median values above zero (3.4% and 5.9% respectively).
The boxes and whiskers of the results for the Netherlands and particularly Austria were rather large and suggest a differentiated approach per active ingredient, or hospital, within the countries. In the remaining countries, the 3rd quartiles were below 20 percent, however with a few outliers of 80 percent and more. In fact, price reductions of 100 percent were found in several cases in Austria and, however only in one case each, in Portugal and Slovakia.
The price reductions usually had the form of discounts. In addition, in Austria and Portugal ex-post rebates were granted after the end of the business year, taking into consideration the overall sales volume of the hospital with
the manufacturer. Cost-free provision of specific medicines was common in hospitals in Austria.
Country-Specific Results on Procurement of Medicines in Hospitals and the Extent and Types of Price Reductions
for the Selected Medicines
In Austria medicines were, with few exceptions (immunoglobine, doxetaxel), either supplied at no discounts, or given for free. No discounts were granted for trastuzumab, etanercept, imatinib, infliximab, interferon beta 1a and clopidogrel (originator). The number of medicines for which no discounts were granted was higher compared to other countries. Amlodipin, simvastatin and atorvastatin (the hospitals decided to have either the originator or the generic version) were provided for free to the hospitals. The survey was performed shortly before the patent expiry of clopidogrel, and hospital pharmacists expected to obtain the medicine (either the originator or the generic version) cost-free after patent expiry. Joint tendering at regional level was done in a single case (immunoglobline), and the discount
O = originator, G = generic For the selected presentations see Table 3
Simvastatin, originator version: not available in the surveyed hospitals Boxplot calculated in R: The box displays the interquartile range (IQR): the bottom and top of the box are the 25
th and 75
th percentiles (the 1
st and 3
rd quartiles,
respectively), and the band near the middle of the box is the median. The dashed lines describe the bottom and top whiskers. Please note that whiskers can be no longer than a certain length; in R the default is that whiskers can be no longer than 1.5 times the IQR. The small circles indicate extreme data points (commonly referred to as “outliers”).
Fig. (1). Range of discounts and rebates per product (boxplot).
Trastuzumab
Docetaxel
Rituximab
Etanercept
Imatinib
Immunglobulin
Infliximab
Interferon 1
Interferon 2
Amlodipin O
Amlodipin G
Simvastatin O
Simvastatin G
Atorvastatin O
Atorvastatin G
Clopidogrel O
Clopidogrel G
0
20
40
60
80
100
discounts and rebates (in %)

Discounts and Rebates Granted for Medicines in Hospitals The Open Pharmacoeconomics & Health Economics Journal, 2013, Volume 5 7
achieved was slightly higher compared to the one achieved by the four hospitals which had negotiated on their own. In all other cases, medicines were purchased in direct negotiations between hospitals and manufacturers (or the wholesaler, in the case of one hospital). For clopidogrel and docetaxel ex-post rebates were expected, and an extra vial was given for free to hospitals on procuring docetaxel.
In the Netherlands, no discounts were granted for trastuzumab, rituximab and imatinib and interferon beta 1a and minor discounts for further oncology medicines and an anti-flammatory product. Higher discounts (between 26 and 90 percent) were granted for cardiovascular medicines. Though discounts on the same medicines differed slightly across the three hospitals, they were more or less in the same dimension. All three hospitals individually procured the medicines.
In Norway the procurement agency LIS centrally procured medicines for all public hospitals. LIS defined a preferred presentation and tendered for it. LIS was able to obtain discounts for all medicines of the sample which they had tendered for. There were, however, differences across the therapeutic groups and between the segments of on-patent or off-patent medicines. For on-patent high-cost oncology medicines (such as trastuzumab, rituzimab) rather low discounts (around five percent) were granted. Yet, Norway was, besides Slovakia, the only country which obtained discounts on these medicines (Portuguese hospitals
received rebates due to bundling). For medicines where generics were available, LIS obtained discounts of around 80 percent – no matter whether they opted for tendering the originator or generic versions. Medicines not tendered by LIS (e.g. different pack sizes, dosages) were purchased individually by the hospitals, and in these cases hospitals usually had to pay the full official list price. Overall, Norway had the highest median of the price reductions.
In Portugal the Central Administration of the Health System (ACSS), a federal entity, tendered for a range of medicines used in hospitals, and set an official tendering price which was usually valid for a few years. In a second step, hospitals individually purchased the medicines they needed, and they could obtain price reductions during the procurement process. The most frequently identified price reductions were ex-post rebates, with a bundling element, since these rebates were granted for a specific sales volume on all medicines of a supplier during a year. Ex-post rebates were usually in the range of ten to 30 percent.
Slovakia was the country in the sample with the lowest number of products available in the hospitals. Discounts could be obtained but usually they were lower compared to the other countries. Several medicines were subject to a limited tender process, which required evaluating bids from three suppliers (so-called “market surveillance”). In our sample, immunoglobulin, amolodipin and clopidogrel were procured via this limited tendering process. We found that
AT = Austria, NL = the Netherlands, NO = Norway, PT = Portugal, SK = Slovakia For the selected presentations see Table 3 Boxplot calculated in R: The box displays the interquartile range (IQR): the bottom and top of the box are the 25
th and 75
th percentiles (the 1
st and 3
rd quartiles,
respectively), and the band near the middle of the box is the median. The dashed lines describe the bottom and top whiskers. Please note that whiskers can be no longer than a certain length; in R the default is that whiskers can be no longer than 1.5 times the IQR. The small circles indicate extreme data points (commonly referred to as “outliers”).
Fig. (2). Range of discounts and rebates granted for medicines per country (boxplot).
AT NL NO PT SK
02
040
6080
100
disc
oun
ts a
nd r
ebat
es (
in %
)

8 The Open Pharmacoeconomics & Health Economics Journal, 2013, Volume 5 Vogler et al.
one specific dosage was procured by “market surveillance”, whereas another dosage of the same active ingredient was purchased via individual negotiations between the supplier and the hospital. Results did not show a clear picture as to whether the “market surveillance” process led to higher discounts compared to negotiations, and the extent of discounts varied across the hospitals even if they all applied this limited tendering process. The highest discounts, still comparatively low with regard to other countries, were obtained when the General Health Insurance centrally tendered medicines, which they did for high-cost medicines. In our sample docetaxel (discounts between 4% and 15%) and interferon (5%) were centrally tendered. A few products were provided for free (as a “gift”) to some of the hospitals; among the presentations selected for the comparative analysis this occurred in one case (Atorvastatin 20mg, 30 tabs, generic version).
Detailed results on minimum, median and maximum values per active ingredient and country are provided in Table 4.
DISCUSSION
The price survey confirms the existence of discounts and rebates granted for medicines used in hospitals in European countries. It provides evidence to the anecdotic knowledge about this issue, and, at the same time, it challenges the wide-spread belief that all medicines in hospitals are granted price reductions. Cardiovascular medicines tended to be granted high discounts and rebates or were provided for free whereas the prices of on-patent oncology medicines were not discounted at all.
The results show a heterogeneous picture concerning the types of price reductions in the surveyed countries. Specific types of discounts were very common in a few countries (e.g. rebates in Portugal), but not reported from others. The practice of supplying medicines cost free to hospitals, which is permitted in some European countries and forbidden in others [29], was confirmed for Austria: the results suggest a broad use of cost-free provision of particular medicines. It can be speculated that specific arrangements such as rebates combined with bundling and cost-free provision of medicines might be incentivized by decentralized procurement processes which, as the literature suggests, are characterized by biased decisions and less quality information compared to centralized tendering [42].
The highest median price reduction was reported from Norway. Looking at the individual values in Norway, the highest discounts were obtained when central tendering was done by the procurement agency LIS. The hypothesis that central procurement might obtain better prices has been discussed in the literature but empirical evidence is scarce [43]. Our study cannot provide a definite answer as to whether centralized procurement is able to systematically obtain lower prices compared to decentralized processes. But our price data on some centralized or joint procurement (LIS in Norway, procurement by the General Health Insurance in Slovakia, one case of regional joint tendering in Austria) appear to support this assumption. Further, our findings challenge the suppliers’ statement that hospitals would be granted a “premium price” in return for confidential
agreements. In fact, the surveyed hospitals of each country received more or less the same extent of discounts and rebates, with the exception of Slovakia where hospitals frequently apply a limited tendering process.
While there were country-specific variances on the extent and type of discounts and rebates, we could identify a homogeneous pattern across the different countries about which medicines were likely to obtain price reductions, and which not. No, or only minor, discounts are granted for on-patent, usually high-cost medicines such as oncology medicines where hospitals have no alternative but to purchase them. During the interviews hospital pharmacists commented that they were fully aware of their inability to obtain price reductions on these medicines since, due to the “monopoly situation” of these products, their purchasing power was limited. However, (considerable) price reductions were obtained for medicines when competitor products were available, no matter whether those were generics (e.g. simvastatin) or not (immunoglobins).
Hospitals’ procurement of medicines at discounts, including the cost-free provision of medicines, has an impact beyond the in-patient sector. Studies have shown how the start of a treatment during the hospital stay can influence future medication in the out-patient sector after a patient has been discharged [23-27]. Therefore, manufacturers are motivated to grant large discounts, up to 100 percent, for medicines which are of strategic relevance for them, i.e. medicines to start treatment in hospitals and to be continued long-term in the out-patient sector. In fact, our findings show that cardiovascular medicines are regularly granted high price reductions or are provided for free in a few countries. Interestingly, in our sample it tended to be the originator versions which were granted high discounts and rebates or were even provided cost-free. These findings suggest that the suppliers of the originator medicines were the first to offer the high price reductions in order to ensure the use of their product in the starting therapy in hospital care.
During the interviews, hospital pharmacists stated that they were happy to accept discounts, rebates and cost-free medicines offered to them: They are required to procure medicines in a cost-effective way to minimize the burden on the hospital pharmaceutical budget which they are responsible for. Hospital pharmacists appeared to be fully aware of the impact of highly discounted medicines on the out-patient sector, but they would not be rewarded for applying an integrative system perspective.
Both hospital pharmacists’ behaviour as well as the pricing strategies applied by the suppliers are incentivized by the underlying national policy frameworks. In the countries surveyed, as well as in other European countries [29], the pharmaceutical system is characterized by two distinct sectors, with different payers for the pharmaceutical bill in the out-patient and hospital sectors. Out-patient medicines expenses are, at least partially, covered by third party payers such as the National Health Service (Norway, Portugal) or a social health insurance (Austria, the Netherlands, Slovakia). For in-patients, medication costs are fully covered and paid out of the hospital budgets, which are funded by the hospital owners (e.g. regions, state, and municipalities) [33, 34, 36-38].

Discounts and Rebates Granted for Medicines in Hospitals The Open Pharmacoeconomics & Health Economics Journal, 2013, Volume 5 9
Our findings highlight the need for designing and implementing appropriate pharmaceutical policies at the interface of the in-patient and out-patient sectors. Some joint funding mechanisms exist in the surveyed countries: In Norway hospitals pay for specific medicines such as tumor necrosis factor (TNF) medicines and medicines for the treatment of multiple sclerosis that patients need after hospital discharge. The funding of these medicines was transferred from the national out-patient funding scheme to hospital budgets in 2006 and 2008 respectively [29]. In the Netherlands, high-cost medicines are 80 percent funded by the social insurance with the remaining costs covered from the hospital budget (orphan medicines are 100 percent covered) [37]. In Slovakia, as said, the General Health Insurance centrally tenders for high-cost medicines used in hospitals [34], and in Austria sickness funds in two of the nine provinces cover the cost of oncology medicines used in hospitals [38]. The authors consider these approaches to be valuable initiatives with representatives of both sectors to create a common understanding and a joint responsibility for the pharmaceutical bill. Since high-cost medicines are targeted, these measures are expected to have considerable economic impact.
Still, these measures appear not to be sufficient since discounts do not occur in the high cost on-patent segment but they were particularly observed on lower priced, high volume medicines. Good practice examples which can serve as models of interface management policies are joint reimbursement lists and joint Drugs and Therapeutics Committees (e.g. in the Stockholm County in Sweden [44], or Scotland [45]), which address both the out-patient and in-patient sectors.
This study has some limitations. We could not collect the required price data in all cases for different reasons. First, we always needed both the official hospital prices and the actual hospital prices. In some cases (e.g. Portugal), not all medicines had an ex-factory price (due to regulation before 2006) and we had to interpret tendering prices from central procurement as official prices. Second, the selected presentations chosen for the analysis were not used in some of the surveyed hospitals. Where appropriate, we included an alternative presentation in the analysis (e.g. docetaxel, 1 x 2ml (40mg/2ml) instead of the reference presentation of docetaxel, 1 x 2ml (80mg/2ml). Third, the price reductions are likely to be underestimated because the extent of ex-post rebates could not be considered in all cases.
The study is an exploratory piece of research which aimed to bring insight into an area where little evidence has been published. Since we had to work on a limited sample of countries and hospitals, the study cannot be considered representative. The number of hospitals included per country varies and is quite low for some of the selected countries.
Notwithstanding these limitations, the study provides an addition to existing knowledge. Medicines management in hospitals has been a rather unknown field for researchers and policy-makers for a long time, and the investigation of pharmaceutical policies in the in-patient sector has been urged [31]. Surveys of medicine prices have usually focused on the out-patient sector [14-16]. To our knowledge, this is the first study in Europe surveying the difference between official and actual prices in hospitals. The findings of our
study build on a survey about estimated discounts and rebates in the hospital setting in European countries, but that survey was not performed at product level [29]. Furthermore, we were successful in gaining access to unpublished medicine price information which is confidential in many countries. Finally, we developed a methodology which can be used to replicate the survey in further countries.
The study is a valuable starting point for political discussions about the impact of confidential arrangements on prices and the need for more transparency of medicine prices. It is recommended that the evidence base be extended by performing the survey in further countries.
CONCLUSION
This study shows that discounts and rebates are granted for some medicines for hospital use. The results suggest product-specific patterns. Hospitals appear to have little leeway to negotiate price reductions for medicines which do not have therapeutic alternatives. High price reductions, including cost-free provision of medicines, tend to be granted for products whose treatment is likely to continue in primary care after the patient is discharged from hospital. These pricing strategies appear to be incentivized by the existing dual financing systems involving different payers in the out-patient and in-patient sectors. Our findings highlight the need for policy measures which are able to bridge the gap between the out-patient and in-patient sectors. The results also suggest that central procurement is likely to result in higher discounts which might be attributable to the stronger market purchasing power of a single purchaser. Further research is recommended to better understand the reasons for the variances in type and extent of price reductions among countries, to investigate the impact of different procurement processes, and to clarify whether a replication of the study in other European countries will show similar results.
CONFLICT OF INTEREST
The authors confirm that this article content has no conflict of interest.
ACKNOWLEDGEMENTS
We thank the hospital pharmacists of the 25 hospitals for their willingness to participate in this study. We are very grateful that they shared with us the data which were of confidential character in most cases and that they took the time to answer our questions during the interviews. Since we assured anonymity of the hospitals concerned, we will not disclose the names of data providers.
The development of the methodology and the collection of the price data were done in the framework of the PHIS (Pharmaceutical Health Information System) project. All authors of this study were members of the PHIS project management consortium. The PHIS project, which ran from September 2008 to April 2011, was commissioned by the Executive Agency for Health and Consumers (EAHC) under the call for proposals 2007 in the priority area “health information” of the European Commission, Directorate-General Public Health and Consumers, and it was co-funded by the Austrian Federal Ministry of Health.
As a follow-up on the PHIS project, we analyzed the full sample of price data with the research focus on discounts and

10 The Open Pharmacoeconomics & Health Economics Journal, 2013, Volume 5 Vogler et al.
rebates, and we wrote this manuscript. No separate funding was provided for this work.
REFERENCES
[1] Simoens S. A review of generic medicine pricing in Europe. GaBI J 2012; 1(1): 8-12.
[2] Dylst P, Simoens S. Generic Medicine Pricing Policies in Europe: Current Status and Impact. Pharmaceuticals 2010; 3(3): 471-81.
[3] Lopes S, Marty C, Berdai D. PHIS Pharma Profile France. Vienna: Gesundheit Österreich GmbH/Geschäftsbereich ÖBIG 2011.
[4] Kanavos P, Taylor D. Pharmacy discounts on generic medicines in France: is there room for further efficiency savings? Curr Med Res Opin 2007; 23(10): 2467-76.
[5] Kanavos P. Do generics offer significant savings to the UK National Health Service? Curr Med Res Opin 2007; 23(1): 105-16.
[6] Simoens S. Developing competitive and sustainable Polish generic medicines market. Croat Med J 2009; 50(5): 440-8.
[7] Vogler S, Zimmermann N, Habl C, Piessnegger J, Bucsics A. Discounts and rebates granted to public payers for medicines in European countries. South Med Rev 2012; 5(1): 38-46.
[8] Espín J, Rovira J, García L. Experiences and Impact of European Risk-Sharing Schemes Focusing on Oncology Medicines. Vienna: EMINET 2011.
[9] Kanavos P, Ferrario A, Espin J. Managed Entry Agreements for Pharmaceuticals: The European Experience. Vienna: EMINet 2011 (unpublished).
[10] Adamski J, Godman B, Ofierska-Sujkowska G, et al. Risk sharing arrangements for pharmaceuticals: potential considerations and recommendations for European payers. BMC Health Serv Res 2010; 10: 153.
[11] OECD. Pharmaceutical pricing policies in a global market. Paris: OECD 2008.
[12] WHO, Health Action International (HAI). Measuring medicine prices, availability, affordability and price components. 2nd ed. Geneva: WHO 2008.
[13] Cameron A, Ewen M, Ross-Degnan D, Ball D, Laing R. Medicine prices, availability, and affordability in 36 developing and middle-income countries: a secondary analysis. Lancet 2009; 373(9659): 240-9.
[14] Brekke KR, Holmås TH, Straume OR. Are Pharmaceuticals Still Inexpensive in Norway? A Comparison of Prescription Drug Prices in Ten European Countries. SNF report no. 08/10. Bergen: The Institute for Research in Economics and Business Administration 2010.
[15] Danzon PM, Chao LW. Cross-national price differences for pharmaceuticals: how large, and why? J Health Econ 2000; 19(2): 159-95.
[16] Walter E, Batista A, Brennig C, Zehetmayr S. Der österreichische Pharmamarkt – ein europäischer Vergleich. Vienna: Institut für Pharmaökonomische Forschung 2008.
[17] Simoens S. International comparison of generic medicine prices. Curr Med Res Opin 2007; 23(11): 2647-54.
[18] WHO Collaborating Centre for Pharmaceutical Pricing and Reimbursement Policies. Glossary of pharmaceutical terms. Latest update of print version: 2011; regularly updated online. Vienna 2011 [Accessed: March 25, 2013]; Available from: http: //whocc.goeg.at/Literaturliste/Dokumente/MethodologyTemplate/PHIS%20Glossary_UpdatedApril2011.pdf
[19] Leopold C, Vogler S, Mantel-Teeuwisse AK, de Joncheere K, Leufkens HG, Laing R. Differences in external price referencing in Europe-A descriptive overview. Health Policy 2012; 104(1): 60.
[20] Vogler S, Zimmermann N, Leopold C, Schmickl B, Windisch F. Impact of medicines price reductions in Greece and Spain on other European countries applying external price referencing. Poster. Drug Utilisation and Health Policy Meeting; Antwerp: EuroDURG 2011.
[21] COWI. Analysis of hospital pharmaceuticals. Copenhagen: Commissioned by Danish Ministry of Health and Prevention 2009 (unpublished).
[22] Vogler S, Zimmermann N, Mazag J. Procuring medicines in hospitals: results of the European PHIS survey. EJHP Pract 2011; 2011(2): 21.
[23] Gallini A, Legal R, Taboulet F. The influence of drug use in university hospitals on the pharmaceutical consumption in their surrounding communities. Br J Clin Pharmacol 2012; 7(10): 1365-2125.
[24] Feely J, Chan R, McManus J, O'Shea B. The influence of hospital-based prescribers on prescribing in general practice. Pharmacoecono-mics 1999; 16(2): 175-81.
[25] Prosser H, Almond S, Walley T. Influences on GPs' decision to prescribe new drugs-the importance of who says what. Fam Pract 2003; 20(1): 61-8.
[26] Schröder-Bernhardi D, Dietlein G. Lipid-lowering therapy: do hospitals influence the prescribing behavior of general practitioners? Int J Clin Pharmacol Ther 2002; 40(7): 317-21.
[27] Grimmsmann T, Schwabe U, Himmel W. The influence of hospitalisation on drug prescription in primary care--a large-scale follow-up study. Eur J Clin Pharmacol 2007; 63(8): 783-90.
[28] Hoebert J, Mantel-Teuwisse A. Pharmaceutical Health Information (PHIS) Evaluation Report. Utrecht: Utrecht WHO Collaborating Centre for Pharmacoepidemiology and Pharmaceutical Policy 2011.
[29] Vogler S, Habl C, Leopold C, Mazag J, Morak S, Zimmermann N. PHIS Hospital Pharma Report. Vienna: Pharmaceutical Health Information System; Gesundheit Österreich GmbH/Geschäftsbereich ÖBIG 2010.
[30] Vogler S, Habl C, Bogut M, Voncina L. Comparing pharmaceutical pricing and reimbursement policies in Croatia to the European Union Member States. Croat Med J 2011; 52(2): 183-97.
[31] Vogler S, Habl C, Leopold C, Rosian-Schikuta I. PPRI Report. Vienna: Gesundheit Österreich GmbH/Geschäftsbereich ÖBIG 2008.
[32] Vogler S. Preisbildung und Erstattung von Arzneimitteln in der EU - Gemeinsamkeiten, Unterschiede und Trends. Pharmazeutische Medizin 2012; 14(1): 56.
[33] Caldeira S, Furtado C, Vieira I, Baptista A. PHIS Hospital Pharma Report Portugal. Vienna: Pharmaceutical Health Information System (PHIS) 2010.
[34] Mazag J. PHIS Hospital Pharma Report Slovakia Vienna: Pharmaceutical Health Information System (PHIS) 2009.
[35] PHIS network members. PHIS Hospital Pharma Reports. Available from: http: //whocc.goeg.at/Publications/CountryReports: PHIS (Pharmaceutical Health Information System), 2009-2011.
[36] Aanes T, Ognøy AH, Festøy H. PHIS Hospital Pharma Report Norway. Vienna: Pharmaceutical Health Information System (PHIS) 2009.
[37] Storms H, Schreurs M. PHIS Hospital Pharma Report The Netherlands Vienna: Pharmaceutical Health Information System (PHIS) 2010.
[38] Zimmermann N, Vogler S. PHIS Hospital Pharma Report Austria. Vienna: Gesundheit Österreich GmbH/Geschäftsbereich ÖBIG 2009.
[39] European Commission Enterprise and Industry Directorate-General. Development of a database on pricing of medicinal products in the EU. Call for proposal. ACTION ENT/IMA/1.1.10.3.8. Brussels 2009.
[40] Habl C, Bachner F. Orphan medicines survey. Vienna: EMINet 2009 (unpublished).
[41] PPI. Pharma Price Information (PPI) service. Available at: www.goeg.at/en/PPI: Gesundheit Österreich GmbH (Austrian Health Institute) 2012.
[42] Vagstad S. Centralized vs decentralized procurement: Does dispersed information call for decentralized decision-making? Int J Int Organ 2000; 18(6): 949-63.
[43] Karjalainen K. Estimating the cost effects of purchasing centralization—Empirical evidence from framework agreements in the public sector. J Purch Supply Manage 2011; 17(2): 87-97.
[44] Gustafsson LL, Wettermark B, Godman B, et al. The ‘Wise List’– A Comprehensive Concept to Select, Communicate and Achieve Adherence to Recommendations of Essential Drugs in Ambulatory Care in Stockholm. Basic Clin Pharmacol Toxicol 2011; 108(4): 224-33.
[45] Herms S, Rutledge P. The Lothian Joint Formulary: overcoming the barriers to formulary success. Pharm Pract 2002; 12(6): 279-85.
Received: February 6, 2013 Revised: April 14, 2013 Accepted: April 20, 2013
© Vogler et al.; Licensee Bentham Open.
This is an open access article licensed under the terms of the Creative Commons Attribution Non-Commercial License (http://creativecommons.org/licenses/by-nc/3.0/) which permits unrestricted, non-commercial use, distribution and reproduction in any medium, provided the work is properly cited.