the operations trifecta logging, metrics, and apm · • elasticsearch 1.0 evolves to support a...
TRANSCRIPT

1
Tanya BraginJune 2018
Logging, Metrics, and APM: The Operations Trifecta

2
You know us for searching logs...

3
You heard we are good at metrics...

4
You recently learned we added APM

5

6
Benefits of Logs, Metrics, APM in one stack

7
Unified DashboardsSame UI for KPI summaries and root cause analysis

8
Unified AlertingTrigger off any operational data to provide unified SLA monitoring

9
Unified Machine LearningCorrelate multiple data sources for more intelligent anomaly detection

10
Operational gainsSingle technology for operational data saves on administrative costs

11
Evolution of Elasticsearch into Metrics Store

12
Elasticsearch for search and numerical analytics
12
Inverted Index for full-text search Columnar store for structured data
BKD Trees for numerical operations Rollups

13
• Elasticsearch primarily used for application search
• Lucene data structure: Inverted index
Elasticsearch beginnings
13
Circa 2010

14
• Elasticsearch 1.0 evolves to support a columnar store (built on top of Lucene “doc values”)
• Structured string and numerical data can be stored there for fast retrieval and summarization / analytics
Elasticsearch evolving to support analytics
14
~ 2010 to 2014
https://www.elastic.co/blog/elasticsearch-as-a-column-store

15
• Elasticsearch 5.0 adds more data structures for efficient storing and querying numbers (BKD Trees)
• These structures become the default storage for numerical and geospatial data in Elasticsearch
Elasticsearch storage efficiencies
15
2016
https://www.elastic.co/blog/searching-numb3rs-in-5.0
1-Dimension 2-Dimensions
16
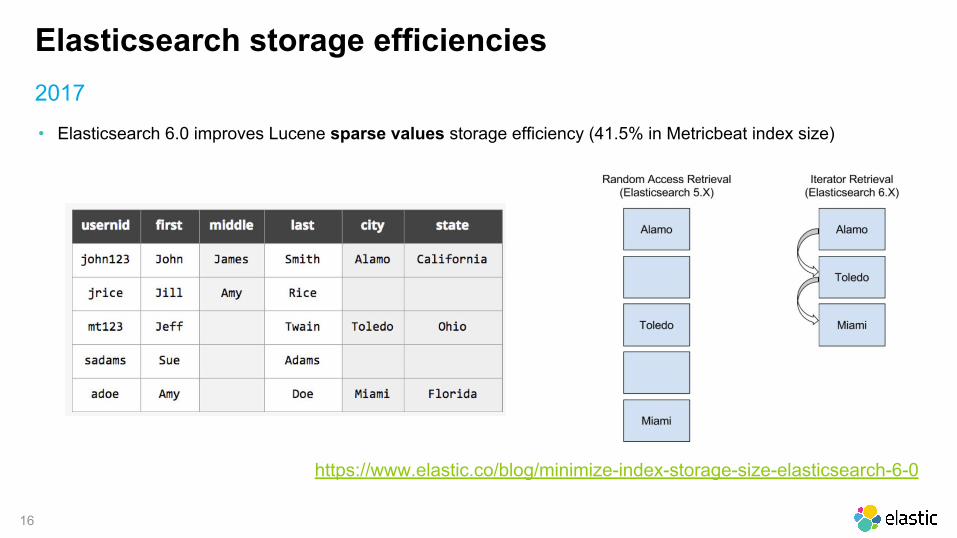
• Elasticsearch 6.0 improves Lucene sparse values storage efficiency (41.5% in Metricbeat index size)
Elasticsearch storage efficiencies
16
2017
https://www.elastic.co/blog/minimize-index-storage-size-elasticsearch-6-0

17
Roll-up support for long-term retentions
• Caveat: Lose ability to query individual events on rolled-up data
• Recommended for long retention use cases, such as capacity planning
• Can accomplish this today with Watcher-enabled rollups
• Built-in rollup support in active development
2018
https://www.elastic.co/blog/data-rollups-in-elasticsearch-you-know-for-saving-space

18
Elasticsearch for search and numerical analytics
18
Inverted Index for full-text search Columnar store for structured data
BKD Trees for numerical operations Rollups

19
Evolution of the rest of Elastic Stack into a Metrics Solution

Immediate insights with modules
• Turnkey experience for specific data types
• Data to dashboard in just one step
• Automated parsing and enrichment
• Default dashboards, alerts, ML jobs
Logging Metrics Security
Available with
20

21
Logging modules
21
System• Linux / MacOS• Windows Events
Containers• Docker• Kubernetes
Infrastructure Applications
Databases• MySQL• PostgreSQL
Queues• Kafka• Redis
Web servers• Apache• Nginx
Audit data• Filesystem• System calls
WINLOGBEATFILEBEATAUDITBEAT

22
Metrics modules
22
System• Linux• MacOS• Windows• Perfmon
Infrastructure
Cloud• AWS• GCP• Azure• DigitalOcean• Alibaba
Containers• Docker• Kubernetes
Virtualization• vSphere
PACKETBEATMETRICBEAT
Network• Netflow• Packets• TLS EnvelopeStorage• Ceph
LOGSTASHHEARTBEAT

23
Metrics modules
23
ApplicationsDatastores• MySQL• PostgreSQL• MongoDB• Couchbase• Aerospike• Graphite
Web servers• Apache• Nginx
Other• HAProxy• Zookeeper
Queues• Kafka• Redis• RabbitMQ
Caches• Memcached
Uptime• Heartbeat
Custom apps• JMX/Jolokia• PHP-FPM• Golang
PACKETBEATMETRICBEAT LOGSTASHHEARTBEAT

24
Roadmap: New operational data sources
New Beats, Logstash inputs
and modules
Default actions for existing modules
Agentless Shippers
• Cloud Monitoring (Azure, Amazon, GCP, …)
• Security Analytics (Bro, Suricata, Sysmon,…)
• Machine Learning jobs for Docker/Kubernetes
• Default alerts for top 5 modules
• Deploy as functions
• Ship data without needing to tent to infrastructure

• Correlate data from different sources• Ability to re-use analysis content • Ability to re-use Elastic-provided content
Preview: Elastic Common Schema
25
Benefits
• Version 0.1 published: https://github.com/elastic/ecs• Working with internal groups to validate• Community feedback welcome!
Status

26
Visualizing time series data
• Timelion
• Time Series Visual Builder
• Annotations

27
Visualizing time series data
• Timelion
• Time Series Visual Builder
• Annotations

28
Visualizing time series data
• Timelion
• Time Series Visual Builder
• Annotations

29
Completing the Trifecta with APM

30
• Open-source alternative to traditional APM tools
• Focused on underserved areas by traditional vendors
• Active roadmap to expand programming languages
Elastic APM
30
APM adds end-user experience and application-level monitoring to the stack
Language support
Current
● Python
● Node.js
● Ruby (Beta)
● RUM (Beta)
In Development
● Java (Beta)
● Go (Alpha)

31
Dedicated APM UI Great overview and drill-down with industry standard visualizations

32
Roadmap: Distributed TracingTrace across multiple services and map services
• See the end-to-end view and navigate to individual transactions
• Based on the notion of a end-to-end Trace ID across services
• Investigating compatibility with OpenTracing API and aligning with W3C trace context spec

33
Roadmap: Ad-hoc search in curated UICombine custom workflow with freedom of search•

34
APM is another index in ElasticsearchNeed another visualization? Build a dashboard, no need to wait for your vendor

35
Logs, metrics, and APM data in a single place

3636
DEMO

37
Demo flow
• Bringing it all together from ElasticON (10 mins)‒ Demo: Website
‒ Demo: Kibana
‒ More detailed script
‒ Recording (skip to 51:30)
• Have backup screenshots in PDF slides in case network goes down‒ Link to Google Drive
Source: Gray Arial 10pt
38
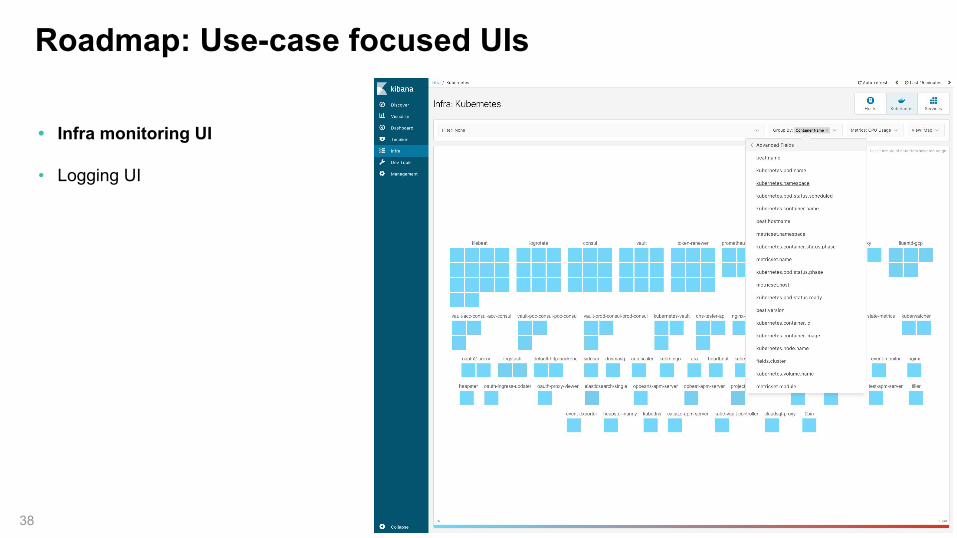
• Infra monitoring UI
• Logging UI
Roadmap: Use-case focused UIs
38


40
• Infra monitoring UI
• Logging UI
Roadmap: Use-case focused UIs
40

41
Roadmap: Use-case focused UIs
41

42
What now?Try it yourself!

43
What now?Try it yourself!

44
What now?Try it yourself!

45
Come to Speaker AMA!
Questions?