the optimality of sensory processing during the speed–accuracy
TRANSCRIPT

Behavioral/Systems/Cognitive
The Optimality of Sensory Processing during theSpeed–Accuracy Tradeoff
Tiffany Ho,1 Scott Brown,3 Leendert van Maanen,4 Birte U. Forstmann,4 Eric-Jan Wagenmakers,4
and John T. Serences1,2
1Department of Psychology and 2Neurosciences Graduate Program, University of California, San Diego, La Jolla, California 92093, 3School of Psychology,University of Newcastle, Callaghan, New South Wales 2308, Australia, and 4Department of Psychology, University of Amsterdam, 1018 WS Amsterdam, TheNetherlands
When people make decisions quickly, accuracy suffers. Traditionally, speed–accuracy tradeoffs (SATs) have been almost exclusivelyascribed to changes in the amount of sensory evidence required to support a response (“response caution”) and the neural correlatesassociated with the later stages of decision making (e.g., motor response generation and execution). Here, we investigated whetherperformance decrements under speed pressure also reflect suboptimal information processing in early sensory areas such as primaryvisual cortex (V1). Human subjects performed an orientation discrimination task while emphasizing either response speed or accuracy.A model of choice behavior revealed that the rate of sensory evidence accumulation was selectively modulated when subjects emphasizedaccuracy, but not speed, suggesting that changes in sensory processing also influence the SAT. We then used fMRI and a forward encodingmodel to derive orientation-selective tuning functions based on activation patterns in V1. When accuracy was emphasized, the extent towhich orientation-selective tuning profiles exhibited a theoretically optimal gain pattern predicted both response accuracy and the rateof sensory evidence accumulation. However, these relationships were not observed when subjects emphasized speed. Collectively, ourfindings suggest that, in addition to lowered response thresholds, the performance decrements observed during speeded decision makingmay result from a failure to optimally process sensory signals.
IntroductionFast decisions are typically more error prone, while precise deci-sions require more time, a phenomenon known as the speed–accuracy tradeoff (SAT) (Woodworth, 1899; Fitts, 1966;Wickelgren, 1977; Dickman and Meyer, 1988). Traditional mod-els of the SAT hold that fast but premature responses occur whennot enough sensory information has been accumulated to sup-port an accurate judgment (i.e., response thresholds are too low)(Bogacz et al., 2006; Ratcliff and McKoon, 2008). On this “re-sponse threshold” account, the SAT is mediated by neural mech-anisms of late-stage decision processes that immediately precedethe initiation of motor responses (Forstmann et al., 2008, 2010;van Veen et al., 2008; Bogacz et al., 2010). A complementary—and largely untested— hypothesis is that speed pressure also in-fluences the efficiency with which sensory evidence isaccumulated during decision making (“sensory-readout” hy-pothesis). This is an important possibility given that the rate of
sensory evidence accumulation necessarily limits the efficacy ofdownstream decision making and motor control processes.
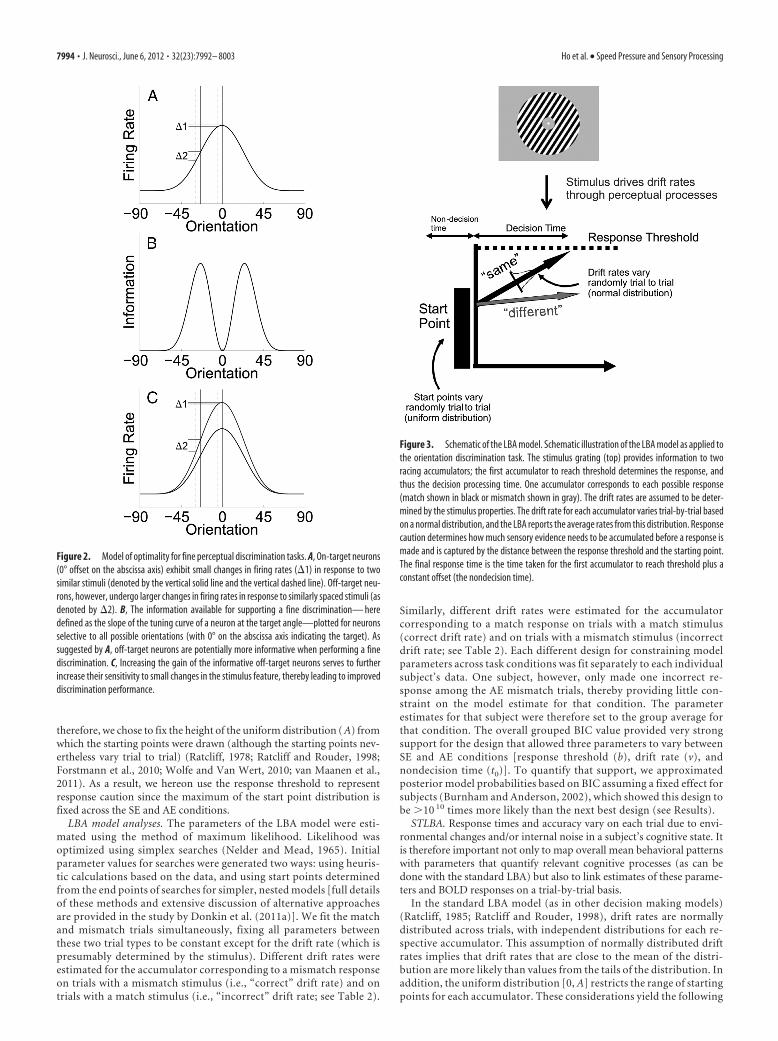
To investigate the influence of the SAT on sensory processing,we designed a perceptual decision making task that required hu-man observers to discriminate between two orientated gratingstimuli (Fig. 1) (see Materials and Methods) under either speedemphasis (SE) or accuracy emphasis (AE) conditions. Impor-tantly, subjects had to discriminate a small rotational offset (5°)between the gratings. Previous psychophysical and neurophysio-logical studies have shown that the most informative neurons forsupporting such fine discriminations are tuned away from thetarget feature (hereupon termed “off-target” neurons) (Fig. 2)(Regan and Beverley, 1985; Hol and Treue, 2001; Schoups et al.,2001; Purushothaman and Bradley, 2005; Butts and Goldman,2006; Jazayeri and Movshon, 2006; Navalpakkam and Itti, 2007;Moore, 2008; Scolari and Serences, 2009). This theoretical frame-work thereby provides a benchmark pattern of optimal sensorygain against which we can compare gain observed under differentSAT conditions.
We investigated how the SAT influenced information pro-cessing by fitting response time (RT) and accuracy data using twomodels of choice behavior: the linear ballistic accumulator (LBA)model (Brown and Heathcote, 2008) (Fig. 3) and an extension ofthe LBA, the single-trial linear ballistic accumulator (STLBA)(van Maanen et al., 2011). These models revealed an impact oftask instruction on the amount of information required to initi-ate a decision (“response caution”) and on the rate of sensoryevidence accumulation (the “drift rate”); the later effect suggests
Received Jan. 23, 2012; revised March 22, 2012; accepted April 19, 2012.Author contributions: T.H., S.B., and J.T.S. designed research; T.H. and J.T.S. performed research; T.H., S.B.,
L.v.M., B.U.F., E.-J.W., and J.T.S. contributed unpublished reagents/analytic tools; T.H., S.B., and J.T.S. analyzeddata; T.H., S.B., L.v.M., B.U.F., E.-J.W., and J.T.S. wrote the paper.
This work was supported by National Institute of Mental Health Grant R01-MH092345 (J.T.S.). We thank ThomasSprague for useful discussions.
Correspondence should be addressed to either Tiffany Ho or John T. Serences, Department of Psychology,University of California, San Diego, La Jolla, CA 92093. E-mail: [email protected] or [email protected].
DOI:10.1523/JNEUROSCI.0340-12.2012Copyright © 2012 the authors 0270-6474/12/327992-12$15.00/0
7992 • The Journal of Neuroscience, June 6, 2012 • 32(23):7992– 8003
that the SAT may affect sensory processing (Hubner et al., 2010;Vandekerckhove et al., 2011). We then used a forward encodingmodel (Brouwer and Heeger, 2009, 2011) (for review, see Nase-laris et al., 2011; Serences and Saproo, 2012) to examine howfeature-selective BOLD response profiles in primary visual cortex(V1) are associated with behavioral performance and with therate of sensory evidence accumulation under different SAT con-ditions. Our results suggest that theoretically optimal responsepatterns in V1 are associated with more efficient sensory evidenceaccumulation— but only when accuracy is emphasized overspeed.
Materials and MethodsSubjects. Sixteen subjects (11 females) were recruited from the Universityof California, San Diego (UCSD) (La Jolla, CA) community. All hadnormal or corrected-to-normal vision. Each subject gave written in-formed consent per Institutional Review Board requirements at UCSDand completed a single 1 h session in a climate- and noise-controlledsubject room outside of the scanner and a single 1.5–2 h session in thescanner. Compensation for participation was $10/h for behavioral train-ing and $20/h for scanning. Subjects received an additional reward fortask compliance according to a point system described below (meanadditional compensation, $6.64). Data from two subjects were discardeddue to improper slice stack selection during fMRI scanning that resultedin no data being collected from large portions of primary visual cortex,the main area of interest in this study.
Stimuli and task. Visual stimuli were generated using the Psychophys-ics Toolbox (Brainard, 1997; Pelli, 1997) implemented in MATLAB (ver-sion 7.1; MathWorks), presented at a frame rate of 60 Hz, and projectedonto a screen at the entrance of the scanner bore that subjects viewedthrough a mirror. Button press responses were made on an fMRI-compatible response box using the index and middle fingers of the righthand.
Subjects were shown a centrally presented oriented grating (with adiameter of �14°) at full contrast which flickered at 6 Hz (83.33 ms on,83.33 ms blank interval). On each trial, the orientation of the grating waspseudorandomly selected with equal probability from one of nine possi-ble orientations (0, 20, 40, 60, 80, 100, 120, 140, 160°) with a smallamount of pseudorandom jitter added (up to �6°, selected from a uni-form distribution). On one-half of the trials, the same stimulus was pre-sented at every “flicker” (“match” trials), but for the remaining trials(“mismatch” trials), the orientation of the grating was offset by 5° onevery other flicker, with the rotational offset of the deviant grating (i.e.,clockwise or counterclockwise) fixed on a given trial and counterbal-
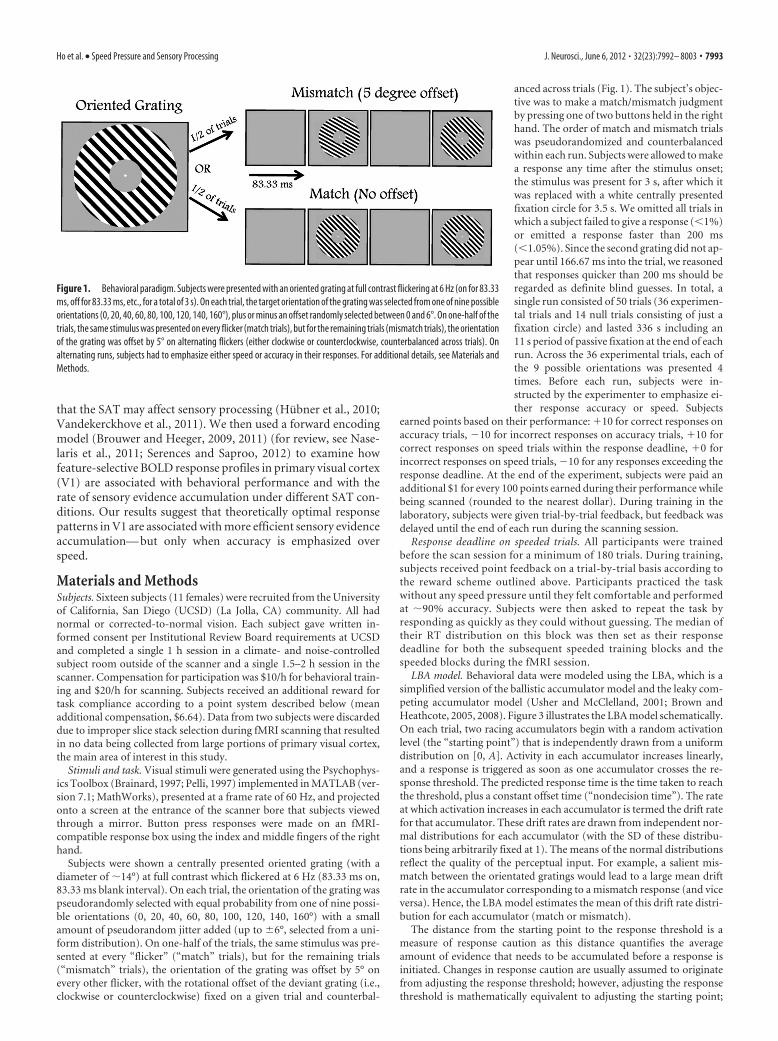
anced across trials (Fig. 1). The subject’s objec-tive was to make a match/mismatch judgmentby pressing one of two buttons held in the righthand. The order of match and mismatch trialswas pseudorandomized and counterbalancedwithin each run. Subjects were allowed to makea response any time after the stimulus onset;the stimulus was present for 3 s, after which itwas replaced with a white centrally presentedfixation circle for 3.5 s. We omitted all trials inwhich a subject failed to give a response (�1%)or emitted a response faster than 200 ms(�1.05%). Since the second grating did not ap-pear until 166.67 ms into the trial, we reasonedthat responses quicker than 200 ms should beregarded as definite blind guesses. In total, asingle run consisted of 50 trials (36 experimen-tal trials and 14 null trials consisting of just afixation circle) and lasted 336 s including an11 s period of passive fixation at the end of eachrun. Across the 36 experimental trials, each ofthe 9 possible orientations was presented 4times. Before each run, subjects were in-structed by the experimenter to emphasize ei-ther response accuracy or speed. Subjects
earned points based on their performance: �10 for correct responses onaccuracy trials, �10 for incorrect responses on accuracy trials, �10 forcorrect responses on speed trials within the response deadline, �0 forincorrect responses on speed trials, �10 for any responses exceeding theresponse deadline. At the end of the experiment, subjects were paid anadditional $1 for every 100 points earned during their performance whilebeing scanned (rounded to the nearest dollar). During training in thelaboratory, subjects were given trial-by-trial feedback, but feedback wasdelayed until the end of each run during the scanning session.
Response deadline on speeded trials. All participants were trainedbefore the scan session for a minimum of 180 trials. During training,subjects received point feedback on a trial-by-trial basis according tothe reward scheme outlined above. Participants practiced the taskwithout any speed pressure until they felt comfortable and performedat �90% accuracy. Subjects were then asked to repeat the task byresponding as quickly as they could without guessing. The median oftheir RT distribution on this block was then set as their responsedeadline for both the subsequent speeded training blocks and thespeeded blocks during the fMRI session.
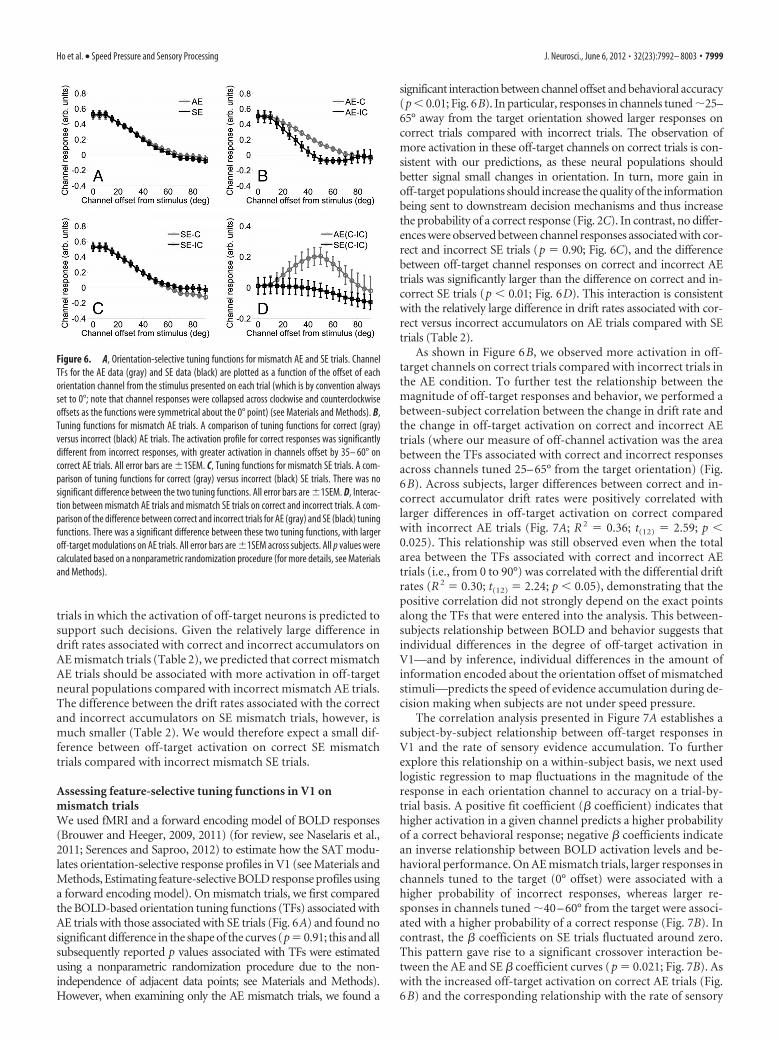
LBA model. Behavioral data were modeled using the LBA, which is asimplified version of the ballistic accumulator model and the leaky com-peting accumulator model (Usher and McClelland, 2001; Brown andHeathcote, 2005, 2008). Figure 3 illustrates the LBA model schematically.On each trial, two racing accumulators begin with a random activationlevel (the “starting point”) that is independently drawn from a uniformdistribution on [0, A]. Activity in each accumulator increases linearly,and a response is triggered as soon as one accumulator crosses the re-sponse threshold. The predicted response time is the time taken to reachthe threshold, plus a constant offset time (“nondecision time”). The rateat which activation increases in each accumulator is termed the drift ratefor that accumulator. These drift rates are drawn from independent nor-mal distributions for each accumulator (with the SD of these distribu-tions being arbitrarily fixed at 1). The means of the normal distributionsreflect the quality of the perceptual input. For example, a salient mis-match between the orientated gratings would lead to a large mean driftrate in the accumulator corresponding to a mismatch response (and viceversa). Hence, the LBA model estimates the mean of this drift rate distri-bution for each accumulator (match or mismatch).
The distance from the starting point to the response threshold is ameasure of response caution as this distance quantifies the averageamount of evidence that needs to be accumulated before a response isinitiated. Changes in response caution are usually assumed to originatefrom adjusting the response threshold; however, adjusting the responsethreshold is mathematically equivalent to adjusting the starting point;
Figure 1. Behavioral paradigm. Subjects were presented with an oriented grating at full contrast flickering at 6 Hz (on for 83.33ms, off for 83.33 ms, etc., for a total of 3 s). On each trial, the target orientation of the grating was selected from one of nine possibleorientations (0, 20, 40, 60, 80, 100, 120, 140, 160°), plus or minus an offset randomly selected between 0 and 6°. On one-half of thetrials, the same stimulus was presented on every flicker (match trials), but for the remaining trials (mismatch trials), the orientationof the grating was offset by 5° on alternating flickers (either clockwise or counterclockwise, counterbalanced across trials). Onalternating runs, subjects had to emphasize either speed or accuracy in their responses. For additional details, see Materials andMethods.
Ho et al. • Speed Pressure and Sensory Processing J. Neurosci., June 6, 2012 • 32(23):7992– 8003 • 7993
therefore, we chose to fix the height of the uniform distribution ( A) fromwhich the starting points were drawn (although the starting points nev-ertheless vary trial to trial) (Ratcliff, 1978; Ratcliff and Rouder, 1998;Forstmann et al., 2010; Wolfe and Van Wert, 2010; van Maanen et al.,2011). As a result, we hereon use the response threshold to representresponse caution since the maximum of the start point distribution isfixed across the SE and AE conditions.
LBA model analyses. The parameters of the LBA model were esti-mated using the method of maximum likelihood. Likelihood wasoptimized using simplex searches (Nelder and Mead, 1965). Initialparameter values for searches were generated two ways: using heuris-tic calculations based on the data, and using start points determinedfrom the end points of searches for simpler, nested models [full detailsof these methods and extensive discussion of alternative approachesare provided in the study by Donkin et al. (2011a)]. We fit the matchand mismatch trials simultaneously, fixing all parameters betweenthese two trial types to be constant except for the drift rate (which ispresumably determined by the stimulus). Different drift rates wereestimated for the accumulator corresponding to a mismatch responseon trials with a mismatch stimulus (i.e., “correct” drift rate) and ontrials with a match stimulus (i.e., “incorrect” drift rate; see Table 2).
Similarly, different drift rates were estimated for the accumulatorcorresponding to a match response on trials with a match stimulus(correct drift rate) and on trials with a mismatch stimulus (incorrectdrift rate; see Table 2). Each different design for constraining modelparameters across task conditions was fit separately to each individualsubject’s data. One subject, however, only made one incorrect re-sponse among the AE mismatch trials, thereby providing little con-straint on the model estimate for that condition. The parameterestimates for that subject were therefore set to the group average forthat condition. The overall grouped BIC value provided very strongsupport for the design that allowed three parameters to vary betweenSE and AE conditions [response threshold (b), drift rate (v), andnondecision time (t0)]. To quantify that support, we approximatedposterior model probabilities based on BIC assuming a fixed effect forsubjects (Burnham and Anderson, 2002), which showed this design tobe �10 10 times more likely than the next best design (see Results).
STLBA. Response times and accuracy vary on each trial due to envi-ronmental changes and/or internal noise in a subject’s cognitive state. Itis therefore important not only to map overall mean behavioral patternswith parameters that quantify relevant cognitive processes (as can bedone with the standard LBA) but also to link estimates of these parame-ters and BOLD responses on a trial-by-trial basis.
In the standard LBA model (as in other decision making models)(Ratcliff, 1985; Ratcliff and Rouder, 1998), drift rates are normallydistributed across trials, with independent distributions for each re-spective accumulator. This assumption of normally distributed driftrates implies that drift rates that are close to the mean of the distri-bution are more likely than values from the tails of the distribution. Inaddition, the uniform distribution [0, A] restricts the range of startingpoints for each accumulator. These considerations yield the following
Figure 2. Model of optimality for fine perceptual discrimination tasks. A, On-target neurons(0° offset on the abscissa axis) exhibit small changes in firing rates (�1) in response to twosimilar stimuli (denoted by the vertical solid line and the vertical dashed line). Off-target neu-rons, however, undergo larger changes in firing rates in response to similarly spaced stimuli (asdenoted by �2). B, The information available for supporting a fine discrimination— heredefined as the slope of the tuning curve of a neuron at the target angle—plotted for neuronsselective to all possible orientations (with 0° on the abscissa axis indicating the target). Assuggested by A, off-target neurons are potentially more informative when performing a finediscrimination. C, Increasing the gain of the informative off-target neurons serves to furtherincrease their sensitivity to small changes in the stimulus feature, thereby leading to improveddiscrimination performance.
Figure 3. Schematic of the LBA model. Schematic illustration of the LBA model as applied tothe orientation discrimination task. The stimulus grating (top) provides information to tworacing accumulators; the first accumulator to reach threshold determines the response, andthus the decision processing time. One accumulator corresponds to each possible response(match shown in black or mismatch shown in gray). The drift rates are assumed to be deter-mined by the stimulus properties. The drift rate for each accumulator varies trial-by-trial basedon a normal distribution, and the LBA reports the average rates from this distribution. Responsecaution determines how much sensory evidence needs to be accumulated before a response ismade and is captured by the distance between the response threshold and the starting point.The final response time is the time taken for the first accumulator to reach threshold plus aconstant offset (the nondecision time).
7994 • J. Neurosci., June 6, 2012 • 32(23):7992– 8003 Ho et al. • Speed Pressure and Sensory Processing

maximum-likelihood estimates for a single-trial drift rate (di) and asingle-trial starting point (ai) given a trial with response time (ti):
di � �b � A
ti � t0if ti �
b � A
v� t0
v ifb � A
v� t0 � ti �
b
v� t0
b
ti � t0if ti �
b
v� t0
ai � �A if ti �
b � A
v� t0
b � �ti � t0 � v ifb � A
v� t0 � ti �
b
v� t0
0 if ti �b
v� t0,
(1)
where b, v, A, and t0 are the parameters estimated using the standard LBAthat correspond to the response threshold (b), the drift rate (v), the heightof the distribution of starting points ( A), and the nondecision time (t0),respectively. Note that the assumed independence between estimatedparameters that is found in the standard LBA model is no longer pre-served with the STLBA. Nevertheless, parameter recovery studies showthat the STLBA can explain much of the variance in the true parametervalues [van Maanen et al. (2011), see the text surrounding their Fig. 3].
As in the main LBA analysis, we computed single-trial estimates ofdrift rate based on a model where response threshold (b), drift rate (v),and the nondecision time (t0) were free to vary between SE and AE trials,whereas the height of the uniform distribution of starting points ( A) wasfixed (for exact values, see Table 2). Constraining the model in otherreasonable ways (e.g., fixing the nondecision time parameter) yieldedqualitatively similar results. Note also that the single-trial estimates forthe starting point here are mathematically equivalent to single-trial esti-mates of the response threshold since what is actually being calculated isthe relative distance between the two.
fMRI data acquisition and analysis. All scanning was performed on aGeneral Electric MR750 3T scanner equipped with an eight-channel headcoil at the W. M. Keck Center for Functional MRI on the main campus atUCSD. Anatomical images were acquired using a FSPGR T1-weightedsequence that yielded images with a 1 1 1 mm resolution. Whole-brain echo-planar functional images (EPIs) were acquired in 28 (for eightof the subjects) or 26 (for the remaining subjects) oblique slices (TR, 1500ms; TE, 30 ms; flip angle, 90°; image matrix, 64 64; field of view, 192mm; slice thickness, 3 mm; 0 mm gap).
Data analysis was performed using BrainVoyager QX (version 1.91;Brain Innovation) and custom time series analysis routines written inMATLAB (version 7.11.0.584; MathWorks). Data from the main exper-iment were collected in 8 or 10 runs per subject (i.e., either 4 or 5 runs perresponse instruction type, respectively). EPI images were slice-time cor-rected, motion-corrected (both within and between scans), and high-pass filtered (3 cycles/run) to remove low-frequency temporalcomponents from the time series. The time series from each voxel in eachobserver was then z-transformed on a run-by-run basis to normalize themean response intensity across time to zero. This normalization wasdone to correct for differences in mean signal intensity across voxels (e.g.,differences related to the composition of a voxel or by its distance fromthe coil elements). We then estimated the magnitude of the BOLD re-sponse on each trial by shifting the time series from each voxel by four1.5 s TRs (6 s) to account for the temporal lag in the hemodynamicresponse function, and then extracting data from the two consecutive1.5 s TRs that correspond to the duration of each 3 s trial (Kamitani andTong, 2005; Serences and Boynton, 2007a,b; Serences et al., 2009). Thetwo data points extracted from these two consecutive TRs were thenaveraged together to compute a single estimate of the response in each V1voxel on each trial. These trial-by-trial estimates of the BOLD responseamplitude were subsequently used as inputs to the forward encodingmodel (see below, Estimating feature-selective BOLD response profilesusing a forward encoding model).
Functional localizer scans. Each subject participated in two runs of anindependent functional localizer scan to identify voxels within primaryvisual cortex that were responsive to the spatial position occupied by theoriented grating stimulus used in the primary experiment. The localizerstimulus was comprised of a full-contrast counter-phase modulated (8Hz) checkerboard that exactly matched the size of the oriented gratingstimulus used in the main task. On each trial, the checkerboard stimuluswas presented continuously for 10 s, and the contrast of the checkerboardwas reduced by 30% for a single video frame at six pseudorandomlyselected time points. Subjects were instructed to make a button pressresponse with their right index finger every time they detected a contrastdecrement. Each 10 s trial was then followed by 10 s of passive fixation.Visually responsive regions of primary visual cortex were identified usinga general linear model (GLM) with a single regressor that was con-structed by convolving a boxcar model of the stimulus sequence with astandard model of the hemodynamic response function (a difference-of-two gamma function model implemented in Brain Voyager; time to peakof positive response, 5 s; time to peak of negative response, 15 s; ratio ofpositive and negative responses, 6; positive and negative response disper-sion, 1). Voxels were retained for analysis in the main experimental taskif they passed a false discovery rate corrected single-voxel threshold ofp � 0.05.
Retinotopic mapping. A meridian mapping procedure consisting of acheckerboard wedge flickering at 8 Hz and subtending 60° of polar anglewas used to identify V1 (Engel et al., 1994; Sereno et al., 1995). Subjectswere instructed to fixate on the center of the screen and to passively viewthe peripheral stimulus. The data collected during these scans were thenprojected onto a computationally inflated representation of each sub-ject’s gray/white matter boundary. V1 in each hemisphere was then man-ually defined according to the representations of the upper and lowervertical meridian following standard practices (Wandell et al., 2007).
Estimating feature-selective BOLD response profiles using a forward en-coding model. The goal of encoding models is to adopt an a priori as-sumption about the important features that can be distinguished usinghemodynamic signals within an ROI, and then to use this set of features(or basis functions) to predict observed patterns of BOLD responses(Gourtzelidis et al., 2005; Thirion et al., 2006; Dumoulin and Wandell,2008; Kay et al., 2008; Brouwer and Heeger, 2009, 2011; Kay and Gallant,2009; Naselaris et al., 2009) (for review, see Naselaris et al., 2011; Serencesand Saproo, 2012). Here, we assumed that the BOLD response in a givenV1 voxel represents the pooled activity across a large population oforientation-selective neurons, and that the distribution of neural tuningpreference is biased within a given voxel due to large-scale feature maps(Freeman et al., 2011) or to random anisotropies in the distribution oforientation-selective columns within each voxel (Kamitani and Tong,2005; Swisher et al., 2010). Thus, the BOLD response measured frommany of the voxels in V1 exhibit a robust orientation preference (Haynesand Rees, 2005; Kamitani and Tong, 2005; Serences et al., 2009; Brouwerand Heeger, 2011; Freeman et al., 2011).
To estimate orientation-selective response profiles based on activationpatterns in V1, we first separated the data from the 8 –10 scanning runsobtained for each subject into train and test sets using a “leave two out”cross-validation scheme (i.e., all but one SE and one AE run were used asa training set, and the held-out SE and AE runs were used as a test set). Byholding one AE and one SE run out for use as a test set, we ensured thatthe training set had an equal number of trials of each type. For each runin the training set, we then computed the mean response evoked by eachof the nine orientations, separately for each voxel. The mean responseswere then sorted based on stimulus orientation and run (i.e., mean re-sponse to orientation 1 was first, then orientation 2, . . . , orientation 9).Thus, each training set had 54 observations for subjects who underwent8 runs in the scanner (6 runs in training set 9 orientations), and 72observations for subjects that underwent 10 runs in the scanner (8 runs inthe training set 9 orientations). Note that, as described below, data inthe test set were not averaged across trials, and a unique channel responsefunction was estimated for every trial.
Adopting the terminology of Brouwer and Heeger (2009, 2011), let mbe the number of voxels in a given visual area, n1 be the number ofobservations in the training set (either 54 or 72), n2 be the number of
Ho et al. • Speed Pressure and Sensory Processing J. Neurosci., June 6, 2012 • 32(23):7992– 8003 • 7995

trials in the test set, and k be the number of hypothetical orientationchannels. Let B1 (m n1 matrix) be the training data set, and B2 (m n2
matrix) be the test data set. Under the assumption that the observedBOLD signal is a weighted sum of underlying orientation-selective neuralresponses, we generated a matrix of hypothetical channel outputs (C1,k n1) composed of nine half-sinusoidal functions raised to the sixthpower as a basis set (Fig. 4). The training data in B1 were then mappedonto the matrix of channel outputs (C1) by the weight matrix (W, m k)that was estimated using a GLM of the following form:
B1 � WC1, (2)
where the ordinary least-squares estimate of W is computed as follows:
W � B1C1T(C1C1
T)�1. (3)
The channel responses C2(k n2) were then estimated based on the testdata (B2) using the weights estimated in Equation 3 as follows:
C2 � (WTW)�1WTB2. (4)
The first steps in this sequence (Eqs. 2, 3) are similar to a traditionalunivariate GLM in that each voxel is assigned a weight for each feature inthe model (in this case, one weight for each hypothetical orientationchannel). Equation 4 then implements a multivariate computation be-cause the channel responses estimated on each trial (in C2) are con-strained by the estimated weights assigned to each voxel and by the vectorof responses observed across all voxels on that trial in the test set. Thus,one key feature of this approach is that a set of estimated channel re-sponses can be obtained on a trial-by-trial basis so long as the number of
voxels is greater than the number of channels. If there are fewer voxelsthan channels, then unique channel response estimates cannot be de-rived as the number of variables being estimated exceeds the number ofavailable measurements. This ability to estimate the orientation-selectivetuning profile on each trial is exploited when comparing channel re-sponses on correct and incorrect trials and when correlating channelresponses with accuracy and drift rates on a trial-by-trial basis (seeResults).
The shape of the basis functions used in C1 has a large impact on theresulting channel response estimates. In the present experiment, we usedhalf-sinusoidal functions that were raised to the sixth power to approxi-mate the shape of single-unit tuning functions in V1, where the 1/�2half-bandwidth of orientation tuned cells is �20° (although there is aconsiderable amount of variability in bandwidth) (Schiller et al., 1976;Swindale, 1998; Ringach et al., 2002a,b; Gur et al., 2005). Given that thehalf-sinusoids were raised to the sixth power, a minimum of seven lin-early independent functions was required to adequately cover orienta-tion space (Freeman and Adelson, 1991); however, since we presentednine unique orientations in the experiment, we used a set of nine evenlydistributed functions. The use of more than the required seven basisfunctions is not problematic so long as the number of functions does notexceed the number of measured stimulus values, in which case the matrixC1 would become rank deficient. While we selected the bandwidth of thebasis functions based on physiology studies, all results that we report arerobust to reasonable variations in this value (i.e., raising the half-sinusoids to the fifth to eighth power, all of which are reasonable choicesbased on the documented variability of single-unit bandwidths). Notethat, since the magnitude of the channel responses is scaled by the am-plitude of the basis functions (which was set to 1 here), the units along they-axes of all data plots are in arbitrary units. Importantly, however, scal-ing the basis functions to some other common value would not changethe differential response between conditions.
Using this modeling approach, the center position of each function inthe basis set can be systematically shifted across orientation space toestimate the response in a channel centered at any arbitrary orientation(as long as the channels remain linearly independent) (Freeman andAdelson, 1991). While this method of shifting the center of each channelacross orientation space could in principle be used to generate channelresponse profiles with a resolution of 1° (or even smaller), we opted toreconstruct the response functions in 5° steps as no additional insightswere gained by estimating the responses at a higher resolution. Aftergenerating a channel response function on each trial in 5° steps acrossorientation space, each function was circularly shifted to a commonstimulus-centered reference frame, and these recentered response func-tions were averaged across left and right V1 and across all trials of a likekind. Thus, by convention, the 0° point along the x-axis in all plots refersto the stimulus that evoked the response profile. Finally, since all channelresponse functions were found to be symmetrical about their centerpoint, we averaged data from corresponding offsets on either side of the0° point (i.e., data were averaged from the channels offset by �5 and �5°from the stimulus, �10 and �10°, and so forth) to produce the reportedorientation tuning functions. Note that, in the process of collapsingacross channels centered on both positive and negative offsets from 0°,we necessarily collapsed across mismatch trials in which there was eithera clockwise or a counterclockwise offset between sequentially presentedgratings within a trial. However, sorting the data by the rotational offsetof the deviant grating had no qualitative impact on any of our results,presumably because the two gratings were flickering back and forth onsequential presentations over the course of the 3 s trial (Fig. 1) andbecause there was a random jitter of up to �6° introduced on each trial(see task description above), which was on the same order as the offsetbetween sequential gratings on mismatch trials (�5°).
Bootstrapping/randomization procedure for evaluating statistical signif-icance. Because the basis functions used to estimate channel responsesoverlapped—thus violating the independence assumption of traditionalstatistical tests—we estimated statistical significance using a nonpara-metric bootstrapping/randomization procedure. Note that this boot-strapping/randomization procedure was used for all comparisons relatedto BOLD tuning functions (see Figs. 6, 7, AE vs SE, correct AE vs incorrect
Figure 4. Schematic of the forward encoding model. A, Basis set comprised of nine half-sinusoidal functions raised to the sixth power: the functions are evenly distributed across ori-entation space. B, Depiction of the design matrix C1. There is one column corresponding to eachobservation in the training data matrix, and each row represents the response profile of one ofthe nine half-sinusoidal basis functions shown in A. This matrix is used to calculate the weightmatrix (W) that estimates the magnitude of the response in each voxel in each of the ninehypothetical orientation channels. This weight matrix can then be used to infer the responseprofile across all nine channels on each trial in the test data set. For more details, see Equations2– 4 (see Materials and Methods, Estimating feature-selective BOLD response profiles using aforward encoding model).
7996 • J. Neurosci., June 6, 2012 • 32(23):7992– 8003 Ho et al. • Speed Pressure and Sensory Processing

AE, correct SE vs incorrect SE, the interaction between AE vs SE based onaccuracy, AE logistic regression � weights vs SE logistic regression �weights, and single-trial correlations between AE responses and drift ratevs single-trial correlations between SE responses and drift rate). First, aseries of standard paired t tests was performed to determine which pointsalong the two tuning curves differed significantly (using a threshold ofp � 0.05 for each individual t test). We then generated a new data set byrandomly selecting 14 participants with replacement and then reassign-ing the condition label associated with data from each participant with aprobability of 0.5. A series of paired t tests was performed on the resa-mpled and randomized data set using the same procedure applied to theobserved data. This resampling plus randomization procedure was theniterated 10,000 times to determine the probability of obtaining the pat-tern of significant differences obtained using the intact data set under thenull hypothesis that the two conditions are equivalent (i.e., interchange-able). The reported p values in the main text thus reflect the proportion oftimes we observed a pattern of significant t tests in the resampled datathat matched the pattern obtained in the observed data. Note that thebehavioral data were evaluated using conventional parametric statisticaltechniques.
ResultsResponse time and accuracy resultsTrials on which RTs were faster than 200 ms were discarded in allsubsequent analyses (including model fitting procedures de-scribed below) (see Materials and Methods). Two-way repeated-measures ANOVA with factors for response-emphasis (speed vsaccuracy emphasis, or SE and AE trials, respectively) and trialtype (match vs mismatch) was used to assess accuracy and RTdata collected during the scanning session (for a summary of thegroup data, see Table 1). The task instructions produced a strongSAT effect: participants responded faster on SE trials comparedwith AE trials (F(1,13) � 39.168; p � 0.001; Table 1), and there wasa corresponding drop in accuracy on SE trials (F(1,13) � 71.975;p � 0.001; Table 1).
On average, subjects gave a match response 55% of thetime, which is significantly greater than chance (one-sample ttest, t(13) � 2.49, p � 0.03). In addition, RTs were slower andaccuracy slightly better on match trials compared with mis-match trials (F(1,13) � 13.26, p � 0.01; F(1,13) � 5.4, p � 0.05;Table 1), which is consistent with the bias to respond matchover mismatch and commensurate with the well known pro-pensity for making confirmatory responses (Clark and Chase,1972). There was an interaction between response-emphasisand trial type for RTs (F(1,13) � 12.6; p � 0.01; Table 1), withselectively long RTs on match AE trials. However, there was nointeraction between response-emphasis and trial type for ac-curacy rates (F(1,13) � 0.61; p � 0.45; Table 1).
LBA model resultsAccuracy rates and RTs might be lower on SE trials comparedwith AE trials due to differences in response caution and/or in the
rate at which sensory evidence is accumulated. Therefore, weused a mathematical model of decision making (Fig. 3) to inves-tigate how emphasizing either speed or accuracy influenced therate of sensory evidence accumulation (as captured by the driftrate parameter) and response caution (as captured by the dis-tance between the starting point and the response threshold) (seeMaterials and Methods). Given that the neuronal mechanismsthought to support fine orientation discriminations are reason-ably well characterized (Fig. 2) (see below, Predicting feature-selective response patterns in V1 on mismatch trials), we focusedour analyses on mismatch trials (data from match and mismatchtrials were nonetheless fit simultaneously) (for more details, seeMaterials and Methods, LBA model analyses). Eight different ver-sions of the LBA model of Brown and Heathcote (2008) were fitby allowing all combinations of three different parameters (driftrate, response caution, and nondecision time) to either varyfreely across SE and AE conditions or to be fixed across thoseconditions, while keeping the maximum starting point alwaysfixed across AE and SE conditions (Fig. 3) (for more details, seeMaterials and Methods, LBA model and LBA model analyses).We then used the Bayesian information criterion (BIC) to selectthe most parsimonious of the eight models, which is a commonlyused measure that evaluates the tradeoff between model com-plexity and goodness of fit (Schwarz, 1978; Raftery, 1995). Themodel yielding the best BIC was the one that estimated differentvalues for the parameters corresponding to response caution,drift rate, and nondecision time on AE trials compared with SEtrials (for a summary of the parameter fits to data averaged overall the subjects, see Table 2). Based on approximated posteriormodel probabilities (for more details, see Materials and Methods,LBA model analyses), this design was found to be �10 10 timesmore likely than the next best design. Individually, this designwas also the modal result: the BIC values for 6 of 14 subjectspreferred this design. Four subjects had best-BIC designs thatincluded an effect on drift rate but not response threshold, whilethree had best-BIC designs that included an effect on thresholdbut not drift rate. Only one subject had a best-BIC design thatincluded no effect at all of the experimental manipulation.
Figure 5 shows the fit of this best-BIC model to the cumulativeresponse time distributions from the data. This figure estimatesthe distributions using quantiles plotted against response proba-bility. These plots are also known as “defective cumulative distri-bution plots” and are a standard method for evaluating the
Table 1. Behavioral accuracy and response times on correct trials during the fMRIexperiment for each condition and for the main effect of response emphasis(speed vs accuracy) and the main effect of trial type (match vs mismatch)
Condition Accuracy Response time (ms)
Speed (match) 71.37 � 2.71 947.7 � 64.2Speed (mismatch) 61.08 � 3.08 896.8 � 49.4Accuracy (match) 90.00 � 1.78 1697.8 � 131.2Accuracy (mismatch) 82.05 � 3.28 1443.9 � 92.9Speed (match plus mismatch) 66.23 � 2.24 922.4 � 40.1Accuracy (match plus mismatch) 86.02 � 2.00 1570.8 � 82.6Match (speed plus accuracy) 80.69 � 2.40 1322.8 � 101.7Mismatch (speed plus accuracy) 71.57 � 2.99 1170.4 � 73.7
For more details, see Results. Shown are means � 1SEM across subjects.
Table 2. Average LBA parameter estimates for the best BIC model on mismatch andmatch trials
LBA parametersSpeed(mismatch)
Accuracy(mismatch)
Speed(match)
Accuracy(match)
Starting point (A) 2.31 2.31 2.31 2.31Nondecision time (t0 ) 0.41 0.42 0.41 0.42Response threshold (b) 2.75 4.43 2.75 4.43Drift rate for accumulator corresponding to
correct response (vc) 2.67 3.00 2.75 2.58Drift rate for accumulator corresponding to
incorrect response (vic) 1.71 0.69 1.19 �0.07Differential drift rate (vc � vic) 0.96 2.31 1.56 2.65
All parameters were fixed to be constant across match and mismatch trials except for the drift rates, which areassumed to be directly related to the quality of the stimuli (for more details, see LBA results). Note that the responsethreshold parameter is equivalent to what we refer to as response caution in the main text, as the starting point isfixed across conditions (see Materials and Methods). Note that, in the main text, we refer to correct accumulators asthe accumulator corresponding to the match response on trials in which the stimulus gratings match, and also theaccumulator corresponding to the mismatch response on trials in which the gratings mismatch (and the converse istrue for incorrect accumulators). Critically, there was a greater difference in the rate of sensory evidence accumula-tion (drift rates) between correct and incorrect accumulators on accuracy emphasis trials compared with speedemphasis trials (last row in the table).
Ho et al. • Speed Pressure and Sensory Processing J. Neurosci., June 6, 2012 • 32(23):7992– 8003 • 7997

quality of fit for response time models, as they provide a muchmore rigorous test than histograms [for introductions to thismethod and related discussion, see the study by Ratcliff andTuerlinckx (2002) or the study by Donkin et al. (2011a)]. Themodel fits the data quite well, matching the probability (asindicated by the height on the graph) of each response type ineach condition accurately. The latency of each part of theresponse time distribution (abscissa axis) is also accuratelycaptured by the model. For example, in the SE and AE condi-tions, the median observed correct RT differs from the medianLBA predicted value by �25 ms.
In any choice task, it is possible that participants occasionallymake random guesses that are independent of the available stim-ulus information. This is especially a concern in the SE conditionin which error rates were relatively high. However, since the de-cision model fits the response time distributions from both con-ditions very well (Fig. 5, left panel), we assume that simplerandom guessing is not a plausible explanation for observed dif-ferences in parameters between the SE and AE conditions. Nev-ertheless, to avoid having the model results overly biased bycontaminant processes such as guessing, we incorporated a mix-ture process with the assumption that each response had a 98%probability of arising from the LBA choice process, and a 2%probability of arising from a guessing process with random re-sponses and uniform RT over the observed range [for details, seethe studies by Ratcliff and Tuerlinckx (2002) and Donkin et al.(2011a)]. With this built-in assumption, the decision model fitthe response time distributions from both conditions very well(Fig. 5), consistent with the hypothesis that participants weremaking informed decisions on the vast majority of trials.
Consistent with most SAT studies, we observed a difference inresponse caution (Table 2) (Ratcliff, 1985; Ratcliff and Rouder,1998; Voss et al., 2004; Palmer et al., 2005). Moreover, we ob-served a larger difference in the rate of evidence accumulationassociated with correct and incorrect accumulators on AE trialscompared with correct and incorrect accumulators on SE trials(F(1,13) � 18.27, p � 0.005, repeated measures two-way ANOVA,with no main effect of stimulus type nor interaction betweenresponse type and stimulus type, F(1,13) � 2.82 and F(1,13) � 0.95,respectively; p � 0.10 for both). In the LBA, high accuracy occurswhen the accumulator corresponding to the correct response forthe stimulus gathers evidence more quickly than the accumulator
corresponding to the incorrect response. The larger difference indrift rates between correct and incorrect accumulators on AEtrials therefore suggests that sensory information about the cor-rect response is being selectively accumulated at a higher ratewhen subjects make decisions in the absence of speed pressure.Such selectivity represents a departure from the typical assump-tion used by mathematical psychologists that the rate of sensoryevidence accumulation is fixed across AE and SE conditions [forextensive discussion, see Ratcliff and Rouder (1998)], as well asthe typical assumption that response caution is the only cognitiveprocess involved in the SAT. However, others have also observedevidence for a change in drift rates with task demands (Vande-kerckhove et al., 2011), and we speculate that the effect may beeven more apparent in the present task because subjects wereengaged in a difficult perceptual discrimination in which thequality of sensory representations critically determined behav-ioral performance [for a more theoretical treatment, see also thestudy by Hubner et al. (2010)]. Finally, the small observed differ-ences in the time taken for nondecision processing between SEand AE conditions (Table 2) are sometimes observed as a conse-quence of task instructions, but these differences are not usuallyof interest when the main purpose of the manipulation is to in-fluence decision processing (Voss et al., 2004; Starns and Ratcliff,2010).
In general, the parameter estimates from the LBA model havebeen shown to be in agreement with the corresponding parame-ters in the Ratcliff diffusion drift model (Donkin et al., 2011b).Nevertheless, to demonstrate that our modeling results are notspecific to our choice of model and fitting procedures, we also fitour behavioral data using the Diffusion Model Analysis Toolbox(DMAT) implemented in MATLAB (Vandekerckhove and Tuer-linckx, 2007, 2008). We used DMAT to fit the same eight modelstested in our LBA analysis (i.e., all possible combinations of driftrate, response threshold, and nondecision time varying or stayingfixed across AE and SE conditions while keeping all other param-eters fixed). Group BIC values for each model design were calcu-lated in the same manner as those computed for the LBA models(see Materials and Methods, LBA model analyses). Consistentwith the results of the LBA model, the diffusion model designwith the best BIC was the one that estimated different values forthe parameters corresponding to drift rate and response thresh-old on AE versus SE trials (AE drift rates were larger than SE driftrates, t(13) � 4.93, p � 0.01; and AE response thresholds werehigher than SE response thresholds, t(13) � 5.94, p � 0.01). Wethen approximated posterior model probabilities using the groupBIC value across all subjects for each model design. The model inwhich only drift rate and response threshold varied yielded thegreatest posterior probability (close to 1, while all other posteriorprobabilities were close to 0).
Predicting feature-selective response patterns in V1 onmismatch trialsWe next sought to establish a relationship between feature-selective BOLD responses in early visual areas and behavior. Insituations that require discriminating between two highly similarstimuli (as in the present experiment in which orientations onmismatch trials were offset by only 5°), neurons tuned to off-target orientations provide the most information about the pres-ence of mismatching orientations (Fig. 2) (Regan and Beverley,1985; Hol and Treue, 2001; Schoups et al., 2001; Purushothamanand Bradley, 2005; Butts and Goldman, 2006; Jazayeri andMovshon, 2006; Navalpakkam and Itti, 2007; Scolari and Ser-ences, 2009, 2010). Hence, we focused our analyses on mismatch
Figure 5. LBA model fits. Cumulative response time distributions estimated from the datausing quantiles (black circles and lines) and predicted by the LBA model (gray dots and lines).Data are shown separately for the speed emphasis condition (left panel) and the accuracyemphasis condition (right panel). In each panel, the upper lines and symbols show quantileestimates for correct responses, and the lower set are for incorrect responses. The data quantilesand model predictions were generated separately for each individual participant and thenaveraged. The height of the graphs shows response probability. Nine quantile estimates areshown in each condition, corresponding to 10, 20, . . . , 90%.
7998 • J. Neurosci., June 6, 2012 • 32(23):7992– 8003 Ho et al. • Speed Pressure and Sensory Processing
trials in which the activation of off-target neurons is predicted tosupport such decisions. Given the relatively large difference indrift rates associated with correct and incorrect accumulators onAE mismatch trials (Table 2), we predicted that correct mismatchAE trials should be associated with more activation in off-targetneural populations compared with incorrect mismatch AE trials.The difference between the drift rates associated with the correctand incorrect accumulators on SE mismatch trials, however, ismuch smaller (Table 2). We would therefore expect a small dif-ference between off-target activation on correct SE mismatchtrials compared with incorrect mismatch SE trials.
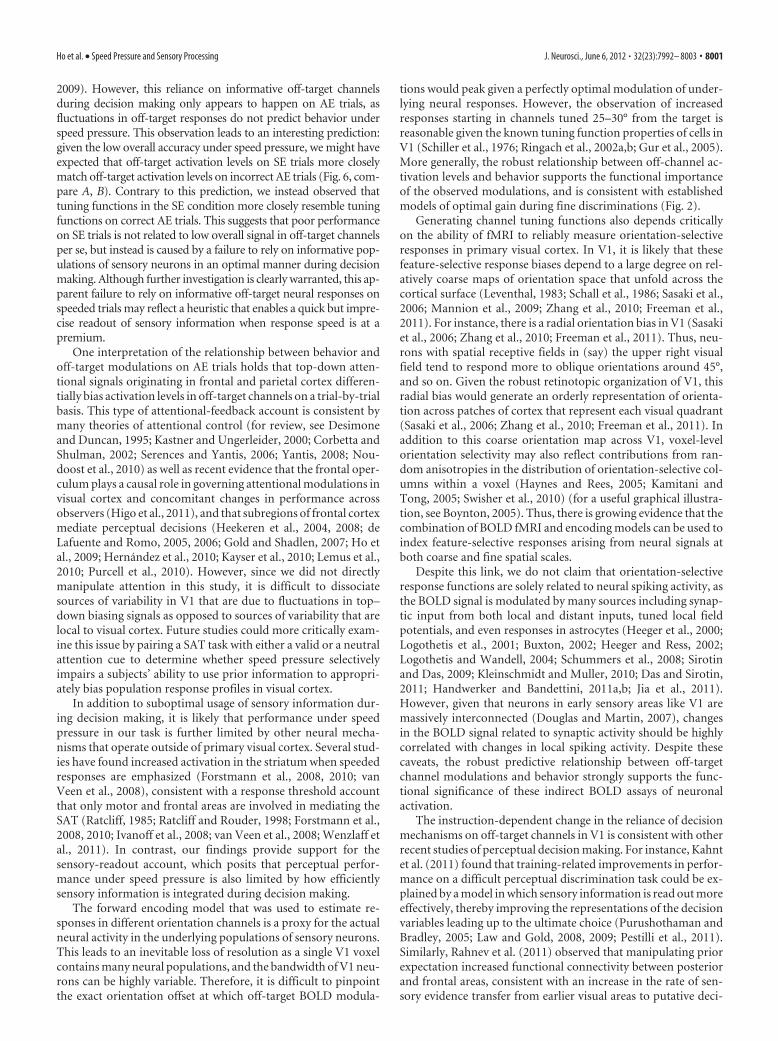
Assessing feature-selective tuning functions in V1 onmismatch trialsWe used fMRI and a forward encoding model of BOLD responses(Brouwer and Heeger, 2009, 2011) (for review, see Naselaris et al.,2011; Serences and Saproo, 2012) to estimate how the SAT modu-lates orientation-selective response profiles in V1 (see Materials andMethods, Estimating feature-selective BOLD response profiles usinga forward encoding model). On mismatch trials, we first comparedthe BOLD-based orientation tuning functions (TFs) associated withAE trials with those associated with SE trials (Fig. 6A) and found nosignificant difference in the shape of the curves (p � 0.91; this and allsubsequently reported p values associated with TFs were estimatedusing a nonparametric randomization procedure due to the non-independence of adjacent data points; see Materials and Methods).However, when examining only the AE mismatch trials, we found a
significant interaction between channel offset and behavioral accuracy(p � 0.01; Fig. 6B). In particular, responses in channels tuned �25–65° away from the target orientation showed larger responses oncorrect trials compared with incorrect trials. The observation ofmore activation in these off-target channels on correct trials is con-sistent with our predictions, as these neural populations shouldbetter signal small changes in orientation. In turn, more gain inoff-target populations should increase the quality of the informationbeing sent to downstream decision mechanisms and thus increasethe probability of a correct response (Fig. 2C). In contrast, no differ-ences were observed between channel responses associated with cor-rect and incorrect SE trials (p � 0.90; Fig. 6C), and the differencebetween off-target channel responses on correct and incorrect AEtrials was significantly larger than the difference on correct and in-correct SE trials (p � 0.01; Fig. 6D). This interaction is consistentwith the relatively large difference in drift rates associated with cor-rect versus incorrect accumulators on AE trials compared with SEtrials (Table 2).
As shown in Figure 6B, we observed more activation in off-target channels on correct trials compared with incorrect trials inthe AE condition. To further test the relationship between themagnitude of off-target responses and behavior, we performed abetween-subject correlation between the change in drift rate andthe change in off-target activation on correct and incorrect AEtrials (where our measure of off-channel activation was the areabetween the TFs associated with correct and incorrect responsesacross channels tuned 25– 65° from the target orientation) (Fig.6B). Across subjects, larger differences between correct and in-correct accumulator drift rates were positively correlated withlarger differences in off-target activation on correct comparedwith incorrect AE trials (Fig. 7A; R 2 � 0.36; t(12) � 2.59; p �0.025). This relationship was still observed even when the totalarea between the TFs associated with correct and incorrect AEtrials (i.e., from 0 to 90°) was correlated with the differential driftrates (R 2 � 0.30; t(12) � 2.24; p � 0.05), demonstrating that thepositive correlation did not strongly depend on the exact pointsalong the TFs that were entered into the analysis. This between-subjects relationship between BOLD and behavior suggests thatindividual differences in the degree of off-target activation inV1—and by inference, individual differences in the amount ofinformation encoded about the orientation offset of mismatchedstimuli—predicts the speed of evidence accumulation during de-cision making when subjects are not under speed pressure.
The correlation analysis presented in Figure 7A establishes asubject-by-subject relationship between off-target responses inV1 and the rate of sensory evidence accumulation. To furtherexplore this relationship on a within-subject basis, we next usedlogistic regression to map fluctuations in the magnitude of theresponse in each orientation channel to accuracy on a trial-by-trial basis. A positive fit coefficient (� coefficient) indicates thathigher activation in a given channel predicts a higher probabilityof a correct behavioral response; negative � coefficients indicatean inverse relationship between BOLD activation levels and be-havioral performance. On AE mismatch trials, larger responses inchannels tuned to the target (0° offset) were associated with ahigher probability of incorrect responses, whereas larger re-sponses in channels tuned �40 – 60° from the target were associ-ated with a higher probability of a correct response (Fig. 7B). Incontrast, the � coefficients on SE trials fluctuated around zero.This pattern gave rise to a significant crossover interaction be-tween the AE and SE � coefficient curves (p � 0.021; Fig. 7B). Aswith the increased off-target activation on correct AE trials (Fig.6B) and the corresponding relationship with the rate of sensory
Figure 6. A, Orientation-selective tuning functions for mismatch AE and SE trials. ChannelTFs for the AE data (gray) and SE data (black) are plotted as a function of the offset of eachorientation channel from the stimulus presented on each trial (which is by convention alwaysset to 0°; note that channel responses were collapsed across clockwise and counterclockwiseoffsets as the functions were symmetrical about the 0° point) (see Materials and Methods). B,Tuning functions for mismatch AE trials. A comparison of tuning functions for correct (gray)versus incorrect (black) AE trials. The activation profile for correct responses was significantlydifferent from incorrect responses, with greater activation in channels offset by 35– 60° oncorrect AE trials. All error bars are �1SEM. C, Tuning functions for mismatch SE trials. A com-parison of tuning functions for correct (gray) versus incorrect (black) SE trials. There was nosignificant difference between the two tuning functions. All error bars are �1SEM. D, Interac-tion between mismatch AE trials and mismatch SE trials on correct and incorrect trials. A com-parison of the difference between correct and incorrect trials for AE (gray) and SE (black) tuningfunctions. There was a significant difference between these two tuning functions, with largeroff-target modulations on AE trials. All error bars are �1SEM across subjects. All p values werecalculated based on a nonparametric randomization procedure (for more details, see Materialsand Methods).
Ho et al. • Speed Pressure and Sensory Processing J. Neurosci., June 6, 2012 • 32(23):7992– 8003 • 7999

evidence accumulation on a between-subject basis (Fig. 7A), thistrial-by-trial coupling between the magnitude of off-target chan-nel responses and behavioral performance suggests that percep-tual decisions are tightly coupled to activation levels acrossinformative off-target sensory neurons, but only when subjectsemphasize accuracy over speed.
Correlating STLBA estimates with off-target activation levelsGiven the data presented thus far that off-target activation levelsin V1 predict behavior on AE trials, we would also predict apositive correlation between trial-by-trial estimates of the rate ofsensory evidence accumulation and the magnitude of the BOLDresponse in off-target channels. To evaluate this relationship, wecorrelated trial-by-trial estimates of off-target channel responsesand trial-by-trial estimates of drift rates derived from the STLBAmodel on a within-subject basis.
As in the standard LBA model described above, we let the rate ofsensory evidence accumulation (drift rate), response caution, andnondecision time vary freely across AE and SE conditions (and as inthe standard LBA model, the height of the starting point distributionwas fixed). Next, we estimated both channel responses and single-trial drift rates on each correct mismatch trial and then computed acorrelation between these metrics across all trials for each subject.We observed larger correlation coefficients on AE compared with SEtrials in channels tuned 30–55° away from the target. This patternproduced a significant crossover interaction between task instruc-tion and correlation coefficient (p � 0.01; Fig. 7C) and suggests thatlarger off-target responses selectively predict higher rates of evidenceaccumulation on AE trials. This finding converges with the prioranalyses of both channel response amplitude (Fig. 6B,D), between-subject correlation (Fig. 7A), and within-subject logistic regression(Fig. 7B), and is consistent with the idea that responses in informa-tive sensory neurons are strongly coupled with behavioral perfor-mance, but only in the absence of speed pressure. However, thisanalysis more directly links trial-by-trial fluctuations in off-targetchannel responses with the rate of sensory evidence accumulationduring decision making.
Note that the correlations shown in Figure 7C were expected tobe small because both measures (model parameters and BOLD re-sponses) are extremely variable when estimated on a trial-by-trialbasis. Nevertheless, even though they were small in magnitude, theobserved correlations were robust to reasonable changes in assump-tions about how model parameters were constrained across condi-tions. For example, the same general pattern was observed using avariant of the STLBA model in which the nondecision time was fixedacross trials. These results were also specific to trial-by-trial estimatesof the model parameter corresponding to the rate of sensory evi-dence accumulation: correlating V1 channel responses to raw re-sponse times or to trial-by-trial estimates of the parametercorresponding to response caution did not yield robust correlations.The selectivity of the correlations presented in Figure 7C thus illus-trates the explanatory power of the rate of sensory evidence accumu-lation on the SAT data and further supports the relationship betweenoptimal response patterns in V1 and decision making when subjectsemphasize accuracy over speed.
DiscussionWhen subjects emphasized accuracy, higher off-target activationlevels predicted larger differential rates of sensory evidence accumu-lation (Fig. 7A), logistic regression revealed a trial-by-trial relation-ship between behavioral accuracy and BOLD activation levels inoff-target orientation channels (Fig. 7B), and a model that providestrial-by-trial estimates of the latent cognitive processes involved inperceptual decision making (van Maanen et al., 2011) revealed acorrelation between activation levels in off-target channels and therate of sensory evidence accumulation (Fig. 7C).
The observation that off-target activation levels consistently pre-dict behavioral performance on AE trials suggests that decisionmechanisms can selectively pool inputs from the most informativesensory neurons (Purushothaman and Bradley, 2005; Law and Gold,
Figure 7. A, Between-subject correlation between differences in off-target channel re-sponses and differences in drift rates. The difference in the drift rates associated with correct andincorrect accumulators is positively correlated with the difference in off-target activation oncorrect and incorrect trials. B, Logistic regression results. � coefficients computed using a logis-tic regression to relate BOLD channel responses and behavioral performance (correct/incorrect)on a trial-by-trial basis. Positive coefficients indicate that larger BOLD signals correspond tocorrect responses, while negative coefficients indicate that larger BOLD signals correspond toincorrect responses. On AE trials (gray), larger signals in channels that were offset by 40 – 60°from the stimulus predicted a higher probability of correct responses. The fit coefficients on SEtrials (black) clustered around zero, except in the 0° channel, giving rise to a significant crossoverinteraction. All error bars are �1SEM across subjects. C, Correlations between STLBA drift rateswith channel responses on correct mismatch trials. Correlation coefficients (r values) betweenSTLBA drift rates and BOLD channel responses for the AE data (gray) and SE data (black) as afunction of channel orientation. On each trial, we estimated both the channel response and thedrift rate and then computed a correlation coefficient across trials per subject. The r valuesplotted here are averaged across subjects. The STLBA parameters were estimated based on amodel in which response threshold and drift rate were allowed to vary between task conditions.All error bars are �1SEM across subjects. All p values were calculated based on a nonparametricrandomization procedure (for more details, see Materials and Methods).
8000 • J. Neurosci., June 6, 2012 • 32(23):7992– 8003 Ho et al. • Speed Pressure and Sensory Processing
2009). However, this reliance on informative off-target channelsduring decision making only appears to happen on AE trials, asfluctuations in off-target responses do not predict behavior underspeed pressure. This observation leads to an interesting prediction:given the low overall accuracy under speed pressure, we might haveexpected that off-target activation levels on SE trials more closelymatch off-target activation levels on incorrect AE trials (Fig. 6, com-pare A, B). Contrary to this prediction, we instead observed thattuning functions in the SE condition more closely resemble tuningfunctions on correct AE trials. This suggests that poor performanceon SE trials is not related to low overall signal in off-target channelsper se, but instead is caused by a failure to rely on informative pop-ulations of sensory neurons in an optimal manner during decisionmaking. Although further investigation is clearly warranted, this ap-parent failure to rely on informative off-target neural responses onspeeded trials may reflect a heuristic that enables a quick but impre-cise readout of sensory information when response speed is at apremium.
One interpretation of the relationship between behavior andoff-target modulations on AE trials holds that top-down atten-tional signals originating in frontal and parietal cortex differen-tially bias activation levels in off-target channels on a trial-by-trialbasis. This type of attentional-feedback account is consistent bymany theories of attentional control (for review, see Desimoneand Duncan, 1995; Kastner and Ungerleider, 2000; Corbetta andShulman, 2002; Serences and Yantis, 2006; Yantis, 2008; Nou-doost et al., 2010) as well as recent evidence that the frontal oper-culum plays a causal role in governing attentional modulations invisual cortex and concomitant changes in performance acrossobservers (Higo et al., 2011), and that subregions of frontal cortexmediate perceptual decisions (Heekeren et al., 2004, 2008; deLafuente and Romo, 2005, 2006; Gold and Shadlen, 2007; Ho etal., 2009; Hernandez et al., 2010; Kayser et al., 2010; Lemus et al.,2010; Purcell et al., 2010). However, since we did not directlymanipulate attention in this study, it is difficult to dissociatesources of variability in V1 that are due to fluctuations in top–down biasing signals as opposed to sources of variability that arelocal to visual cortex. Future studies could more critically exam-ine this issue by pairing a SAT task with either a valid or a neutralattention cue to determine whether speed pressure selectivelyimpairs a subjects’ ability to use prior information to appropri-ately bias population response profiles in visual cortex.
In addition to suboptimal usage of sensory information dur-ing decision making, it is likely that performance under speedpressure in our task is further limited by other neural mecha-nisms that operate outside of primary visual cortex. Several stud-ies have found increased activation in the striatum when speededresponses are emphasized (Forstmann et al., 2008, 2010; vanVeen et al., 2008), consistent with a response threshold accountthat only motor and frontal areas are involved in mediating theSAT (Ratcliff, 1985; Ratcliff and Rouder, 1998; Forstmann et al.,2008, 2010; Ivanoff et al., 2008; van Veen et al., 2008; Wenzlaff etal., 2011). In contrast, our findings provide support for thesensory-readout account, which posits that perceptual perfor-mance under speed pressure is also limited by how efficientlysensory information is integrated during decision making.
The forward encoding model that was used to estimate re-sponses in different orientation channels is a proxy for the actualneural activity in the underlying populations of sensory neurons.This leads to an inevitable loss of resolution as a single V1 voxelcontains many neural populations, and the bandwidth of V1 neu-rons can be highly variable. Therefore, it is difficult to pinpointthe exact orientation offset at which off-target BOLD modula-
tions would peak given a perfectly optimal modulation of under-lying neural responses. However, the observation of increasedresponses starting in channels tuned 25–30° from the target isreasonable given the known tuning function properties of cells inV1 (Schiller et al., 1976; Ringach et al., 2002a,b; Gur et al., 2005).More generally, the robust relationship between off-channel ac-tivation levels and behavior supports the functional importanceof the observed modulations, and is consistent with establishedmodels of optimal gain during fine discriminations (Fig. 2).
Generating channel tuning functions also depends criticallyon the ability of fMRI to reliably measure orientation-selectiveresponses in primary visual cortex. In V1, it is likely that thesefeature-selective response biases depend to a large degree on rel-atively coarse maps of orientation space that unfold across thecortical surface (Leventhal, 1983; Schall et al., 1986; Sasaki et al.,2006; Mannion et al., 2009; Zhang et al., 2010; Freeman et al.,2011). For instance, there is a radial orientation bias in V1 (Sasakiet al., 2006; Zhang et al., 2010; Freeman et al., 2011). Thus, neu-rons with spatial receptive fields in (say) the upper right visualfield tend to respond more to oblique orientations around 45°,and so on. Given the robust retinotopic organization of V1, thisradial bias would generate an orderly representation of orienta-tion across patches of cortex that represent each visual quadrant(Sasaki et al., 2006; Zhang et al., 2010; Freeman et al., 2011). Inaddition to this coarse orientation map across V1, voxel-levelorientation selectivity may also reflect contributions from ran-dom anisotropies in the distribution of orientation-selective col-umns within a voxel (Haynes and Rees, 2005; Kamitani andTong, 2005; Swisher et al., 2010) (for a useful graphical illustra-tion, see Boynton, 2005). Thus, there is growing evidence that thecombination of BOLD fMRI and encoding models can be used toindex feature-selective responses arising from neural signals atboth coarse and fine spatial scales.
Despite this link, we do not claim that orientation-selectiveresponse functions are solely related to neural spiking activity, asthe BOLD signal is modulated by many sources including synap-tic input from both local and distant inputs, tuned local fieldpotentials, and even responses in astrocytes (Heeger et al., 2000;Logothetis et al., 2001; Buxton, 2002; Heeger and Ress, 2002;Logothetis and Wandell, 2004; Schummers et al., 2008; Sirotinand Das, 2009; Kleinschmidt and Muller, 2010; Das and Sirotin,2011; Handwerker and Bandettini, 2011a,b; Jia et al., 2011).However, given that neurons in early sensory areas like V1 aremassively interconnected (Douglas and Martin, 2007), changesin the BOLD signal related to synaptic activity should be highlycorrelated with changes in local spiking activity. Despite thesecaveats, the robust predictive relationship between off-targetchannel modulations and behavior strongly supports the func-tional significance of these indirect BOLD assays of neuronalactivation.
The instruction-dependent change in the reliance of decisionmechanisms on off-target channels in V1 is consistent with otherrecent studies of perceptual decision making. For instance, Kahntet al. (2011) found that training-related improvements in perfor-mance on a difficult perceptual discrimination task could be ex-plained by a model in which sensory information is read out moreeffectively, thereby improving the representations of the decisionvariables leading up to the ultimate choice (Purushothaman andBradley, 2005; Law and Gold, 2008, 2009; Pestilli et al., 2011).Similarly, Rahnev et al. (2011) observed that manipulating priorexpectation increased functional connectivity between posteriorand frontal areas, consistent with an increase in the rate of sen-sory evidence transfer from earlier visual areas to putative deci-
Ho et al. • Speed Pressure and Sensory Processing J. Neurosci., June 6, 2012 • 32(23):7992– 8003 • 8001

sion mechanisms. Thus, the present results complement otherrecent studies that emphasize the importance of efficient sensoryreadout in perceptual decision making, and suggest that the op-timality of readout breaks down under speed pressure.
ReferencesBogacz R, Brown E, Moehlis J, Holmes P, Cohen JD (2006) The physics of
optimal decision making: a formal analysis of models of performance intwo-alternative forced-choice tasks. Psychol Rev 113:700 –765.
Bogacz R, Wagenmakers EJ, Forstmann BU, Nieuwenhuis S (2010) Theneural basis of the speed-accuracy tradeoff. Trends Neurosci 33:10 –16.
Boynton GM (2005) Imaging orientation selectivity: decoding consciousperception in V1. Nat Neurosci 8:541–542.
Brainard DH (1997) The Psychophysics Toolbox. Spat Vis 10:433– 436.Brouwer GJ, Heeger DJ (2009) Decoding and reconstructing color from
responses in human visual cortex. J Neurosci 29:13992–14003.Brouwer GJ, Heeger DJ (2011) Cross-orientation suppression in human vi-
sual cortex. J Neurophysiol 106:2108 –2119.Brown S, Heathcote A (2005) A ballistic model of choice response time.
Psychol Rev 112:117–128.Brown SD, Heathcote A (2008) The simplest complete model of choice re-
sponse time: linear ballistic accumulation. Cogn Psychol 57:153–178.Burnham KP, Anderson DR (2002) Model selection and multimodel infer-
ence: a practical information theoretic approach, Ed 2. New York:Springer.
Butts DA, Goldman MS (2006) Tuning curves, neuronal variability, andsensory coding. PLoS Biol 4:e92.
Buxton RB (2002) Introduction to functional magnetic resonance imaging:principles and techniques. Cambridge, UK: Cambridge UP.
Clark HH, Chase WG (1972) On the process of comparing sentences againstpictures. Cogn Psychol 3:472–517.
Corbetta M, Shulman GL (2002) Control of goal-directed and stimulus-driven attention in the brain. Nat Rev Neurosci 3:201–215.
Das A, Sirotin YB (2011) What could underlie the trial-related signal? Aresponse to the commentaries by Drs. Kleinschmidt and Muller, and Drs.Handwerker and Bandettini. Neuroimage 55:1413–1418.
de Lafuente V, Romo R (2005) Neuronal correlates of subjective sensoryexperience. Nat Neurosci 8:1698 –1703.
de Lafuente V, Romo R (2006) Neural correlate of subjective sensory expe-rience gradually builds up across cortical areas. Proc Natl Acad Sci U S A103:14266 –14271.
Desimone R, Duncan J (1995) Neural mechanisms of selective visual atten-tion. Annu Rev Neurosci 18:193–222.
Dickman SJ, Meyer DE (1988) Impulsivity and speed-accuracy tradeoffs ininformation processing. J Pers Soc Psychol 54:274 –290.
Donkin C, Brown SD, Heathcote A (2011a) Drawing conclusions fromchoice response time models: a tutorial. J Math Psychol 55:140 –151.
Donkin C, Brown S, Heathcote A, Wagenmakers EJ (2011b) Diffusion ver-sus linear ballistic accumulation: different models but the same conclu-sions about psychological processes? Psychon Bull Rev 18:61– 69.
Douglas RJ, Martin KA (2007) Recurrent neuronal circuits in the neocortex.Curr Biol 17:R496 –R500.
Dumoulin SO, Wandell BA (2008) Population receptive field estimates inhuman visual cortex. Neuroimage 39:647– 660.
Engel SA, Rumelhart DE, Wandell BA, Lee AT, Glover GH, Chichilnisky EJ,Shadlen MN (1994) fMRI of human visual cortex. Nature 369:525.
Fitts PM (1966) Cognitive aspects of information processing: III. Set forspeed versus accuracy. J Exp Psychol 71:849 – 857.
Forstmann BU, Dutilh G, Brown S, Neumann J, von Cramon DY, Ridderink-hof KR, Wagenmakers EJ (2008) Striatum and pre-SMA facilitatedecision-making under time pressure. Proc Natl Acad Sci U S A105:17538 –17542.
Forstmann BU, Anwander A, Schafer A, Neumann J, Brown S, WagenmakersEJ, Bogacz R, Turner R (2010) Cortico-striatal connections predict con-trol over speed and accuracy in perceptual decision making. Proc NatlAcad Sci U S A 107:15916 –15920.
Freeman J, Brouwer GJ, Heeger DJ, Merriam EP (2011) Orientation decod-ing depends on maps, not columns. J Neurosci 31:4792– 4804.
Freeman WT, Adelson EH (1991) The design and use of steerable filters.IEEE Trans Pattern Anal Mach Intell 13:891–906.
Gold JI, Shadlen MN (2007) The neural basis of decision making. Annu RevNeurosci 30:535–574.
Gourtzelidis P, Tzagarakis C, Lewis SM, Crowe DA, Auerbach E, Jerde TA,Ugurbil K, Georgopoulos AP (2005) Mental maze solving: directionalfMRI tuning and population coding in the superior parietal lobule. ExpBrain Res 165:273–282.
Gur M, Kagan I, Snodderly DM (2005) Orientation and direction selectivityof neurons in V1 of alert monkeys: functional relationships and laminardistributions. Cereb Cortex 15:1207–1221.
Handwerker DA, Bandettini PA (2011a) Hemodynamic signals not pre-dicted? Not so: a comment on Sirotin and Das (2009). Neuroimage55:1409 –1412.
Handwerker DA, Bandettini PA (2011b) Simple explanations before com-plex theories: alternative interpretations of Sirotin and Das’ observations.Neuroimage 55:1419 –1422.
Haynes JD, Rees G (2005) Predicting the orientation of invisible stimulifrom activity in human primary visual cortex. Nat Neurosci 8:686 – 691.
Heeger DJ, Ress D (2002) What does fMRI tell us about neuronal activity?Nat Rev Neurosci 3:142–151.
Heeger DJ, Huk AC, Geisler WS, Albrecht DG (2000) Spikes versus BOLD:what does neuroimaging tell us about neuronal activity? Nat Neurosci3:631– 633.
Heekeren HR, Marrett S, Bandettini PA, Ungerleider LG (2004) A generalmechanism for percetual decision making in the human brain. Nature431:859 – 862.
Heekeren HR, Marrett S, Ungerleider LG (2008) The neural systems thatmediate human perceptual decision making. Nat Rev Neurosci9:467– 479.
Hernandez A, Nacher V, Luna R, Zainos A, Lemus L, Alvarez M, Vazquez Y,Camarillo L, Romo R (2010) Decoding a perceptual decision processacross cortex. Neuron 66:300 –314.
Higo T, Mars RB, Boorman ED, Buch ER, Rushworth MF (2011) Distrib-uted and causal influence of frontal operculum in task control. Proc NatlAcad Sci U S A 108:4230 – 4235.
Ho TC, Brown S, Serences JT (2009) Domain general mechanisms of per-ceptual decision making in human cortex. J Neurosci 29:8675– 8687.
Hol K, Treue S (2001) Different populations of neurons contribute to thedetection and discrimination of visual motion. Vision Res 41:685– 689.
Hubner R, Steinhauser M, Lehle C (2010) A dual-stage two-phase model ofselective attention. Psychol Rev 117:759 –784.
Ivanoff J, Branning P, Marois R (2008) fMRI evidence for a dual processaccount of the speed-accuracy tradeoff in decision-making. PLoS One3:e2635.
Jazayeri M, Movshon JA (2006) Optimal representation of sensory informa-tion by neural populations. Nat Neurosci 9:690 – 696.
Jia X, Smith MA, Kohn A (2011) Stimulus selectivity and spatial coherenceof gamma components of the local field potential. J Neurosci31:9390 –9403.
Kahnt T, Grueschow M, Speck O, Haynes JD (2011) Perceptual learningand decision-making in human medial frontal cortex. Neuron70:549 –559.
Kamitani Y, Tong F (2005) Decoding the visual and subjective contents ofthe human brain. Nat Neurosci 8:679 – 685.
Kastner S, Ungerleider LG (2000) Mechanisms of visual attention in thehuman cortex. Annu Rev Neurosci 23:315–341.
Kay KN, Gallant JL (2009) I can see what you see. Nat Neurosci 12:245.Kay KN, Naselaris T, Prenger RJ, Gallant JL (2008) Identifying natural im-
ages from human brain activity. Nature 452:352–355.Kayser AS, Buchsbaum BR, Erickson DT, D’Esposito M (2010) The func-
tional anatomy of a perceptual decision in the human brain. J Neuro-physiol 103:1179 –1194.
Kleinschmidt A, Muller NG (2010) The blind, the lame, and the poor signalsof brain function—a comment on Sirotin and Das (2009). Neuroimage50:622– 625.
Law CT, Gold JI (2008) Neural correlates of perceptual learning in asensory-motor, but not a sensory, cortical area. Nat Neurosci 11:505–513.
Law CT, Gold JI (2009) Reinforcement learning can account for associativeand perceptual learning on a visual-decision task. Nat Neurosci12:655– 663.
Lemus L, Hernandez A, Luna R, Zainos A, Romo R (2010) Do sensory cor-tices process more than one sensory modality during perceptual judg-ments? Neuron 67:335–348.
Leventhal AG (1983) Relationship between preferred orientation and re-
8002 • J. Neurosci., June 6, 2012 • 32(23):7992– 8003 Ho et al. • Speed Pressure and Sensory Processing

ceptive field position of neurons in cat striate cortex. J Comp Neurol220:476 – 483.
Logothetis NK, Wandell BA (2004) Interpreting the BOLD signal. Annu RevPhysiol 66:735–769.
Logothetis NK, Pauls J, Augath M, Trinath T, Oeltermann A (2001) Neuro-physiological investigation of the basis of the fMRI signal. Nature412:150 –157.
Mannion DJ, McDonald JS, Clifford CW (2009) Discrimination of the localorientation structure of spiral glass patterns early in human visual cortex.Neuroimage 46:511–515.
Moore BC (2008) Basic auditory processes involved in the analysis of speechsounds. Philos Trans R Soc Lond B Biol Sci 363:947–963.
Naselaris T, Prenger RJ, Kay KN, Oliver M, Gallant JL (2009) Bayesian re-construction of natural images from human brain activity. Neuron63:902–915.
Naselaris T, Kay KN, Nishimoto S, Gallant JL (2011) Encoding and decod-ing in fMRI. Neuroimage 56:400 – 410.
Navalpakkam V, Itti L (2007) Search goal tunes visual features optimally.Neuron 53:605– 617.
Nelder JA, Mead R (1965) A simplex algorithm for function minimization.Comput J 7:308 –313.
Noudoost B, Chang MH, Steinmetz NA, Moore T (2010) Top-down con-trol of visual attention. Curr Opin Neurobiol 20:183–190.
Palmer J, Huk AC, Shadlen MN (2005) The effect of stimulus strength onthe speed and accuracy of a perceptual decision. J Vis 5:376 – 404.
Pelli DG (1997) The Video Toolbox software for visual psychophysics:transforming numbers into movies. Spat Vis 10:437– 442.
Pestilli F, Carrasco M, Heeger DJ, Gardner JL (2011) Attentional enhance-ment via selection and pooling of early sensory responses in human visualcortex. Neuron 72:832– 846.
Purcell BA, Heitz RP, Cohen JY, Schall JD, Logan GD, Palmeri TJ (2010)Neurally constrained modeling of perceptual decision making. PsycholRev 117:1113–1143.
Purushothaman G, Bradley DC (2005) Neural population code for fine per-ceptual decisions in area MT. Nat Neurosci 8:99 –106.
Raftery AE (1995) Bayesian model selection in social research (with discus-sion). Sociol Methodol 25:111–193.
Rahnev D, Lau H, de Lange FP (2011) Prior expectation modulates the in-teraction between sensory and prefrontal regions in the human brain.J Neurosci 31:10741–10748.
Ratcliff R (1978) A theory of memory retrieval. Psychol Rev 85:59 –108.Ratcliff R (1985) Theoretical interpretations of the speed and accuracy of
positive and negative responses. Psychol Rev 92:212–225.Ratcliff R, McKoon G (2008) The diffusion decision model: theory and data
for two-choice decision tasks. Neural Comput 20:873–922.Ratcliff R, Rouder JN (1998) Modeling response times for two-choice deci-
sions. Psychol Sci 9:347–356.Ratcliff R, Tuerlinckx F (2002) Estimating parameters of the diffusion mod-
el: approaches to dealing with contaminant reaction times and parametervariability. Psychon Bull Rev 9:438 – 481.
Regan D, Beverley KI (1985) Postadaptation orientation discrimination.J Opt Soc Am 2:147–155.
Ringach DL, Bredfeldt CE, Shapley RM, Hawken MJ (2002a) Suppression ofneural responses to nonoptimal stimuli correlates with tuning selectivityin macaque V1. J Neurophysiol 87:1018 –1027.
Ringach DL, Shapley RM, Hawken MJ (2002b) Orientation selectivity inmacaque V1: diversity and laminar dependence. J Neurosci 22:5639 –5651.
Sasaki Y, Rajimehr R, Kim BW, Ekstrom LB, Vanduffel W, Tootell RB (2006)The radial bias: a different slant on visual orientation sensitivity in humanand nonhuman primates. Neuron 51:661– 670.
Schall JD, Vitek DJ, Leventhal AG (1986) Retinal constraints on orientationspecificity in cat visual cortex. J Neurosci 6:823– 836.
Schiller PH, Finlay BL, Volman SF (1976) Quantitative studies of single-cellproperties in monkey striate cortex. II. Orientation specificity and oculardominance. J Neurophysiol 39:1320 –1333.
Schoups A, Vogels R, Qian N, Orban G (2001) Practising orientation iden-tification improves orientation coding in V1 neurons. Nature 412:549 –553.
Schummers J, Yu H, Sur M (2008) Tuned responses of astrocytes and theirinfluence on hemodynamic signals in the visual cortex. Science320:1638 –1643.
Schwarz G (1978) Estimating the dimension of a model. Ann Stat6:461– 464.
Scolari M, Serences JT (2009) Adaptive allocation of attentional gain. J Neu-rosci 29:11933–11942.
Scolari M, Serences JT (2010) Basing perceptual decisions on the most in-formative sensory neurons. J Neurophysiol 104:2266 –2273.
Serences JT, Boynton GM (2007a) Feature-based attentional modulationsin the absence of direct visual stimulation. Neuron 55:301–312.
Serences JT, Boynton GM (2007b) The representation of behavioral choicefor motion in human visual cortex. J Neurosci 27:12893–12899.
Serences JT, Saproo S (2012) Computational advances towards linkingBOLD and behavior. Neuropsychologia 50:435– 446.
Serences JT, Yantis S (2006) Selective visual attention and perceptual coher-ence. Trends Cogn Sci 10:38 – 45.
Serences JT, Saproo S, Scolari M, Ho T, Muftuler LT (2009) Estimating theinfluence of attention on population codes in human visual cortex usingvoxel-based tuning functions. Neuroimage 44:223–231.
Sereno MI, Dale AM, Reppas JB, Kwong KK, Belliveau JW, Brady TJ, RosenBR, Tootell RB (1995) Borders of multiple visual areas in human re-vealed by functional magnetic resonance imaging. Science 268:889 – 893.
Sirotin YB, Das A (2009) Anticipatory haemodynamic signals in sensorycortex not predicted by local neuronal activity. Nature 457:475– 479.
Starns JJ, Ratcliff R (2010) The effects of aging on the speed-accuracy com-promise: boundary optimality in the diffusion model. Psychol Aging25:377–390.
Swindale NV (1998) Orientation tuning curves: empirical description andestimation of parameters. Biol Cybern 78:45–56.
Swisher JD, Gatenby JC, Gore JC, Wolfe BA, Moon CH, Kim SG, Tong F(2010) Multiscale pattern analysis of orientation-selective activity in theprimary visual cortex. J Neurosci 30:325–330.
Thirion B, Duchesnay E, Hubbard E, Dubois J, Poline JB, Lebihan D, DehaeneS (2006) Inverse retinotopy: inferring the visual content of images frombrain activation patterns. Neuroimage 33:1104 –1116.
Usher M, McClelland JL (2001) The time course of perceptual choice: theleaky, competing accumulator model. Psychol Rev 108:550 –592.
Vandekerckhove J, Tuerlinckx F (2007) Fitting the Ratcliff diffusion modelto experimental data. Psychon Bull Rev 14:1011–1026.
Vandekerckhove J, Tuerlinckx F (2008) Diffusion model analysis withMATLAB: a DMAT primer. Behav Res Methods 40:61–72.
Vandekerckhove J, Tuerlinckx F, Lee MD (2011) Hierarchical diffusionmodels for two-choice response times. Psychol Methods 16:44 – 62.
van Maanen L, Brown SD, Eichele T, Wagenmakers EJ, Ho T, Serences J,Forstmann BU (2011) Neural correlates of trial-to-trial fluctuations inresponse caution. J Neurosci 31:17488 –17495.
van Veen V, Krug MK Carter CS (2008) The neural and computational basisof controlled speed-accuracy tradeoff during task performance. J CognNeurosci 20:1952–1965.
Voss A, Rothermund K, Voss J (2004) Interpreting the parameters of thediffusion model: an empirical validation. Mem Cognit 32:1206 –1220.
Wandell BA, Dumoulin SO, Brewer AA (2007) Visual field maps in humancortex. Neuron 56:366 –383.
Wenzlaff H, Bauer M, Maess B, Heekeren HR (2011) Neural characteriza-tion of the speed-accuracy tradeoff in a perceptual decision-making task.J Neurosci 31:1254 –1266.
Wickelgren W (1977) Speed-accuracy tradeoff and information-processingdynamics. Acta Psychol 41:67– 85.
Wolfe JM, Van Wert MJ (2010) Varying target prevalence reveals two, dis-social decision criteria in visual search. Curr Biol 20:121–124.
Woodworth RS (1899) The accuracy of voluntary movement. Psychol Rev3:1–114.
Yantis S (2008) The neural basis of selective attention: cortical sources andtargets of attentional modulation. Curr Dir Psychol Sci 17:86 –90.
Zhang E, Huang M, Xiang X, Yan Y, Shen MY, Chen M, Xu X, Li W (2010)Anisotropic orientation selectivity of monkey V1 neurons in Cartesianand polar coordinates. Soc Neurosci Abstr 36:483.12.
Ho et al. • Speed Pressure and Sensory Processing J. Neurosci., June 6, 2012 • 32(23):7992– 8003 • 8003