the oregon department of education should take further...
TRANSCRIPT
Secretary of State Dennis Richardson
Audits Division, Director Kip Memmott
Report 2017 –29
State of Oregon
The Oregon Department of Education Should Take Further Steps to Help Districts and High Schools Increase Oregon’s Graduation Rate December 2017
CONFIDENTIAL DRAFT

This page intentionally left blank.

Secretary of State Audit Highlights December 2017
The Oregon Department of Education Should Take Further Steps to Help Districts and High Schools Increase Oregon’s Graduation Rate
Audit Purpose
The purpose of the audit was to determine how ODE and school districts could increase four-year graduation rates in Oregon’s public high schools.
Key Findings
Through school visits, interviews, data analysis, and document reviews, we found that:
Students who changed districts during high school – more than a quarter of all high school students – had graduation rates roughly 30% lower than students who did not. ODE does not analyze or report graduation performance for these students.
Schools with mid-range graduation rates – 67%-85% - receive limited improvement support from ODE, though most non-graduates attend these schools.
More than 70% of students who do not graduate on time are low-income. ODE should assess the need for services to help those students succeed.
The Legislature and ODE has not emphasized middle school performance or student transitions from middle school to high school, though students who struggle in middle school are already at risk of not graduating.
ODE does not track student grades or specific credits attained, data the agency could use to help more students graduate.
ODE should improve its internal communications and help districts and schools communicate the importance of graduation to parents and the community.
Background
One in four Oregon public high school students does not graduate on time.
Current steps to boost on-time graduation rates include plans to reduce chronic absenteeism, prevent students from dropping out, increase access to college-level courses in high school, and increase career-technical education.
Report Highlights
The Oregon Department of Education (ODE) has prioritized improving four-year graduation rates in recent years. The Secretary of State Audits Division found ODE could make further progress by helping schools and districts focus on specific groups, such as students who transfer between districts, low-income students, and middle school students. ODE can also better help districts and schools use data to identify students in danger of not graduating, use effective improvement tools, and communicate the importance of graduation to parents and the community.
Recommendations
The report includes recommendations to the Oregon Department of Education on additional efforts it could take to increase on-time graduation rates. Among them: focusing on specific student groups, supporting coordination between middle schools and high schools, collecting more detailed student data, and helping districts better use improvement tools.
The Oregon Department of Education generally agreed with our findings and recommendations. The agency’s response can be found at the end of the report.
Secretary of State, Dennis Richardson Oregon Audits Division, Kip Memmott, Director
About the Secretary of State Audits Division
The Oregon Constitution provides that the Secretary of State shall be, by virtue of his office, Auditor of Public Accounts. The Audits Division performs this duty. The division reports to the elected Secretary of State and is independent of other agencies within the Executive, Legislative, and Judicial branches of Oregon government. The division has constitutional authority to audit all state officers, agencies, boards, and commissions and oversees audits and financial reporting for local governments.
Audit Team
William Garber, CGFM, MPA, Deputy Director
Sheronne Blasi, MPA, Audit Manager
Andrew Love, Audit Manager
Karen Peterson, Principal Auditor
Jonathan Bennett, MPA, Staff Auditor
This report is intended to promote the best possible management of public resources. Copies may be obtained from:
website: sos.oregon.gov/audits
phone: 503-986-2255
mail: Oregon Audits Division 255 Capitol Street NE, Suite 500 Salem, Oregon 97310
We sincerely appreciate the courtesies and cooperation extended by officials and employees of the Oregon Department of Education, school districts, and high schools during the course of this audit.

Report Number 2017-29 December 2017 ODE Graduation Rates Page 1
For the 2015-17 biennium, ODE had an operating budget of $297 million and 439 full-time equivalent positions.
Secretary of State Audit Report
The Oregon Department of Education Should Take Further Steps to Help Districts and High Schools Increase Oregon’s Graduation Rate
One in four Oregon public high school students does not graduate on time. Oregon’s 75% graduation rate trails the national average of 84% and is well below Oregon’s goal of all students graduating. The Oregon Department of Education (ODE) has taken steps to improve four-year graduation rates. We found ODE can make further progress by helping schools and districts focus on specific groups, such as students who transfer between districts, low-income students, and middle school students. ODE can also better help districts and schools use data to identify students at risk of not graduating, use effective improvement tools, and communicate the importance of graduation to parents and the community.
Introduction
Oregon’s public education system includes multiple partners that each play a key role related to student graduation rates.
Governor - Since 2011, the Governor is the Superintendent of Public Instruction and appoints the Deputy Superintendent of Public Instruction to lead the Department of Education.
State Legislature - The Legislature sets the overall K-12 funding level and passes laws that establish or modify education programs and goals. It also sets the mandatory requirements for student graduation.
State Board of Education - The State Board of Education oversees ODE and sets educational policies and standards for Oregon’s public schools. The board is made up of seven voting members appointed by the Governor and approved by the Senate. The State Treasurer and Secretary of State are also on the board, serving as non-voting, ex-officio members.
Department of Education - ODE is responsible for administering state and federal grant programs, ensuring school districts comply with laws and rules, administering distribution of state funds to districts, and holding districts and schools accountable by reporting student performance
The education system involves multiple layers of government

Report Number 2017-29 December 2017 ODE Graduation Rates Page 2
information. Its mission is to “foster equity and excellence for every learner through collaboration with educators, partners, and communities.” Agency divisions include:
Office of the Deputy Superintendent: Provides management and leadership for the agency. This division also includes staff responsible for government and legal affairs, internal audits, State Board of Education administration, and communications.
Office of Teaching, Learning and Assessment: Responsible for developing academic content standards, district and school improvement efforts, accelerated credit programs, career and technical education, and statewide assessments.
Office of Student Services: Oversees a number of program areas including special education, child nutrition, and school health.
Office of Accountability, Research and Information Services: Collects and analyzes data supporting ODE’s accountability and research roles, and provides data collection support for Oregon’s schools and districts.
Office of Equity, Diversity and Inclusion: Responsible for activities related to closing the achievement gap, migrant education, civil rights, African American statewide education plan, and English Language Learner support and monitoring.
Office of Finance and Administration: Provides internal fiscal and administrative services, and calculates and distributes payments to schools and districts from the State School Fund.
Early Learning Division and the Youth Development Council: Since 2013, ODE has administered the programs for the Youth Development Council and the Early Learning Division. These differ from other divisions as they have their own policy boards.
Chief Education Office - The Chief Education Office, created in 2015, is charged with building a seamless system of education in Oregon. Its role is to foster stronger connections and curriculum alignment from early learning through post-secondary education and the workforce to improve student outcomes.
School Districts - Oregon’s 197 school districts are responsible for governing their schools consistent with State Board of Education policies. Districts establish their own strategic plans, set school days and hours, determine their curriculum, and decide how they will distribute their allocation of state school funding. Roughly, 1,250 public schools in these districts educate more than 575,000 students.
Education Service Districts – Oregon’s 19 education service districts provide regional services to assist school districts in providing equitable education opportunities for all public school students.
Report Number 2017-29 December 2017 ODE Graduation Rates Page 3
Cohort Graduation Rate: Follows the cohort of students who enter the 9th grade in the same year through their 12th grade year, adjusting for students who transfer in and out of the state. The graduation rate is the percent of students who earn a high school diploma in this period, which includes the Oregon diploma and modified diploma.
Federal Government - The U.S. Department of Education’s role is shifting with the Every Student Succeeds Act (ESSA), which passed in December 2015 and replaced No Child Left Behind (NCLB). Like NCLB, ESSA provides federal funds and academic services for students in poverty and other historically underserved groups. It also requires states to have an accountability system.1 Unlike NCLB, ESSA gives states more flexibility in designing accountability systems and in identifying and supporting schools and districts that need improvement. Federal officials approved Oregon’s ESSA plan in August 2017.
In 2011, Oregon’s Legislature set an ambitious education goal: all eligible Oregonians would have at least a high school diploma or equivalent by 2025. As we will detail later in this report, Oregon’s 75% cohort graduation rate remains low nationally, but has increased in the last five years. Below, are some of the initiatives ODE and its partners have undertaken.
Equity Lens - The State Board of Education adopted an “Equity Lens” on race and ethnicity to better support traditionally underserved students.2 As part of that emphasis, ODE developed plans to improve graduation rates and other outcomes for the state’s African American students, Native American students, migrant students, and English Language Learners. The Tribal Attendance Pilot Program (TAPP) is an example of a specific program designed to enhance education equity by improving the attendance of Native American students.
Chronic Absenteeism Plan - To address the high rate of chronic absenteeism in Oregon’s public schools, ODE, and the Chief Education Office developed a Chronic Absenteeism Plan in 2016. ODE received $7.4 million to implement the plan in the 2017-19 biennium. Chronic absenteeism rates are highest in high school, peaking in the 12th grade, at 32% of the student body. Research indicates that chronically absent students - students who miss 10% of school days or more in a school year - have lower graduation rates, lower performance on standardized tests, and increased behavioral issues.
Graduation Improvement Blueprint - ODE also recently issued a graduation improvement blueprint, which it formed with stakeholder
1 ESSA requires states to develop an accountability system that meaningfully differentiates the performance of all public schools in the state annually. It must include measures of student achievement, graduation rates, and school quality. One measure of school quality that Oregon will use is student absenteeism. Performance must be reported for all student groups. 2The Equity Lens explicitly identifies disparities in education outcomes for targeting areas of action, intervention and investment, with a focus on issues related to race and ethnicity.
ODE and its partners have focused on improving graduation rates in recent years
The first year of TAPP, based on ODE’s evaluation of the program, has found improved attendance, evidence of improved relations between tribes and school districts, and areas to target with interventions.

Report Number 2017-29 December 2017 ODE Graduation Rates Page 4
input. It identifies critical elements to improve graduation rates and highlights some successful, evidence-based strategies used around the state.
Measure 98 - Measure 98, a 2016 ballot initiative approved by the voters, provides direct funding to school districts to increase high school graduation rates. These funds can be used for Career and Technical Education, college-level courses while in high school, and dropout prevention programs.3 Districts receive funds based on the number of students they have. The Legislature approved $170 million for the 2017-19 biennium, approximately 60% of the measure’s original funding level.
Other Graduation Rate Initiatives - Other evidence-based initiatives have been implemented to increase graduation rates. Those initiatives include state funding for full-day kindergarten and expansion of Career Technical Education (CTE). The Legislature has also considered and passed numerous policy measures targeted at early childhood and K-12 education. In the 2017 legislative session, the Legislature passed 16 education-related policy measures, and considered another 23.
The State Board of Education adopted increased graduation requirements in 2007. These requirements were fully adopted in 2014. The new requirements increased the minimum number of credits needed to graduate and gave all students the option to earn credit by demonstrating proficiency.4
3 Ballot Measure 98 was adopted into state statute as the “High School Graduation and College and Career Readiness Act of 2016.” The Measure indicates that by no later than December 31, 2020 and every two years thereafter, the Secretary of State shall conduct financial and program audits of the High School Graduation and College and Career Readiness Fund. 4 Proficiency credit is earned for demonstrating defined levels of proficiency or mastery of recognized standards by successfully completing classroom or equivalent work, successfully passing an appropriate exam, providing a collection of work or assessment evidence, or providing documentation of prior learning activities or experiences. For example, this allows meeting math requirements through courses such as Integrated Math, Applied Math, Construction Math, and Business Math, as long as they meet the content threshold of Algebra I or higher.
The State Board of Education has increased high school graduation requirements
Career-related learning experiences: Students participate in activities that connect classroom learning with relevant real life experiences in the workplace, community, and/or school. Extended application: Students apply and extend their knowledge in new and complex situations related to their personal and/or career interests and post-high school goals through critical thinking, problem solving or inquiry in real world contexts.

Report Number 2017-29 December 2017 ODE Graduation Rates Page 5
Currently, high school students must complete credit requirements, demonstrate essential skills proficiency, and meet personalized learning requirements to receive an Oregon diploma. Specifically, the requirements include:
Students demonstrate they have met essential skills requirements by using either the Smarter Balanced assessment, other approved assessments such as the ACT and ASSET, or work samples scored using official state scoring guides.
For personalized learning, students complete an education plan and profile, and assemble a collection of their work that displays how they met career-related learning experiences and extended application of essential skills learned in their educational career. Students may address both career-related learning experiences and extended application in one collection, or create separate collections, depending on the nature of the learning experience or project. Collections may include an internship report, evaluation and documentation of a workplace activity, job shadow notebook, technical or research report with documentation of work and reflection, and summary and documentation of a project related to school.
Modified diplomas require a complete course of study aligned with the state’s academic standards, and are included in Oregon’s graduation rate. They are for students with documented learning or medical barriers who have shown an inability to achieve an Oregon diploma. Students still must earn 24 credits, though 12 are designated to certain academic subjects and the other 12 toward electives. Credits may be earned through a combination of modified classes, regular education classes, and credit by proficiency.
Credits
English/Language Arts – 4 credits
Mathematics – 3 credits (Algebra I and higher)
Science – 3 credits (2 with lab experiences)
Social Science – 3 credits
Physical Education – 1 credit
Health Education – 1 credit
Second Language/Art/CTE – 3 credits
Electives – 6 credits
Total – 24 credits
Essential Skills
Read and comprehend a variety of text
Write clearly and accurately
Apply mathematics in a variety of settings
Personalized Learning
Education plan and profile
Career-related learning experiences
Extended application
Report Number 2017-29 December 2017 ODE Graduation Rates Page 6
Similar to other states, the majority of Oregon’s K-12 education funding comes from the state, which allocated $8.2 billion for K-12 education in the 2017-19 biennium. State funds, which are combined with local property and timber tax revenues, are distributed to districts using a formula designed to equalize allocations across districts. For the 2017-19 biennium, local revenues will provide $4 billion for K-12 education.
The Legislature has increased state funds in each of the last four biennia, including an 11% increase in 2017-19. However, since property tax limitations passed in the 1990s5, Oregon’s school per student funding has remained virtually the same, factoring for inflation, and have not kept pace with increased education expenses. Education organizations estimate it would have taken another $200 million in the 2017-19 biennium for most districts to maintain their programs.
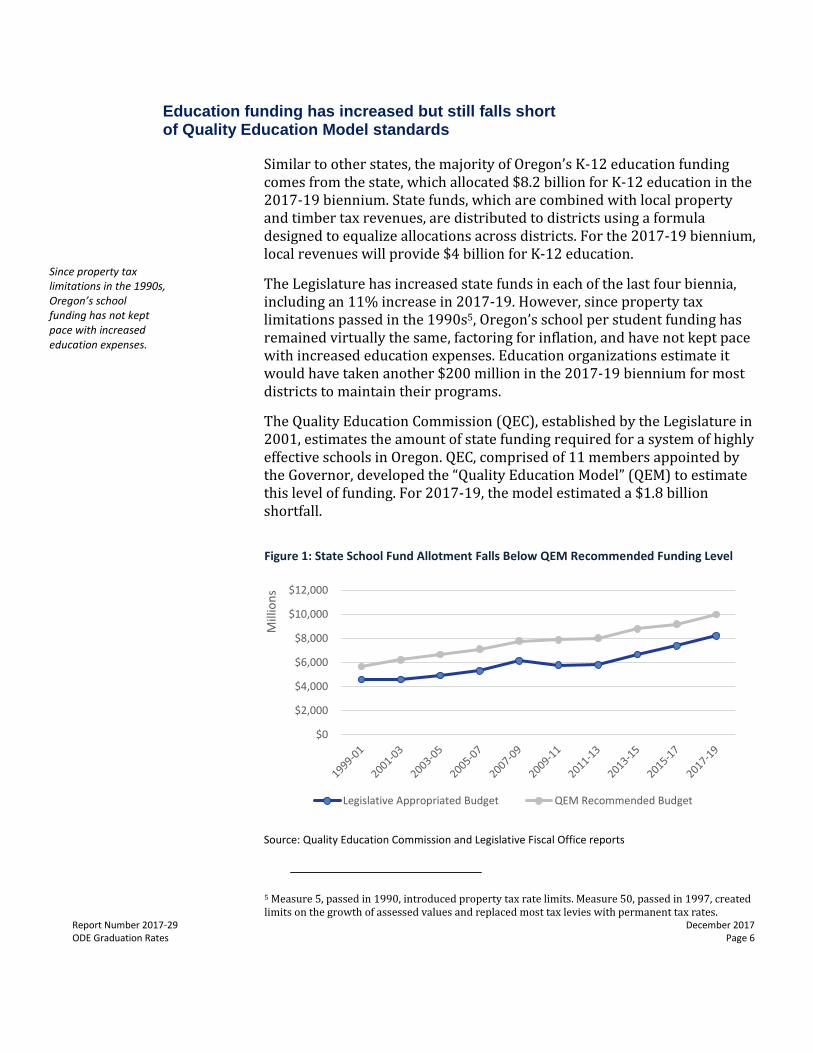
The Quality Education Commission (QEC), established by the Legislature in 2001, estimates the amount of state funding required for a system of highly effective schools in Oregon. QEC, comprised of 11 members appointed by the Governor, developed the “Quality Education Model” (QEM) to estimate this level of funding. For 2017-19, the model estimated a $1.8 billion shortfall.
Figure 1: State School Fund Allotment Falls Below QEM Recommended Funding Level
Source: Quality Education Commission and Legislative Fiscal Office reports
5 Measure 5, passed in 1990, introduced property tax rate limits. Measure 50, passed in 1997, created limits on the growth of assessed values and replaced most tax levies with permanent tax rates.
$0
$2,000
$4,000
$6,000
$8,000
$10,000
$12,000
Mill
ion
s
Legislative Appropriated Budget QEM Recommended Budget
Education funding has increased but still falls short of Quality Education Model standards
Since property tax limitations in the 1990s, Oregon’s school funding has not kept pace with increased education expenses.

Report Number 2017-29 December 2017 ODE Graduation Rates Page 7
Oregon moved from being the 15th highest funded state for education nationally to the 31st highest between 1990 and 2015, according to the 2016 QEM Report. Over that same period, the report notes that Oregon had the second lowest growth in spending per pupil in the nation.
Objective
The purpose of this audit was to determine how ODE and school districts could help increase student four-year graduation rates in Oregon public high schools.
Scope
The scope of this audit concentrated on schools with low and middle-range graduation rates that have not improved as much as the state as a whole between the 2011-12 and 2015-16 school years. These represent 40% of high schools in 2015-16. We did not focus on graduation rates at alternative education schools and programs as well as online schools, as our office conducted a separate audit that focused on students at-risk of not graduating in those schools. That audit will be released shortly.
Methodology
To address our objective, we conducted interviews with multiple stakeholders. Among them were representatives from the Oregon School Board Association, Confederation of Oregon School Administrators, Education Northwest, Chalkboard Project, Stand for Children, Unite Oregon, Salem Keizer Coalition for Equality, Oregon Parent Teacher Association, Chief Education Office, and Quality Education Commission. We also interviewed ODE management and staff in the following units: Research and Data Analysis; Accountability and Reporting; Student Services; Office of the Deputy Superintendent; Standards and Instructional Support; Data, Operations and Grant Management; Child Nutrition; Education Programs and Assessment; and District and School Effectiveness.
We also visited nine high schools with low or middle-range graduation rates whose rates improved by less than 5% between the 2011-12 and 2015-16 school years. As part of our school visits, we conducted interviews with school and district administrators, teachers, support staff, and students and toured school buildings. We spoke with the principal and two teachers at an additional school over the phone. We judgmentally selected these schools to obtain diversity in terms of size, geographic location, and student group populations.
We visited four more high schools that had middle or high graduation rates and had shown significant improvement between the 2011-12 and
Objective, Scope and Methodology
Report Number 2017-29 December 2017 ODE Graduation Rates Page 8
2015-16 school years. During these visits, we conducted interviews with school administrators and toured school buildings. We also spoke with administrators for two additional schools over the phone. We judgmentally selected these schools based on similar criteria as was used for the low and middle-range schools.
We reviewed state laws and administrative rules related to the agency and our audit objective. We also reviewed the agency’s performance measures, annual reports, planning documents and website materials relevant to our audit objective. We reviewed agency budget documentation prepared by the Legislative Fiscal Office.
We identified promising practices for evaluating student success and improving graduation rates through a review of available research conducted by ODE, the Quality Education Commission, and the Chief Education Office. We also reviewed documents found on the websites of other states’ education agencies to identify promising practices and data collection practices. We also reviewed research from other national education organizations, including the Education Commission of the States, the Everyone Graduates Center at the School of Education at Johns Hopkins University, Chalkboard Project, the Data Quality Campaign, the National Education Policy Center, Harvard Graduate School of Education, and the Consortium on Chicago School Research.
We analyzed national data from the U.S. Census Bureau and National Center for Education Statistics. We also analyzed Oregon district and school data provided by ODE and data collected by the audit team from ODE’s website. This included data on graduation rates, dropout rates, enrollment, and student demographics. We assessed the reliability of this data by evaluating previous assessments of reliability by other Oregon Audits Division auditors, reviewing existing information about the data and the system that produced them, and interviewing agency officials knowledgeable about the data. We determined that the data were sufficiently reliable for the purposes of this report.
We conducted this performance audit in accordance with generally accepted government auditing standards. Those standards require that we plan and perform the audit to obtain sufficient, appropriate evidence to provide a reasonable basis for our findings and conclusions based on our audit objective. We believe that the evidence obtained and reported provides a reasonable basis to achieve our audit objective.
Report Number 2017-29 December 2017 ODE Graduation Rates Page 9
5-Year Completion Rate: Follows the four-year graduation rate cohort for an additional year and includes students who received a diploma or an equivalent credential, such as a GED.
Audit Results: The Oregon Department of Education Should Take Further Steps to Help Districts and High Schools Increase Oregon’s Graduation Rate
Earning a high school diploma is a key life milestone. This achievement demonstrates commitment, responsibility, and aptitude. It expands livelihood and career opportunities, whether a graduate enters the workforce or continues with higher education. In contrast, research shows that not graduating leads to higher unemployment, lower incomes, poorer health, and higher incarceration rates. Society also faces financial impacts such as higher social service and incarceration costs, and lower tax revenues from non-graduates. This cost is estimated at $260,000 to $292,500 for each student without a high school diploma.6
Oregon’s high school graduation rates have increased gradually, on average about 1% a year for the past five years, to 75% in 2015-16. While this improvement is encouraging, the state still has a quarter of its students not able to graduate on time.
Improving high school graduation rates is a complex issue that requires strong partnerships between state agencies, local agencies, community organizations, school districts, schools, students, and parents.
ODE has taken actions to improve graduation rates, but it can further help schools and districts support students who transfer between districts, low-income students, and middle school students. ODE can also better help districts and schools use data to identify students in danger of not graduating, use effective improvement tools, and communicate the importance of graduation to parents and the community.
Oregon’s four-year graduation rate improved by roughly 5% over the last five years, to 75% in 2015-16.7 Over this same period, the five-year completion rate has shown less growth, meaning that overall, there has
6 Miller, L. and Connors, K (2015). Return on Investment in Education. Center on Reinventing Public Education. 7 Starting in 2013-14, in addition to students receiving regular diplomas, the rate includes students receiving modified diplomas and students who earned their diplomas but had not yet received them because they were returning for a 5th year to earn college credits. To create greater comparability, we have adjusted the data prior to 2013-14 to include modified diplomas, but we do not have data for 5th-year students prior to 2013-14 to make that adjustment.
Oregon’s graduation rate has improved but remains low
Hallway in an Oregon high school

Report Number 2017-29 December 2017 ODE Graduation Rates Page 10
been limited improvement in the number students getting a diploma or its equivalent.
Figure 2: Trend in Four-Year Graduation and Five-Year Completion Rates
Source: ODE cohort graduation rate data, obtained from ODE website. Graduation data prior to 2013-14 is adjusted to include modified diplomas.
In the last five years, graduation rates for all student groups have increased. Some have shown stronger growth relative to their peers, such as African American and Hispanic students. But other student groups, such as Current English Learners and American Indian students, have made less progress, as shown in Figure 3. ODE has recognized these gaps and, as mentioned earlier, has made educational equity and closing achievement gaps a priority. ODE has recently developed or is in the process of developing specific statewide education plans to address disparities and educational needs for student groups that have large achievement gaps compared to the statewide graduation average.
70% 70%72%
74% 75%
81% 82% 82% 82% 82%
50%
60%
70%
80%
90%
100%
2011-12 2012-13 2013-14 2014-15 2015-16
4-Year Graduation Rate 5-Year Completion Rate

Report Number 2017-29 December 2017 ODE Graduation Rates Page 11
Figure 3: Growth in On-Time Graduation Rates by Student Group
2011-12 2015-16 Change
All Students 70.0% 74.8% 4.8%
Male 66.2% 71.4% 5.2%
Female 74.0% 78.4% 4.4%
Am. Indian/Alaska Native 53.3% 56.4% 3.1%
Asian 81.7% 88.0% 6.3%
Native Hawaiian/Pacific Islander 67.2% 70.1% 2.8%
African American/Black 55.4% 66.1% 10.7%
Hispanic/Latino 61.3% 69.4% 8.2%
Multi-Racial 70.3% 74.4% 4.1%
White 72.7% 76.6% 3.9%
Economically Disadvantaged 63.3% 68.1% 4.8%
Not Economically Disadvantaged 77.1% 83.8% 6.7%
Current English Learner 51.9% 52.9% 1.0%
Not an English Learner 71.5% 75.8% 4.3%
Students w/Disabilities 49.3% 55.5% 6.2%
Students w/o Disabilities 73.2% 78.1% 4.9%
Source: ODE cohort graduation rate data, obtained from ODE website. Graduation data from 2011-12 is adjusted to include modified diplomas. The Ever English Learner student group was not tracked in 2011-12.
Students who attend traditional public high schools, which are the vast majority of students, graduate at higher rates than those who attend other school types including charter, alternative and online schools. Charter and online student enrollment and performance has increased over the last five years, but on-time graduation in these schools continues to trail traditional schools by more than 20%. Our office conducted a separate audit focused on improving graduation rates and other results in alternative education and online schools. That audit will be released shortly.
Oregon’s graduation rate has been consistently low when compared to other states. In the last five years, it has ranked in the bottom five.8 In 2015-16, the most recent year with comparable data, Oregon’s graduation rate ranked 48th. Several factors can reduce the comparability of graduation rates across states. For example, some have more rigorous graduation requirements. Oregon is among 13 states that require the highest minimum number of credits to graduate – 24. There are also variations in how states calculate graduation rates. For example, in contrast to Oregon, a few states establish their cohorts later in the school year, leaving out students who drop out early in their freshman year. However, even while acknowledging these variations, nationally recognized groups, such as the Data Quality Campaign and the Everyone
8 National Center for Education Statistics, Digest of Education Statistics, Public high school 4-year adjusted cohort graduation rate (ACGR), by selected student characteristics and state: 2010-11 through 2014-15.
Even within Oregon, there is variability in credit requirements. For example, McMinnville High School requires 27 credits and Sherwood High School requires 28. Both of these schools have consistently higher graduation rates than the state average.
Report Number 2017-29 December 2017 ODE Graduation Rates Page 12
Graduates Center, consider the graduation rates across states to be reasonably comparable and have used them to compare performance.
Helping more students to engage in school and earn diplomas involves multiple key partners. For ODE, we found it could strengthen support to districts and schools so they can improve graduation rates among the following groups of students:
High school students who change districts;
Students at schools with mid-range graduation rates; and
Low-income students.
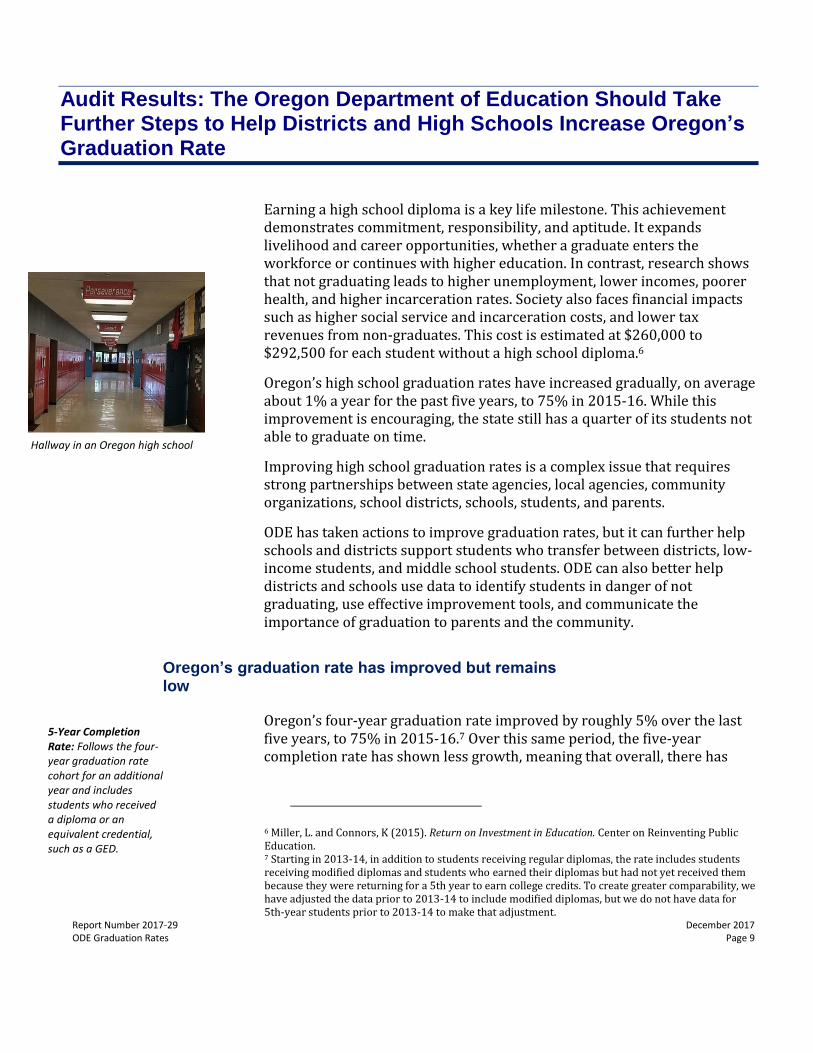
Students transferring between school districts graduate at much lower rates and could benefit from more support
During our school visits, staff often stated that students transferring into their schools often struggled to graduate on time. We requested ODE data and analyzed the effect students who changed districts during high school had on graduation.9 Using cohort data, we found that these students had sharply lower graduation rates overall. Specifically, in the adjusted graduating cohort of 2015-16, about 27% of students changed districts within the state at least once in their high school career. These students had an on-time graduation rate of 51%, well below the statewide graduation rate of 75% and more than 30% lower than their peers who stayed in the same district.
We also found these substantial differences persisted within every student group ODE tracks, as shown in Figure 4.
Figure 4: Gaps in On-Time Graduation Rates by Student Group in 2015-16
Graduation Rate Gap for
Students Changing Districts Student Groups
Greater than 30% American Indian/Alaska Native, Hispanic/Latino, White, Not Economically Disadvantaged, Not an English Learner, Ever English Learner, Students without Disabilities, Male
Between 26% and 30% African American/Black, Multi-Racial, Students with Disabilities, Economically Disadvantaged, Female
Between 19% to 25% Asian, Native Hawaiian/Pacific Islander, Current English Learner
Source: ODE cohort graduation rate data, obtained from ODE analyst
9 Students who changed districts include students who were enrolled in their resident school district after October 1 of their high school entry year. Students whose only enrollment was at a long-term care or treatment facility were excluded.
ODE can take further steps to help specific groups of students graduate
Students who changed districts at least once in their high school career had an on-time graduation rate of 51%.

Report Number 2017-29 December 2017 ODE Graduation Rates Page 13
Economically disadvantaged students, for example, were 29% less likely to graduate on time if they switched districts. Meanwhile, students who were not economically disadvantaged but still switched districts were 34% less likely to graduate. The similarity of results indicates that transferring districts has a negative effect on students beyond traditional risk factors, such as living in poverty.
The effect on the graduation rate is significant. While transfer students made up just over a quarter of the 2015-16 graduation cohort, they made up more than half of students who did not graduate on time, as shown in Figure 5. We found similar results for the prior two school years as well.
Figure 5: Students Who Changed Districts Make Up a Disproportionate Share of Students Who Do Not Graduate on Time
Source: ODE cohort graduation rate data, obtained from ODE analyst
Research has shown students who change schools, whether the result of a transfer between districts or within a district, typically have lower test scores and increased high school dropout rates. These moves disrupt student relationships with peers and teachers, and can alter their education program.
ODE does calculate and report student mobility rates at the school and district level for annual school and district report cards. But this measure only accounts for students who change schools or have enrollment gaps within the school year, as opposed to those who transfer during the summer. The agency also does not analyze or report the graduation performance of these students. Analyzing and reporting the performance of students who transfer and having a system in place for supporting them could help students such as these stay on track for graduation.
27%52%
73%48%
Students in 2015-16Graduation Cohort
Students who did not graduateon-time in 2015-16
Students who changed districts Students who did not change districts
Economically Disadvantaged: Students who are eligible for the free/reduced price meal program.
Report Number 2017-29 December 2017 ODE Graduation Rates Page 14
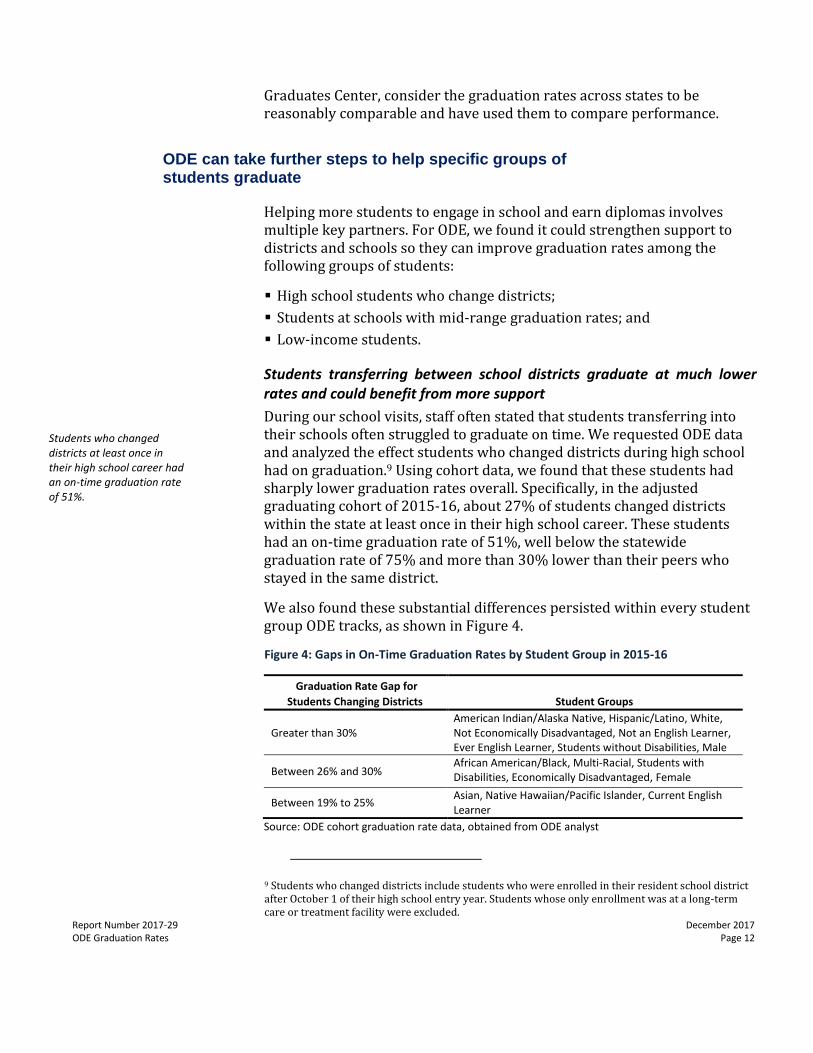
Schools with mid-range performance account for many non-graduates, but receive limited ODE improvement assistance
High schools with mid-range graduation rates, between 67% and 85%,10 educate the largest number of high school students and have a large portion of non-graduates and dropouts, see Figure 6. However, these schools are not the focus of ODE’s improvement support efforts, rather, schools with the lowest graduation rates receive the majority of ODE improvement assistance. To increase the state’s overall graduation rate substantially, further support to mid-range schools – not just to schools with low graduation rates – is needed.
Figure 6: 2015-16 Share of Non-Graduates and Dropouts by School Graduation Rate
School Classification Number
of Schools Number of Students
Non-Graduates
Dropouts
High Grad Rate (>=85%) 120 74,800 1,900 900
Mid-Grad Rate (between 67% and 85%) 123 86,000 4,900 2,500
Low Grad Rate (<=67%) 82 17,000 3,600 2,100
Total 325 177,900 10,400 5,500
Source: Cohort graduation rate data, obtained from ODE website. Figures exclude students not enrolled in a high school, such as those in a district program. Totals may not equal due to rounding. Non-graduates and dropouts are not mutually exclusive categories; some dropouts are included in the count of non-graduates.
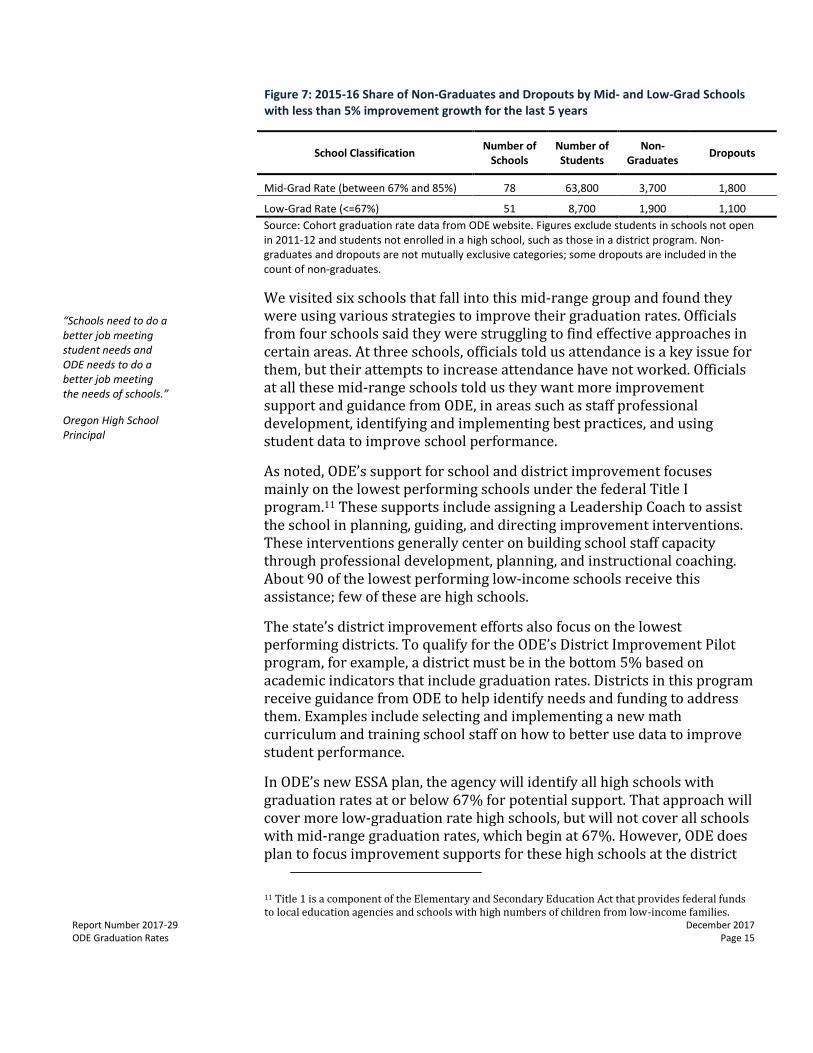
We compared the graduation rate improvement at low- and mid-range graduation rate schools to the state as a whole, which, as noted, was 5% over the past five years. As shown in Figure 7, mid-range schools make up the majority of schools showing lower improvement in graduation rates than the state. These schools also had more non-graduates and dropouts than low-range schools with similarly low growth.
10In its 2016 report Building a Grad Nation: Progress and Challenges in Raising High School Graduation Rates, The Everybody Graduates Center at John’s Hopkins University defines “high” graduation rates schools as those with rates of 85% or above and “low” graduation rates schools as those with rates of 67% or below.
Report Number 2017-29 December 2017 ODE Graduation Rates Page 15
Figure 7: 2015-16 Share of Non-Graduates and Dropouts by Mid- and Low-Grad Schools with less than 5% improvement growth for the last 5 years
School Classification Number of
Schools Number of Students
Non- Graduates
Dropouts
Mid-Grad Rate (between 67% and 85%) 78 63,800 3,700 1,800
Low-Grad Rate (<=67%) 51 8,700 1,900 1,100
Source: Cohort graduation rate data from ODE website. Figures exclude students in schools not open in 2011-12 and students not enrolled in a high school, such as those in a district program. Non-graduates and dropouts are not mutually exclusive categories; some dropouts are included in the count of non-graduates.
We visited six schools that fall into this mid-range group and found they were using various strategies to improve their graduation rates. Officials from four schools said they were struggling to find effective approaches in certain areas. At three schools, officials told us attendance is a key issue for them, but their attempts to increase attendance have not worked. Officials at all these mid-range schools told us they want more improvement support and guidance from ODE, in areas such as staff professional development, identifying and implementing best practices, and using student data to improve school performance.
As noted, ODE’s support for school and district improvement focuses mainly on the lowest performing schools under the federal Title I program.11 These supports include assigning a Leadership Coach to assist the school in planning, guiding, and directing improvement interventions. These interventions generally center on building school staff capacity through professional development, planning, and instructional coaching. About 90 of the lowest performing low-income schools receive this assistance; few of these are high schools.
The state’s district improvement efforts also focus on the lowest performing districts. To qualify for the ODE’s District Improvement Pilot program, for example, a district must be in the bottom 5% based on academic indicators that include graduation rates. Districts in this program receive guidance from ODE to help identify needs and funding to address them. Examples include selecting and implementing a new math curriculum and training school staff on how to better use data to improve student performance.
In ODE’s new ESSA plan, the agency will identify all high schools with graduation rates at or below 67% for potential support. That approach will cover more low-graduation rate high schools, but will not cover all schools with mid-range graduation rates, which begin at 67%. However, ODE does plan to focus improvement supports for these high schools at the district
11 Title 1 is a component of the Elementary and Secondary Education Act that provides federal funds to local education agencies and schools with high numbers of children from low-income families.
“Schools need to do a better job meeting student needs and ODE needs to do a better job meeting the needs of schools.”
Oregon High School Principal

Report Number 2017-29 December 2017 ODE Graduation Rates Page 16
level. Under ODE’s plan, these supports will include leadership coaching, technical assistance, and system development. ODE staff anticipate this leading to district wide systematic improvements affecting all schools in a supported district.
ODE’s ESSA plan also outlines a System of Performance Management to help guide improvement efforts for all districts. This process will begin with a comprehensive needs assessment that districts will use to identify priorities and guide the development of district improvement plans. ODE plans to use a risk-based approach for monitoring these plans, with higher risk districts receiving more collaborative support and more frequent monitoring.
Besides direct school and district support, ODE has published information on research-based practices proven to increase student success and graduation rates. The agency has posted these best practices on its website, in its recently released graduation improvement blueprint, and within agency research briefs.
This information is helpful, but it may not provide the type of support many schools and districts need. ODE staff told us districts and schools often need help with establishing effective school and district-level processes to guide improvement efforts. For example, many schools and districts do not have effective processes to analyze student data, as discussed later in this report.
Performance continues to lag for low-income students, despite some additional state support
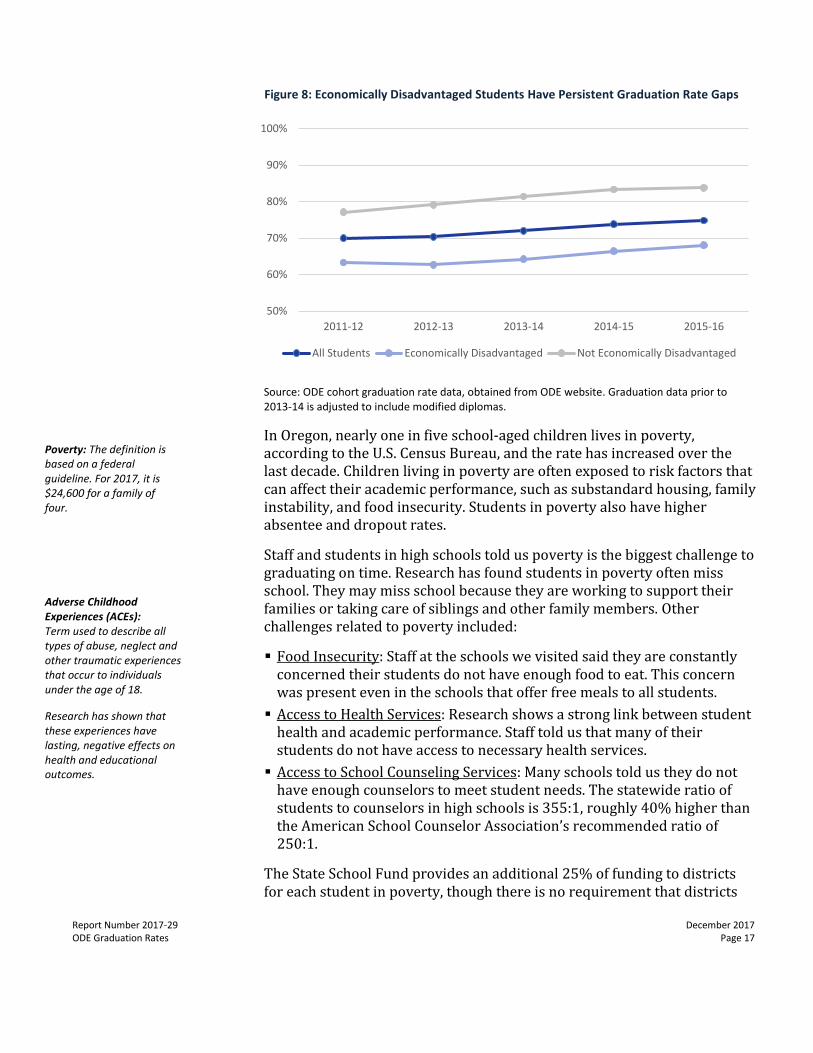
Economically disadvantaged students graduate at substantially lower graduation rates than their non-economically disadvantaged peers, see Figure 8.
More than half of Oregon’s students are classified as economically disadvantaged. They make up more than 70% of the students who do not graduate on time.
Report Number 2017-29 December 2017 ODE Graduation Rates Page 17
Figure 8: Economically Disadvantaged Students Have Persistent Graduation Rate Gaps
Source: ODE cohort graduation rate data, obtained from ODE website. Graduation data prior to 2013-14 is adjusted to include modified diplomas.
In Oregon, nearly one in five school-aged children lives in poverty, according to the U.S. Census Bureau, and the rate has increased over the last decade. Children living in poverty are often exposed to risk factors that can affect their academic performance, such as substandard housing, family instability, and food insecurity. Students in poverty also have higher absentee and dropout rates.
Staff and students in high schools told us poverty is the biggest challenge to graduating on time. Research has found students in poverty often miss school. They may miss school because they are working to support their families or taking care of siblings and other family members. Other challenges related to poverty included:
Food Insecurity: Staff at the schools we visited said they are constantly concerned their students do not have enough food to eat. This concern was present even in the schools that offer free meals to all students.
Access to Health Services: Research shows a strong link between student health and academic performance. Staff told us that many of their students do not have access to necessary health services.
Access to School Counseling Services: Many schools told us they do not have enough counselors to meet student needs. The statewide ratio of students to counselors in high schools is 355:1, roughly 40% higher than the American School Counselor Association’s recommended ratio of 250:1.
The State School Fund provides an additional 25% of funding to districts for each student in poverty, though there is no requirement that districts
50%
60%
70%
80%
90%
100%
2011-12 2012-13 2013-14 2014-15 2015-16
All Students Economically Disadvantaged Not Economically Disadvantaged
Poverty: The definition is based on a federal guideline. For 2017, it is $24,600 for a family of four.
Adverse Childhood Experiences (ACEs): Term used to describe all types of abuse, neglect and other traumatic experiences that occur to individuals under the age of 18.
Research has shown that these experiences have lasting, negative effects on health and educational outcomes.

Report Number 2017-29 December 2017 ODE Graduation Rates Page 18
spend the money on services for those students12. The Legislature also supplements the federal School Nutrition Program, providing free meals to students who qualify for only reduced-price lunches under federal rules.
The Legislature has also required several studies of practices to better support students in poverty. The most recent study, released in 2017, examined the relationship between district budgeting practices and the allocation of State School Fund poverty funding.13 The report, which was based on a survey of 120 districts, estimated that roughly two-thirds of this funding is spent on poverty-related programs.
Children in poverty often have adverse childhood experiences that can hinder their learning. Trauma-informed professional development can help school staff better understand the effect of these experiences and better support students. In 2016 and 2017, the Legislature provided funding for ODE, the Oregon Health Authority (OHA), and the Chief Education Office to run a pilot training program in two high schools to learn how best to support students affected by childhood trauma.
About one-third of the schools we visited had School Based Health Centers. These centers operate as public-private partnerships between OHA, school districts, local health authorities, and health care providers. They provide services such as dental and health screenings, mental health counseling, and alcohol and drug counseling -- some of the same services officials at the other schools we visited said their students were not receiving.
Even with these efforts to support economically disadvantaged students, the gap in their graduation performance persists. ODE has developed plans to support other historically underserved students groups, including African American students and English Learners. To meet graduation rate goals, ODE should undertake efforts to better support economically disadvantaged students as well.
High school graduation efforts have focused on indicators at the elementary and high school levels, with little attention at the middle school level or to student transitions from middle school. Meanwhile, studies have
12 Districts are not required to identify how revenue from the poverty weight is budgeted or expended. 13 “Practices to Improve the Achievement of Students in Poverty,” Oregon Chief Education Office, February 2017.
ODE has not emphasized middle school performance or student transitions from middle school to high school
School Based Health Centers
-Provide onsite health care services for students and the community.
-There are 77 SBHCs across Oregon in 24 counties.
-The majority of students using SBHCs are covered under Medicaid.
Report Number 2017-29 December 2017 ODE Graduation Rates Page 19
found that students who struggle in middle school are already at risk of not graduating.
Research highlights the importance of middle school performance
While 9th grade is a critical time for students and important to track, substantial academic research emphasizes the potential benefits of reaching struggling students in middle school.14 For example, research has found that students who are not doing well begin to give up on education well before setting foot in a high school classroom. Research has found a strong correlation between students’ middle-grade experience and their academic success in high school.
The Consortium on Chicago School Research found that students with a very high risk of high school failure were chronically absent in middle grades or already receiving failing grades in their middle-grade courses. Further, research on on-track indicators by the Everyone Graduates Center at the John Hopkins University’s School of Education found:
In high-poverty environments, a student’s middle-grades experience strongly affects the odds of graduating from high school.
At least in high-poverty environments, it is possible to identify up to half, and sometimes even more, of eventual high school dropouts during the middle grades.
The earlier middle-grade students moved off track, the less likely they were to graduate. For example, sixth graders who failed math or English, attended school less than 80% of the time, or received an unsatisfactory behavior grade in a core course had, at best, a 20% chance of graduating on time.
In reviewing middle school attendance patterns in Oregon, chronic absenteeism begins to increase in middle school and rises through high school. Throughout elementary, middle, and high schools, disciplinary incidents, another indicator of on-time graduation15, are the highest in 7th
14 Allensworth, E., Gwynne, J., Moore, P., and de la Torre, M. (2014). Looking Forward to High School and College: Middle Grade Indicators of Readiness in Chicago Public Schools. Chicago, IL: University of Chicago Consortium on Chicago School Research. Balfanz, R. (2009). Putting Middle Grades Students on the Graduation Path. Center for Social Organization of Schools at Johns Hopkins University, Everyone Graduates Center and Talent Development Middle Grades Program. Balfanz, R. Solving the High School Graduation Crisis: Identifying and Using School Feeder Patterns in your Community. Everyone Graduates Center at Johns Hopkins University and United Way Worldwide. 15 Balfanz, Rovers; Byrnes, Vaughan; and Fox, Joanna (2014). Sent Home and Put Off-Track: The Antecedents, Disproportionalities, and Consequences of Being Suspended in the Ninth Grade. Journal of Applied Research on Children: Informing Policy for Children at Risk: Vol. 5: Iss. 2, Article 13. Frazelle, S. & Nagel, A. (2015). A practitioner’s guide to implementing early warning systems (REL 2015-056). Washington, DC: U.S. Department of Education, Institute of Education Sciences, National Center for Education Evaluation and Regional Assistance, Regional Educational Laboratory Northwest. Retrieved from hrrp://ies.ed.gov/ncee/edlabs.

Report Number 2017-29 December 2017 ODE Graduation Rates Page 20
and 8th grades. A small number of students are also starting to drop out in middle school.
ODE’s strategy for improving graduation rates has not emphasized middle grade performance. ODE’s key performance measures, set by the Legislature, are on early learning, elementary, and high school measures. Likewise, legislatively funded initiatives have prioritized grade-level efforts on early learning, elementary, and high school grades. Those initiatives include Preschool Promise, a program to enhance access to high quality preschool for low-income children, full-day kindergarten, and career-technical education grants designed to support mainly high school students.
ODE can provide more strategies to improve coordination between middle schools and high schools
In our visits with high schools, we found few schools had strong coordination with middle schools to better prepare incoming freshmen for high school coursework.
Eight of the ten high schools we visited with lower graduation rate improvement said they had little or inconsistent curriculum coordination with their area middle schools, though many school staff told us students are coming into high school unprepared for the expectations and content. High school staff told us they wanted more coordination with middle schools, but they said they had limited time or support for collaborative professional development and planning with middle school teachers.
Research has shown curriculum alignment between middle and high schools can improve student achievement. Such alignment fosters a shared understanding among teachers at both levels of what will be taught, how it will be taught, and how it will be assessed. Better alignment can benefit all students, research indicates, and particularly underserved student populations.16 One of the high graduation rate high schools we visited said the district had worked hard to align curriculum from elementary through high school, with a focus on students’ needs and growth. The principal said the alignment was a key reason student performance improved in recent years.
Torres, D. Diego; Bancroft, Amanda; and Stroub, Kori (2015). Evaluating High School Dropout Indicators and Assessing Their Strength. Houston Education Research Consortium, Rice University’s Kinder Institute for Urban Research. 16 Parrish, T.; Poland, L.; Arellanes, M.; Ernandes, J.; and Viloria, J. (2011). Making the Move: Transition Strategies at California Schools with High Graduation Rates. California Comprehensive Center at WestEd. Scholosser, L. (2015). Transition by Design: The Power of Vertical Teams. St. John Fisher College. Southern Regional Education Board (2012). Improved Middle Grades Schools for Improved High School Readiness: Ten Best Practices in the Middle Grades.

Report Number 2017-29 December 2017 ODE Graduation Rates Page 21
The State Board of Education sets educational content standards for districts, yet it is up to districts to choose their curriculum to meet those standards and the amount of effort they put into alignment between schools. ODE has encouraged and supported curriculum alignment in some of its district improvement efforts, but has not made a statewide push to facilitate alignment.
ODE collects large amounts of data from districts and high schools, primarily to meet state and federal data reporting requirements, but some key information on student course performance that could help identify challenges to graduation is missing. While schools typically have more data on their students than ODE does, some schools struggle with using it to identify students at risk of not graduating.
ODE does not collect detailed data on individual student course performance, limiting its ability to analyze barriers to graduation
ODE collects a wide variety of individual student data from schools and districts related to graduation rates, such as discipline incidents, attendance, class sizes, assessment scores, and whether freshmen are on-track to graduate. However, it does not collect two critical predictors of graduation success: individual student grades and student credit attainment.
This lack of student-level course performance data limits ODE’s ability to analyze barriers to graduation. Researchers have found student course performance is one of the strongest indicators of the likelihood of graduating. Class performance data would help ODE analyze when students are most likely to fall off track, which courses have high failure rates, and how student success or failure in specific courses ties to graduation.
For example, during most of our school visits, staff identified math as a challenge for their students. Several identified freshman as having challenges with math, particularly with Algebra 1, the lowest math class that meets graduation requirements. Some of these schools noted a high percentage of freshman students fail that class, with one reporting upwards of 30%. But ODE has no ability to assess how many students are failing Algebra 1, how that ultimately affects their graduation prospects, and whether Algebra 1 failure plays a larger role than other potential barriers to graduation. Making that kind of diagnosis could greatly help ODE identify statewide issues and tailor its improvement efforts to address them.
Tracking individual student performance and helping districts analyze data could help more students graduate
Freshman-on-track: Measures the percent of students who earned 6 credits or more (25% or more of the credits needed to graduate) by the end of their freshman year. ODE collects information on this measure as a yes or no for each student. It does not identify whether students earned credits in required subjects, such as math or language arts.
Report Number 2017-29 December 2017 ODE Graduation Rates Page 22
A number of states already collect course performance data, including Vermont, Indiana, and Florida. Vermont and Florida gather both credit attainment and course grades. In Indiana, the course grade is an optional field. These states also track whether courses are eligible for college credit, another element missing in ODE’s collections.
ODE, through the Deputy Superintendent of Public Instruction, has the authority to request additional data from districts. ODE staff told us they hesitate to add additional data requirements because of the costs they may impose on schools and districts. However, ODE already collects data on the classes students take by subject and teacher for every student in the state. Collecting student-course performance data would allow ODE to perform more powerful and helpful analysis.
ODE could help schools better analyze which students are in danger of not graduating
As noted, schools and districts have a significant amount of student data, including critical predictors of graduation such as attendance, course performance, and behavior incidents. But many lack processes or expertise to use this information to improve student performance.
Staff at many of the schools and districts we visited identified substantial challenges in using data effectively. These challenges included inadequate student data systems, as well as school and district staff lacking expertise in data analysis. Several of the schools and districts we spoke to said they could use additional help from ODE to better use the student data that they already collect.
We also saw effective data use practices, especially in the higher graduation rate schools that we visited. In one school, an assistant principal created a series of spreadsheets using Google Documents that allowed all administrators, counselors, and teachers to see regularly updated student course performance and attendance information. Another school identified a set of key metrics and used student performance on those metrics to guide weekly teacher professional development. ODE could incorporate practices such as these into best practices shared with all schools and districts.
ODE provides data-related support to schools and districts, but that support focuses on collecting and verifying accountability information, such as graduation and dropout rates.
Funding from Measure 98, which voters approved in 2016, focuses on improving graduation rates. One requirement is that schools establish a regular time for teachers and staff to collaboratively review their 9th grade student data and develop strategies based on this review. ODE plans to provide guidance to schools on how to conduct these reviews. This review
Report Number 2017-29 December 2017 ODE Graduation Rates Page 23
should help schools keep 9th graders on track for graduation but will not address data analysis needs at other grade levels or for the school as a whole.
Personalized learning and support by school staff contribute to students’ academic success and promote high graduation rates. This can come from tying coursework to student career goals and valuing student feedback. We found three tools – personal learning plans, student surveys, and district continuous improvement plans – that could be used more effectively statewide to engage students and help schools improve.
Personal learning plans could be better used to increase student engagement
All students are required to have a student education plan and profile to guide their learning based on their interests. These plans require students to:
Describe personal, academic, and career interests;
Describe personal, educational, and career goals (both short-term and long-term);
Identify “next steps” after high school completion for successful transition to college or university, a career school, an apprenticeship, the workforce, or the military;
Plan courses and learning experiences that support the student’s interests and goals;
Document personal progress and achievement;
Record personal awards, accomplishments, experiences, and skills; and
Reflect on the current status of personal, education, and career goals.
Besides creating career and college-going pathways, these plans help students stay on track and stay engaged in learning.
During our school visits, however, we heard of wide variations in when and how students were completing the plans. Students at two schools said they primarily worked on them in 12th grade, though Oregon requires that students start plans in 7th grade and continue working on them through 12th grade. Students at five schools said the plan was required but generally ignored. The schools provided little follow-up or guidance, these students said, so they found little value in using this tool.
Schools are required to provide guidance to students on developing their student education plan and profile. Currently, ODE relies on district
ODE can help schools and districts more effectively use improvement tools
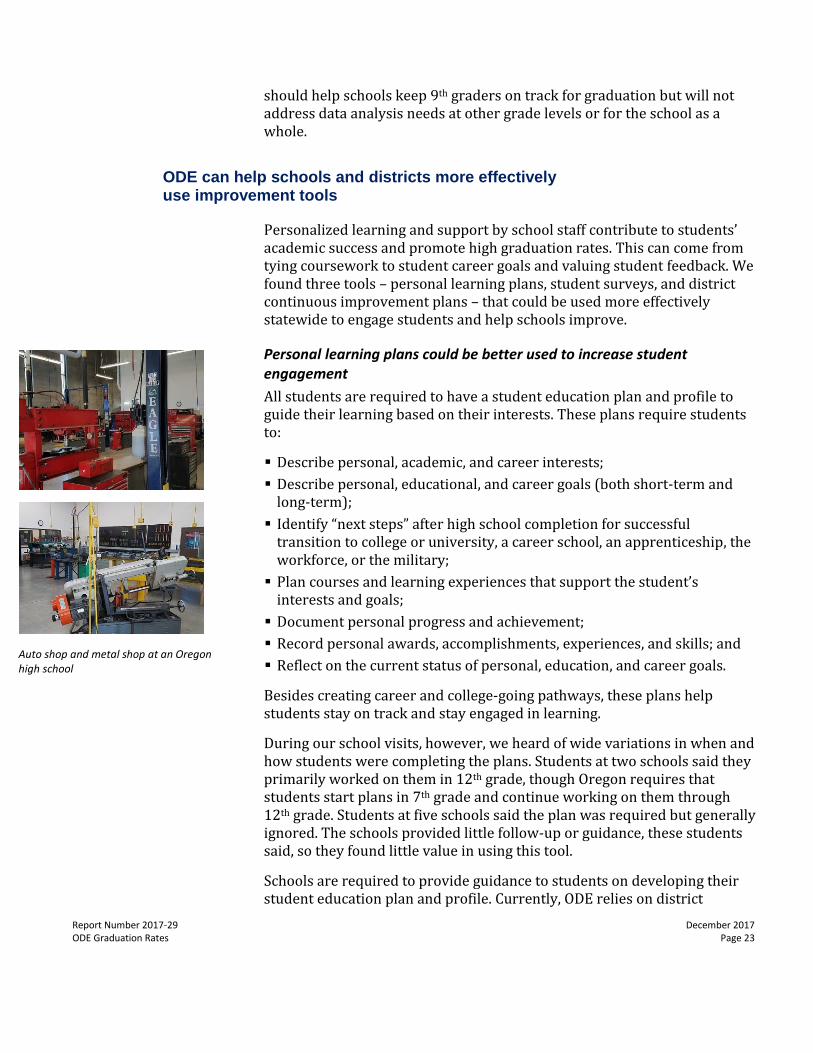
Auto shop and metal shop at an Oregon high school
Report Number 2017-29 December 2017 ODE Graduation Rates Page 24
superintendents to affirm that their schools are using plans and profiles. However, ODE is not reviewing how effectively schools are using them.
ODE expects schools to have a guidance and counseling program to assist students with their personal learning plan. However, not all schools meet this requirement, and some students mentioned that it was challenging to get time with a counselor. Recently, ODE adopted national school counseling standards and required districts to evaluate the extent of guidance and counseling programs schools provide. ODE is working on updating its comprehensive guidance and counseling framework and developing state support for the related standards.
Some state education agencies have gone further than ODE by providing more guidance for schools on how to implement personal learning plans. For example, Nebraska provides a lesson plan for teachers to help students develop personal learning plans and a booklet with step-by-step guidelines for students, schools, and parents. Some states, including Iowa, have set grade-level guidance for what they expect students to include in their career and educational plans.
Student surveys can help gauge student needs and guide school improvement efforts
Strong connections between students and school has shown to increase graduation rates. Few officials at the schools we visited with lower graduation growth said they regularly solicited feedback from all their students. Students told us they were not able to provide much input on classes, school services, and activities. Some students expressed frustration about class schedules and not getting into the elective classes that interested them. For example, some said they wanted a wider variety of foreign language classes, or courses their school does not offer, such as auto shop and culinary arts.
Half of the high schools we visited with higher graduation rates regularly collected and acted on student feedback. Methods ranged from conducting surveys of all students to establishing multiple student advisory groups with a diverse set of students. One school based its student survey on the Gallup Student Poll, with added measures to gauge students’ thoughts on fairness, safety and their own “soft skills,” including relationship skills. This school directly incorporates the results of the survey into their teachers’ professional development.
ODE offers technical assistance to schools, but it does not have a suggested model or survey tool that schools can use to gauge school climate and student engagement.
“Some people think that it’s really hard to measure the intangibles, but we forget that we can just ask the students…Eliciting student voice is not something that we do enough of in schools and that could get to their internal drives.”
Oregon High School Assistant Principal
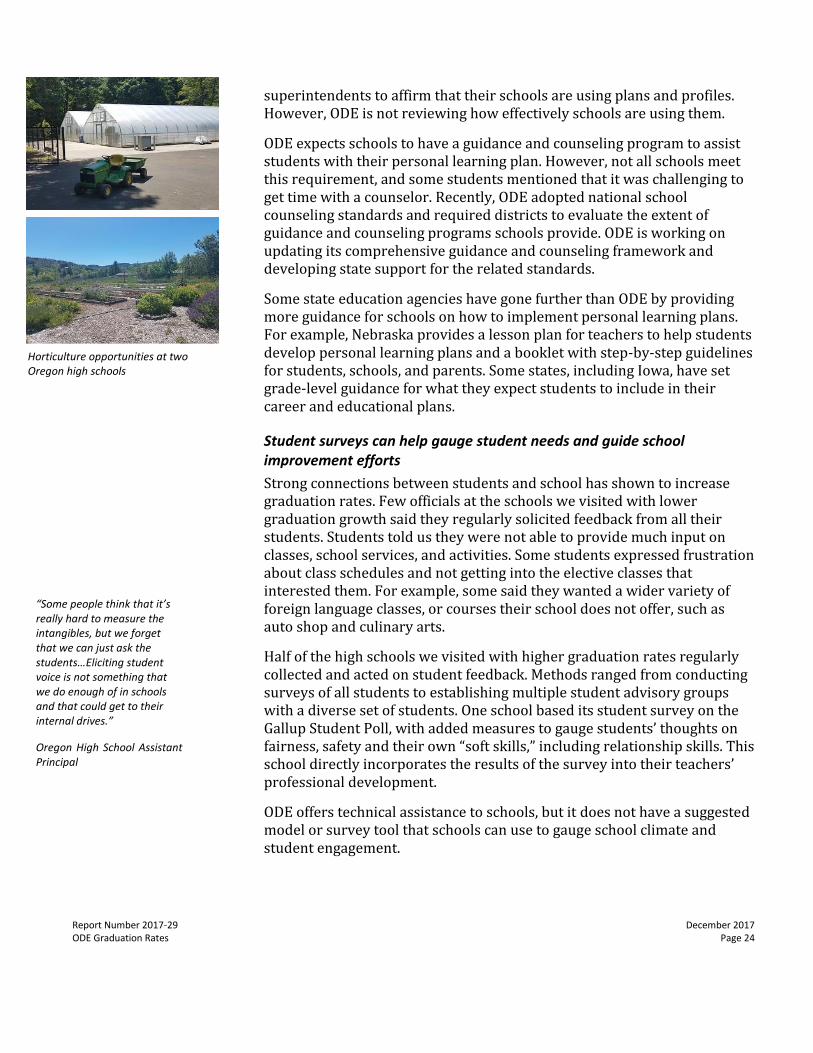
Horticulture opportunities at two Oregon high schools
Report Number 2017-29 December 2017 ODE Graduation Rates Page 25
District Continuous Improvement Plans could be a valuable tool to help guide district improvement efforts
ODE requires Continuous Improvement Plans (CIPs) for all districts. CIPs are a tool used to develop and monitor efforts for improving student outcomes. There are 37 indicators included in this tool for district-level planning. They fall within the areas of district and school structure and culture, family and community involvement, technical and adaptive leadership, educator effectiveness, and teaching and learning. However, ODE and districts have not fully used CIPs to enhance their collaboration on improvement efforts in areas such as graduation, and to reduce redundancy among the multiple improvement plans districts and schools must complete.
ODE has recognized shortcomings with CIPs and district officials indicated they do not find much value in using them, given the effort involved. District officials reported getting minimal feedback from ODE, and said they use other strategic planning documents to meet their needs.
ODE recently suspended the use of CIPs for the next two school years while planning to improve them. Going forward, ODE plans to adjust the CIP to be more flexible and design it so it can be used to reduce duplicative improvement plans districts and schools prepare to meet other state and federal requirements. The goal is to have district needs guide the CIP process and for it to add value to other improvement work schools and districts are doing.
If ODE creates a better process for CIPs and gives districts useful feedback on their plans, the agency could build better partnerships with districts on improvement efforts.
We found ODE’s units could enhance collaboration internally to better support district and school improvement efforts. ODE, districts, and schools can also work together to better communicate the importance of graduation to students, parents and the community.
ODE can improve internal communication and coordination between its operating units
Many ODE units are involved in efforts to increase graduation rates, including the District and School Effectiveness, Standards and Instructional Support, and Data Operations and Grant Management units. While the agency has increased its focus on internal coordination, our interviews with ODE staff indicate that the agency still administers many programs in isolation.
ODE can improve internal collaboration and help schools and districts communicate the importance of graduation

Report Number 2017-29 December 2017 ODE Graduation Rates Page 26
For any given school district, ODE does not have an effective method for staff to identify which agency initiatives a district is participating in, ODE staff told us. A central database of initiatives would be beneficial, they said, but the agency does not have one.
Without effective sharing and coordination, it is difficult for agency staff to know who else in the agency is working with a particular school or district or if there are already active initiatives in place to address a particular problem. For example, staff from one unit told us that they have worked with the same schools or districts as other units within ODE, but did not know it until the school or district asked them about it.
ODE staff said some of the coordination problems relate to federal and state funding streams that focus only on specific programs or efforts. Recently, ODE staff created an agency cross-office coherence team to collaborate on projects. The agency is also developing a new strategic plan that will provide more opportunities for cross-office collaboration. ODE’s recently approved ESSA plan identifies these efforts as critical for streamlining agency initiatives and leveraging expertise across the agency.
ODE can better help districts and schools engage families and communicate the importance of graduation
We heard overwhelmingly from high schools and districts that engaging parents, and at times the greater community, was a significant challenge for them. They also viewed communicating the importance of graduation to parents and communities as critical for getting students to graduate.
Poverty, family instability, and negative prior experiences with education are some reasons behind low parental participation, district, and school staff told us. We were also told that some students were not aware of the opportunities a diploma provides. They could see getting a job without one, and saw little value in putting in the effort to graduate.
Officials at three rural high schools said their location gave them little opportunity to sustain partnerships with the community. That lack of connection makes it difficult to get volunteers for school activities and social service needs, and to raise the local match dollars required to apply for grants. This limits the options that these schools have to keep students engaged and be competitive for additional programs through grants.
High schools offer events to involve parents, such as a parents’ night and conferences, though school officials said participation is often low and parents of high-performing students are more likely to attend. Schools we visited are trying to engage more parents and community members by providing school information in multiple languages, having teachers regularly contact parents, fostering connections with diverse parent groups, and increasing real-time parental access to student grades. One
Report Number 2017-29 December 2017 ODE Graduation Rates Page 27
school we visited had students bring a parent or other adult for a student-led conference and saw a dramatic increase in participation from prior years, to almost 98%.
Oregon could benefit from approaches taken in other states. For example, Iowa’s education department shared the methods a high school has developed to ensure staff are effectively communicating with parents. The school uses many modes of communication, including parent surveys, regular and varied use of social media, annual get-togethers, and class descriptions for parents for each class that underscore how parents can help. The school also stresses working together to best support children in their education. These efforts have helped the high school increase attendance and graduation rates, Iowa officials said. Iowa also provides toolkits to assist schools with implementing family engagement strategies. Indiana’s education department has a Family and Community Engagement initiative that encourages the family and community to actively engage in a child’s day-to-day schoolwork and development activities. In addition to recognizing schools as “Family Friendly,” the department shares a statewide framework and best practices for family and community engagement.
ODE staff told us they consistently hear in agency-organized forums that communities place a high value on education. In our visits, we heard this value is not consistent in all communities. ODE support to help high schools and districts identify effective communication strategies could boost the value placed on graduation across the state.
Report Number 2017-29 December 2017 ODE Graduation Rates Page 28
Recommendations: ODE Should Take Further Steps to Help Districts and High Schools Increase Oregon’s Graduation Rate
To help improve high school graduation rates, we recommend ODE:
1. Research and recommend effective approaches to districts and schools on ways to better serve students who change districts and schools.
2. Analyze and report performance for students who transfer between school districts and between schools during high school, and share this information with districts and schools.
3. Include schools with mid-range graduation rates while engaging in efforts to improve school performance as identified in ODE’s approved ESSA plan.
4. Identify strategies to better support economically disadvantaged students, such as reducing food insecurity, increasing access to medical services and increasing access to school counselors.
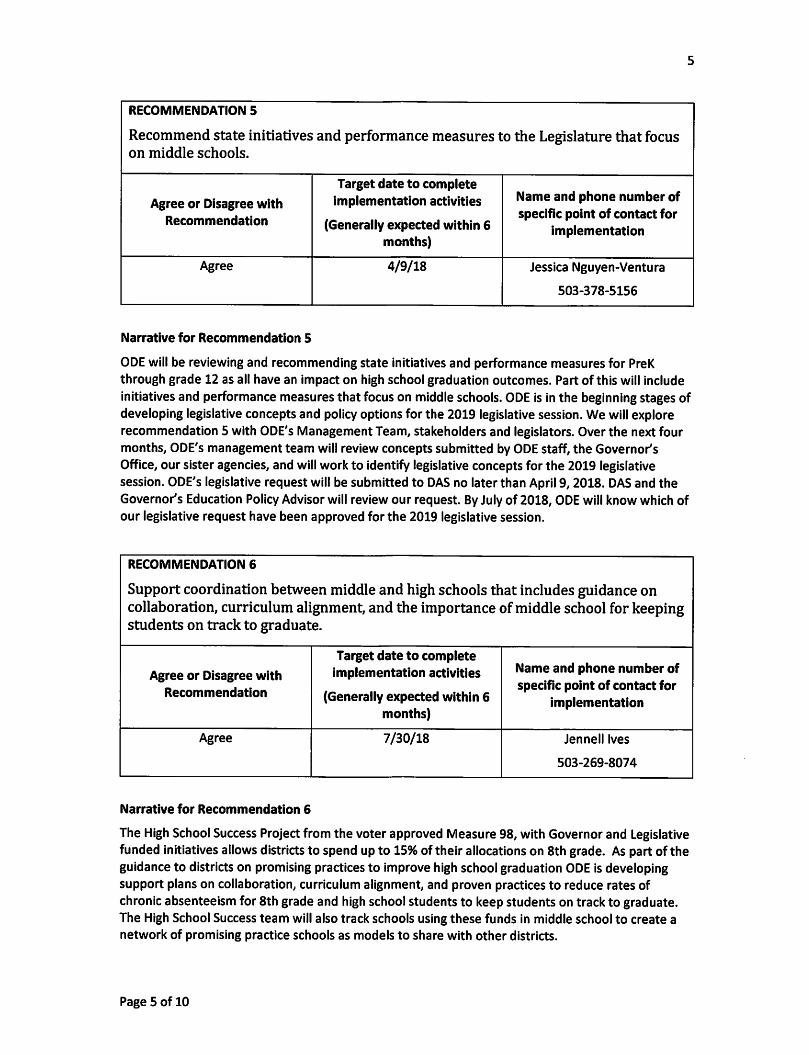
5. Recommend state initiatives and performance measures to the Legislature that focus on middle schools.
6. Support coordination between middle and high schools that includes guidance on collaboration, curriculum alignment, and the importance of middle school for keeping students on track to graduate.
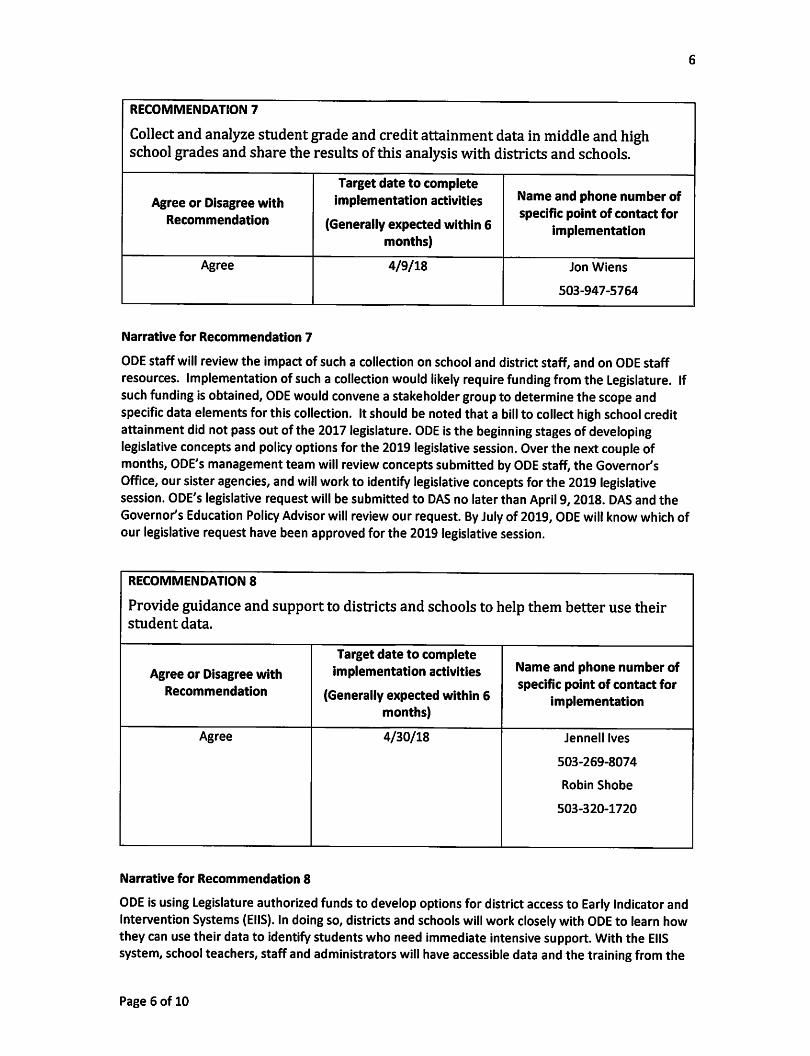
7. Collect and analyze student grade and credit attainment data in middle and high school grades and share the results of this analysis with districts and schools.
8. Provide guidance and support to districts and schools to help them better use their student data.
9. Evaluate how schools are using the required student education plan and profile, and provide guidance on how schools can use them effectively to improve graduation, including expectations at each grade level.
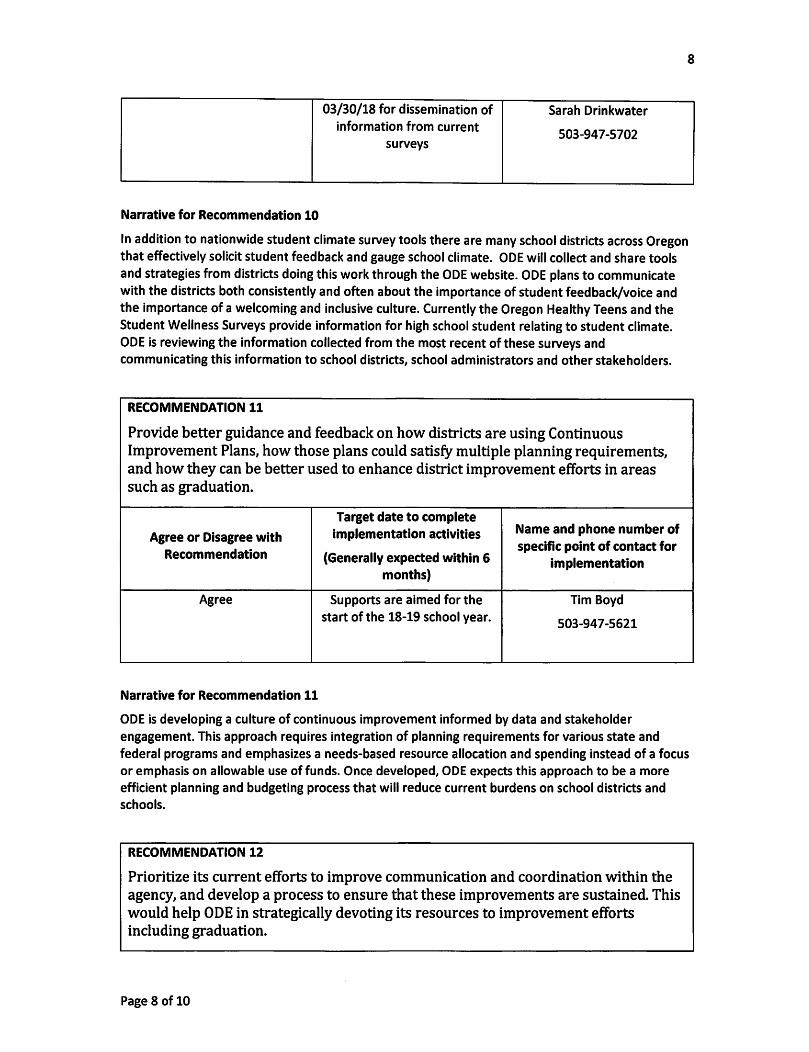
10. Provide guidance to districts and schools on how to effectively solicit student feedback and gauge school climate.
11. Provide better guidance and feedback on how districts are using Continuous Improvement Plans, how those plans could satisfy multiple planning requirements, and how they can be better used to enhance district improvement efforts in areas such as graduation.

Report Number 2017-29 December 2017 ODE Graduation Rates Page 29
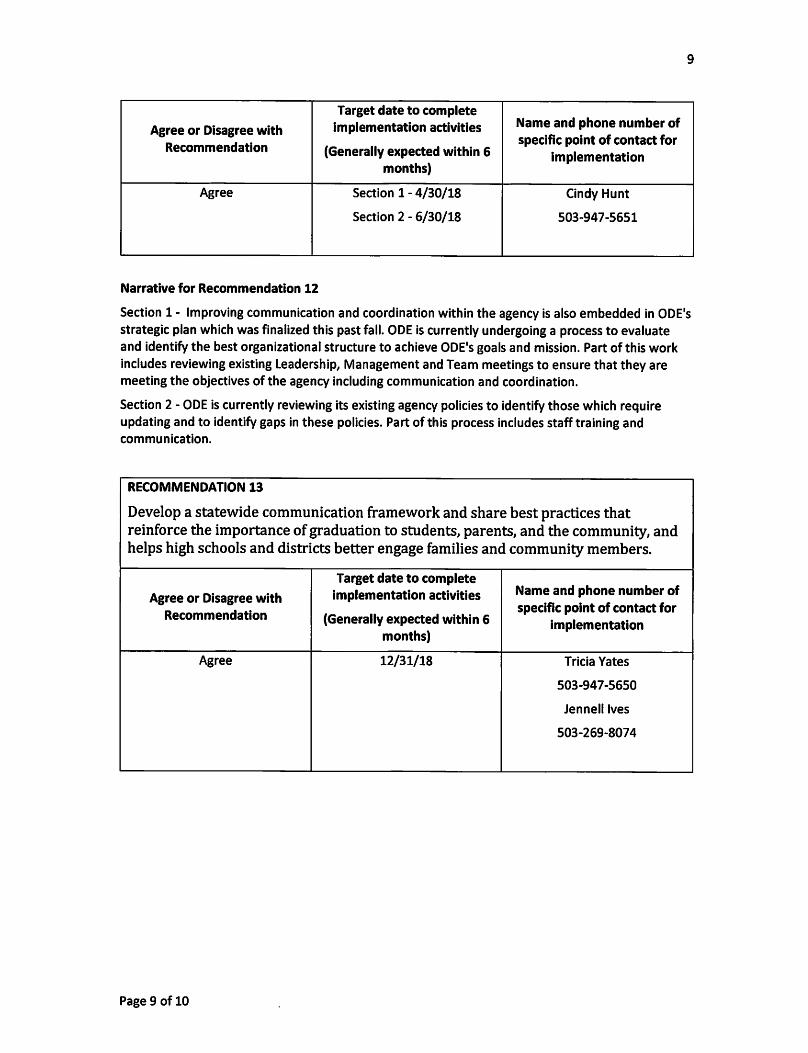
12. Prioritize its current efforts to improve communication and coordination within the agency, and develop a process to ensure that these improvements are sustained. This would help ODE in strategically devoting its resources to improvement efforts including graduation.
13. Develop a statewide communication framework and share best practices that reinforce the importance of graduation to students, parents, and the community, and helps high schools and districts better engage families and community members.