the organization of enterprise in japan - harvard … files/14-037_ab1d14d1...the organization of...
TRANSCRIPT

Copyright © 2013, 2014 by Tom Nicholas
Working papers are in draft form. This working paper is distributed for purposes of comment and discussion only. It may not be reproduced without permission of the copyright holder. Copies of working papers are available from the author.
The Organization of Enterprise in Japan Tom Nicholas
Working Paper
14-037 August 30, 2014
The Organization of Enterprise in Japan
Tom Nicholas* Harvard Business School
August, 2014
Abstract
Recent research reveals that the joint stock corporation was not a superior form of business organization in many countries historically. In Japan, however, it played a more fundamental role. Between 1896 and 1939 joint stock enterprises accounted for 44 percent of registered businesses, and 80 percent of total capital. From 1922 to 1939 joint stock enterprises outperformed limited and unlimited partnerships by ROE, and generated 94 percent of aggregate profits. External finance factors, Japan’s development phase, industrial structure, public policy and culture determined high joint stock usage. When the private limited liability company was introduced in 1938, it did not displace the joint stock form.
Keywords: Japan, legal form, enterprise, modernization
* Soldiers Field Road, Boston, MA 02163, USA. Email: [email protected]. I thank Joan Farre-Mensa, Les Hannah, Naomi Kodama, Ramana Nanda, Nobuyuki Tamai, and Akiko Kanno and Mayuka Yamazaki from Harvard Business School’s Japan Research Center in Tokyo for helpful comments and suggestions. The Division of Research and Faculty Development at Harvard Business School provided funding.
2
I. INTRODUCTION
Traditionally joint stock corporations have been seen as indispensable to rapid economic
progress because they foster capital pooling, risk sharing and governance (e.g., Cochran, 1974;
Chandler, 1977), but recent research has shown that when alternative forms were available in
history, specifically the private limited liability company (PLLC), then the joint-stock form was
adopted much less frequently. Guinnane et al., (2007) find that legal provisions introducing the
PLLC first emerged in 1892 in Germany with the Gesellschaft mit beschränkter Haftung
(GmbH), and Britain authorized PLLCs to be established from 1907.1 Similarly, France’s version
of the PLLC, the Société à Responsabilité Limitée, was adopted widely following its introduction
in 1925. When the United States finally provided a systematic framework for the organization of
PLLCs in the late twentieth century2, Guinnane et al., (2007) argue that small and medium sized
business owners were liberated from the restrictions associated with the corporate form.
The recent body of work indicates that the joint stock corporation has been overstated as a
handmaiden of economic growth, and it has also substantially refocused the literature on the
nuances of laws governing business organizational choices. For example, Lamoreaux and
Rosenthal (2005) show that the contracting environment faced by firms in nineteenth century
France and the United States was quite similar despite these countries having fundamentally
different legal origins. Much of the new work is cross-country comparative in approach, but
studies of individual countries are also illuminating. Despite operating under a Civil Code,
during the late nineteenth and early twentieth centuries, Spanish entrepreneurs were permitted by
commercial law to organize their businesses in innovative ways. Many opted for what became
1 In Germany in 1907 corporations accounted for just 0.3 percent of firms, while other legal forms of organization such as the commercial partnership or the GmbH employed approximately 88 percent of the labor force. See Guinnane et al., (2007), p. 16. 2 Although several states made efforts to introduce PLLCs during the late nineteenth and early twentieth centuries it was not until the 1980s that the PLLC form became fully instituted.

3
institutionalized as the Sociedad de Responsabilidad Limitada, the Spanish version of the PLLC
(Guinnane and Martinez Rodriguez, 2012). Flexibility was also present in another country, civil
law Brazil, as different layers of the French-based legal system (i.e., protections within corporate
charters as opposed to national laws) afforded many safeguards for creditors and investors that
were available in common law countries (Musacchio, 2009).
This paper examines the legal and historical context in which firms were organized in
Japan from 1896 when the Civil Code was enacted and comprehensive records began to be
collected. It poses two questions. First, what type of business organizational form was used most
heavily? Second, to what extent were organizational forms associated with performance
differences? While Guinnane et al., (2007) and a number of other studies have addressed the first
question in specific country contexts, lack of data has precluded progress on the second question.
This is an important omission because evaluating the performance of enterprises by their
organizational form permits much broader conjectures to be made concerning the relationship
between the structure of enterprise and economic progress. For example, Owen (1991) argues
that economic growth was constrained in the Russian Empire by especially restrictive corporate
laws and bureaucratic regulation, while Kuran (2005) maintains that an aversion to the
corporation in Islamic law held back the development of the Ottoman Empire.
Several factors make the study of Japan compelling. First, it adapted basic institutions from
the West so it selected and modified the legal frameworks (including those relating to enterprise
form) that were considered to provide the best foundation for economic development (Westney,
1987). The Japanese case helps inform our understanding of the extent to which policy makers
considered that particular types of enterprise form would function most effectively in that
context. Second, Japan underwent a profound economic transformation starting in the Meiji era,

4
which was underpinned at least partly by the growth of enterprise. Hence, the link between
enterprise and economic development is fundamental. Third, at a more pragmatic level from the
standpoint of empirical analysis, because the government prioritized growth it kept meticulous
statistical records to guide policy. Data compiled by the Japanese government represent one of
the most comprehensive collections of information on enterprises for any country historically.
New data were assembled from Japanese governmental reports and consist of a 44 year panel
on the organization and performance of enterprise for the 47 prefectures from 1896. The dataset
is constructed at the level of legal form, by industry, by prefecture, by year. For the time period
1896 to 1939 the dataset includes the number of enterprises by type of legal organizational
structure, and financial variables including the value of authorized and paid-up capital. During
the early 1920s the Division of Statistics of the Ministry of Agriculture and Commerce started to
collect additional data on the net profits and losses of joint stock corporations [Kabushiki
Kaisha], limited partnerships [Goushi Kaisha] and unlimited partnerships [Goumei Kaisha].
Performance data were collected from 1922 to 1939 permitting outcomes to be examined at the
legal form, by industry, by prefecture, by year level for the universe of registered enterprises.
Beyond Section II, which covers the historical background, the paper has four main parts.
Section III documents the data construction effort and provides descriptive evidence on
enterprises by type of legal organization over time, across prefectures and industries. Heavy use
of the joint stock form stands out. Joint stock companies accounted for the largest share of all
registered enterprises, followed by limited partnerships and unlimited partnerships. The share of
enterprises by type remained roughly the same across prefectures. The largest share of joint stock
firms existed in the transportation sector, a sector relying heavily on external finance. Joint stock
5
firms were considerably larger on average than limited and unlimited partnerships, accounting
for around 80 percent of total capital.
In Section IV, the descriptive evidence is related to the existing literature in order to provide
potential explanations for why the joint stock form was used so dominantly. While a range of
idiosyncratic factors mattered, main explanations revolve around the following areas: the
provision of external finance, development phase and industrial structure, and culture and public
policy. Specifically, work by Miwa and Ramseyer (2002) highlights that businesses relied much
more heavily on equity in competitive capital markets versus bank-provided debt than is
typically supposed. As such, external finance considerations would have biased organizational
choices towards the joint stock form. So too would the capital intensity demands of
modernization as Japan progressed along the pathway to development. In terms of industry
structure the conglomerate form, or zaibatsu, is inextricably linked with Japanese enterprise
history. After about 1910 most zaibatsu began to reorganize from unlimited or limited
partnerships to joint stock enterprises under a holding company, which had a positive effect on
performance (Okazaki, 2001). Finally, policy makers chose to make the joint stock form widely
accessible, while cultural factors meant joint stock corporations had a particularly high prestige
status relative to their unlimited or limited partnership counterparts.
The new data are used in Section V to consider the economic significance of enterprises as
measured by their financial performance. For the period between 1922 and 1939 joint stock
corporations accounted for 94 percent of aggregate profits and panel regressions show they
performed better than unlimited and limited partnerships on a return on equity (ROE) basis.
Additional specifications attempt to address the possibility that better performing business
owners (in ROE terms) may have chosen to adopt the joint stock form, perhaps to attract more

6
outside capital. While endogeneity concerns cannot be ruled out, linking the descriptive results
with existing evidence from the literature helps to isolate potential mechanisms and selection
effects. Overall, the analysis shows the particular importance of the joint stock form both
extensively and in terms of its relative financial performance.
Finally, it could be argued that the heavy use of the joint stock form may be unsurprising
because an intermediate form of enterprise like the PLLC was unavailable. Therefore, additional
descriptive data are introduced in Section VI to examine changes in the organization of
enterprise following the passage of laws promulgating the Yugen Kaisha, Japan’s form of
PLLC.3 The Yugen Kaisha was instituted under the Private Limited Liability Company Law
[Yugen Kaisha Hou] of 1938 and it came into force in 1940. Exploiting the period after Japan
introduced the PLLC means that a fuller menu of organizational forms becomes observable.
Following the legal reform the share of joint stock companies remained roughly the same
because the PLLC displaced limited and unlimited partnerships. This finding contrasts with
Guinnane et al. (2007) who show that in Britain and France legislation promulgating PLLCs led
to a relative drop in the formation of joint stock corporations.4 In these countries, and in
Germany, the PLLC gave owners the flexibility to create structures that balanced tradeoffs
associated with issues such as protecting against untimely dissolution and providing concessions
to minority shareholders, which negated joint stock ownership. In Japan the tradeoffs between
organizing as a joint stock or PLLC appear to have been much less extreme.
Broad explanations covered in Section IV also help to account for the heavy use of the joint
stock form for the time period when the PLLC became available. Japan’s rapid post-WWII
3 Performance data are not available on a systematic basis after the Second World War. 4 In Germany the cost of incorporation was particularly high and therefore the number of corporations was quite small. The GmbH substituted mainly for ordinary partnerships. See further, Guinnane et al. (2007), pp. 16-17.

7
growth created opportunities for joint stock enterprises that were able to access external capital
markets (Hoshi and Kashyap, 2004). A growth in stock ownership by banks, and the connection
of corporations through cross-shareholding keiretsu led to biases in the direction of corporate
organization. Cultural norms favoring joint stock enterprise persisted, while imperfect regulatory
boundaries did little to separate small closely-held enterprises from large dispersed ownership
firms, meaning more limited substitution between the PLLC and the joint stock form.
Consequently, attributes of the PLLC appealed mostly to Japanese business owners who had
previously chosen to organize as limited and unlimited partnerships.
II. HISTORICAL BACKGROUND
Business enterprise contributed significantly to Japan’s remarkable process of modernization,
so it is an ideal historical context for examining the link between legal organizational forms and
economic development. Economic growth in Japan from the late nineteenth to the mid-twentieth
century represented the product of, among other factors, institutional reform, infrastructure
investment, technological development and the marginalization of the old feudal system of the
Tokugawa era (e.g., Mosk 2001; Morck and Nakamura, 2007; Mitchener and Ohnuki, 2009;
Nicholas, 2011). Although growth was faster during the post-WWII era than in the pre-WWII era
(Hayashi and Prescott, 2008), the Japanese “economic miracle” of the former years was not
independent of the foundations established during the latter years (Kelley and Williamson,
1974). Although agricultural employment remained approximately constant between 1885 and
1940, resources were increasingly deployed in commerce and industry.5
In categorizations of countries around the world by their legal origin (e.g., La Porta et al.,
2008) Japan is classified as following the German tradition. This makes some sense up to the
5 Agricultural employment remained approximately the same at 14 million from 1885 to 1940, but the share fell from over 60 percent to around 40 percent over the same time period (Hayashi and Prescott, 2008, p. 580, p. 596.)
8
mid-twentieth century6 given that Japan replicated elements of most of the five major German
codes, and a major reform in 1911 was based on the German Handelsgesetzbuch, which had
replaced the original 1861 legislation relating to companies in that country.7 However, the
interpretation of codes by judges, rather than relying on precedent, as in common law countries,
had very little effect on the actual governance of enterprises. Hence, legal influence in the
Japanese case should be considered as being far more nuanced.
The multitude of influences pertaining to enterprises is reveled in a close inspection of the
Commercial Code, which established Japan’s system of business organization consisting of joint
stock corporations, limited partnerships and unlimited partnerships.8 Although the initial 1890
version was developed by a German employed by the Japanese government named Hermann
Roesler, a 1911 translation of the 1899 Commercial Code (which replaced an 1893 version)
makes implicit references to the use of French Commercial Code. French names are retained to
denote the various forms of enterprise even though German-based concepts are used in
substantive areas such as defining member liability and liquidation procedures.9
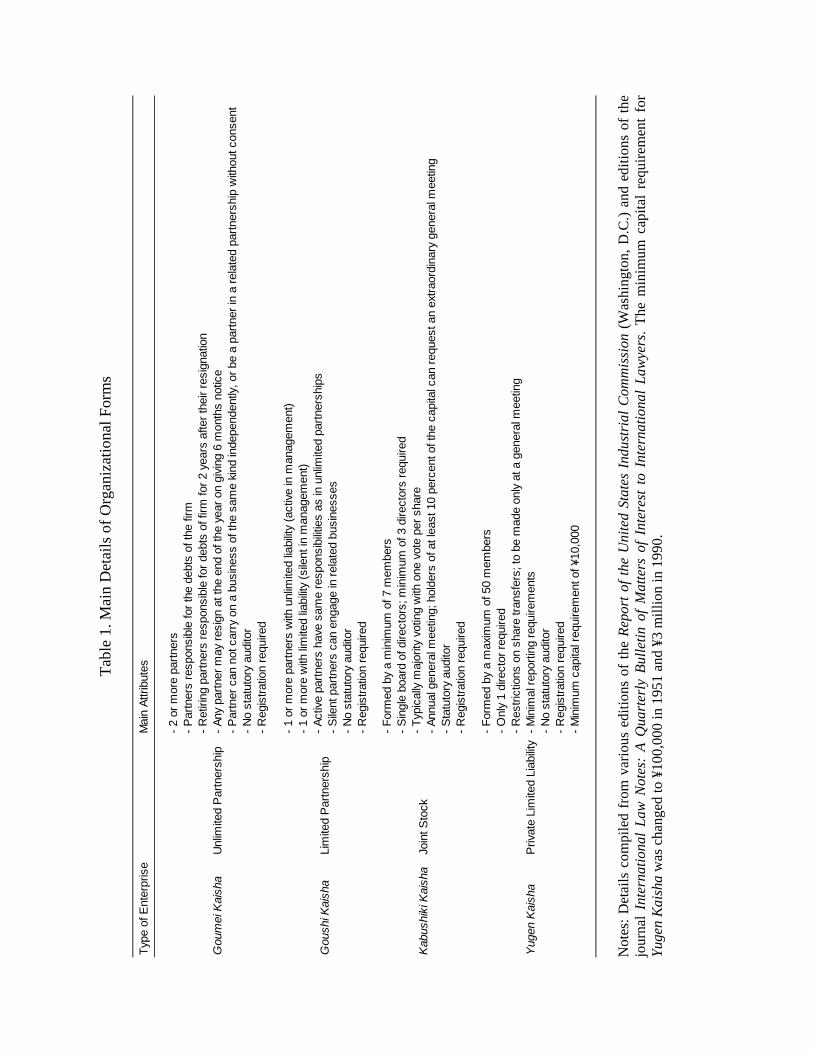
The main attributes of each organizational form are given in Table 1. It is well-known that
the joint stock form created benefits and costs: it facilitated access to external finance but gave
rise to moral hazard through limited liability. The Japanese joint stock form was only distinct in
a few minor respects from that used in other countries, including fuller disclosure requirements
and an increase in the scope of decisions that needed to be ratified at a general meeting. These
efforts were designed to protect minority shareholders (Baum and Takahashi, 2005, p. 376).
6 After the Second World War many laws affecting investor protections were of U.S. origin, so the time-invariant coding of Japan’s legal system is less defensible. 7 Japanese corporate law was also influenced by other countries. Issues related to the liquidation and reorganization of joint stock companies followed English principles. See further, Baum and Takahashi (2005), pp. 376-377. 8 Japan also used the joint stock limited partnership (Kabushiki Goushi Kaisha) which resembled the German Kommanditgesellschaft auf Aktienand and a mutual company form (Sougo Kaisha). However, neither was common. 9 Joint stock, limited partnerships and unlimited partnerships are recorded as: Kabushiki Kaisha [Société anonyme], Goushi Kaisha [Société en commandite] and Goumei Kaisha [Société en nom collectif]. Hang (1911), p. 10.
9
The organization of enterprise in this way represented a break from the pre-Meiji era, which
revolved around merchant houses run by prominent families and the guild system. Japanese
policy makers promoted joint stock companies according to the belief that they would facilitate
large-scale capital intensive enterprise, which was considered to be a crucial factor for catch-up
industrialization. As Eiichi Shibusawa (1840-1931) a prominent Meiji reformer stated: “To make
the nation truly prosperous, we must enrich the country; to enrich the country, we must make
scientific progress and help commerce and industry thrive; to help commerce and industry thrive,
we must establish joint-stock corporate organizations.” (Shimada, 2012, p. 9).
The joint stock form had a profound effect on Japanese business organization. Zaibatsu
enterprises – large diverse business conglomerates – started as ordinary partnerships but became
joint stock corporations. Most took advantage of limited liability for partnerships under the
Commercial Code, which mitigated downside risk without requiring family owners to disclosure
financial statements, but public pressures to disclose, along with governance considerations led
many to form as joint stock enterprises. As the economy became increasingly militarized during
the 1930s, the influence of the traditional family-owned zaibatsu waned, but new zaibatsu rose
to preeminence especially in heavy industries geared towards the war effort. New zaibatsu like
Asano and Nissan exploited the joint stock form, performing more favorably in terms of
profitability and sales growth than the old zaibatsu firms like Mitsui (Frankl, 1999).
However, while much of the existing evidence points to the significance of the joint stock
form, lack of data on the universe of enterprises leaves open questions about which
organizational form was most critical and especially the comparative performance of enterprise.
Notwithstanding zaibatsu enterprises controlled about one third of Japan’s capital stock (Frankl,
1999, p. 997) empirical studies relying on these enterprises alone leave two-thirds of the capital
10
stock unexplored. A major premise of the Guinnane et al., (2007) approach is that small and
medium sized businesses should be integrated into analytical frameworks, which can only be
achieved with an all-encompassing approach. The remainder of the paper introduces and
analyses new data on all registered enterprises in Japan to address fundamental questions with
respect to the use and performance of different organizational forms.
III. DATA AND DESCRIPTIVE EVIDENCE
New data were collected from Japanese government reports. Established in 1881, the
Ministry of Agriculture and Commerce (MAC) collected statistics on agriculture, commerce and
industry. When the MAC was divided into the Ministry of Agriculture and Forestry and the
Ministry of Commerce and Industry in 1925, information on companies continued to be collected
by the latter. Prefectural authorities were tasked with collecting information, which were collated
centrally. Using the Statistical Report of the Ministry of Agriculture and Commerce [Noushoumu
Toukei-hyo] and the Report on Business Companies [Kaisha Toukei-hyo] a consistent data series
on the number of enterprises and capital was established from 1896 to 1939.
The main dataset is a panel covering 47 prefectures from 1896 to 1939, three legal forms
(limited and unlimited partnerships and joint stock) and six industries (agriculture, fisheries,
commercial, industrial, mining and transport). A unit of observation is at the legal form, by
industry, by prefecture, by year, level. Exploiting an expansion of data collection efforts by
prefectures and the government, financial statistics for enterprises were also added to the data
from 1922. From 1896 figures for capital held by shareholders and owners of partnerships plus
reserves are reported, and starting in the 1920s prefectural authorities also compiled data on
profits and losses, dividends and debentures “in order to make the statistics more complete and

11
useful.”10 Data on profitability become useable from 1922 and are reported both for profitable
and loss-making enterprises, which represents a particularly rich source of information.11 To
adjust for prices changes, the financial variables are given in 1939 prices using the CPI.12
Some advantages and disadvantages of the data are worth emphasizing. First, it is important
to note that the data cover the universe of registered enterprises, yet the majority of Japanese
enterprises were sole proprietorships and traditional kumiai (analogous to Anglo-Saxon
partnerships or German stille Gesellschaften) that did not have to register (they were regulated
by Civil Code provisions) and had no separate legal personality. As such, the entrepreneurial
foundations of Japanese enterprise formation cannot be fully explored.13 Second, the financial
data are not aggregated by business group and therefore the analysis cannot capture the
performance of each zaibatsu. In other words, the panel tracks the performance of the average
“representative” registered enterprise by legal form. Third, changes in enterprise form at the
firm-level are not observed. This precludes estimation by firm fixed effects, thereby ruling out
controls for omitted variables related to business owners choosing legal forms for reasons, such
as unobservable investment requirements, that were constant over time but variable across
enterprises. By using a higher level of aggregation as a unit of analysis, the approach trades off
some level of identification in order to achieve universal coverage of registered enterprises.
Main Trends
Beginning with the raw data, Figure 1 shows trends in the number of registered enterprises.
The kink in the series during the early 1920s is caused by two factors. First, data for the pre-1921 10 Keikichi Hirata, Chief Statistician, preface to 1921 Report on Business Companies [Kaisha Toukei-hyo]. 11 Financial data covering profits are first reported in 1921, but this appears to be an outlying year in terms of the quality of the data. Hence, all the estimates start from 1922. 12 Lawrence H. Officer and Samuel H. Williamson, “What was the GDP, CPI, Wage or Population of Japan Then?” Measuring Worth, 2013. 13 Several authors emphasize the entrepreneurial foundations underpinning Japanese economic development. See further Hirschmeier (1964) and Fukuyama (1996), p. 164).
12
period slightly overstates the number of enterprises and thus the growth rate because these years
include enterprises in suspension of business. Data from 1921 onwards do not include
suspensions. Second, the Great Earthquake of 1923 caused data for certain areas of Tokyo and
Kanagawa prefectures to be destroyed. A fall in the number of enterprises during the late 1930s
coincides with the Sino-Japanese War (1937-1945). As Nakamura (2003, p. 55) puts it: “the
direct and indirect effects of the war on Japan’s economy were profound, undermining the
foundations of the national, business and household economies.”
A clear trend to emerge from Figure 1 is the rapid development of business enterprise over
time. Approximately 5,000 enterprises were registered in 1896, but by 1939 there were over
88,000, representing an annual average growth rate of 7 percent. Although Japan was starting
from a low base given its early stage of development, and according to metrics like the number
of corporations per capita or corporate share capital (at market or book) as a percentage of GDP,
Japan was considerably behind the leading industrial countries (Hannah, 2013), the growth rate
is systematically pronounced across the Meiji, Taisho and early Showa eras.
Figure 2 highlights the changing organizational structure of Japanese business over time. For
the period as a whole joint stock companies accounted for the largest share of all enterprises (44
percent) followed by limited partnerships (around 40 percent) and unlimited partnerships (around
16 percent). Over time, the share of joint stock firms reached a peak during the early 1920s
before falling to a low point during the mid-1930s and rebounding by the end of the time period.
In 1939 joint stock firms accounted for around 40 percent of registered enterprises.
At the prefecture-level, Figure 3 shows the share of enterprises by legal form remained
approximately the same, with the only outlier being Okinawa which, with its capital intensive
sugar industry, had relatively more joint stock firms than the average. Kanto and Kinki, and to a
13
lesser extent Chibu (a region in-between Kanto, including large cities like Tokyo and Yokohama,
and Kinki, where the cities of Kyoto, Osaka, and Kobe are located), remained dominant areas
accounting for almost three quarters of enterprises between 1896 and 1939.
Figure 4 breaks down the data by industry. All the major sectors covered by the data
(fisheries and mining are excluded because the number of observations is too small to generate
annual shares) exhibit similar approximate time series changes. In terms of levels, the
transportation sector stands out with the highest proportion of joint stock firms. According to
Figure 5 joint stock companies accounted for around four-fifths of total capital, which remained
roughly constant throughout the time period. Data on financial performance become useable
from 1922. Figure 6 shows that joint stock firms accounted for 94 percent of the aggregate
profits between 1922 and 1939. When taken together, the evidence clearly indicates that that
joint stock enterprise was significant numerically, in terms of capital intensity and profits.
IV. EXPLANATIONS FOR THE ADOPTION OF THE JOINT STOCK FORM
Three broad explanations are particularly useful for understanding the prevalence of the joint
stock form. First, the main argument advanced for organizing as a joint stock enterprise is that it
facilitates access to external finance through the issuance of shares in public equity markets. In
Japan during the late nineteenth and early twentieth centuries, joint stock formation for reasons
related to corporate financing was especially important. Despite the development of a well-
functioning banking sector during the Meiji era (Mitchener and Ohnuki, 2009), firms relied
heavily on public equity capital rather than bank debt for long term financing.
The principal evidence for this explanation derives from research by Miwa and Ramseyer.
They reject the Gerschenkron-based argument that bank intermediation was critical to the
provision of long term capital in Japan. Firms sold equity, issued bonds or funded investment
14
projects through retained earnings, with bank debt being a source of capital mostly for operating
expenses. Flow of funds data reveals a mean ratio of bank debt to gross assets of between 2 and 8
percent between 1919 and 1941, whereas firm-level data for cotton spinning, railroad and
electrical utility firms indicates a heavy reliance on stock and bond issues.
A precocious organization of stock exchanges facilitated this form of financing. Japan had
two stock exchanges in 1878 (Tokyo and Osaka), as many as 46 by the turn of the century as a
result of relaxed regulations, and following a rationalization phase, around 10 for the remainder
of the prewar era (Hameo et al., 2009, p. 57). Rajan and Zingales’ (2003, Table 3) figures
highlight that Japan had a higher ratio of stock market capitalization to GDP than Germany or
the United States for all the prewar benchmark years of 1913, 1929 and 1938. In fact, Japan
ranks highest by the Rajan-Zingales metric by some margin for all countries in 1938.
A second reason for the prevalence of the joint stock form relates to Japan’s early stage of
development and its industry structure. According to Guinnane et al., (2007, p. 3) “the corporate
form was important for enterprises such as railroads that had to raise enormous sums of capital
on the market.” In 1896 four out of the five largest joint stock companies in transport in Japan
were railroad concerns14 and they collectively held ¥85.3 million in assets compared to the five
largest joint stock companies in manufacturing (cotton or flax spinning concerns) which held
¥10.9 million in assets (Wray, 1984, p. 281).15 The development of transportation infrastructure,
which required state intervention and external financing, played a key role in facilitating urban
growth during the process of Japanese economic modernization (Mosk, 2001). Furthermore, joint
stock appears to have been associated with effective governance in Japan’s nascent industries.
14 The exception in transport was NYK Line [Nippon Yusen Kaisha] a shipping firm, which ranked as the second largest firm by asset size behind the Japan Railway Company. 15 These amounts in today’s U.S. dollars are approximately $3 billion and $390 million respectively.
15
For example, most enterprises in the cotton industry were joint stock concerns so enterprises
could grow, and be managed, beyond the boundaries of the family (Braguinsky et al., 2014).
Even zaibatsu enterprises ultimately became joint stock corporations. Access to external
capital was not a dominant reason for the switch since the zaibatsu relied heavily on family
finance. Rather public pressures for increased disclosure and changes in governance structures
played important roles. Mitsui, a major zaibatsu that can be traced back to the early seventeenth
century, expanded from banking into mining, trade, and manufacturing and was the first zaibatsu
to alter its organizational form. In 1909 Mitsui transformed its four main constituent enterprises
into joint stock companies, which were held by family members using a limited partnership. This
partnership became a joint stock corporation in 1937 (Morikawa, 1992, p. 184).16
A third reason can be broadly categorized as public policy and culture. Beyond the efforts of
the Meiji reformers to promote joint stock organization, legislative changes had an important
effect on enterprise legal form. A law in 1905 doubled the taxes on partnerships, and it also
imposed taxes on retained earnings in mostly family-owned enterprises to fund the Russo-
Japanese War. Joint stock companies were exempt from the tax increases. Furthermore, Fruin,
(1992, p. 76) writes: “especially after the 1920 revision in which taxes were levied on dividends
and bonuses paid to individuals, family-controlled firms adopted the joint stock form of
ownership as a means of reducing taxes.”
The joint stock form was ascribed a high level of prestige by Japanese business owners
within the menu of enterprise choices, which meant that they were willing to subsume the
additional administrative costs and complexities associated with forming a corporation (Matsui,
2008, p. 112). As an illustration of this factor, consider Figure 7, which uses snapshot data from
16 Mitsui complied with the Commercial Code by having non-family shareholders and directors, but the stock was still mostly family-owned.
16
the 1921 Report on Business Companies [Kaisha Toukei-hyo] breaking down the level of
enterprise capital into size thresholds. Medium and large-sized enterprises tended to be
disproportionately organized using the joint stock legal form, but a surprising share of joint stock
enterprises possessed capital of less than ¥50,000 (approximately $500,000 in today’s U.S.
dollars). This is consistent with Hannah’s (2014b, pp. 9-10) extrapolations using Rajan and
Zingales’ (2003) data and other sources, showing that the average size of Japanese listed
companies was particularly small.
V. RETURN ON EQUITY SPECIFICATIONS AND RESULTS
Measuring Performance
Was Japan better off for the preponderance of its joint stock enterprises? While the
relationship between equity returns and economic growth is complex (Ritter, 2005)17, metrics for
measuring the comparative performance of enterprises are illuminating, especially given that
performance measures are absent from most historical studies of law and enterprise form. ROE
makes the most sense as a performance measure in this case given the rich data provided in the
governmental reports on the capital held in enterprises and net profits. Although joint stock firms
were larger than partnerships and generated more profits, it does not necessarily follow that they
were more efficient in the use of capital. Several studies have shown that private firms have
higher ROE than public ones (e.g., Faccio et al., 2012) or that firms experience a decline in
profitability once they undergo an IPO (e.g., Loughran and Ritter, 1997). Numerous scholars
have identified an inverse correlation between firm size and equity returns (e.g., Banz, 1981) and
equity capitalization is a priced factor in the asset pricing model of Fama and French (1995).
17 Ritter (2005) finds a negative relationship (cross-sectional correlation of -0.37) between cross-country real stock returns and per capita GDP growth between 1900 and 2002.

17
Table 2 reports descriptive statistics on the financial variables of interest and basic difference
in means tests. These show that the level of capital and net profits were significantly higher in
joint stock firms compared to both limited and unlimited partnerships. Variables inputted directly
from the data volumes can be used to construct ROE estimates, which are calculated using the
formula below, where f denotes type of organizational form, i industry, p prefecture and t denotes
year. Table 2 shows that joint stock firms generated an average ROE of approximately 3.6
percent per annum between 1922 and 1939 compared to -0.69 percent for limited partnerships
and 0.53 percent for unlimited partnerships. These are estimates for the universe of enterprises in
Japan. For benchmarking purposes Okazaki (2001, p. 255) reports an average ROE of 8.9
percent per annum for 135 major firms active in Japan between 1922 and 1936.
19391922tcapital
profitnetfpitfpit ...
ROE
(1)
In a multivariate context the data can be used to specify an ROE estimating equation in the
following form to examine the relationship between enterprise form and performance:
fipttpifipt2fipt1fipt2fipt1fipt )CAPlog(LEVUPLPROE (2)
ROE is the performance measure and the main parameters are 1 and 2 for two dummy
variables, which measure ROE for limited partnerships (LP) and unlimited partnerships (UP)
relative to the baseline excluded category of joint stock companies. To control for the impact of
leverage on returns (i.e., the possibility that higher ROE may be driven by the greater use of debt
financing) and differences in size, LEV measures the average ratio of debenture debt to capital
and CAP measures the average capital of enterprises. With variation in ROE for each

18
organizational form by industry, prefecture and year, i , p and t represent fixed effects to
control for unobservable sector-specific, spatial or macroeconomic shocks respectively.
An obvious issue with this econometric approach is selection. Rather than being randomly
determined, organizational form is a choice on the part of business owners and assuming a
hierarchy of forms, then successful business owners may have simply selected to organize as a
joint stock corporation. According to the explanations outlined above for the adoption of the
joint stock form, business owners may have chosen this structure to access external finance and
achieve higher growth rates, especially in capital intensive industries, or because of development
stage and industry structure, or public policy and cultural factors, or a simultaneous mixture of
all of these factors. Given the life cycle of firms, it is plausible that limited and unlimited
partnerships accounted for the majority of early stage enterprises and would therefore exhibit a
greater degree of entrepreneurial “churn” through successes and failures (Haltiwanger, 2012). If
these categories reflect the main margin of adjustment, the effect would be to depress average
ROE for limited and unlimited partnerships relative to the joint stock category.
Although ultimately the parameter estimates from (2) cannot be interpreted as causal, some
progress can be made in addressing these and other potentially confounding issues. As
robustness checks, separate regressions are run to test for spatial differences by excluding the
main industrial areas of Kanto and Kinki and for major time period differences given that the
Japanese economy became ever more militarized during the 1930s, and enterprises may have a
performed differently in a market-based economy with free entry and exit of the entrepreneurial
labor supply as opposed to in an increasingly autarkic context. Using a specification with
interactions between LP and UP dummies and sector-specific variables, ROE estimates are also
provided by type of enterprise organization for each industry relative to the joint stock form.
19
Furthermore, because the data volumes separately record net profits for both profitable and
unprofitable enterprises it is possible to analyze the extent to which ROE differences are being
driven by successful or unsuccessful business owners; that is, whether better entrepreneurs who
generated higher ROE may have selected in to the joint stock form. Finally, following research
in the finance literature, (e.g., Asker et al., 2013), matching methods are used. Figure 8 illustrates
large differences by organizational form with respect to the distribution of capital, suggesting
that organizational form and performance may simply reflect fundamental variation between
different types of businesses. Matching is not a remedy for endogeneity concerns or omitted
variable bias, but it can be used to usefully examine ROE by enterprise type within overlapping
areas of these capital distributions.
Baseline Estimates and Robustness Checks
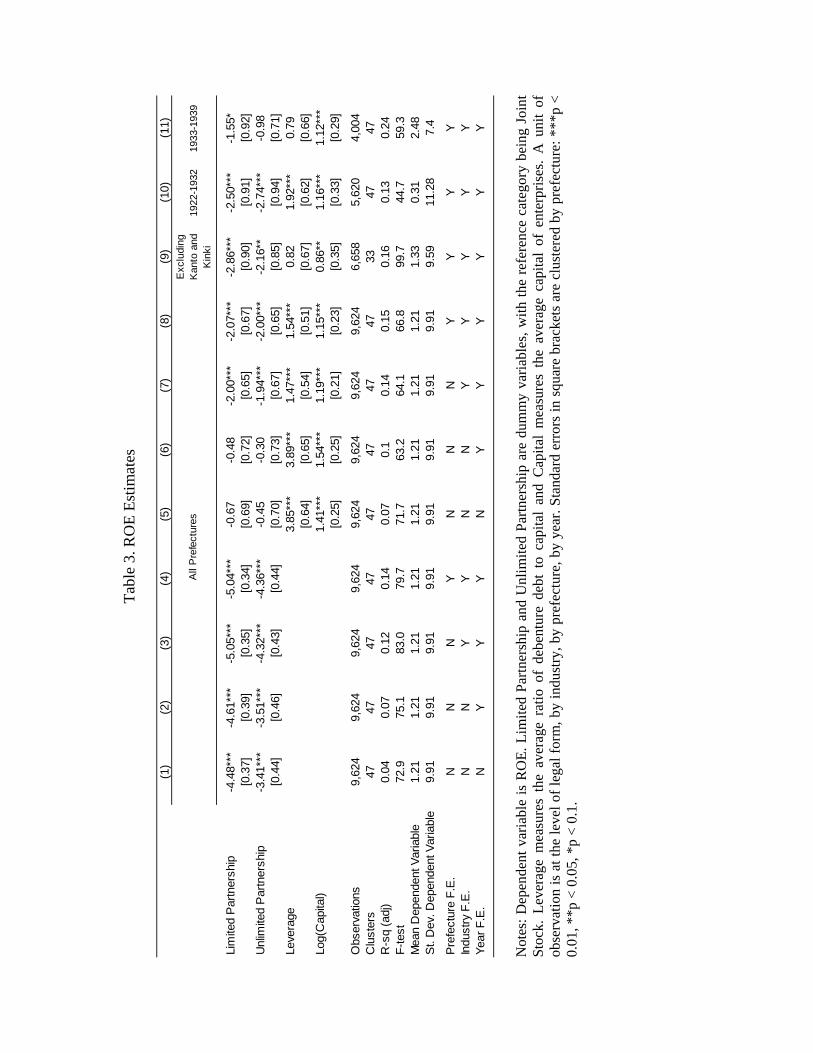
Table 3 reports OLS estimates from equation (2). Columns 1 to 4 sequentially add the
prefecture, industry and year fixed effects and columns 5 to 8 follow the same strategy while also
including controls for leverage and capital. Column 9 presents the estimates excluding
prefectures in the regions of Kanto and Kinki, which represent the largest concentrations of
enterprises, and columns 10 and 11 partition the data according to time periods when the
Japanese economy was less and more exposed to militarization.18 The dependent variable, ROE,
is measured in percentage points. Standard errors account for the clustering of observations
within prefectures. Given missing observations in the data volumes for some of the variables, the
regressions are estimated symmetrically across specifications with 9,624 cells.19
18 Two main periods are used, 1922 to 1932 and 1933 to 1939. In 1932 Inukai Tsuyoshi, the Prime Minister of Japan was assassinated. This represents a demarcation point to identify the strengthening of militarism. 19 Because a unit of observation is at the level of legal form (3 types), by prefecture (47) by sector (6), and the panel covers 18 years (1922 to 1939) a balanced panel would give 15,228 observations. However, some enterprise forms
20
Estimates in columns 1 to 4 reveal large negative and statistically significant effects on the
category dummy variables for both limited and unlimited partnerships. At the legal form, by
industry, by prefecture, by year level the ROE of limited partnerships was between 4.5 and 5
percentage points lower than that of joint stock enterprises, the baseline category. The ROE of
unlimited partnerships was between 3.4 and 4.4 percentage points lower. Both estimates are large
compared to the ROE sample mean of 1.2 percent. The estimates are reasonably stable across
columns 1 to 4 with the addition of the year, industry and prefecture fixed effects.
In columns 5 and 6 the parameters on the dummy variables become statistically insignificant
with the addition of controls for leverage and capital. Leverage enters positively and
significantly, implying that enterprises with greater leverage had higher ROE, which may stem
from the fact that if business owners can borrow capital at less than the marginal rate it can be
earned within the enterprise, then ROE should be mechanically higher. More surprisingly, the
coefficient on the logarithm of capital is positive, implying that larger enterprises had higher
ROE, all else being equal. This contrasts with the negative relationship between market
performance and size found in the finance literature (e.g., Fama and French, 1995). Potential
explanations would be larger Japanese enterprises being able to benefit from scale and scope
economies (Chandler et al., 1997), or that size correlates with unobserved managerial ability.
While the coefficients on the limited and unlimited partnership dummy variables are
statistically insignificant in columns 5 and 6, they become statistically significant in columns 7
and 8 with the introduction of industry and prefecture fixed effects respectively. These estimates
indicate that limited and unlimited partnerships underperformed joint stock enterprises by
approximately 2 percentage points. The coefficients on the leverage and capital variables remain
did not exist at this level, or data are missing in the government reports. The maximum number of observations for any one variable in the dataset is 12,592, and for all the variables included in the ROE specifications it is 9,624.
21
economically large and statistically significant. In column 9 the exclusion of prefectures in Kanto
and Kinki leads to slightly larger differences in ROE between limited and unlimited partnerships
and joint stock enterprises, whereas the effects of leverage and capital on ROE are smaller.
Columns 10 and 11 show that the largest performance differences between enterprises are
observed in a free market setting between 1922 and 1932, although average ROE (the mean of
the dependent variable) was much higher between 1933 and 1939 in an environment where rising
government spending and low interest rates may have promoted investment and business
expansion.20 Overall, the baseline results and additional checks indicate that limited and
unlimited partnerships underperformed in ROE terms relative to their joint stock counterparts.
To explore sector specific variation in ROE performance, Figure 9 plots point estimates and
95 percent confidence intervals from specifications where the dummy variables LP and UP are
interacted with dummy variables for each sector. Joint stock enterprises act as the baseline
category. Most of the sector-specific point estimates are negative, although perhaps surprisingly
the confidence intervals overlap with zero in the transport sector where the joint stock form may
have been expected to have advantages as a conduit to external finance.21 The point estimates for
fisheries and mining are negative, but the confidence intervals are large because the number of
observations in these industries is somewhat smaller. In the industrial sector the relative ROE
estimates for limited partnerships and unlimited partnerships are negative and statistically
significant at the 5 percent level. The most precise, statistically significant negative ROE effect
20 Following the initial boom caused by the First World War, Japan underwent a decade of relative stagnation. It escaped most of the negative effects of the Great Depression. In his study of firm profitability in prewar Japan Okazaki (2001, p. 258) argues that the superior performance of zaibatsu enterprises may have been at least partly driven by privileged access to resources as a consequence of close ties to the government. 21 A more detailed industry classification system would permit heterogeneity within the broad industry categories to be explored. However, while these data are available from the government reports (there are break downs by approximately 45 sub-industries and 106 sub-sub-industries), at these more granular levels the number of missing observations increases substantially, as does the cost of data collection. These reasons meant constructing the dataset at the level of the legal form, by main industry, by prefecture, by year.
22
for limited and unlimited partnerships is estimated in the commercial sector, which includes
activities such as banking, insurance and services. The commercial sector accounts for
approximately 53 percent of enterprises in the dataset between 1896 and 1939 and approximately
52 percent of enterprises between 1922 and 1939 when ROE calculations can be made. As a
further robustness check, the specification in column 8, Table 3 was re-estimated without the
commercial sector. The parameters on the limited partnership and unlimited partnership
dummies are -1.79 (s.e. 0.84) and -1.62 (s.e. 0.86) respectively.
ROE for Profitable and Unprofitable Enterprises and Matching
Tables 4A and 4B provide results that attempt to decompose the ROE outcome variable into
components that can be attributable to profitable and unprofitable enterprises. The aim is to
explore potential mechanisms that may be driving the baseline results. For each observation cell
profits are recorded in the data volumes for successful (i.e., positive net profit) and unsuccessful
(i.e., negative net profit) enterprises. Tables 4A and 4B report estimates from regressions where
the dependent variable, ROE, is calculated using profits for each group of enterprises separately.
Because of this decomposition, the coefficients on the limited and unlimited partnership dummy
variables in Tables 4A and 4B sum to equal the coefficients in Table 3.
The first four columns of Tables 4A and 4B show that profitable and unprofitable enterprises
account for approximately equivalent contributions to the generation of the results in Table 3.
For example, the coefficient on the limited partnership dummy in Table 4A, column 1 is -2.18
when only the net profits of profitable enterprises are included in the calculation of the
numerator of equation (1) and -2.30 in Table 4B, column 1 when only the net losses of
unprofitable enterprises are included. These estimates sum to the coefficient of -4.48 in Table 3
column 1. However, introducing controls for leverage, capital and fixed effects reveals key
23
differences across the specifications. In columns 5 to 11 of Table 4A the coefficients are mostly
large, negative and statistically significant, whereas they are small and almost always fail to clear
thresholds for statistical significance in Table 4B. This implies that the differences in ROE by
organizational form in Table 3 are being driven largely by the differences present in profitable
enterprises. These results would be consistent with superior entrepreneurs selecting joint stock
status, or joint stock status facilitating ROE gains. Loss making enterprises are statistically
indistinguishable from one another by ROE across the different organizational forms.
Finally, Table 5 introduces matching estimates in order to test the robustness of the baseline
results contained in Table 3 against confounds due to the implicit weighting of observations in
the OLS linear framework. Whereas the baseline OLS estimates assume that the groups of
enterprises by organizational form are balanced in their observable characteristics, matching
relaxes that particular assumption so that only closely comparable observations determine the
calculation of the relative ROE difference. Given variation in the distribution of capital in Figure
8, and the fact that capital has a large and statistically significant effect on ROE in Table 3,
matching on observables has some advantages from the standpoint of inference.
Using the full set of variables in column 8 of Table 3 a propensity score was used to estimate
assignment probabilities into the categories of enterprises by their legal form. The ROE outcome
was then estimated by comparing limited partnerships with joint stock corporations and by
comparing unlimited partnerships with joint stock corporations. The first row in each set of
results provides a nearest-neighbor match where all observations in the data are included to
generate the estimates. The second row uses caliper nearest-neighbor matching since some of the
initial matches may have substantially different propensity scores. Calipers were set at a width of
24
0.2 times the standard deviation of the propensity scores (Austin, 2011). The final column
reports a test to check the matching estimates statistically balance enterprises by size.
In the first row of Table 4 it can be seen that the mean difference between limited
partnerships and joint stock enterprises is large, with a difference of -4.5 percentage points.
However, the covariate balance test rejects the null hypothesis that the two groups of enterprises
are closely matched according to their capital. Caliper matching in the second row of Table 4
provides more favorable balancing properties, establishing a mean difference of -1.3 percentage
points in the ROE of limited partnerships compared to observationally similar joint stock
enterprises. Although caliper matching leads to a substantial drop off in the number of matching
pairs, reassuringly the matching estimates in Table 4 of -1.3 to -4.5 percentage points bound the
baseline estimate of around -2.0 percentage points in column 8 of Table 3.
The third and fourth rows of Table 4 follow the same approach for comparing the mean ROE
of unlimited partnerships with joint stock enterprises. The mean differences are large and
negative, as in in column 8 of Table 3, although the covariate balance test fails to reject the null
hypothesis of observational overlap in terms of capital. A variety of mechanisms can explain
ROE variation, including correlations between the size of enterprises, the selection of
organizational form and performance, or superior ROE enabling a change in form over the life
cycle of businesses. Although the specific causal mechanisms cannot be identified, the results
nevertheless reveal a robust positive relationship between joint stock enterprises and ROE.
VI. INTRODUCTION OF THE YUGEN KAISHA, (JAPAN’S PLLC)
So far the analysis has shown that the joint stock form was heavily used in Japan during the
late nineteenth and early twentieth centuries, and that it was associated with superior
performance. Yet, both factors could be explained by an intermediate form of organization being
25
unavailable. Some business owners may have been constrained optimizers and have chosen the
PLLC over limited and unlimited partnerships, or the joint stock form, had it been available, as it
was in other countries such as Britain, Germany and France. One way of addressing this issue is
to examine what happened to organizational choices once the PLLC was introduced.
The Yugen Kaisha, which is often considered to be Japan’s version of the PLLC, was brought
about by a 1938 reform, which came into effect in 1940. While much of the more general
reforms at this time were based on the 1937 German Aktiengesetz, or stock corporation law, the
intuition behind the Yugen Kaisha followed that of the German GmbH from 1892, although (as
described in more detail below) the precise structure of these respective legal forms differed in
fundamental ways. Given the close historical correspondence between Japanese and German
laws it is perhaps surprising that policy makers did not introduce the Yugen Kaisha earlier.
On the other hand, to the extent that Japanese policy makers designed the Commercial Code
as an “eclectic body of law embodying the best principles of the commercial laws of all other
civilized nations”22 it could be argued that the introduction of the Yugen Kaisha almost half a
century after it first appeared in Germany was a reflection of the suitability of existing forms. In
other words, it is possible there was no demand for a structure that in the language of Guinnane
et al., (2007, p. 2), “combined the advantages of legal personhood and joint stock with a flexible
internal organizational structure.” Shimizu (2012) argues, for example, that flexible governance
could be achieved by business owners under the existing Goushi Kaisha, and that the principal
contribution of the Yugen Kaisha was only to extend the scope of limited liability.
22 De Becker (1913), p. 207.

26
Although Japanese policy makers had considered a flexible limited liability structure in the
original Meiji draft of the Commercial Code23, according to Baum and Takahashi (2005, p. 378)
the major momentum for legislative change towards the Yugen Kaisha only originated in 1917
and 1918 with two academic studies published by Naojiro Sugiyama, from Tokyo University.
Sugiyama pointed out that many countries had invoked laws promulgating PLLCs and the rapid
take-up of the new form in those places implied Japanese small firms, which proliferated around
the time of the First World War, could also benefit from the new organizational form. In 1929,
the Tokyo Chamber of Commerce and Industry investigated laws in relation to various forms of
enterprises, especially those with limited liability. Drawing on the findings of this investigation
and academic studies, in 1931 the Legislative Council of the Ministry of Justice announced that
it would “provide through a special law, recognition for a special form of company equivalent to
a limited liability company under foreign laws, or a private company under English laws”
(Asagi, 1995). A bill on the Yugen Kaisha was submitted seven years later to the Imperial Diet,
and it was enacted in 1940 along with other laws revising the Commercial Code.
Table 1 documents basic elements of the Yugen Kaisha and illustrates how it differed from
the other organizational forms available at the time in Japan. It provided for limited liability
(though not as flexibly as the GmbH24), was capped by a maximum of 50 shareholding members
(the GmbH had no member caps25), imposed restrictions on the transfer of shares but required
only one director, and limited reporting requirements.26 In an effort to exclude very small
businesses, a minimum capital requirement was initially set at ¥10,000 (approximately $100,000
23 Asagi (1995) documents that Hermann Roesler, the German who was commissioned to draft Japan’s initial Commercial Code, included the idea of Sakin Kaisha, which allowed some partners to be unlimited liability partners through agreement among all partners in the articles of association. This idea was not included in the final text. 24 Unlike in the case of German law with respect to the GmbH, no voluntary undertaking of additional contractual obligations by means of the articles of association was permissible. Japan did not recognize any deviation from the limits of liability set out in it laws. 25 In this sense the Yugen Kaisha was more similar to the 1907 British PLLC which also had capped membership. 26 For example, publication of a balance sheet was not required.
27
in today’s U.S. dollars). Yet, the 50 member cap was sufficiently high to permit larger
enterprises to exploit the new form.27 In effect the Yugen Kaisha law established an intermediary
form between the limited and unlimited partnership and the joint stock form.
Figure 10 presents time series data on the concentration of business forms in Japan from
1940 to 1995. Two striking patterns emerge. First, the adoption of the PLLC was immediate and
rapid despite the disruption of the Second World War. Within two decades the PLLC accounted
for 37 percent of all registered enterprises, and by the end of the twentieth century it accounted
for more than 50 percent.28 A second clear trend to emerge from the data is that the PLLC
displaced limited and unlimited partnerships not joint stock enterprises. In this sense, the
Japanese experience is much closer to that of Germany, than Britain or France where the PLLC
started to substitute for the joint stock form (Guinnane et al., 2007).
Why did the joint stock form remain in heavy use despite the introduction of the Yugen
Kaisha? As in the prewar era (see Section IV), external finance considerations continued to be
important, but rather than being advantageous for accessing equity markets, the joint stock form
offered benefits for accessing bank debt, which became a considerably more important financing
channel in the postwar years (Franks et al., 2014). Although several zaibatsu were eliminated or
restructured as a consequence of the allied occupation29, cross-shareholding developed under the
new keiretsu, and banks and financial institutions became both creditors and shareholders of the
new industrial groups (Shishido, 2001, p. 664). Reforms from 1945 to 1952 led to the
reconfiguration of corporate power and authority between the shareholders meeting, the board of
27 The minimum capital requirement for Yugen Kaisha was changed to ¥100,000 in 1951 and ¥3 million in 1990. In 1990 also the minimum capital requirement was introduced for Kabushiki Kaisha and set ¥10 million. Before that, there was no legal minimum capital requirement for Kabushiki Kaisha, but ¥350,000 had been used as a threshold for a stock exchange listing. 28 In 1995, there were 1,219,214 registered PLLCs in Japan versus 1,213,034 joint stock, 26,485 limited partnerships and 5,724 unlimited partnerships. 29 The zaibatsu had been strong supporters of the militaristic government, so their breakup was considered to be a major objective of the allied occupation.

28
directors, and corporate auditors as investor protections in joint stock businesses were
strengthened; but in the long run regulations protecting shareholders at the expense of business
owners were less stringent in Japan than in other countries (Hannah, 2014b). A culture favoring
the joint stock form persisted through the postwar era as it signaled advantages when, for
example, engaging in procurement contracting or in developing relationships with banks. Joint
stock was a prestigious type of organization more generally despite being associated with higher
administrative costs and more stringent public disclosures (Matsui, 2008).
VII. CONCLUSION
This paper has assembled new data on the organization of enterprise in Japan, with a view to
placing the Japanese experience in the context of the broader research agenda initiated by
Guinnane et al., (2007). Their findings show convincingly that the joint stock corporation was
not a superior form of business organization in many advancing industrial nations. When
governments offered business owners the opportunity to have a flexible system of organization
that was embodied in the PLLC, the take-up was generally rapid, and this process occurred in
nations with both Anglo-American and French, or German, legal institutions. As such this body
of works casts strong doubts on the alleged domination of both joint stock corporations and
country-specific legal origins as being major determinants of economic growth.
Japan appears to be a unique case, which both confirms and differs from some of this
established wisdom. On the one hand, it was ostensibly a civil law country in which the joint
stock form was probably just as popular as it was in the United States where a common law legal
tradition existed. On the other hand, the role of the joint stock corporation was likely more
pivotal in the process of Japanese modernization during the late nineteenth and early twentieth
centuries than it was in many other countries, including Germany, Britain and France. It was

29
prevalent over time, across prefectures and sectors and it was superior in terms of ROE
performance. Joint stock enterprises accounted for 94 percent of aggregate profits between 1922
and 1939, a striking illustration of this particular organizational form’s dominance.
Even when the PLLC was introduced, providing an ex post insight into the potential selection
preferences of business owners, the share of enterprises organized under joint stock ownership
remained high. The Yugen Kaisha offered an intermediate choice to small and medium sized
business owners, but the specific Japanese legal and historical context meant there was limited
substitution with the joint stock form. Moreover, while the Yugen Kaisha ultimately accounted
for over half of all registered enterprises, its relevance for satisfying the needs of both business
owners and the government was severely negated in the long run. Progressive revisions to
Japanese company law effectively narrowed the legal and organizational gap between the Yugen
Kaisha and joint stock ownership. Under reforms in 2005, the Yugen Kaisha was abolished and
replaced with the Godo Kaisha, which was modeled on the U.S. limited liability form.
30
References
Asagi, Shin-ichi, “Historical Review of the Corporate Law Revisions of Showa 13, Part 3: An Historical Perspective on the Events Leading to the Enactment of the Yugen Kaisha Laws in Japan,” [Showa 13-nen Kaisha-hou Kaisei no Rekishi-teki Tenkai: Dai-3-bu – Honpou Yugen Kaisha-hou Seitei Shoushi] The Law and Politics Review [Kobe Gakuin Hougaku] 25 (3) 1995: 1-57.
Asker, John., Joan Farre-Mensa, and Alexander Ljungqvist, “Comparing the Investment Behavior of Public and Private Firms,” New York University Working Paper, 2013.
Banz, Rolf W., “The Relationship Between Return and Market Value of Common Stock,” Journal of Financial Economics 9 (1) 1981: 3-18.
Baum, Harald., and Eiji Takahashi, “Commercial and Corporate Law in Japan,” In Wilhelm Röhl, History of Law in Japan Since 1868 (Leiden, 2005).
Braguinsky, Serguey., Atsushi Ohyama, Tetsuji Okazaki and Chad Syverson, “Acquisitions, Productivity, and Profitability: Evidence from the Japanese Cotton Spinning Industry,” University of Chicago Working Paper, 2014.
Chandler, Alfred D., Jr, Franco Amatori and Takashi Hikino eds., Big Business and the Wealth of Nations (Cambridge, Mass., 1997).
Chandler, Alfred D., Jr. The Visible Hand, (Cambridge, Mass., 1977). Cochran, Thomas., “The Business Revolution,” American Historical Review 79 (1) 1977: 449-
66. De Becker, Joseph Ernest., Commentary on the Commercial Code of Japan (London, 1913). Faccio, M., M. Marchica, J. McConnell, and R. Mura, “Returns and Risks to Private Equity,”
Purdue University Working Paper, 2012. Fama, Eugene F., and Kenneth R. French, “Size and Book-to-Market Factors in Earnings and
Returns,” Journal of Finance 50 (1) 1995: 131-155. Frankl, Jennifer L., “An Analysis of Japanese Corporate Structure, 1915-1937,” Journal of
Economic History 59 (4) 1999: 997-1015. Franks, Jullian., Colin Mayer and Hideaki Miyajima, “The Ownership of Japanese Corporations
in the 20th Century,” Review of Financial Studies, forthcoming, 2014. Fruin, Mark., The Japanese Enterprise System: Competitive Strategies and Cooperative
Structures. (Oxford, 1992). Fukuyama, Francis., Trust: Human Nature and the Reconstitution of Social Order (New York,
1996). Guinnane, Timothy., and Susana Martίnez Rodrίguez, “For Every Law, a Loophole: Flexibility
in the Menu of Spanish Business Forms, 1886-1936,” Yale Working Paper, 2012. Guinnane, Timothy., Ron Harris, Naomi R. Lamoreaux and Jean-Laurent Rosenthal, “Putting the
Corporation in its Place,” Enterprise and Society 8 (3) 2007: 687-729. Haltiwanger, John., “Job Creation and Firm Dynamics in the United States,” Innovation Policy
and the Economy 12 (1) 2012: 17-38. Hang, Yang Yin., The Commercial Code of Japan: Translated (Boston, 1911). Hannah, Leslie., “A Global Corporate Census: Publicly-Traded and Close Companies in 1910,”
Economic History Review, forthcoming, 2014. Hannah, Leslie., “Quoted Corporations, Private (Close) Companies and Limited Partnerships: An
Historical Comparison of Japan with the US, Germany, Switzerland and the UK, 1899-1999,” LSE Working Paper, 2014b.

31
Hayashi, Fumio., and Edward C. Prescott, “The Depressing Effect of Agricultural Institutions on the Prewar Japanese Economy,” Journal of Political Economy 116 (4) 2008: 573-562.
Hirschmeier, Johannes., The Origins of Entrepreneurship in Meiji Japan (Cambridge, Mass., 1964).
Japanese Governmental Reports. Statistical Report of the Ministry of Agriculture and Commerce [Noushoumu Toukei-hyo] and the Report on Business Companies [Kaisha Toukei-hyo]. Editions from 1896 to 1939.
Kelley, Allen C., and Jeffrey G. Williamson, Lessons from Japanese Development (Chicago, 2007).
Kuran, Timur., “The Absence of the Corporation in Islamic Law: Origins and Persistence,” The American Journal of Comparative Law 53 (4 ) 2005: 785-834.
Lamoreaux, Naomi R. and Jean-Laurent Rosenthal, “Legal Regime and Contractual Flexibility: A Comparison of Business’s Organizational Choices in France and the United States during the Era of Industrialization,” American Law and Economics Review 7 (1) 2005: 28-61.
La Porta, Rafael, Florencio Lopez-de-Silanes and Andrei Shleifer “The Economic Consequences of Legal Origins,” Journal of Economic Literature 46 (2) 2008: 285-332.
Loughran, T., and J. R. Ritter “The Operating Performance of Firms Conducting Seasoned Equity Offerings,” Journal of Finance 52 (5) 1992: 1823-1850.
Masakazu, Shimada., “The Tensions between the Open Market Model and Closed ‘Zaibatsu’ Model,” Bunkyo Gakuin University Working Paper, 2012.
Matsui, Tomoyo., “Corporate Governance and Closely-held Companies in Japan: the Untold Story,” in Luke Nottage, Leon Wolff, Kent Anderson eds., Corporate Governance in the 21st Century. Japan’s Gradual Transformation (London, 2008).
Mitchener, Kris., and Mari Ohnuki, “Institutions, Competition and Capital Market Integration in Japan,” Journal of Economic History 69 (1) 2009: 138-171.
Miwa, Y., and J. M. Ramseyer, “Banks and Economic Growth: Implications from Japanese History,” Journal of Law and Economics 45 (1) 2002: 127-164.
Morck, Randall., and Masao Nakamura, “Business Groups and the Big Push: Meiji Japan’s Mass Privatization and Subsequent Growth,” Enterprise and Society 8 (3) 2007: 543-601.
Morikawa, Hidemasa., Zaibatsu: The Rise and Fall of Family Enterprise Groups in Japan (Tokyo, 1992).
Mosk, Carl., Japanese Industrial History: Technology, Urbanization, and Economic Growth (Armonk, 2001).
Musacchio, Aldo., Experiments in Financial Democracy: Corporate Governance and Financial Development in Brazil, 1882-1950 (Cambridge, 2009).
Nakamura, Takafusa., Akira Hayami, Konosuke Odaka, Osamu Saito and Ronald P. Toby, The Economic History of Japan: 1600-1990. (Oxford, 2003).
Nicholas, Tom., “The Origins of Japanese Technological Modernization,” Explorations in Economic History 48 (2) 2011: 272-291.
Officer, Lawrence H., and Samuel H. Williamson, “What was the GDP, CPI, Wage or Population of Japan Then?” Measuring Worth, 2013.
Okazaki, Tetsuji., “The Role of Holding Companies in Pre-War Japanese Economic Development: Rethinking Zaibatsu in Perspectives of Corporate Governance,” Social Science Japan Journal 4 (2) 2001: 243-268.
Owen, Thomas C., The Corporation Under Russian Law, 1800–1917: A Study in Tsarist Economic Policy (Cambridge, Mass., 2002).

32
Rajan, Raghuram., and Luigi Zingales, “The Great Reversals: The Politics of Financial Development in the Twentieth Century,” Journal of Financial Economics 69 (1) 2003: 5-50.
Ritter, Jay R., “Economic Growth and Equity Returns,” Journal of Financial Economics 13 (1) 2005: 489-503.
Shimizu, Takashi., “Organizations, Corporations and Shareholders: An Organizational Analysis of the Legal Structure of Business Entities,” Tokyo University Working Paper, 2012.
Shishido, Zenichi, “Reform in Japanese Corporate Law and Corporate Governance: Current Changes in Historical Perspective,” The American Journal of Comparative Law 49 2001: 653-678.
Tang, John P., “Technological Leadership and Late Development: Evidence from Meiji Japan, 1868-1912,” Economic History Review, 64 (S1) 2011: 99-116.
Westney, Eleanor., Imitation and Innovation: The Transfer of Western Organizational Patterns to Meiji Japan (Cambridge, Mass., 1987).
Tabl
e 1.
Mai
n D
etai
ls o
f Org
aniz
atio
nal F
orm
s
N
otes
: Det
ails
com
pile
d fr
om v
ario
us e
ditio
ns o
f th
e R
epor
t of
the
Uni
ted
Stat
es I
ndus
tria
l C
omm
issi
on (
Was
hing
ton,
D.C
.) an
d ed
ition
s of
the
jour
nal
Inte
rnat
iona
l L
aw N
otes
: A
Qua
rter
ly B
ulle
tin
of M
atte
rs o
f In
tere
st t
o In
tern
atio
nal
Law
yers
. Th
e m
inim
um c
apita
l re
quire
men
t fo
r Y
ugen
Kai
sha
was
cha
nged
to ¥
100,
000
in 1
951
and
¥3 m
illio
n in
199
0.
Mai
n At
tribu
tes
Gou
mei
Kai
sha
Unl
imite
d P
artn
ersh
ip
- 2 o
r mor
e pa
rtner
s- P
artn
ers
resp
onsi
ble
for t
he d
ebts
of t
he fi
rm- R
etiri
ng p
artn
ers
resp
onsi
ble
for d
ebts
of f
irm fo
r 2 y
ears
afte
r the
ir re
sign
atio
n- A
ny p
artn
er m
ay re
sign
at t
he e
nd o
f the
yea
r on
givi
ng 6
mon
ths
notic
e - P
artn
er c
an n
ot c
arry
on
a bu
sine
ss o
f the
sam
e ki
nd in
depe
nden
tly, o
r be
a pa
rtner
in a
rela
ted
partn
ersh
ip w
ithou
t con
sent
- No
stat
utor
y au
dito
r- R
egis
tratio
n re
quire
d
Gou
shi K
aish
aLi
mite
d Pa
rtner
ship
- 1 o
r mor
e pa
rtner
s w
ith u
nlim
ited
liabi
lity (a
ctive
in m
anag
emen
t)- 1
or m
ore
with
lim
ited
liabi
lity
(sile
nt in
man
agem
ent)
- Act
ive
partn
ers
have
sam
e re
spon
sibi
litie
s as
in u
nlim
ited
partn
ersh
ips
- Sile
nt p
artn
ers
can
enga
ge in
rela
ted
busi
ness
es- N
o st
atut
ory
audi
tor
- Reg
istra
tion
requ
ired
Kab
ushi
ki K
aish
aJo
int S
tock
- For
med
by
a m
inim
um o
f 7 m
embe
rs- S
ingl
e bo
ard
of d
irect
ors;
min
imum
of 3
dire
ctor
s re
quire
d- T
ypic
ally
maj
ority
vot
ing
with
one
vot
e pe
r sha
re- A
nnua
l gen
eral
mee
ting;
hol
ders
of a
t lea
st 1
0 pe
rcen
t of t
he c
apita
l can
requ
est a
n ex
traor
dina
ry g
ener
al m
eetin
g- S
tatu
tory
aud
itor
- Reg
istra
tion
requ
ired
Yug
en K
aish
aP
rivat
e Li
mite
d Li
abilit
y
- For
med
by
a m
axim
um o
f 50
mem
bers
- Onl
y 1
dire
ctor
requ
ired
- Res
trict
ions
on
shar
e tra
nsfe
rs; t
o be
mad
e on
ly a
t a g
ener
al m
eetin
g- M
inim
al re
porti
ng re
quire
men
ts- N
o st
atut
ory
audi
tor
- Reg
istra
tion
requ
ired
- Min
imum
cap
ital r
equi
rem
ent o
f ¥10
,000
Type
of E
nter
pris
e

Table 2. Descriptive Statistics
Notes: Monetary values in thousands of real Japanese yen (1939=100). ROE in percent and pertains to the period 1922 to 1939. Standard deviations in square brackets.
Limited Unlimited JointPartnership Partnership Stock
Net Profit 1.06 1.00 24.25[31.81] [29.65] [77.54]
Capital 80.95 82.58 451.95[1324.10] [341.51] [876.59]
ROE -0.86 0.21 3.62[9.71] [10.97] [8.73]
Tabl
e 3.
RO
E Es
timat
es
Not
es: D
epen
dent
var
iabl
e is
RO
E. L
imite
d Pa
rtner
ship
and
Unl
imite
d Pa
rtner
ship
are
dum
my
varia
bles
, with
the
refe
renc
e ca
tego
ry b
eing
Joi
nt
Stoc
k. L
ever
age
mea
sure
s th
e av
erag
e ra
tio o
f de
bent
ure
debt
to
capi
tal
and
Cap
ital
mea
sure
s th
e av
erag
e ca
pita
l of
ent
erpr
ises
. A
uni
t of
ob
serv
atio
n is
at t
he le
vel o
f leg
al fo
rm, b
y in
dust
ry, b
y pr
efec
ture
, by
year
. Sta
ndar
d er
rors
in s
quar
e br
acke
ts a
re c
lust
ered
by
pref
ectu
re: *
**p
< 0.
01, *
*p <
0.0
5, *
p <
0.1.
(1)
(2)
(3)
(4)
(5)
(6)
(7)
(8)
(9)
(10)
(11)
Exc
ludi
ng
Kan
to a
nd
Kin
ki19
22-1
932
1933
-193
9
Lim
ited
Partn
ersh
ip-4
.48*
**-4
.61*
**-5
.05*
**-5
.04*
**-0
.67
-0.4
8-2
.00*
**-2
.07*
**-2
.86*
**-2
.50*
**-1
.55*
[0.3
7][0
.39]
[0.3
5][0
.34]
[0.6
9][0
.72]
[0.6
5][0
.67]
[0.9
0][0
.91]
[0.9
2]Un
limite
d P
artn
ersh
ip-3
.41*
**-3
.51*
**-4
.32*
**-4
.36*
**-0
.45
-0.3
0-1
.94*
**-2
.00*
**-2
.16*
*-2
.74*
**-0
.98
[0.4
4][0
.46]
[0.4
3][0
.44]
[0.7
0][0
.73]
[0.6
7][0
.65]
[0.8
5][0
.94]
[0.7
1]Le
vera
ge3.
85**
*3.
89**
*1.
47**
*1.
54**
*0.
821.
92**
*0.
79[0
.64]
[0.6
5][0
.54]
[0.5
1][0
.67]
[0.6
2][0
.66]
Log(
Cap
ital)
1.41
***
1.54
***
1.19
***
1.15
***
0.86
**1.
16**
*1.
12**
*[0
.25]
[0.2
5][0
.21]
[0.2
3][0
.35]
[0.3
3][0
.29]
Obs
erva
tions
9,62
49,
624
9,62
49,
624
9,62
49,
624
9,62
49,
624
6,65
85,
620
4,00
4C
lust
ers
4747
4747
4747
4747
3347
47R
-sq
(adj
)0.
040.
070.
120.
140.
070.
10.
140.
150.
160.
130.
24F-
test
72.9
75.1
83.0
79.7
71.7
63.2
64.1
66.8
99.7
44.7
59.3
Mea
n D
epen
dent
Var
iabl
e1.
211.
211.
211.
211.
211.
211.
211.
211.
330.
312.
48St
. Dev
. Dep
ende
nt V
aria
ble
9.91
9.91
9.91
9.91
9.91
9.91
9.91
9.91
9.59
11.2
87.
4
Pref
ectu
re F
.E.
NN
NY
NN
NY
YY
YIn
dust
ry F
.E.
NN
YY
NN
YY
YY
YYe
ar F
.E.
NY
YY
NY
YY
YY
Y
All
Pre
fect
ures

Tabl
e 4.
Dis
aggr
egat
ed R
OE
Estim
ates
A. P
rofit
able
Ent
erpr
ises
N
otes
: Dep
ende
nt v
aria
ble
is R
OE
whe
re th
e nu
mer
ator
is re
stric
ted
to o
nly
prof
itabl
e en
terp
rises
. Lim
ited
Partn
ersh
ip a
nd U
nlim
ited
Partn
ersh
ip
are
dum
my
varia
bles
, with
the
refe
renc
e ca
tego
ry b
eing
Joi
nt S
tock
. Lev
erag
e m
easu
res
the
aver
age
ratio
of d
eben
ture
deb
t to
capi
tal a
nd C
apita
l m
easu
res
the
aver
age
capi
tal o
f ent
erpr
ises
. A u
nit o
f obs
erva
tion
is a
t the
leve
l of l
egal
form
by
indu
stry
by
pref
ectu
re b
y ye
ar. S
tand
ard
erro
rs in
sq
uare
bra
cket
s are
clu
ster
ed b
y pr
efec
ture
: ***
p <
0.01
, **p
< 0
.05,
*p
< 0.
1.
(1)
(2)
(3)
(4)
(5)
(6)
(7)
(8)
(9)
(10)
(11)
Exc
ludi
ng
Kan
to a
nd
Kin
ki19
22-1
932
1933
-193
9
Lim
ited
Partn
ersh
ip-2
.18*
**-2
.05*
**-2
.14*
**-2
.12*
**-1
.17*
*-0
.83*
-1.7
1***
-2.4
5***
-3.0
6***
-3.3
4***
-0.9
9[0
.23]
[0.2
4][0
.20]
[0.2
0][0
.47]
[0.4
8][0
.48]
[0.5
7][0
.88]
[0.7
1][0
.84]
Unlim
ited
Par
tner
ship
-1.8
7***
-1.7
2***
-1.9
5***
-1.9
3***
-1.0
4**
-0.7
2-1
.55*
**-2
.09*
**-2
.49*
**-2
.82*
**-0
.89
[0.2
7][0
.28]
[0.2
2][0
.21]
[0.4
5][0
.46]
[0.4
3][0
.48]
[0.7
2][0
.58]
[0.6
4]Le
vera
ge2.
66**
*3.
26**
*2.
40**
*2.
55**
*1.
97**
*3.
09**
*1.
65**
*[0
.53]
[0.6
4][0
.59]
[0.4
7][0
.49]
[0.6
1][0
.46]
Log(
Cap
ital)
0.31
**0.
37**
0.07
-0.2
5-0
.53
-0.6
5**
0.34
[0.1
4][0
.15]
[0.1
6][0
.20]
[0.3
3][0
.27]
[0.2
6]
Obs
erva
tions
9,62
49,
624
9,62
49,
624
9,62
49,
624
9,62
49,
624
6,65
85,
620
4,00
4C
lust
ers
4747
4747
4747
4747
3347
47R
-sq
(adj
)0.
040.
100.
160.
200.
050.
120.
170.
200.
180.
190.
27F-
test
47.2
72.4
93.0
84.2
47.3
74.4
96.4
83.9
97.7
87.7
39.1
Mea
n D
epen
dent
Var
iabl
e5.
295.
295.
295.
295.
295.
295.
295.
295.
335.
544.
94St
. Dev
. Dep
ende
nt V
aria
ble
5.28
5.28
5.28
5.28
5.28
5.28
5.28
5.28
5.37
5.71
4.58
Pref
ectu
re F
.E.
NN
NY
NN
NY
YY
YIn
dust
ry F
.E.
NN
YY
NN
YY
YY
YYe
ar F
.E.
NY
YY
NY
YY
YY
Y
All
Pre
fect
ures

B. U
npro
fitab
le E
nter
pris
es
Not
es:
Dep
ende
nt v
aria
ble
is R
OE
whe
re t
he n
umer
ator
is
rest
ricte
d to
onl
y un
prof
itabl
e en
terp
rises
. Li
mite
d Pa
rtner
ship
and
Unl
imite
d Pa
rtner
ship
are
dum
my
varia
bles
, with
the
refe
renc
e ca
tego
ry b
eing
Joi
nt S
tock
. Lev
erag
e m
easu
res
the
aver
age
ratio
of d
eben
ture
deb
t to
capi
tal
and
Cap
ital
mea
sure
s th
e av
erag
e ca
pita
l of
ente
rpris
es. A
uni
t of
obs
erva
tion
is a
t th
e le
vel o
f le
gal f
orm
by
indu
stry
by
pref
ectu
re b
y ye
ar.
Stan
dard
err
ors i
n sq
uare
bra
cket
s are
clu
ster
ed b
y pr
efec
ture
: ***
p <
0.01
, **p
< 0
.05,
*p
< 0.
1.
(1)
(2)
(3)
(4)
(5)
(6)
(7)
(8)
(9)
(10)
(11)
Exc
ludi
ng
Kan
to a
nd
Kin
ki19
22-1
932
1933
-193
9
Lim
ited
Partn
ersh
ip-2
.30*
**-2
.56*
**-2
.91*
**-2
.92*
**0.
500.
35-0
.29
0.37
0.20
0.84
-0.5
6*[0
.27]
[0.2
7][0
.26]
[0.2
5][0
.50]
[0.4
9][0
.50]
[0.3
7][0
.39]
[0.5
2][0
.33]
Unlim
ited
Par
tner
ship
-1.5
5***
-1.7
8***
-2.3
6***
-2.4
3***
0.59
0.42
-0.3
90.
090.
330.
08-0
.09
[0.3
3][0
.33]
[0.3
4][0
.34]
[0.5
5][0
.55]
[0.5
8][0
.42]
[0.3
7][0
.66]
[0.2
3]Le
vera
ge1.
19**
*0.
63**
-0.9
4*-1
.01*
-1.1
4-1
.17
-0.8
6*[0
.26]
[0.3
1][0
.53]
[0.5
6][0
.74]
[0.7
8][0
.45]
Log(
Cap
ital)
1.10
***
1.17
***
1.12
***
1.39
***
1.38
***
1.81
***
0.78
***
[0.2
1][0
.20]
[0.1
9][0
.14]
[0.1
8][0
.20]
[0.1
2]
Obs
erva
tions
9,62
49,
624
9,62
49,
624
9,62
49,
624
9,62
49,
624
6,65
85,
620
4,00
4C
lust
ers
4747
4747
4747
4747
3347
47R
-sq
(adj
)0.
020.
070.
10.
120.
040.
090.
120.
130.
150.
120.
12F-
test
39.0
40.2
50.7
42.5
43.8
34.6
42.0
40.7
51.7
17.4
25.8
Mea
n D
epen
dent
Var
iabl
e-4
.08
-4.0
8-4
.08
-4.0
8-4
.08
-4.0
8-4
.08
-4.0
8-4
.00
-5.2
3-2
.46
St. D
ev. D
epen
dent
Var
iabl
e7.
957.
957.
957.
957.
957.
957.
957.
957.
69.
315.
08
Pref
ectu
re F
.E.
NN
NY
NN
NY
YY
YIn
dust
ry F
.E.
NN
YY
NN
YY
YY
YYe
ar F
.E.
NY
YY
NY
YY
YY
Y
All
Pre
fect
ures
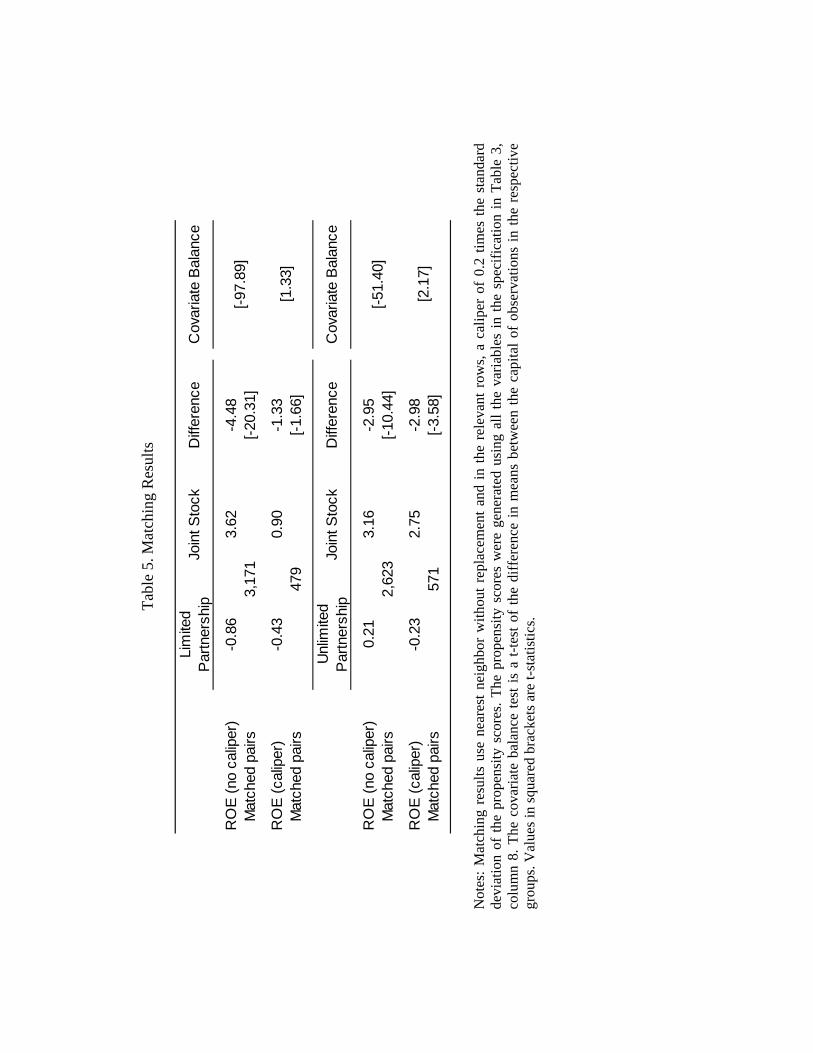
Ta
ble
5. M
atch
ing
Res
ults
Not
es: M
atch
ing
resu
lts u
se n
eare
st n
eigh
bor
with
out r
epla
cem
ent a
nd in
the
rele
vant
row
s, a
calip
er o
f 0.
2 tim
es th
e st
anda
rd
devi
atio
n of
the
prop
ensi
ty s
core
s. Th
e pr
open
sity
sco
res
wer
e ge
nera
ted
usin
g al
l the
var
iabl
es in
the
spec
ifica
tion
in T
able
3,
colu
mn
8. T
he c
ovar
iate
bal
ance
test
is a
t-te
st o
f th
e di
ffer
ence
in m
eans
bet
wee
n th
e ca
pita
l of
obse
rvat
ions
in th
e re
spec
tive
grou
ps. V
alue
s in
squa
red
brac
kets
are
t-st
atis
tics.
Lim
ited
Par
tner
ship
Join
t Sto
ckD
iffer
ence
Cov
aria
te B
alan
ce
RO
E (n
o ca
liper
)-0
.86
3.62
-4.4
8M
atch
ed p
airs
[-20.
31]
RO
E (c
alip
er)
-0.4
30.
90-1
.33
Mat
ched
pai
rs[-1
.66]
Unl
imite
d P
artn
ersh
ipJo
int S
tock
Diff
eren
ceC
ovar
iate
Bal
ance
RO
E (n
o ca
liper
)0.
213.
16-2
.95
Mat
ched
pai
rs[-1
0.44
]
RO
E (c
alip
er)
-0.2
32.
75-2
.98
Mat
ched
pai
rs[-3
.58]
[-97.
89]
[1.3
3]
[-51.
40]
[2.1
7]57
1
479
3,17
1
2,62
3
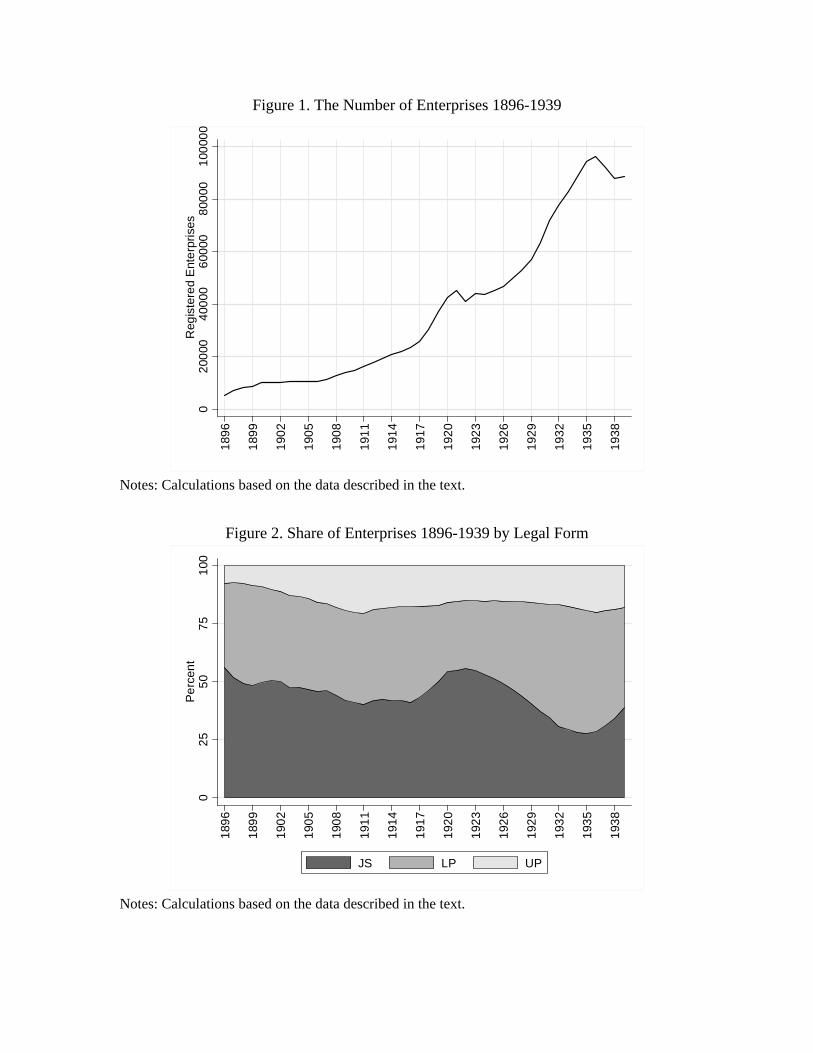
Figure 1. The Number of Enterprises 1896-1939
Notes: Calculations based on the data described in the text.
Figure 2. Share of Enterprises 1896-1939 by Legal Form
Notes: Calculations based on the data described in the text.
020
000
4000
060
000
8000
010
0000
Reg
iste
red
Ent
erpr
ises
1896
1899
1902
1905
1908
1911
1914
1917
1920
1923
1926
1929
1932
1935
1938
025
5075
100
Perc
ent
1896
1899
1902
1905
1908
1911
1914
1917
1920
1923
1926
1929
1932
1935
1938
JS LP UP
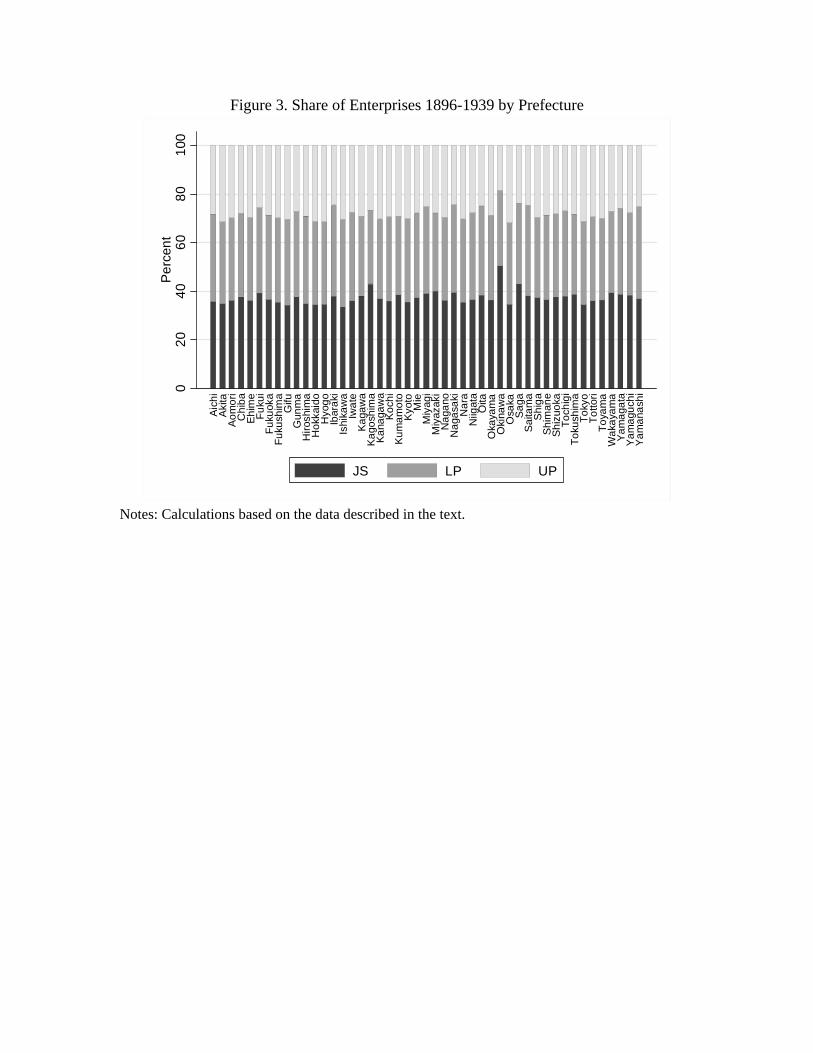
Figure 3. Share of Enterprises 1896-1939 by Prefecture
Notes: Calculations based on the data described in the text.
020
4060
8010
0P
erce
nt
Aic
hiA
kita
Aom
ori
Chi
baE
him
eFu
kui
Fuku
oka
Fuku
shim
aG
ifuG
unm
aH
irosh
ima
Hok
kaid
oH
yogo
Ibar
aki
Ishi
kaw
aIw
ate
Kag
awa
Kag
oshi
ma
Kan
agaw
aK
ochi
Kum
amot
oK
yoto
Mie
Miy
agi
Miy
azak
iN
agan
oN
agas
aki
Nar
aN
iigat
aO
itaO
kaya
ma
Oki
naw
aO
saka
Sag
aS
aita
ma
Shi
gaS
him
ane
Shi
zuok
aTo
chig
iTo
kush
ima
Toky
oTo
ttori
Toya
ma
Wak
ayam
aY
amag
ata
Yam
aguc
hiY
aman
ashi
JS LP UP

Fi
gure
4. S
hare
of E
nter
pris
es 1
896-
1939
by
Indu
stry
Not
es: C
alcu
latio
ns b
ased
on
the
data
des
crib
ed in
the
text
.
0255075100Percent
1896
1899
1902
1905
1908
1911
1914
1917
1920
1923
1926
1929
1932
1935
1938
JSLP
UP
0255075100Percent
1896
1899
1902
1905
1908
1911
1914
1917
1920
1923
1926
1929
1932
1935
1938
JSLP
UP
0255075100Percent
1896
1899
1902
1905
1908
1911
1914
1917
1920
1923
1926
1929
1932
1935
1938
JSLP
UP
0255075100Percent
1896
1899
1902
1905
1908
1911
1914
1917
1920
1923
1926
1929
1932
1935
1938
JSLP
UP
Agr
icul
ture
C
omm
erci
al
Indu
stria
l Tr
ansp
ort
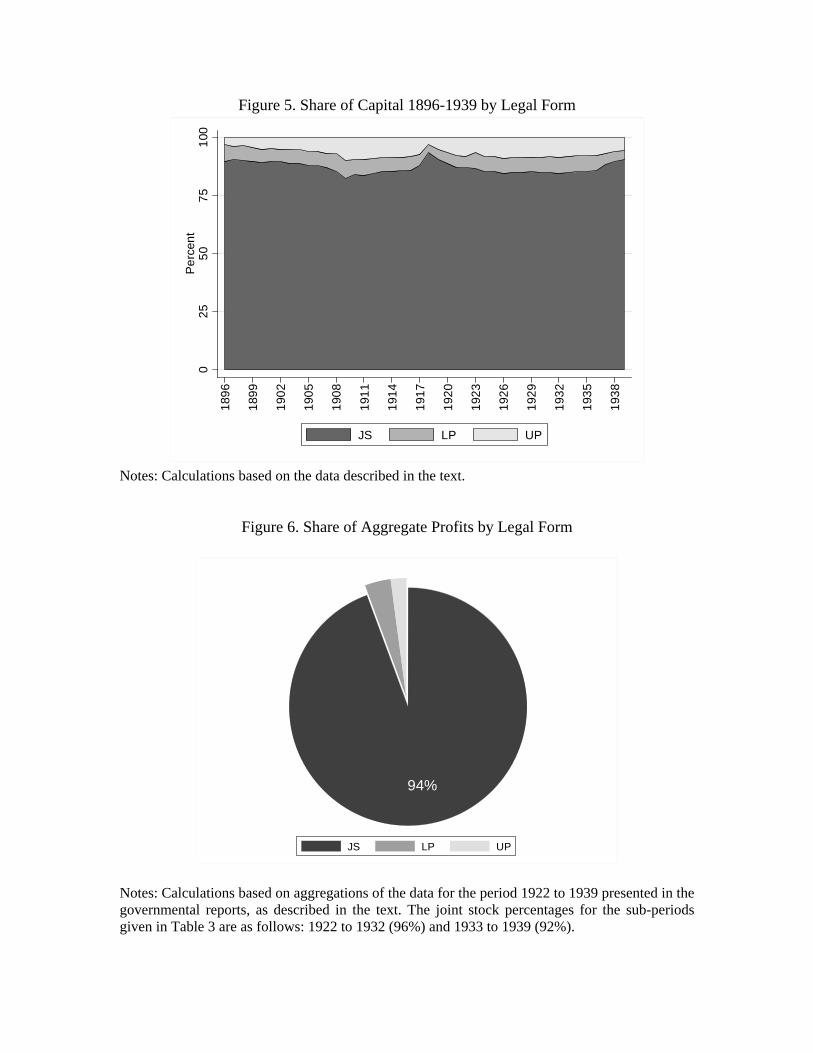
Figure 5. Share of Capital 1896-1939 by Legal Form
Notes: Calculations based on the data described in the text.
Figure 6. Share of Aggregate Profits by Legal Form
Notes: Calculations based on aggregations of the data for the period 1922 to 1939 presented in the governmental reports, as described in the text. The joint stock percentages for the sub-periods given in Table 3 are as follows: 1922 to 1932 (96%) and 1933 to 1939 (92%).
025
5075
100
Per
cent
1896
1899
1902
1905
1908
1911
1914
1917
1920
1923
1926
1929
1932
1935
1938
JS LP UP
94%
JS LP UP
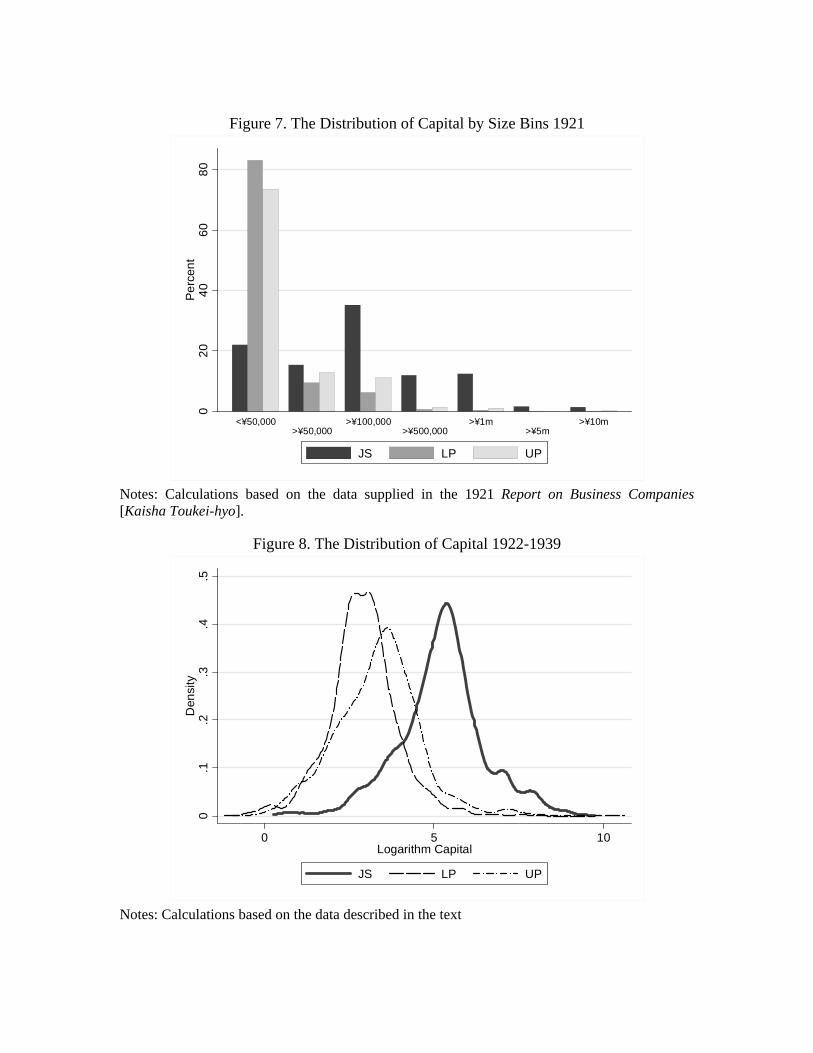
Figure 7. The Distribution of Capital by Size Bins 1921
Notes: Calculations based on the data supplied in the 1921 Report on Business Companies [Kaisha Toukei-hyo].
Figure 8. The Distribution of Capital 1922-1939
Notes: Calculations based on the data described in the text
020
4060
80Pe
rcen
t
<¥50,000>¥50,000
>¥100,000>¥500,000
>¥1m>¥5m
>¥10m
JS LP UP
0.1
.2.3
.4.5
Den
sity
0 5 10Logarithm Capital
JS LP UP

Figure 9. ROE Estimates by Sector
Notes: Estimates derived from the following specification with interaction terms between industries (IND) and Limited Partnership and Unlimited Partnership dummy variables.
fipttpfiptfiptfiptfiptfiptfiptfipt )CAPlog(LEVINDUPINDLPUPLPROE 212121
Figure 10. Share of Enterprises 1940-1995 by Legal Form
Notes: Compiled from statistics reported by Harald Baum and Eiji Takahashi, “Commercial and Corporate Law in Japan,” p. 401 in Wilhelm Röhl, History of Law in Japan Since 1868 (Leiden, 2005). Between 1960 and 1980 no statistics are given so these are linear interpolations.
Agriculture Commercial Fisheries Industrial Mining Transport
-20
-15
-10
-50
5R
OE
Rel
ativ
e to
Joi
nt S
tock
LP UP
025
5075
100
Per
cent
1940
1945
1950
1955
1960
1965
1970
1975
1980
1985
1990
1995
PLLC JS LP UP