the organizational design of high-tech startups and ...ftp.zew.de/pub/zew-docs/dp/dp17074.pdf · 1...
TRANSCRIPT

Dis cus si on Paper No. 17-074
The Organizational Design of High-Tech Startups
and Product InnovationChristoph Grimpe, Martin Murmann,
and Wolfgang Sofka

Dis cus si on Paper No. 17-074
The Organizational Design of High-Tech Startups
and Product InnovationChristoph Grimpe, Martin Murmann,
and Wolfgang Sofka
Download this ZEW Discussion Paper from our ftp server:
http://ftp.zew.de/pub/zew-docs/dp/dp17074.pdf
Die Dis cus si on Pape rs die nen einer mög lichst schnel len Ver brei tung von neue ren For schungs arbei ten des ZEW. Die Bei trä ge lie gen in allei ni ger Ver ant wor tung
der Auto ren und stel len nicht not wen di ger wei se die Mei nung des ZEW dar.
Dis cus si on Papers are inten ded to make results of ZEW research prompt ly avai la ble to other eco no mists in order to encou ra ge dis cus si on and sug gesti ons for revi si ons. The aut hors are sole ly
respon si ble for the con tents which do not neces sa ri ly repre sent the opi ni on of the ZEW.

1
The Organizational Design of High-Tech Startups and Product Innovation
Christoph Grimpe
Copenhagen Business School
Centre for European Economic Research (ZEW) Mannheim
Email: [email protected]
Martin Murmann
Centre for European Economic Research (ZEW) Mannheim
Institute for Employment Research (IAB) Nuremberg
University of Zurich
Email: [email protected]
Wolfgang Sofka
Copenhagen Business School
University of Liverpool Management School
Email: [email protected]
Abstract
We investigate whether appointing a middle management level affects startups’ innovation
performance. Additional hierarchical levels are often suspected to restrict innovative activi-
ties. However, founders’ capacities for information processing and resource allocation are
usually strongly limited while, at the same time, R&D decisions are among the most conse-
quential choices of startups. We argue that middle management is positively related to intro-
ducing product innovations because it improves the success rates from recombining existing
knowledge as well as managing R&D personnel. In addition, we suggest that the effective-
ness of these mechanisms depends on the riskiness of a startup’s business opportunity. Based
on a sample of German high-tech startups, we find support for our conjectures.
Keywords: Middle management, innovation performance, R&D, startups, organizational de-
sign, R&D management

2
I. INTRODUCTION
Launching innovative products onto the market is a central element in the strategies of most
startups in high-technology sectors (Wiklund and Shepherd, 2003). Having discovered an
entrepreneurial opportunity, many startups find themselves in a race to realize that opportuni-
ty and to introduce new products ahead of competitors or before their funding runs out
(Venkataraman, 1997; Shane, 2000). Opportunities are realized when startups decide to act
upon them by deploying resources and investments in the pursuit of perceived opportunities
(Shane and Venkataraman, 2000; Eckardt and Shane, 2003; Shane, 2003). An important part
of this process are decisions on research and development (R&D) activities that are challeng-
ing since technologies and market conditions are by definition novel and uncertain (Amit,
Glosten, and Muller, 1990) while funding sources are limited (Hall, 2005). While we learn
from existing literature how demanding and error prone R&D decisions are for the manage-
ment of established firms (Koput, 1997; Katila, 2002), we know comparatively little about
the management of R&D in startups. Faced with many competing demands for attention, the
burden on startup management, often times the founder or founding team, to evaluate many
technological alternatives and to arrive at the most promising ones is high (Dencker and
Gruber, 2015).
In this study, we investigate whether startups can improve the likelihood for successful
innovation by altering their organizational design through the introduction of a middle man-
agement. We expect a startup’s middle management to allow for better managing competing
demands for attention and processing information related to R&D and technology develop-
ment in order to successfully realize innovation. We draw theoretical mechanisms from the
literature on how middle managers increase a startup’s information processing capacity as
well as free up attention of founders (Colombo and Grilli, 2013) and integrate them into
models of R&D decision making. We reason that startups with middle management will in-

3
crease their innovation performance in general, but also indirectly by re-using existing
knowledge bases of the startup and managing R&D personnel more effectively. Further, we
hypothesize that the latter will be more beneficial for startups with risky business opportuni-
ties while the former effects occur when opportunities are comparatively less risky. We test
our theoretical reasoning using a unique sample of almost 3,700 firm-year observations of
1,708 high-tech startups founded in Germany between 2005 and 2012. The information on
these firms stems from linked employer-employee data that merges firm data from a panel
survey with official register data on the employees who work in these firms. The results
broadly confirm our theoretical expectations.
Our theoretical model addresses a gap in existing literatures that are on the one hand ra-
ther critical of the effects of added hierarchical levels on innovation performance for the av-
erage firm (Burns and Stalker, 1961) but on the other hand recognize the establishment of
middle management as a crucial milestone in the maturing of startups (Colombo and Grilli,
2013). Intuitively, we would associate middle management with a higher level of formaliza-
tion and bureaucracy, a more “mechanistic” and less “organic” organizational structure that
facilitates control and productivity but often stifles creativity and innovation (e.g., Burns and
Stalker, 1961; Thompson, 1965; Dess, Lumpkin, and McKee, 1999; Shane and
Venkataraman, 2000; Ireland, Covin, and Kuratko, 2009; Foss, Lyngsie, and Zahra, 2015).
More recently, however, scholars have begun to argue for the benefits of formal structure to
realize opportunities. Ireland and Webb (2009) suggest that centralization allows unambigu-
ous resource allocation decisions and facilitates monitoring and control. Foss et al. (2015)
find that both decentralization and formalization help opportunity discovery and realization.
Yet most research in this area assumes an established firm while scant attention has been paid
to organizational structure in startups. Moreover, while Sine, Mitsuhashi and Kirsch (2006)
show that startups with higher founding team formalization, specialization, and administra-

4
tive intensity perform better than those with more organic structures, we know little about the
relationship between organizational structure and innovation, a central outcome of opportuni-
ty realization.
In that sense, we advance existing literature in two important ways. First, entrepreneur-
ship literature has largely acknowledged that startups adjust their organizational design while
they mature (Baron, Burton, and Hannan, 1999; Colombo and Grilli, 2013) through a process
of professionalization (Hellmann and Puri, 2002). However, we know comparatively little
about how these changes in organizational design affect their innovation performance, argua-
bly a core strategic goal of most high-tech startups. Our theoretical model introduces infor-
mation processing and monitoring mechanisms from existing middle management literature
into models of R&D decision making, thereby providing a basis for future theorizing. What is
more, existing literature that investigates innovation outcomes of high-tech startups but ig-
nores its organizational design, particularly the presence of an additional hierarchical level, is
likely to suffer from biased results.
Second, an active stream in the strategic entrepreneurship literature focusses on how the
internal organization of startups interacts with industry characteristics such as the business
opportunities in an industry. These theoretical models largely equate the management capaci-
ty of a startup with its founder. Prior knowledge and experience of founders are assumed to
be the primary source of success for startups and these effects are contingent on the startups’
business opportunity (e.g., Dencker and Gruber, 2015). We extend this contingency perspec-
tive to the organizational design choices of a startup by arguing that (a) a startup’s capacity
for R&D decision making is not limited to its founder but can be extended through middle
management and (b) the positive effects of these organizational design choices are contingent
on the startup’s business opportunity. Our theoretical model can be a pathway for future theo-

5
rizing on how the effectiveness of other organizational design choices of startups (apart from
middle management) is contingent on their business opportunities.
These academic insights have immediate implications for decision making in startups.
Our results provide evidence for how the establishment of a middle management level in-
creases the odds for innovation success in high-tech startups. This evidence can alleviate con-
cerns among startup founders and/or owners about whether the introduction of a middle man-
agement makes startups more bureaucratic and less innovative. Our results show the opposite.
These insights are also valuable to investors, consultants or government agencies advising
high-tech startups. We show that the innovativeness of a high-tech startup is not merely a
function of its technological decisions but also whether it puts an organization design in place
that increases the management capacities for making these decisions.
II. THEORY AND HYPOTHESES
Innovation opportunities and decision making
New technologies have long been characterized as a basis for the creation of new products,
new processes, new markets, or new ways of organizing (Schumpeter, 1934), and entrepre-
neurs must discover and identify opportunities in which such new technologies could be used
(e.g., Venkataraman, 1997; Shane, 2000; Dencker and Gruber, 2015). Opportunities are real-
ized when entrepreneurs decide to act upon them through a process of resource acquisition
and organization (Shane, 2003). As a consequence, opportunity realization in entrepreneurial
ventures depends often times on the founder or founding team and the decision to engage in
identified opportunities. Following previous studies, we will refer to the founder(s) as the
startup’s highest management level making these strategic decisions (e.g. Dencker and
Gruber, 2015), given that very few startups hire professional top managers early in their life

6
cycle. Our terminology assumes that the hierarchical level below the founders (i.e. top man-
agement) is the middle management.
Our theoretical reasoning is concerned with the realization of innovation opportunities.
In other words, we predict the likelihood with which startups manage to introduce product
innovations built from new technologies or the recombination of existing ones. The introduc-
tion of new products allows firms to alter current patterns of competition and cooperation,
facilitate market entry, and gain market share based on a superior offering compared to in-
cumbent firms (Venkataraman, 1997; Wiklund and Shepherd, 2003). However, the realiza-
tion of such opportunities puts considerable demands on decision makers because invest-
ments in R&D have to be made, forcing deciders in startups to dedicate attention to the re-
combination of existing resources and the acquisition of new ones.
While successful product innovations create important benefits for startups, making the
necessary investment decisions is challenging for two primary reasons. First, the outcomes of
investments in R&D are uncertain (Amit et al., 1990). On the technological side, experimen-
tation with novel or untested materials and procedures is by nature error prone and likely to
fail. Even technologically feasible solutions often fail commercially due to a lack of customer
acceptance (Gourville, 2006). Second, large parts of R&D expenditures consist of salaries for
scientists and engineers or investments in specialized, non-fungible laboratories (Hall, 2005).
Accordingly, firms are constrained in the available financing for R&D to equity capital or
cash flows since external lenders find it difficult to finance uncertain investments with little
collateral. Decision making in innovation activities is therefore particularly crucial for new
ventures lacking the internal funds for sustaining innovation failures.
Decision making in innovation activities can be conceptualized as a search process in
which firms make heterogeneous decisions about which technologies to select or combine
(Katila and Ahuja, 2002). Some of these choices lead to higher innovation performance than

7
others. The quality of these technology choices depends on the amount of attention that a firm
can devote to screening potential alternatives (Koput, 1997). A lack of attention results in
erroneous technology choices, missing out on important trends or spreading existing screen-
ing capacities too thinly. Management attention has often been described as one of the most
important resources of the firm (Ocasio, 1997), but startups, in particular, are challenged to
commit sufficient attention to realizing innovation opportunities.
Hypotheses
Startup decision making is typically dominated by the founders whose decisions have vital
influence on the firm (Wasserman, 2012). As a consequence, prior literature has extensively
studied the role of founder knowledge and experience in facilitating the recognition of entre-
preneurial opportunities and startup performance (e.g., Shane, 2000, 2003; Dencker and
Gruber, 2015). Since founder decision making is not only concerned with the startup’s inno-
vation domain but encompasses all kinds of related and unrelated activities that are crucial for
the survival of the firm, it is likely that capacity constraints impede the recognition and ex-
ploitation of innovation opportunities. We reason that startups can alleviate capacity con-
straints of the founders and facilitate innovation through organizational design choices. Or-
ganizational structure, in that sense, allocates the authority to make decisions, to deploy re-
sources, and to select the opportunities to pursue (e.g., Galbraith, 1977). Specifically, we ar-
gue that startups with a middle management possess higher information processing capacities
compared to startups without such a hierarchical level, leading to better opportunity recogni-
tion and realization.
The term middle management originates from the perspective that firms consist of at
least two levels, i.e. a top management and line workers (Rajan and Wulf, 2003). The typical
startup starts with these two levels, and the introduction of a hierarchical level in between, i.e.
the middle management, constitutes a major organizational design change (Colombo and

8
Grilli, 2013). Middle managers are managerial or administrative specialists with delegated
decision rights (Baron et al., 1999). They can reduce the ambiguity about the organization of
work in a firm and thereby improve coordination and efficiency (Sine et al., 2006).
Since all individuals are naturally limited in their capacity to acquire, store, process and
transmit information (Simon, 1948), the establishment of a middle-management level can
improve the information processing capacity of startups (Colombo and Grilli, 2013). The
middle management of an organization allows it to handle a given amount of information
more efficiently by enabling parallel information processing in which middle managers share
information processing tasks with top management (Radner, 1993).
Besides, the establishment of a middle management level allows firms to use existing in-
formation processing capacities more efficiently. Garicano (2000) conceptualizes the hierar-
chical decision making in firms based on the knowledge that is available to each employee
for solving problems. Organizational hierarchies emerge because some employees are better
equipped than others to deal with particularly hard problems. Line workers can deal with reg-
ular problems based on their own knowledge and turn to middle managers for increasingly
exceptional or difficult problems. Middle managers turn to top management only if their
knowledge is insufficient to deal with a particular problem. Hence, a middle management
level frees up top management to focus on the most challenging problems of the organization.
Moreover, middle management allows an organization to predict more accurately when
problems or projects have reached a scope that benefit from organization-wide solutions
(Harris and Raviv, 2002). The latter are most effectively addressed by top management since
they have the broadest set of knowledge about the organization while lower level projects or
problems do not require top management attention. In sum, middle management increases the
information processing capacity of startups by enabling parallel processing and allowing de-

9
cision making of its founders to focus on strategic and higher-value decisions while other
decisions can be delegated to middle managers.
We conjecture that the improvement in startup’s information processing capacity from
introducing middle managers can be extended to improving decision making in R&D. R&D
decisions are particularly complex and uncertain, requiring management attention and thor-
ough decision making. Middle managers allow founders to specialize in solving more strate-
gic problems and to use their skills and competences more productively. Since innovation is a
domain of strategic importance for successfully entering markets and gaining market share,
middle management is therefore likely to improve a startup’s ability to innovate and position
its offering vis-à-vis the incumbents in the market. As a result, our first hypothesis reads:
Hypothesis 1: Startups with middle management are more likely to introduce
product innovations.
Existing literature has frequently highlighted that startups are differentially endowed with
resources upon market entry, including prior technological knowledge, invested capital, or
managerial, entrepreneurial and industry experience of the founder (e.g., Shane, 2000;
Dencker and Gruber, 2015). We focus on a startup’s prior technological knowledge base be-
cause the recombination of existing knowledge is a central determinant of a firm’s ability to
innovate (Rosenkopf and Nerkar, 2001; Katila and Ahuja, 2002). We suggest that startups
with a middle management will be more effective in recombining existing knowledge.
Literature describing innovation performance based on the re-use of a firm’s existing
technologies (i.e. deep search) summarizes its advantages across the dimensions of reliability,
predictability and efficiency (Katila and Ahuja, 2002). We reason that new ventures with
middle management will experience advantages across all three dimensions. First, the added
information-processing capacity decreases the likelihood of errors and false starts when using
the same knowledge elements repeatedly so that search becomes more reliable (Levinthal and

10
March, 1993). Second, middle management can be assumed to render the startup’s search
more predictable because it enables a better understanding of the requirements that need to be
met for successful innovation. Higher information processing capacity facilitates an under-
standing of how product development tasks can be decomposed into manageable sub-
problems, how recombination activities should be sequenced, and what elements are unnec-
essary and can thus be disregarded. Third, middle management allows for a deeper under-
standing of the existing knowledge base which increases a startup’s ability to identify valua-
ble knowledge elements that may not have been obvious to the founder. In sum, our second
hypothesis reads:
Hypothesis 2: Startups with middle management are more likely to introduce
product innovations, and this likelihood increases with the size of the startup’s ex-
isting knowledge base.
Apart from the positive influence of middle management on a startup’s ability to recombine
existing knowledge, we argue that middle management can further influence current
knowledge production by reducing the span of control for a startup’s employees. Tighter
spans of control imply that the plans of an organization can be implemented more quickly if
workers receive instructions from their managers more effectively (Keren and Levhari,
1979). These theoretical models rest on the assumption that the goals and incentives of the
owners and the employees of a firm differ, requiring monitoring or incentive alignments to
overcome principal-agent problems from employees following their self-interests (Calvo and
Wellisz, 1978; Qian, 1994).
Jensen and Meckling (1995) suggest that the agency problems are especially pronounced
when employees possess specific knowledge that is difficult to transfer. The R&D activities
of startups create such conditions. Given that R&D evolves around experimentation with
novel and untested procedures and materials, it is difficult to codify and monitor. Many R&D

11
outcomes occur as tacit knowledge in the understanding of R&D personnel and would be
costly to codify comprehensively (Agrawal, Cockburn, and McHale, 2006). Besides, the
knowledge from failed experiments is rarely codified but may be as valuable for eventually
identifying promising R&D trajectories.
The motivations of scientists and engineers for their work have also been found to differ
from the goals of their firms (Gambardella, Ganco, and Honoré, 2015): R&D decisions of
individuals can be driven by curiosity, an interest in learning about or confidence in particular
technologies. This can lead to biased decision making of R&D personnel. One of the best
documented biases of R&D personnel is the systematic negative bias about the quality or
usability of knowledge from external sources (“not invented here syndrome”) (Katz and
Allen, 1982; Antons and Piller, 2015). In the absence of a middle management, it falls on the
startup’s founders to monitor the technological choices of its R&D personnel and ascertain
that these choices are aligned with the overall goals of the startup. We reason that middle
managers can share this management task either by supervising R&D personnel directly or
freeing up founder capacities from monitoring other startup activities.
We acknowledge that hierarchical layers can constrain the information flow between
knowledge production and top management of organizations since the transfer of information
rests on aggregation with potential losses of important details (Keren and Levhari, 1989;
Stein, 2002). However, we suggest that on balance middle management will be particularly
helpful for effectively managing R&D personnel because it can provide direction, set priori-
ties and correct mistakes. Based on the added monitoring capacity, market opportunities can
be more reliably identified and evaluated so that R&D personnel can be focused on them.
Monitoring by middle management allows for the targeted provision of resources in order to
increase the likelihood of innovations. As a consequence, our third hypothesis reads as fol-
lows:

12
Hypothesis 3: Startups with middle management are more likely to introduce
product innovations, and this likelihood increases with the size of the startup’s
R&D personnel.
Finally, Dencker and Gruber (2015) shed light on the business opportunity itself that a startup
seeks to exploit and suggest that its riskiness will not only directly influence firm perfor-
mance but also condition the role of the founder’s industry and managerial experience. Miller
(1992, 1993) relates the risk of a business to the dynamics of its environment, e.g. changes in
input prices, competitor behavior, etc. On the one hand, such risks increase the odds of a
startup’s failure (Miller, 1992). On the other hand, riskier businesses enable startups to find
dissatisfied customers or niche markets that are not served by incumbent firms (Wiklund and
Shepherd, 2003). Dencker and Gruber (2015), based on the intuitive assumption of a positive
risk-return relationship, find that riskier opportunities are associated with greater startup per-
formance above and beyond the characteristics of the founder. Accordingly, we reason that
the benefits that middle managers bring to the management of prior knowledge and R&D in
startups are conditioned by the riskiness of a startup’s business opportunity.
Risky business opportunities affect the R&D decision making of startups in two ways.
First, they aggravate the consequences of failing innovations, e.g. due to a lack of reliability
or desired functionality, for the startup. Startups with risky business opportunities may not
have the financial resources and goodwill from customers, investors or suppliers to sustain a
failed innovation. Accordingly, screening technologies and predicting success rates requires
comparatively more attention from founders. Second, risky business opportunities imply that
the technological and market demands for successful innovation are comparatively less pre-
dictable. Hence, they benefit from increasingly intense testing and adapting. The latter re-
quires more intensive management of current R&D activities. In sum, risky business oppor-
tunities tax the attention of founders especially with decision making in current R&D activi-

13
ties. As a consequence, startups with risky business opportunities are also particularly likely
to experience positive effects from middle management in directing current R&D activities
and personnel. We propose:
Hypothesis 4a: Startups with middle management are more likely to introduce
product innovations, and the effect of middle management on the startup’s R&D
personnel is stronger for risky business opportunities.
Conversely, startups with comparatively less risky business opportunities benefit from more
predictable environments. Technological and market conditions can be analyzed more relia-
bly, creating opportunities for exploiting existing technologies. Within such settings, the ben-
efit from involving middle management emerges from increased information processing ca-
pacities for identifying unrealized market potentials of existing technologies. We predict:
Hypothesis 4b: Startups with middle management are more likely to introduce
product innovations, and the effect of middle management on the prior knowledge
base is stronger for comparatively less risky business opportunities.
III. DATA AND METHODS
Data
We construct a dedicated dataset combining multiple data sources to test our hypotheses. It
rests on a linked employer-employee panel dataset that matches firm-level data from the
KfW/ZEW Startup Panel with the official employment statistics provided by the German
Federal Employment Agency. The KfW/ZEW Startup Panel is a survey of German startups
of the cohorts 2005-2012. It was established in 2008 as a joint project of the Centre for Euro-
pean Economic Research (ZEW), the KfW Bankengruppe (Germany’s and the world’s larg-
est state-owned promotional bank), and Creditreform (Germany’s largest credit rating agen-
cy). The KfW/ZEW Startup Panel is a stratified random sample of legally independent new

14
ventures drawn from the Mannheim Enterprise Panel (Mannheimer Unternehmenspanel -
MUP). The MUP contains basic information such as addresses, year of startup, sector of ac-
tivity, and legal form, for almost all German firms (see Bersch et al., 2014, for a detailed de-
scription). The sample of the KfW/ZEW Startup Panel is drawn from almost all sectors of the
MUP population (the primary sector, the energy sector, and the public sector are not includ-
ed) and stratified according to three criteria: (i) the year of a firm’s formation, (ii) the indus-
try, and (iii) whether or not a firm has received financial support from KfW. Stratification is
controlled for by including dummy variables for the stratification cells in all regressions.
When drawn into the sample firms are allowed to be not older than three years. Subsidi-
ary businesses and ventures that resulted from merger activities are excluded. Startups that
participate once in the survey are subsequently followed for up to seven successive years (i.e.
until they are eight years old. See Fryges, Gottschalk, and Kohn, 2010, for a detailed descrip-
tion). Data are collected using computer-assisted telephone interviews. In the present study,
the survey data provide information about the founders’ characteristics (i.e. educational
background and managerial and entrepreneurial leadership experience) and venture character-
istics (including innovation and R&D activities).
We match the firm-level information with employee-level information from the official
employment statistics provided by the Federal Employment Agency. The employment statis-
tics contain person-specific register data on all employees subject to social security contribu-
tions in Germany.1 This dataset is a rich source of employee records and allows us, most im-
portantly, to identify middle managers and R&D personnel based on occupation codes (see
1 In addition to regular full-time and part-time employees, this includes apprentices, interns, and marginally
employed personnel. All notifications on employment and unemployment spells of an individual can be
linked with the aid of a unique person-specific identifier thereby obtaining the complete employment histo-
ry of each employee. A further identifier makes it possible to match the employees to establishments. The
data are reported by the employing establishment and are collected by the social security agencies. Report-
ing data about the employees is mandatory for the employing establishments in order to calculate the con-
tributions to the social security system.

15
variable description below). Moreover, the employment statistics also provide details regard-
ing further employee characteristics for the purpose of the present study.
As there is no common identifier in the two data sets, we matched startups from the
KfW/ZEW Startup Panel using a text search algorithm via startup names and addresses. The
text search algorithm is described in detail in the Appendix B of Czarnitzki et al. (2015) and
has proven to deliver very reliable results in various settings.
We were able to match about 90% of the startups from the KfW/ZEW-Startup Panel that
self- reported to have employees who are subject to social security contributions (during a
telephone interview) with one or more establishments from the official employment statistics.
Firms that self-reported to have employees subject to social security contributions, but which
were not found in the official employment statistics, were removed from the sample. In addi-
tion, we adjusted for the possibility of incorrect matches or erroneous data in either dataset by
excluding matches in the 1st and 100th percentiles of the difference between employment
sizes reported during telephone interviews and to the social security agencies. To assess the
quality of the matches in the resulting firm-year panel dataset, we calculated the correlation
coefficient between the numbers of employees reported in the KfW/ZEW-Startup Panel and
the numbers of employees reported in the official employment statistics. The correlation is
slightly above 0.95 which makes us confident that the matching procedure led to reliable re-
sults.
We obtain information from 3,407 startups that operate in knowledge-intensive indus-
tries and have at least one employee.2 Because we apply a one year time lag between inde-
pendent and dependent variables (see details below), we are able to draw on 3,699 observa-
tions from 1,708 startups in the panel dataset that we use for estimations.
2 “Knowledge-intensive industries” include “cutting-edge” and high-technology manufacturing, technology-
intensive services, software supply and consultancy, and skill-intensive services in line with Fryges et al.
(2010).

16
Variables
Dependent variable
Our hypotheses predict the likelihood with which startups introduce product innovations.
Accordingly, we create a dummy variable for the introduction of a product innovation in a
given year. Product innovations can have various degrees of novelty. We require that a
startup’s new product is new to the market, not just new to the startup itself.
Explanatory variables
Our main variables of interest on the right-hand side of our estimation equation are whether
or not a firm employs at least one employee who is appointed with delegated decision making
authority (“middle manager”), the size of the existing knowledge stock of a firm, the number
of R&D employees, and the riskiness of the business opportunity a firm exploits.
We construct our binary indicator for the presence of a middle manager from occupation
codes available in the employment statistics of the German Federal Employment Agency. In
the individual level data, occupations are coded using the five-digit occupation code
KldB2010 (the German adaption of ISCO-08, devised by the Federal Employment Agency)
which allows identifying employees with supervisory or executive competences.3 We classify
such employees as “middle managers”. Analogously, we construct the number of R&D em-
ployees by summing up those employees that have occupation codes relating to R&D occu-
pations.4
3 Employees with supervisory or executive competences are identified by a “9” as fourth digit of the five-
digit KldB2010 occupation code. 4 We apply the definition of R&D occupations of the German Federal Statistical Offices
(https://www.klassifikationsserver.de/klassService/jsp/item/grouping.jsf?form:_idcl=form:tree:0:0:0:0:link
_expand_plus&autoScroll=&form_SUBMIT=1&javax.faces.ViewState=rO0ABXVyABNbTGphdmEubG
FuZy5PYmplY3Q7kM5YnxBzKWwCAAB4cAAAAAJ1cQB%2BAAAAAAACdAABZHB0ABYvanNw
L2l0ZW0vZ3JvdXBpbmcuanNw)

17
We approximate a firm’s existing knowledge stock by the number of patents the found-
er(s) of a firm held prior to the registration of the firm. We retrieve this information from the
survey data of the KfW/ZEW Startup Panel.
Following Dencker and Gruber (2015), we measure the riskiness of the business oppor-
tunity of a firm using the average credit rating score of all other German firms of the same
age in the same three-digit NACE industry. Credit rating scores reach from 100 (best) to 600
(worst, indicating default) and are retrieved from the credit rating agency Creditreform. The
measure reflects the average likelihood of failure of comparable firms. Since information
about startups is typically scarce, the probability of failure of comparable firms oftentimes
determines the financing conditions and the financial pressure a new venture faces and hence
measures the inherent riskiness of its business opportunity. Dencker and Gruber (2015) argue
that this measure reflects the risk-return potential inherent in opportunities. Risk ratings, in
that sense, proxy for the likelihood of insolvency in a given industry, and higher risk ratings
should therefore also provide the basis for building high-performing startups (Stinchcombe,
1965; Dencker and Gruber, 2015).
We control for a number of factors that have frequently been shown to be associated with
the likelihood to innovate (Ahuja, Lampert, and Tandon, 2008). Details on the construction of
all variables are provided in Table 4 in Appendix A. We control for the resource availability
of the startup by controlling for the number of founders and employees as well as for R&D in
particular by including R&D expenditures (scaled by startup sales). Besides, we control for
the quality of the startup’s human capital by including a dummy variable if at least one of the
founders had tertiary education as well as the share of employees with tertiary education.
Besides, founder experience has been found to impact startup performance (Colombo,
Delmastro, and Grilli, 2004; Colombo and Grilli, 2005). We capture these effects with two

18
dummy variables indicating whether the founder had managerial or entrepreneurial experi-
ence as well as the number of years of industry experience of the founder.
Taking into consideration structural differences among startups, we control for the
startup’s age and whether it is incorporated (limited liability). We further add three industry
dummies for technology intensive services, software supply and consultancy as well as skill-
intensive services. High-tech manufacturing startups will serve as our reference group.
Estimation approach and identification
Since our dependent variable is binary, we choose probit estimates with standard errors ro-
bust to clustering at the startup level as our main estimation method. In our analyses, we es-
timate a series of interaction effects. The interpretation of interaction effects in nonlinear
models, such as probit or logit models, is not straightforward (Ai and Norton, 2003; Greene,
2010). Therefore, we first re-calculated all interaction effects following Ai and Norton
(2003). In addition, we double-checked all results with linear probability models as a robust-
ness check. We did not find qualitative differences to the reported marginal effects in both
checks.
Endogeneity is a potential issue in our empirical setting. A first source of endogeneity
might stem from simultaneity/omitted variable bias. It seems plausible to assume that startups
of higher quality might simultaneously have a higher probability of doing both, hiring a mid-
dle manager and introducing an innovation. If we cannot control for startup quality adequate-
ly, we might spuriously attribute changes in innovation propensity to the introduction of a
middle management. We address this problem by a two-step strategy: We first pre-balance
our sample with respect to firm-year observations with middle management and those with-
out over a large number of indicators for firm quality that are determined before a startup
introduces a middle management (and potentially confounds the measures). Second, we con-

19
trol for a wide range of contemporary or one period lagged indicators for firm quality directly
in all estimated models.
We apply entropy balancing to implement the pre-balancing empirically. Entropy balanc-
ing achieves balance over specified moments of selected covariates by deriving sample
weights. The retrieved weights are then used in subsequent weighted estimations
(Hainmueller, 2011; Hainmueller and Xu, 2013). Intuitively, this can be understood as the
creation of a synthetic control group, where the observations in the control group are re-
weighted so that their specified sample moments mimic those of the treatment group as close-
ly as possible (cf. Abadie, Diamond, and Hainmueller, 2010). In contrast to other related
methods, for instance propensity score matching, entropy balancing induces covariate balance
directly, and not as the result of a propensity score matching procedure (which requires iter-
ated re-specifications of the propensity score estimation to achieve covariate balance). Entro-
py balancing has been applied for sample balancing in several recent studies (e.g., Bansak,
Hainmueller, and Hangartner, 2016; Malesky and Taussig, 2016; Satyanath, Voigtländer, and
Voth, 2017). Technical details on the derivation of the entropy balancing weights are provid-
ed in Appendix B.
Our choice of indicators for startup quality that we use in the balancing exercise follows
the results of Colombo and Grilli (2013) who analyze the antecedents of the emergence of a
middle management layer in Italian high-tech startups. We balance on the full-time equiva-
lent employment size of the startup at the time of foundation including founders, whether the
firm was incorporated with limited liability at the time of foundation, industry dummies,
whether the firm reported to have equity investors in the first interview, the number of patents
a firm founder held at the time of firm foundation, and measures for founder human capital
(whether the founder has tertiary education, the founder’s years of industry experience,
whether the founder had started a firm before, and whether the founder has experience as a

20
manager in dependent employment).5 The data show that, as expected, startups with middle
management clearly outperform those without middle management with respect to nearly all
firm quality indicators. After balancing, though, original differences are leveled entirely (see
Table 5 in Appendix A for results).
A second, closely related, source of endogeneity might arise from direct reverse causali-
ty, when firms appoint a middle manager in response to the introduction of a market novelty.
We use only lagged values of middle management to reduce the potential bias caused.
To assess the robustness of our identification strategy, we re-estimate our main models
and instrument the presence of a middle manager by two measures that we regard as plausi-
bly exogenous to a startup’s innovation performance: (1) the number of executives in firms
that filed bankruptcy in the same district and one-digit NACE industry in a given year and (2)
the propensity that other firms in the sample, which operate in the same one-digit NACE in-
dustry and are in the same size category, have a middle management.6 The first instrument
introduces exogenous variation due to a local supply shock of potential candidates for middle
management positions. The second instrument introduces exogenous variation in the firms’
demands for middle managers.
Because our IV model is over-identified (i.e., we use more instruments than endogenous
regressors we instrument for) we use a (pooled) GMM approach to estimate the IV model and
adjust the GMM weighting matrix and the standard errors for a potential clustering at the firm
5 For founding teams we use information on the founder with the highest education/most experience in the
team. For improving the precision of the balancing of continuous variables (i.e. startup size and number of
founder patents), we require that the first three moments of these variables are balanced, i.e. mean, vari-
ance and skewness. 6 According to existing research, the necessity to introduce a hierarchical structure depends crucially on
industry and firm size (Rajan and Zingales, 2001). However, the probability that other firms hire a middle
manager should not directly influence a focal firm’s probability to launch an innovation on the market. For
the generation of the instrument, we defined six size categories to achieve an as uniform as possible distri-
bution of observations over size categories: (1) 1 employee, (2) 2 employees, (3) 3 or 4 employees, (4) 5 to
7 employees, (5) 8 to 14 employees, (6) more than 14 employees.

21
level. We find the proposed instruments to be valid and our identification strategy to be sup-
ported by the results of IV regressions (see results section for details).
IV. RESULTS
Summary statistics and a table of pairwise correlations are provided in Table 1 and Table 2.
We learn from the descriptive statistics that 16% of startups in our sample report product in-
novations which gives some indication that achieving innovation success is challenging for
the average high-tech startup. Startups are on average 3.87 years old, have 1.7 founders and
employ 4.89 employees. They spend 12% of sales on R&D and employ 0.14 R&D employ-
ees, albeit with a substantial standard deviation. The number of R&D employees provides
some indication that R&D positions are difficult to finance for startups. Similarly, founders
hold 0.48 patents when creating the startup but also with a large standard deviation.
Most of the startups operate in service sectors, especially technology-intensive services
(42 percent). Thirty percent of startup operate in high-tech manufacturing sectors which typi-
cally have higher entry barriers, e.g. from necessary fixed capital investments. The riskiness
of the business opportunities of startups in our sample is at an intermediate level at 308 on the
scale between 100 and 600. Most startups are incorporated as limited liability companies
(64%) but few have equity investors from the start (4%). Moreover, 10% of startups in our
sample have a middle management. Hence, a sizable number of startups makes this organiza-
tional design choice but the majority of startups does not. This indicates that the introduction
of a middle management has the potential to be a strategic decision differentiating startups
from their peers.
None of the correlations between the explanatory variables reach levels that indicate col-
linearity problems. This is supported by the variance inflation factor (VIF) that has an aver-

22
age value of 1.45 for our main models. The VIF is far below usually applied critical levels of
10 (Belsley, Kuh, and Welsh, 1980).
------ Table 1 about here ------
------ Table 2 about here ------
In line with Hypothesis 1, our main multivariate regression estimates from weighted Probit
models reveal a significant and positive relationship between middle management and a
startup’s likelihood to introduce a product innovation (Column A of Table 3; see Column A
of Table 6 in Appendix A for results of the unbalanced/non-weighted model). Employing at
least one middle manager increases the likelihood to introduce a market novelty by 7.2 per-
centage points. Given that the average propensity to introduce a market novelty in the sample
is 16%, this effect size stands for a substantial increase.
------ Table 3 about here ------
The marginal effects of the wide range of included control variables show the expected signs.
Most noteworthy, the R&D intensity has a positive and significant effect, as does the size of
the existing knowledge stock (patents at time of foundation), the number of R&D employees,
and the share of employees with tertiary education.
We apply interaction and split sample analyses, to test the moderating effects on the rela-
tionship between middle management and innovation performance that we proposed in Hy-
potheses 2 to 4b (Table 3; Column B-F). In support of Hypothesis 2, we find a positive and
significant interaction effect between the presence of a middle management level and a
startups’ existing knowledge stock. Hence, middle management seems to become especially

23
effective in managing innovation when middle managers can draw on larger stocks of exist-
ing knowledge. In addition, it seems reasonable to assume that middle managers help startups
to translate inventions into marketable innovations and hence facilitate the commercialization
of previously recognized opportunities. In contrast, our data does not support Hypothesis 3:
The interaction effect between middle management and the number of R&D employees is
positive but insignificant in the full sample. As we will show in the following, understanding
the relationship between middle management, the number of R&D employees, and innova-
tion requires a more nuanced explanation.
To assess how the riskiness of a firm’s business opportunity influences the moderating
effects of the prior knowledge stock and the R&D personnel (Hypotheses 4a and 4b), we split
our sample at the industry median of the riskiness of the business opportunity.7 In support of
Hypothesis 4a, we find that the interaction between middle management and the number of
R&D employees is only positive and significant for firms that exploit risky opportunities. In
contrast, and in support of Hypothesis 4b, the interaction term between middle management
and the size of a startup’s prior knowledge stock is only positive and significant for less risky
business opportunities. These results support the hypothesized rationale that in highly risky
businesses, which need to adapt to their business environment constantly and keep the cost of
these adaptions under control, middle management plays an important role in supporting the
founders in monitoring ongoing R&D. In contrast, in less risky but more stable environments
that allow recombining a startup’s existing knowledge stock middle management seems to
facilitate innovation by rendering the search for innovation through the recombination of ex-
isting technologies more efficiently and reliably.
7 We split the sample at the industry medians of the industries used for the stratification of the KfW/ZEW
Startup Panel. We control for these stratification industries by industry fixed effects in all models. Since
the opportunity risk measure is generated on a three-digit NACE level, this procedure implies that we
compare “more risky” opportunities to opportunities that are less risky but generally comparable.

24
Robustness checks
As described before, we apply an instrumental variables approach as a robustness check
(Table 7 in Appendix A). In a first step, we instrument lagged middle management to repli-
cate our main analyses (i.e. we replicate Table 3, Column A). Both instruments have a posi-
tive and statistically significant impact on the probability to employ a middle manager in the
first stage of the IV regression. The joint first stage F-statistics of the instruments is 10.45. As
a rule of thumb, first stage F-statistics of 10 and below indicate critically weak instruments.
The Hansen-J test for over-identification has a p-value of 0.106: over-identification and the
validity of our instruments cannot be rejected at a 10% significance level. When instrument-
ed, the effect of middle management remains positive and significant.
In a second step, we re-run the IV model but use contemporary (and not lagged) explana-
tory variables. Since the effect of middle management is identified by exogenous variation in
the IV model, a specification without lags yields unbiased estimates. However, the precision
of the estimates should increase due to the increase in the sample size. This allows us to pro-
vide some evidence whether the fact that the coefficient and the standard error of middle
management become somewhat inflated in the lagged IV specification can be attributed to the
rather week instruments. As in the first specification, both instruments have a significantly
positive relationship with the propensity to employ a middle manager in the first stage. The
power of the instruments is higher with a first stage F-statistic of 20.75 and a p-value of the
Hansen-J test for over-identification of 0.511. As a consequence of the stronger instruments,
the inflation of the estimated coefficient for middle management decreases considerably (to
0.247). Hence, we conclude that overall the IV specifications support a causal interpretation
of our results.
As a second robustness check, we increase the level of detail of the included industry
fixed effects. We do so to assure that our estimates are not driven by industry differences in

25
the propensity to innovate we do not control for. The industry controls in our main models
reflect the stratification criteria of the KfW/ZEW-Startup Panel and are included on the level
of stratification to control for firms’ probabilities to be drawn into the sample. When we in-
crease the level of detail of the industry fixed effects up to the two digit NACE level, the
marginal effect of middle management changes only slightly (see Columns C and D of Table
6 in Appendix A). Hence, we are confident that controlling for industry differences at the
level of the industry stratification of the sample yields unbiased results.
V. DISCUSSION
Do middle managers help startups to introduce innovative products to the market? And if so,
when are middle managers most effective? Our research addresses a fundamental puzzle in
the literature on organizational design. On the one hand, middle management is typically as-
sociated with a higher level of formalization and bureaucracy and therefore bears the risk of
hampering creativity and innovation in the average firm (e.g., Burns and Stalker, 1961;
Thompson, 1965). On the other hand, organizational structure such as a middle management
level can help firms to allocate resources, to facilitate monitoring and control, and therefore
to realize opportunities (Ireland and Webb, 2009; Foss et al., 2015).
Our research provides a number of compelling findings to address this gap in existing re-
search for a high-tech startup context. Based on a unique sample of almost 3,700 firm-year
observations between 2005 and 2012, we find that high-tech startups with middle manage-
ment have a higher likelihood of introducing product innovations. We attribute this finding to
the fact that the establishment of middle management leads to increased information pro-
cessing and monitoring capacity in the startup (Colombo and Grilli, 2013). Middle manage-
ment frees up founders to focus on the most challenging problems of the organization. It also
allows an organization to predict more accurately when problems or projects require organi-

26
zation-wide solutions (Harris and Raviv, 2002). In that sense, middle management enables
parallel processing and allows decision making of its founders to focus on strategic and high-
er-value decisions while other decisions can be delegated to middle managers. This should be
particularly true for decision making in R&D. Since R&D decisions are complex and uncer-
tain, they require management attention and thorough decision making. Middle managers
allow founders to focus on these decisions and therefore improve a startup’s ability to inno-
vate.
Moreover, we find evidence that middle managers facilitate the recombination of exist-
ing knowledge, a central determinant of a firm’s ability to innovate (Rosenkopf and Nerkar,
2001; Katila and Ahuja, 2002). Middle managers, through the added information-processing
capacity, apparently decrease the likelihood of errors and false starts when using the same
knowledge elements repeatedly so that search becomes more reliable (Levinthal and March,
1993). They also make the search for innovation more predictable due to a better understand-
ing of the requirements that need to be met for successful innovation. The increased infor-
mation processing capacity helps understand how product development tasks can be decom-
posed into manageable sub-problems, how they should be sequenced, and which elements to
disregard.
Contrary to our expectations, we do not find a positive and significant interaction effect
between middle management and the size of a startup’s current R&D personnel. We had ex-
pected middle management to be of value in directing and focusing current knowledge pro-
duction and technology development by reducing the span of control for a startup’s employ-
ees, leading to quicker implementation of plans because of tighter spans of control (Keren
and Levhari, 1979). However, our results indicate that this relationship is more complex and
requires an understanding of the riskiness of the startup’s business opportunity. Splitting the
sample into two groups with below and above median riskiness reveals that the interaction

27
between middle management and current R&D personnel is positive and significant for firms
that operate in industries with risky business opportunities. However, there is no significant
interaction effect for less risky opportunities. In contrast, the interaction term between middle
management and the startup’s existing knowledge is only positive and significant in indus-
tries with less risky business opportunities. These results support our expectations that
startups in highly risky businesses need to continuously adapt and dedicate management at-
tention which is why middle management is particularly helpful in supporting founders. In
more stable environments, middle managers help with recombining a startup’s existing
knowledge stock.
Taken together, our findings advance academic research along two dimensions. First, ex-
isting entrepreneurship literature emphasizes how startups mature and professionalize
through their organizational design choices (Baron et al., 1999; Colombo and Grilli, 2013;
Hellmann and Puri, 2002). Our theoretical model focusses on one particular organizational
design choice, i.e. the establishment of a middle management layer in a startup, and links it to
innovation performance, arguably one of the most crucial strategic outcomes for high-tech
startups. We integrate mechanisms on information processing and monitoring from existing
middle management literature into models of R&D decision making. On the one hand, this
provides a basis for future studies to theorize about how middle management affects other
strategic outcomes of startups, e.g. internationalization. On the other hand, it highlights a
weakness in existing literature investigating innovation outcomes of high-tech startups. Stud-
ies ignoring the hierarchical levels are likely to suffer from biased results.
Second, recent research in strategic entrepreneurship emphasizes how the riskiness of a
startup’s business opportunity conditions the value of founder knowledge and experience for
startup success (e.g., Dencker and Gruber, 2015). We find that this contingency effect of a
startup’s business opportunity is not limited to founder characteristics. Instead, we show how

28
middle management can extend the management capacities of a startup for making R&D de-
cisions and that the effects differ depending on the riskiness of the startup’s business oppor-
tunities. Our theoretical model can be a pathway for future theorizing on how the effective-
ness of other organizational design choices of startups (apart from middle management) is
contingent on their business opportunities.
Apart from these academic contributions, our findings have relevance for decision mak-
ing in startups. We provide evidence of the benefits of middle management for startups and
outline conditions under which the establishment of a middle management level is most ef-
fective. These insights translate into direct recommendations for the management of startups.
They suggest that startups should hire middle managers as soon as the startup finances allow
to do so (Michelacci and Quadrini, 2005) in order to improve the realization of opportunities.
There is a particularly strong case for the establishment of middle management in high-tech
startups that have a strong technological base and whose prior knowledge offers numerous
opportunities for recombination. Moreover, high-tech startups that continue to invest into
R&D because the business opportunity they exploit features high-risk and return prospects
also benefit from middle managers. Founders should critically question their own information
processing capabilities and to what extent they can dedicate attention to innovation. Similar-
ly, startup advisors such as investors, consultants or government agencies should take these
mechanisms into account. We show that the likelihood for innovation success of a startup is
not limited to technological decisions of its founders but includes organizational design
choices which will make it more likely that the startup will have the information processing
and monitoring capacities in place to arrive at promising R&D decisions.
29
VI. CONCLUDING REMARKS
We have argued theoretically and shown empirically that establishing a middle management
layer can help startups to introduce product innovations. The positive effects of middle man-
agement seem to arise through improved capabilities for information processing, monitoring
and decision making. These improvements help startups prioritize between the creation of
new knowledge and the exploitation of existing knowledge, dependent on the riskiness of a
startup’s business opportunity.
Nevertheless, our research is not without limitations. First, our research investigates only
an individual organizational design choice and seeks to isolate its effect on innovation. How-
ever, the organizational structure of startups can be characterized by several other dimensions
that may interact with the establishment of a middle management level. Future research
should therefore also consider other design choices and study their interrelationships. Second,
while our research design allows us to capture the effect of middle management across a
number of startups and industries, smaller scale and/or qualitative studies may be better posi-
tioned to delineate communication and coordination patterns by which middle managers and
founders interact in their R&D decisions. Finally, while we use panel data that enables us to
control for a large number of firm- as well as individual-specific factors in our models and to
use one period lagged explanatory variables to reduce the risk of reverse causality, the re-
maining time dimension in our panel dataset is not large enough to estimate meaningful fixed
effects specifications. Hence there may be some remaining unobserved heterogeneity in indi-
vidual or firm characteristics that can offer alternative explanations for our empirical results.
However, since we are able demonstrate the robustness of our results by using different
methods of identification, including a pre-balancing of our sample and instrumental variables
models, we consider the potential remaining bias to be very small at most.

30
VII. REFERENCES
Abadie A, Diamond A, Hainmueller J. 2010. Synthetic Control Methods for Comparative
Case Studies: Estimating the Effect of California’s Tobacco Control Program. Journal of
the American Statistical Association 105(490): 493-505.
Agrawal A, Cockburn L, McHale J. 2006. Gone but Not Forgotten: Knowledge Flows, Labor
Mobility, and Enduring Social Relationships. Journal of Economic Geography 6(5): 571-
591.
Ahuja G, Lampert CM, Tandon V. 2008. Moving Beyond Schumpeter: Management
Research on the Determinants of Technological Innovation. Academy of Management
Annals 2: 1-98.
Ai C, Norton EC. 2003. Interaction Terms in Logit and Probit Models. Economics Letters 80:
123-129.
Amit R, Glosten L, Muller E. 1990. Entrepreneurial Ability, Venture Investments, and Risk
Sharing. Management Science 36(10): 1232-1245.
Antons D, Piller FT. 2015. Opening the Black Box of "Not Invented Here": Attitudes,
Decision Biases, and Behavioral Consequences. Academy of Management Perspectives
29(2): 193-217.
Bansak K, Hainmueller J, Hangartner D. 2016. How Economic, Humanitarian, and Religious
Concerns Shape European Attitudes toward Asylum Seekers. Science 354(6309): 217-
222.
Baron JN, Burton MD, Hannan MT. 1999. Engineering Bureaucracy: The Genesis of Formal
Policies, Positions, and Structures in High-Technology Firms. Journal of Law,
Economics and Organization 15(1): 1-41.
Belsley DA, Kuh E, Welsh RE. 1980. Regression Diagnostics: Identifying Influential Data
and Sources of Collinearity: New York.
Bersch J, Gottschalk S, Müller B, Niefert M. 2014. The Mannheim Enterprise Panel (Mup)
and Firm Statistics for Germany. , ZEW Centre for European Economic Research
Discussion Paper:
Burns T, Stalker GM. 1961. The Management of Innovation (3 ed.). Oxford University Press:
Oxford.
Calvo GA, Wellisz S. 1978. Supervision, Loss of Control, and the Optimum Size of the Firm.
Journal of Political Economy 86(5): 943-952.
Colombo MG, Delmastro M, Grilli L. 2004. Entrepreneurs' Human Capital and the Start-up
Size of New Technology-Based Firms. International Journal of Industrial Organization
22(8): 1183-1211.
Colombo MG, Grilli L. 2005. Founders’ Human Capital and the Growth of New Technology-
Based Firms: A Competence-Based View. Research Policy 34(6): 795-816.
Colombo MG, Grilli L. 2013. The Creation of a Middle-Management Level by
Entrepreneurial Ventures: Testing Economic Theories of Organizational Design. Journal
of Economics and Management Strategy 22(2): 390-422.
Czarnitzki D, Doherr T, Hussinger K, Schliessler P, Toole AA. 2015. Individual Versus
Institutional Ownership of University-Discovered Inventions, ZEW Centre for European
Economic Research Discussion Paper:
Dencker JC, Gruber M. 2015. The Effects of Opportunities and Founder Experience on New
Firm Performance. Strategic Management Journal 36(7): 1035-1052.
Dess GG, Lumpkin GT, McKee JE. 1999. Linking Corporate Entrepreneurship to Strategy,
Structure, and Process: Suggested Research Directions. Entrepreneurship Theory and
Practice 23(3): 85-103.

31
Eckardt JT, Shane SA. 2003. Opportunities and Entrepreneurship. Journal of Management
29: 333-349.
Foss NJ, Lyngsie J, Zahra SA. 2015. Organizational Design Correlates of Entrepreneurship:
The Roles of Decentralization and Formalization for Opportunity Discovery and
Realization. Strategic Organization 13(1): 32-60.
Fryges H, Gottschalk S, Kohn K. 2010. The Kfw/Zew Start-up Panel: Design and Research
Potential. Journal of Applied Social Science Studies (European Data Watch) 130: 117-
131.
Galbraith J. 1977. Organizational Design. Addison Wesley: Reading, MA.
Gambardella A, Ganco M, Honoré F. 2015. Using What You Know: Patented Knowledge in
Incumbent Firms and Employee Entrepreneurship. Organization Science 26(2): 456-474.
Garicano L. 2000. Hierarchies and the Organization of Knowledge in Production. Journal of
Political Economy 108(5): 874-904.
Gourville JT. 2006. Eager Sellers and Stony Buyers: Understanding the Psychology of New-
Product Adoption. Harvard Business Review 84(6): 3-10.
Greene WH. 2010. Testing Hypotheses About Interaction Terms in Nonlinear Models.
Economics Letter 107(2): 291-296.
Hainmueller J. 2011. Entropy Balancing for Causal Effects: A Multivariate Reweighting
Method to Produce Balanced Samples in Observational Studies. Political Analysis 20(1):
25-46.
Hainmueller J, Xu Y. 2013. Ebalance: A Stata Package for Entropy Balancing. Journal of
Statistical Software 54(7)
Hall BH. 2005. The Financing of Innovation. In S Shane (Ed.), The Handbook of Technology
and Innovation Management. Blackwell: Oxford: 409-430.
Harris M, Raviv A. 2002. Organization Design. Management Science 48(7): 852-865.
Hellmann T, Puri M. 2002. Venture Capital and the Professionalization of Start-up Firms:
Empirical Evidence. The Journal of Finance 57(1): 169-197.
Ireland RD, Covin JG, Kuratko DF. 2009. Conceptualizing Corporate Entrepreneurship
Strategy. Entrepreneurship Theory and Practice 33(1): 19-46.
Ireland RD, Webb JW. 2009. Crossing the Great Divide of Strategic Entrepreneurship:
Transitioning between Exploration and Exploitation. Business Horizons 52(5): 469-479.
Jensen MC, Meckling WH. 1995. Specific and General Knowledge, and Organizational
Structure. Journal of Applied Corporate Finance 8(2): 4-18.
Katila R. 2002. New Product Search over Time: Past Ideas in Their Prime? Academy of
Management Journal 45: 995-1010.
Katila R, Ahuja G. 2002. Something Old, Something New: A Longitudinal Study of Search
Behavior and New Product Introduction. Academy of Management Journal 45(6): 1183-
1194.
Katz R, Allen TJ. 1982. Investigating the Not Invented Here (Nih) Syndrome. A Look at the
Performance, Tenure, and Communication Patterns of 50 R&D Project Groups. R&D
Management 12: 7-19.
Keren M, Levhari D. 1979. The Optimum Span of Control in a Pure Hierarchy. Management
Science 25(11): 1162-1172.
Keren M, Levhari D. 1989. Decentralization, Aggregation, Control Loss and Costs in a
Hierarchical Model of the Firm. Journal of Economic Behavior & Organization 11(2):
213-236.
Koput KW. 1997. A Chaotic Model of Innovative Search: Some Answers, Many Questions.
Organization Science 8(5): 528-542.
Levinthal DA, March JG. 1993. The Myopia of Learning. Strategic Management Journal 14:
95-112.

32
Malesky E, Taussig M. 2016. The Danger of Not Listening to Firms: Government
Responsiveness and the Goal of Regulatory Compliance. Academy of Management
Journal forthcoming
Michelacci C, Quadrini V. 2005. Borrowing from Employees: Wage Dynamics with
Financial Constraints. Journal of the European Economic Association 3(2/3): 360-369.
Miller KD. 1992. A Framework for Integrated Risk Management in International Business.
Journal of International Business Studies 23(2): 311–331.
Miller KD. 1993. Industry and Country Effects on Managers' Perceptions of Environmental
Uncertainties. Journal of International Business Studies 24(4): 693-714.
Ocasio W. 1997. Towards an Attention-Based View of the Firm. Strategic Management
Journal 18: 187-206.
Qian Y. 1994. Incentives and Loss of Control in an Optimal Hierarchy. The Review of
Economic Studies 61(3): 527-544.
Radner R. 1993. The Organization of Decentralized Information Processing. Econometrica
61(5): 1109-1146.
Rajan R, Wulf J. 2003. The Flattening Firm: Evidence from Panel Data on the Changing
Nature of Corporate Hierarchies. National Bureau of Economic Research Working Paper
Series No. 9633
Rajan R, Zingales L. 2001. The Firm as a Dedicated Hierarchy: A Theory of the Origins and
Growth of Firms. The Quarterly Journal of Economics 116(3): 805-851.
Rosenkopf L, Nerkar A. 2001. Beyond Local Search: Boundary-Spanning, Exploration, and
Impact in the Optical Disc Industry. Strategic Management Journal 22(4): 287-306.
Satyanath S, Voigtländer N, Voth HJ. 2017. Bowling for Fascism: Social Capital and the Rise
of the Nazi Party. Journal of Political Economy 125(2): 478-526.
Schumpeter JA. 1934. Theory of Economic Development. Harvard University Press:
Cambridge, MA.
Shane SA. 2000. Prior Knowledge and the Discovery of Entrepreneurial Opportunities.
Organization Science 11(4): 448-469.
Shane SA. 2003. A General Theory of Entrepreneurship: The Individual-Opportunity Nexus.
Edward Elgar: Aldershot.
Shane SA, Venkataraman S. 2000. The Promise of Entrepreneurship as a Field of Research.
Academy of Management Review 25: 217-226.
Simon HA. 1948. Administrative Behavior. A Study of Decision-Making in Administrative
Organizations: New York.
Sine WD, Mitsuhashi H, Kirsch DA. 2006. Revisiting Burns and Stalker: Formal Structure
and New Venture Performance in Emerging Economic Sectors. Academy of Management
Journal 49(1): 121-132.
Stein JC. 2002. Information Production and Capital Allocation: Decentralized Versus
Hierarchical Firms. The Journal of Finance 57(5): 1891-1921.
Stinchcombe AL. 1965. Social Structures and Organizations. In JG March (Ed.), Handbook
of Organizations. Rand McNally: Chicago: 142-193.
Thompson VA. 1965. Bureaucracy and Innovation. Administrative Science Quarterly 10(1):
1-20.
Venkataraman S. 1997. The Distinctive Domain of Entrepreneurship Research: An Editor’s
Perspective. In JN Katz, R Brockhaus (Eds.), Advances in Entrepreneurship, Firm
Emergence, and Growth. JAI Press: Greenwich: 119-138.
Wasserman N. 2012. The Founder's Dilemmas: Anticipating and Avoiding the Pitfalls That
Can Sink a Startup. Princeton University Press: Princeton, NJ.
Wiklund J, Shepherd D. 2003. Aspiring for, and Achieving Growth: The Moderating Role of
Resources and Opportunities. Journal of Management Studies 40(8): 1919-1941.

33
TABLES
Table 1: Descriptive statistics
All firms (N = 3,699)
Variable Unit Mean S.D. Min Max
Product innovation (y/n) (y/n) 0.16 0.37 0.00 1.00
Firm has middle management (y/n) - lag (y/n) 0.10 0.30 0.00 1.00
Risk of business opportunity Score 308.32 14.64 239.00 461.58
Number of R&D employees - lag Count 0.14 0.64 0.00 13.00
Number of patents bef. foundation Count 0.48 7.40 0.00 180.00
R&D intensity (R&D/sales) - lag Share 0.12 0.34 0.00 2.00
Number of founders Count 1.70 0.98 1.00 9.00
Founder with tertiary education (y/n) (y/n) 0.65 0.48 0.00 1.00
Founder has managerial experience (y/n) (y/n) 0.51 0.50 0.00 1.00
Founder has entrepreneurial experience (y/n) (y/n) 0.47 0.50 0.00 1.00
Years of industry experience Count 19.48 9.06 2.00 48.00
Number of dep. employees - lag Count 4.89 5.16 1.00 45.00
Employees with tertiary edu. (share) - lag Share 0.25 0.33 0.00 1.00
Equity capital in year of foundation (y/n) 0.04 0.20 0.00 1.00
Limited liability (y/n) 0.64 0.48 0.00 1.00
Firm age Count 3.87 1.56 1.08 8.00
High-technology manufacturing (y/n) 0.30 0.46 0.00 1.00
Technology-intensive services (y/n) 0.42 0.49 0.00 1.00
Software supply and consultancy (y/n) 0.14 0.35 0.00 1.00
Skill-intensive services (y/n) 0.14 0.35 0.00 1.00
Year 2008 (y/n) 0.12 0.32 0.00 1.00
Year 2009 (y/n) 0.19 0.39 0.00 1.00
Year 2010 (y/n) 0.20 0.40 0.00 1.00
Year 2011 (y/n) 0.24 0.43 0.00 1.00
Year 2012 (y/n) 0.26 0.44 0.00 1.00
Notes: Additional control variable: funding by KfW bank

34
Table 2: Pairwise correlations of dependent and main explanatory variables (n = 3,699)
Variable (1) (2) (3) (4) (5) (6) (7) (8) (9) (10) (11) (12) (13) (14) (15)
(1) Product innovation (y/n) 1
(2) Firm has Middle Management (y/n) - lag 0.1114* 1
(3) Risk of business opportunity (log) 0.0715* 0.0347* 1
(4) Number of RnD Employees - lag 0.0610* 0.0878* -0.0148 1
(5) Number of Patents bef. foundation 0.0266 -0.0167 0.0081 -0.0039 1
(6) R&D intensity (R&D/sales) - lag 0.2771* 0.1024* 0.0532* 0.0519* 0.0694* 1
(7) # Founders in team (log) 0.1162* 0.1026* 0.0573* 0.0495* 0.0176 0.1227* 1
(8) Founder with tertiary education (y/n) 0.1116* 0.0582* -0.0076 0.0683* 0.0405* 0.1394* 0.2787* 1
(9) Founder has managerial experience (y/n) 0.0316 0.0479* -0.0377* 0.0405* -0.0107 0.0301 -0.0016 0.0517* 1
(10) Founder has entrepreneurial experience (y/n) 0.1115* 0.0688* 0.1082* 0.0224 0.0457* 0.0750* 0.2699* 0.1011* -0.2094* 1
(11) Years of industry experience -0.0169 0.0042 -0.0328* 0.0452* 0.0542* -0.0276 0.0085 -0.0953* 0.1209* 0.0419* 1
(12) Number of dep. Employees (log) - lag 0.0877* 0.2525* -0.007 0.2144* -0.0332* 0.0442* 0.1548* 0.0076 0.0450* 0.0837* 0.0416* 1
(13) Employees with tertiary edu. (share) - lag 0.0724* 0.0845* 0.0212 0.0867* -0.0263 0.1840* 0.1556* 0.3152* 0.0296 0.0815* -0.0500* -0.0072 1
(14) Equity capital in year of foundation 0.1025* 0.1105* 0.0015 0.0691* -0.0039 0.2892* 0.1093* 0.0705* -0.0146 0.0652* -0.0662* 0.1129* 0.1280* 1
(15) Limited liability 0.1984* 0.1568* 0.1742* 0.1039* 0.0362* 0.2007* 0.3519* 0.3064* -0.0187 0.2911* 0.0102 0.2246* 0.2120* 0.1508* 1
(16) Firm age (log) -0.0804* 0.0199 0.1528* 0.0036 0.0029 -0.0712* -0.0232 -0.0353* -0.0422* -0.0350* 0.1569* 0.1236* 0.0055 -0.0329* -0.1146*
Notes: * denotes the statistical significance of a pairwise correlation at a 5% level.

35
Table 3: Main results
Dependent variable: A B C D E F
Full Sample Full Sample Full Sample Full Sample Risk > MED Risk <= MED
Product innovation M.E. (S.E.) M.E. (S.E.) M.E. (S.E.) M.E. (S.E.) M.E. (S.E.) M.E. (S.E.)
Firm has middle management (y/n) - lag 0.072 (0.026)*** 0.054 (0.026)** 0.069 (0.028)** 0.054 (0.027)** 0.059 (0.039) 0.042 (0.037)
Number of patents before foundation 0.002 (0.001)* 0.001 (0.001)** 0.002 (0.001)* 0.001 (0.001)** 0.002 (0.001)*** -0.001 (0.001)
Number of R&D employees - lag 0.040 (0.019)** 0.033 (0.016)** 0.032 (0.023) 0.032 (0.023) 0.020 (0.031) 0.038 (0.023)
Middle management * # patents bef. found. - lag
0.167 (0.079)**
0.167 (0.080)** 0.083 (0.080) 0.285 (0.105)***
Middle management * # R&D empl. - lag
0.012 (0.025) 0.001 (0.026) 0.073 (0.042)* -0.038 (0.028)
Risk of business opportunity (log) 0.397 (0.299) 0.406 (0.299) 0.394 (0.299) 0.406 (0.299) 0.549 (0.389) 0.115 (0.779)
R&D intensity (R&D/sales) - lag 0.120 (0.029)*** 0.115 (0.028)*** 0.120 (0.029)*** 0.115 (0.028)*** 0.102 (0.032)*** 0.110 (0.045)**
# Founders in team (log) 0.022 (0.029) 0.024 (0.029) 0.022 (0.029) 0.024 (0.029) 0.006 (0.035) 0.052 (0.039)
Founder with tertiary education (y/n) 0.014 (0.035) 0.013 (0.034) 0.014 (0.035) 0.013 (0.034) 0.028 (0.044) -0.012 (0.045)
Founder has managerial experience (y/n) 0.055 (0.028)* 0.054 (0.028)* 0.055 (0.028)* 0.054 (0.028)* 0.081 (0.038)** 0.035 (0.038)
Founder has entrepreneurial exp. (y/n) 0.029 (0.029) 0.025 (0.029) 0.028 (0.029) 0.025 (0.029) 0.026 (0.039) 0.014 (0.035)
Founder’s years of industry experience -0.000 (0.002) -0.000 (0.002) -0.000 (0.002) -0.000 (0.002) 0.001 (0.002) -0.003 (0.002)
Number of dep. employees (log) - lag -0.022 (0.014) -0.021 (0.014) -0.022 (0.014) -0.021 (0.014) -0.024 (0.020) -0.020 (0.019)
Employees with tertiary edu. (share) - lag 0.123 (0.039)*** 0.122 (0.038)*** 0.125 (0.039)*** 0.122 (0.038)*** 0.111 (0.053)** 0.102 (0.050)**
Equity capital in year of foundation 0.016 (0.052) 0.004 (0.050) 0.016 (0.052) 0.004 (0.050) 0.038 (0.070) -0.038 (0.064)
Limited liability 0.063 (0.048) 0.059 (0.048) 0.063 (0.048) 0.059 (0.048) 0.051 (0.061) 0.077 (0.066)
Firm age (log) -0.047 (0.032) -0.047 (0.031) -0.048 (0.032) -0.047 (0.031) -0.045 (0.041) 0.001 (0.044)
Technology-intensive services -0.186 (0.035)*** -0.183 (0.034)*** -0.187 (0.035)*** -0.183 (0.034)*** -0.142 (0.046)*** -0.207 (0.043)***
Software supply and consultancy -0.008 (0.041) 0.001 (0.040) -0.008 (0.041) 0.001 (0.040) 0.020 (0.055) -0.018 (0.066)
Skill-intensive services -0.133 (0.043)*** -0.128 (0.042)*** -0.133 (0.043)*** -0.128 (0.042)*** -0.153 (0.054)*** -0.105 (0.057)*
Constant and year fixed effecs Yes Yes Yes Yes Yes Yes
N / Pseudo R-sq. 3699 / 0.12 3699 / 0.13 3699 / 0.12 3699 / 0.13 1904 / 0.14 1795 / 0.16
Notes: Marginal effects from probit models. Significance levels: *** 1%, ** 5%, * 10%. Cluster robust standard errors in parentheses. Baseline category for industry controls: high-tech manufacturing. Additional control var. in all
regressions: Funding by KfW bank

36
APPENDICES
Appendix A: Tables and figures
Table 4: Details on measures
Variable Construction
Product innovation
Dummy variable - Takes a value of one for a firm-year observation if a firm intro-
duces a product innovation that is a national or worldwide market novelty in a year
Firm has middle management
Dummy variable - At least one dependent employee in firm is classified as having
supervisory or executive competence according to the KldB2010 (ISCO-08) occu-
pation code
R&D employees
Number of dependent employees who are classified as R&D personnel according to
the KldB2010 (ISCO-08) occupation code
Patents before foundation Number of patents a founder self-reported to hold at the time of firm foundation
R&D intensity
R&D expenses/total sales - largest percentile is winsorized and missing values are
imputed by one period lagged values if possible
Riskiness of business opportunity
Credit rating score of other firms of the same age in the same NACE4 industry -
credit rating scores reach from 100 (best) to 600 (worst)
Number of founders Number of founders (in the founding team) according to the survey data
Number of dep. employees
Number of reportable employees subject to social insurance contributions. This
includes regular full-time and part-time employees, apprentices, interns, and mar-
ginally employed personnel.
Founder with tertiary education
Dummy variable - Takes a value of one if the founder (or at least one founder in the
team) has a tertiary degree
Employees with tertiary education Share of dependent employees with tertiary degree
Entrepreneurial experience
Dummy variable - Takes a value of one if the founder (or at least one founder in the
team) started up an own company before.
Managerial experience
Dummy variable - Takes a value of one if the founder (or at least one founder in the
team) has managerial experience as employee from prior employment
Industry experience
Years of industry experience of the founder (or the founder with the longest experi-
ence in the team)
Equity capital in year of foundation Dummy variable – Takes a value of one if a firm reported any equity investors
during the first interview
Limited liability Dummy variable – Takes a value of one if a firm is incorporated with limited liabil-
ity
Firm age Age of startup in years

37
Table 5: Entropy balancing outcomes
Treatment group Control group
Before weighting
Mean Variance Skewness Mean Variance Skewness
Equity capital in year of foundation 0.112 0.100 2.460 0.036 0.035 4.989
Limited liability at foundation 0.871 0.113 -2.216 0.611 0.238 -0.455 Founder with tertiary education (y/n) 0.740 0.193 -1.091 0.646 0.229 -0.609
Years of industry experience 19.590 81.620 0.405 19.460 82.100 0.466 Founder has managerial experience (y/n) 0.583 0.244 -0.335 0.502 0.250 -0.006
Founder has entrepreneurial experience (y/n) 0.577 0.245 -0.312 0.461 0.249 0.157
Full-time eq. empl. size at foundation (incl. founders) 3.186 23.060 2.850 1.997 6.929 2.547 High-technology manufacturing 0.364 0.232 0.565 0.291 0.206 0.921
Technology-intensive services 0.339 0.225 0.681 0.429 0.245 0.288 Software supply and consultancy 0.165 0.138 1.802 0.136 0.117 2.126
After weighting
Mean Variance Skewness Mean Variance Skewness
Equity capital in year of foundation 0.112 0.100 2.460 0.112 0.099 2.463
Limited liability at foundation 0.871 0.113 -2.216 0.870 0.113 -2.195 Founder with tertiary education (y/n) 0.740 0.193 -1.091 0.739 0.193 -1.089
Years of industry experience 19.590 81.620 0.405 19.590 81.610 0.406
Founder has managerial experience (y/n) 0.583 0.244 -0.335 0.583 0.243 -0.335 Founder has entrepreneurial experience (y/n) 0.577 0.245 -0.312 0.577 0.244 -0.310
Full-time eq. empl. size at foundation (incl. founders) 3.186 23.060 2.850 3.183 23.030 2.852 High-technology manufacturing 0.364 0.232 0.565 0.364 0.232 0.565
Technology-intensive services 0.339 0.225 0.681 0.339 0.224 0.680
Software supply and consultancy 0.165 0.138 1.802 0.165 0.138 1.804

38
Table 6: Additional specifications and robustness check estimates
Dependent variable: A B C D
Not balanced Full Sample Full Sample - OLS Full Sample - OLS
Product innovation M.E. (S.E.) M.E. (S.E.) M.E. (S.E.) M.E. (S.E.)
Firm has middle management (y/n) - lag 0.047 (0.019)**
0.074 (0.028)*** 0.064 (0.027)**
Number of patents before foundation 0.001 (0.000)*
Number of R&D employees - lag 0.017 (0.010)*
Middle management in firms in risky environment - lag
0.052 (0.036)
Middle management in firms in non-risky environment - lag
0.050 (0.035)
Middle management * # Patents bef. foundation (firms in risky env.) - lag
0.090 (0.086)
Middle management * # Patents bef. foundation (firms in non-risky env.) - lag
0.266 (0.099)***
Middle management * # R&D employees (firms in risky env.) - lag
0.072 (0.043)*
Middle management * # R&D employees (firms in non-risky env.) - lag
-0.044 (0.028)
# Patents bef. foundation in firms in risky environment
0.003 (0.001)***
# Patents bef. foundation in firms in non-risky environment
-0.001 (0.001)
# R&D employees in firms in risky environment - lag
0.027 (0.031)
# R&D employees in firms in non-risky environment - lag
0.037 (0.022)*
Risk of business opportunity (log) 0.399 (0.161)** 0.289 (0.293) 0.436 (0.309) 0.199 (0.404)
R&D intensity (R&D/sales) - lag 0.139 (0.017)*** 0.117 (0.027)*** 0.159 (0.038)*** 0.143 (0.037)***
# Founders in team (log) 0.009 (0.015) 0.025 (0.028) 0.017 (0.031) 0.011 (0.029)
Founder with tertiary education (y/n) 0.047 (0.018)*** 0.009 (0.033) 0.023 (0.035) 0.021 (0.034)
Founder has managerial experience (y/n) 0.031 (0.014)** 0.059 (0.028)** 0.043 (0.030) 0.048 (0.029)*
Founder has entrepreneurial experience (y/n) 0.043 (0.015)*** 0.022 (0.028) 0.029 (0.031) 0.027 (0.029)
Years of industry experience -0.001 (0.001) -0.000 (0.002) 0.000 (0.002) -0.001 (0.002)
Number of dep. employees (log) - lag 0.006 (0.008) -0.023 (0.014) -0.017 (0.016) -0.017 (0.015)
Employees with tertiary edu. (share) - lag -0.000 (0.020) 0.118 (0.038)*** 0.146 (0.045)*** 0.127 (0.044)***
Equity capital in year of foundation 0.003 (0.035) 0.001 (0.049) 0.024 (0.064) 0.011 (0.056)
Limited liability 0.078 (0.019)*** 0.066 (0.048) 0.055 (0.037) 0.042 (0.035)
Firm age (log) -0.058 (0.016)*** -0.039 (0.030) -0.039 (0.034) -0.048 (0.033)
Stratification industry fixed effects Yes Yes
NACE 1-digit fixed effects
Yes
NACE 2-digit fixed effects
Yes
Year fixed effects and constant Yes Yes Yes Yes
N / Pseudo R-sq. 3699 / 0.14 3699 3699 3699
Notes: Marginal effects from probit models in Column A and B). Significance levels: *** 1%, ** 5%, * 10%. Cluster robust standard errors in parentheses. Baseline category for industry controls: high-tech manufacturing. Additional
control var. in all regressions: Funding by KfW bank.

39
Table 7: GMM-IV Estimation
Dependent variable: A B C
1st stage - lags 2nd stage - lags 2nd stage - no lags
Product innovation M.E. (S.E.) M.E. (S.E.) M.E. (S.E.)
Firm has middle management (y/n) - lag
0.370 (0.204)*
Firm has middle management (y/n)
0.247 (0.139)*
Executives involved in firms (same NACE-1 and district) 0.000 (0.000)*
Share of firms with middle manager (same NACE-1 and size class) 0.580 (0.138)***
Risk of business opportunity (log) 0.108 (0.131) 0.324 (0.190)* 0.083 (0.069)
R&D intensity (R&D/sales) - lag 0.038 (0.025) 0.215 (0.031)***
R&D intensity (R&D/sales)
0.204 (0.023)***
Number of Patents bef. foundation 0.000 (0.000)* 0.001 (0.001) 0.001 (0.001)
Number of R&D employees - lag 0.008 (0.012) 0.019 (0.014)
Number of R&D employees 0.017 (0.01)*
# Founders in team (log) 0.012 (0.017) 0.010 (0.018) 0.007 (0.014)
Founder with tertiary education (y/n) -0.001 (0.015) 0.051 (0.017)*** 0.052 (0.013)***
Equity capital in year of foundation 0.075 (0.042)* -0.014 (0.055) -0.004 (0.042)
Founder has managerial experience (y/n) 0.024 (0.012)** 0.022 (0.015) 0.02 (0.012)*
Founder has entrepreneurial experience (y/n) 0.013 (0.014) 0.037 (0.016)** 0.032 (0.012)**
Years of industry experience 0.000 (0.001) -0.001 (0.001) -0.001 (0.001)
Number of dep. employees (log) - lag 0.015 (0.012) -0.021 (0.015)
Number of dep. employees (log)
-0.004 (0.013)
Employees with tertiary edu. (share) - lag 0.043 (0.019)** -0.015 (0.023)
Employees with tertiary edu. (share)
-0.007 (0.019)
Full-time eq. empl. size at foundation (incl. founders) 0.000 (0.003) 0.002 (0.003) 0.000 (0.002)
Limited liability 0.032 (0.014)** 0.044 (0.018)** 0.053 (0.013)***
Firm age (log) 0.004 (0.014) -0.058 (0.018)*** 0.001 (0.009)
Technology-intensive services -0.024 (0.018) -0.116 (0.021)*** -0.091 (0.016)***
Software supply and consultancy -0.004 (0.025) -0.026 (0.030) -0.017 (0.023)
Skill-intensive services -0.002 (0.020) -0.113 (0.024)*** -0.082 (0.018)***
Year fixed effects and constant Yes Yes Yes
First stage F-statistic of instruments
10.45 20.75
First stage Hansen's J-Test p-value
0.106 0.511
N / (Pseudo) R-sq. 3699 / 0.10 3699 / 0.08 5847 / 0.09
Notes: Significance levels: *** 1%, ** 5%, * 10%. Cluster robust standard errors in parentheses. Baseline category for industry controls: high-tech manufacturing.
Additional control var. in all regressions: Funding by KfW bank.
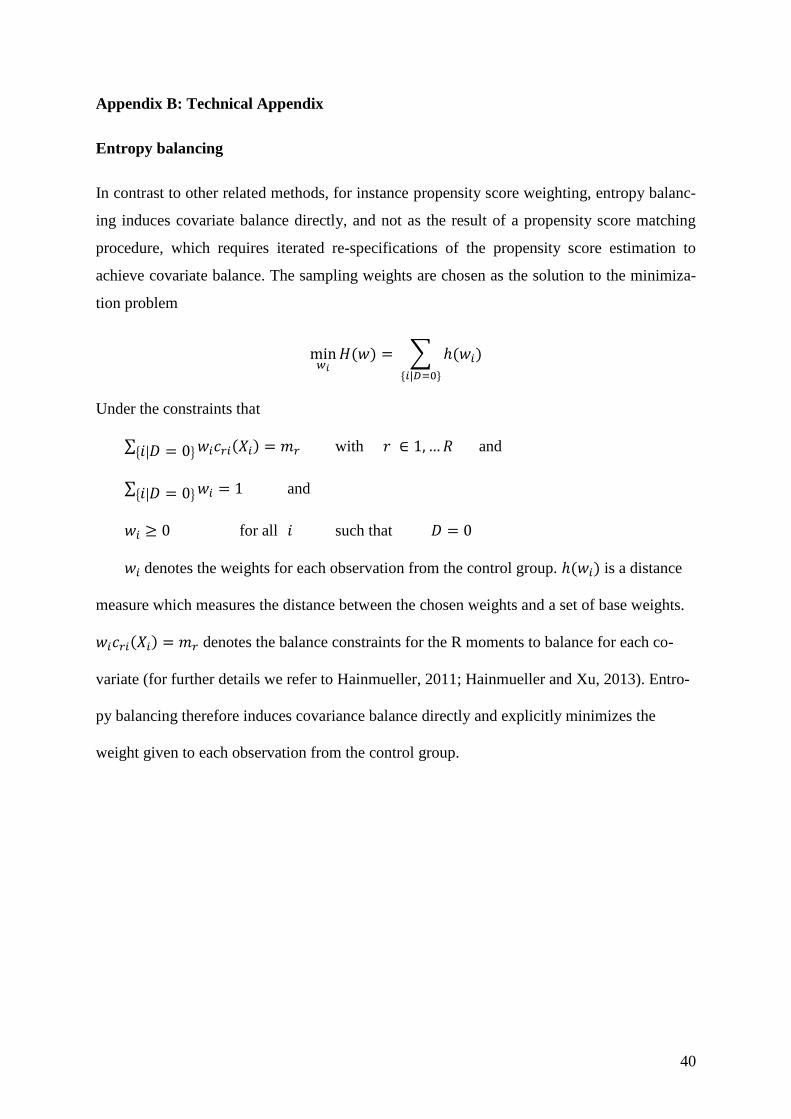
40
Appendix B: Technical Appendix
Entropy balancing
In contrast to other related methods, for instance propensity score weighting, entropy balanc-
ing induces covariate balance directly, and not as the result of a propensity score matching
procedure, which requires iterated re-specifications of the propensity score estimation to
achieve covariate balance. The sampling weights are chosen as the solution to the minimiza-
tion problem
min𝑤𝑖
𝐻(𝑤) = ∑ ℎ(𝑤𝑖)
{𝑖|𝐷=0}
Under the constraints that
∑ 𝑤𝑖𝑐𝑟𝑖(𝑋𝑖) = 𝑚𝑟{𝑖|𝐷 = 0} with 𝑟 ∈ 1, … 𝑅 and
∑ 𝑤𝑖 = 1{𝑖|𝐷 = 0} and
𝑤𝑖 ≥ 0 for all 𝑖 such that 𝐷 = 0
𝑤𝑖 denotes the weights for each observation from the control group. ℎ(𝑤𝑖) is a distance
measure which measures the distance between the chosen weights and a set of base weights.
𝑤𝑖𝑐𝑟𝑖(𝑋𝑖) = 𝑚𝑟 denotes the balance constraints for the R moments to balance for each co-
variate (for further details we refer to Hainmueller, 2011; Hainmueller and Xu, 2013). Entro-
py balancing therefore induces covariance balance directly and explicitly minimizes the
weight given to each observation from the control group.