the origin of the hum - lmu
TRANSCRIPT

The Origin of the Hum
Toshiro TanimotoVisiting Fellow, CAS, LMU
UCSB

Menu
1. The (Historical) Origin of the Hum (Study)
2. Development of our understanding
3. Questions

Background Towards Understanding Seismic Noise
1.0e-04 1.0e-03 1.0e-02 1.0e-01 1.0 10.01.0e-20
1.0e-19
1.0e-18
1.0e-17
1.0e-16
1.0e-15
1.0e-14
1.0e-13
Frequency (Hz)
Acc
eler
atio
n PSD
(m**
2/s*
*3)
NLNM (Peterson 1993)
Atmosphere
Microseism

From Google Books

1.0e-04 1.0e-03 1.0e-02 1.0e-01 1.0 10.01.0e-20
1.0e-19
1.0e-18
1.0e-17
1.0e-16
1.0e-15
1.0e-14
1.0e-13
Frequency (Hz)
Acc
eler
atio
n PSD
(m
**2/
s**3
)
NLNM (Peterson 1993)
Atmosphere
MicroseismWWSSN Short Period
WWSSNLong Period

Acceleration power spectral densities for 56 h long records of the STS-1 seismometers at station BFO. Solid lines labelled Z, EW and NS are from the corresponding components for the
very quiet 56 h interval starting 2004 September 29, 0:00:00 GMT. Note the large difference between the vertical and horizontal components.
Zürn W , and Wielandt E Geophys. J. Int. 2007;168:647-658
© 2006 The Authors Journal compilation © 2006 RAS

Four Papers in 1998
1. Nawa et al., Earth, Planets and Space, 1998Superconducting gravimeter at Showa Stationin Antarctica
2. Suda, Nawa, and Fukao, Science, 1998IDA (gravimeter)
3. Kobayashi and Nishida, Nature, 1998Theory (planetary applications)
4. Tanimoto, Um, Kobayashi, Nishida, GRL, 1998IDA
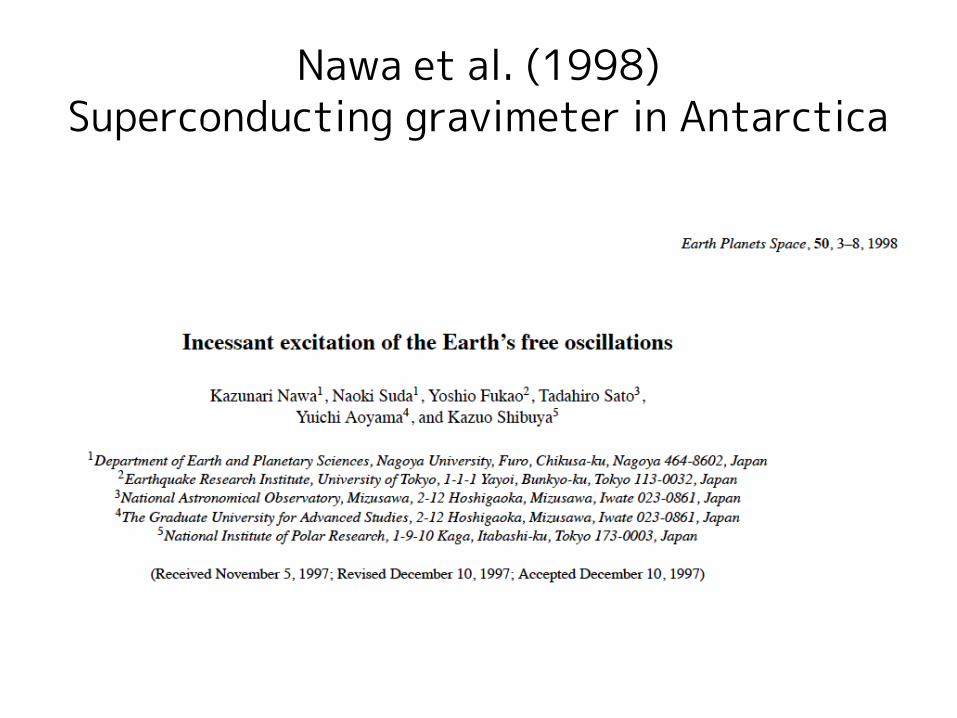
Nawa et al. (1998)Superconducting gravimeter in Antarctica

Nawa et al. (1998)Superconducting gravimeter at Showa, Antarctica

Suda, Nawa, Fukao (1998)
Data
Synthetic
Data (IDA)

3

Excitation by Random Pressure SourceKey : the correlation length () in pressureThis nature paper assumed that ~ Scale height of atmosphere (8.7km)
Observation indicates ~ 1 km or less,thus the estimates were too large.


0.276 0.300 0.324 0.347 0.371 0.395 0.418 0.442 0.466 0.489 0.513
Acc
eler
atio
n (n
gal)
3.0 4.0 5.0 6.0
Frequency (mHz)
0 S
25
0 S
30
0 S
35
0 S
40
0 S
45
0 S
50
0.276
0.486
0.695
0.904
1.114
1.323
1.532
1.742
1.951
2.160
2.370
Acc
eler
atio
n (n
gal)
Quiet_Days
1.0 2.0 3.0 4.0 5.0 6.0 7.0 8.0 9.010.0
HRV (STS1)
0 S
10
0 S
15
0 S
20
0 S
25
0 S
30
0 S
35
0 S
40
0 S
45
0 S
50
0 S
55
0 S
60
0 S
65
0 S
70
0 S
75
0 S
80
0 S
85
0 S
90
0 S
95
Figure 1

0.10
0.30
0.50
0.70
0.90
1.10
1.30
1.50
1.70
1.90
2.10
Acc
eler
atio
n (n
gal)
1.0 2.0 3.0 4.0 5.0 6.0 7.0
CAN
0 S
10
0 S
15
0 S
20
0 S
25
0 S
30
0 S
35
0 S
40
0 S
45
0 S
50
0 S
55
0 S
60
0 S
65
0.10
0.30
0.50
0.70
0.90
1.10
1.30
1.50
1.70
1.90
2.10
Acc
eler
atio
n (n
gal)
1.0 2.0 3.0 4.0 5.0 6.0 7.0
Frequency (mHz)
KIP0
S 1
0
0 S
15
0 S
20
0 S
25
0 S
30
0 S
35
0 S
40
0 S
45
0 S
50
0 S
55
0 S
60
0 S
65

IDA Geoscope


We started to work on the hum because
1.Justify the installment of a superconducting gravimeter in Antarctica. They needed (wanted) to justify their big investiment.
2.Dream for planetary applicationsGet planetary interior of a
non-tectonic planet.


Is the excitation source in the solid earth or in the atmosphere/ocean ?
• Claims of slow earthquakes (e.g., Beroza and Jordan, 1990).
• Something like tremor may excite them.
• The key is in detection of seasonality.

0 . 2 0
0 . 2 4
0 . 2 8
0 . 3 2
0 . 3 6
0 . 4 0
0 . 4 4
0 . 4 8
0 . 5 2
0 . 5 6
0 . 6 0
Acc
eler
atio
n (n
gal)
3 . 0 4 . 0 5 . 0
F r e q u e n c y ( m H z )
P A S
0 S
20
0 S
25
0 S
30
0 S
35
0 S
40

0.000
0.200
0.400
0.600
0.800
1.000
1.200
1.400
1.600
1.800
2.000
Ave
rage
Mod
al A
mpl
itude
(nga
l)Signal
max=130
Noise
max=194
90 91 92 93 94 95 96
PAS (Average 0S20 0S40)

0.000 1.094 2.187 3.281 4.375 5.468 6.562 7.656 8.750 9.843 10.937
Sign
al
1.0 2.0 3.0 4.0
Background Oscillations (PAS)
0.95
0.000 1.362 2.724 4.086 5.448 6.810 8.172 9.534 10.896 12.258 13.620
Noi
se
1.0 2.0 3.0 4.0
Frequency (cycles/year)
Noise
0.95
0.99
Figure 3a: Lomb analysis of data between 0.2 and 0.6 ngal in Figure 2.Six months periodicity in signal are clear in the top figure.

Ekstrom, JGR, 2001On seismically quiet days, equivalent Rayleigh-waves for M~5.8 are circulating around the globe.
Periodicity in the stack is dominated by 6-months periodicity

Seismic Data and SWH

What would create 6-months periodicity?
Obviously both atmosphere and ocean could.
My eureka moment was1. The oceans can cause large pressure cha
nges.2. The atmosphere : pressure change is < 1
0% The correlation length is small.

My eureka moment

Rhie and Romanowicz, Nature, 2004


Traer, Gerstoft, Bromirski & Shearer, JGR 2014
Beam azimuth and SWH Correlation NH Winter
SH Winter

Interactions of Ocean Waves with Sea Bottom(Scattering of Ocean Waves into Love Waves)
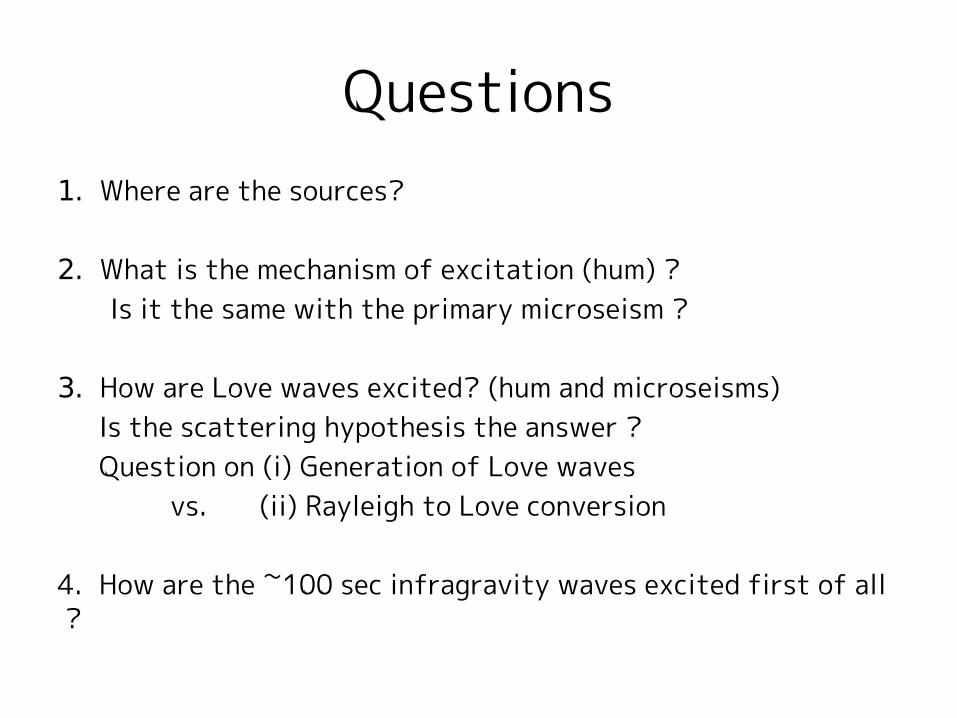
Questions1. Where are the sources?
2. What is the mechanism of excitation (hum) ? Is it the same with the primary microseism ?
3. How are Love waves excited? (hum and microseisms)Is the scattering hypothesis the answer ?Question on (i) Generation of Love waves
vs. (ii) Rayleigh to Love conversion
4. How are the ~100 sec infragravity waves excited first of all ?


Notion : Rayleigh waves are constantly circulating the Earth.
1.0e-04 1.0e-03 1.0e-02 1.0e-01 1.0 10.01.0e-20
1.0e-19
1.0e-18
1.0e-17
1.0e-16
1.0e-15
1.0e-14
1.0e-13
Frequency (Hz)
Acc
eler
atio
n PSD
(m**
2/s*
*3)
NLNM (Peterson 1993)
Atmosphere
Microseism

Questions1. Where are the sources?
2. What is the mechanism of excitation (hum) ? Is it the same with the primary microseism ?
3. How are Love waves excited? (hum and microseisms)Is the scattering hypothesis the answer ?Question on (i) Generation of Love waves
vs. (ii) Rayleigh to Love conversion
4. How are the ~100 sec infragravity waves excited first of all ?

Hurricane Sandy(October, 2012)