the origins of lactase persistence and ongoing convergent ...€¦ · the origins of lactase...
TRANSCRIPT

THE ORIGINS OF LACTASE PERSISTENCE AND ONGOING CONVERGENT EVOLUTION
by
BETH A. KELLER B.S. University of Phoenix, 2003
A thesis submitted in partial fulfillment of the requirements for the degree of Master of Arts
in the Department of Anthropology in the College of Sciences
at the University of Central Florida Orlando, Florida
Spring Term 2011

ii
ABSTRACT
As a primary factor in human evolution, natural selection is an important
component of genetic research. Studies of lactase persistence suggest that positive
selection has played a powerful role in the adaptation to a lifelong consumption of fresh
milk. Using multiple research studies of lactase persistence and suspected
corresponding single nucleotide genetic polymorphisms, this study combines data
sources to determine whether evidence exists for natural selection of a specific
cytosine-to-thymine genetic mutation located 13,910 base pairs (T-13910) upstream
from the lactase gene. This polymorphism has potential to be a causal element for
lactase persistence, and data suggest that natural selection has played a role in the
rising frequency and distribution of this allele, if only in some regions. European and
neighboring regions appear to have the highest frequencies with little or no frequency in
Asia, Africa and Indonesia; however the presence of lactase persistence in those areas
suggests convergent evolution may be occurring on a phenotypic level. To examine this
possibility several other identified polymorphisms in the same region as the T-13910 will
be included in this study.

iii
Dedicated to my wonderful family whose
encouragement made all the difference.

iv
ACKNOWLEDGMENTS
I would like to thank my committee members, Dr. McIntyre, Dr. Dupras and Dr.
Walker for their time and assistance in the writing of this thesis, as well as the excellent
coursework they provided during my graduate career that gave me the knowledge and
ability to do so. I would like to extend a special thank you to my advisor, Dr. McIntyre,
who has been instrumental in guiding me through the process of conducting and
understanding statistical analyses.

v
TABLE OF CONTENTS
LIST OF FIGURES ......................................................................................................... vii
LIST OF TABLES .......................................................................................................... viii
CHAPTER 1: INTRODUCTION ....................................................................................... 1
Research questions and hypothesis ............................................................................ 2
Material sources ........................................................................................................... 2
Analysis strategy .......................................................................................................... 3
CHAPTER 2: THE BASICS OF LACTOSE AND LACTASE ........................................... 4
The roles of lactose and lactase in mammalian growth and development ................... 5
Sources of lactase nonpersistence .............................................................................. 6
Health effects of milk .................................................................................................... 9
Lactose structure, function and formation .................................................................. 10
The lactase gene ....................................................................................................... 15
CHAPTER 3: NATURAL SELECTION .......................................................................... 18
Distinguishing natural selection from demographic influences ................................... 18
Identifying natural selection for lactase persistence ................................................... 20
Theories of lactase persistence expansion ................................................................ 22
Identification of lactase persistence mutations ........................................................... 25
CHAPTER 4: ARCHAEOLOGICAL DATA .................................................................... 28
Methods of detecting domestic animal strategies ...................................................... 28
Dairy residue studies ................................................................................................. 30
Development of animal domestication ....................................................................... 32
vi
CHAPTER 5: MATERIALS AND METHODS ................................................................ 33
Haplotype distribution ................................................................................................ 33
Additional regional polymorphisms ............................................................................ 34
Data adjustments ....................................................................................................... 34
Regional designations ................................................................................................ 38
Hardy Weinberg equilibrium ....................................................................................... 38
Methods of testing lactose metabolism in included studies ........................................ 39
Methods of DNA sampling in included studies ........................................................... 41
Statistical evaluations ................................................................................................ 41
Full data set analysis ................................................................................................. 45
Revised data set analysis .......................................................................................... 47
Additional polymorphisms analyzed ........................................................................... 50
Mapping analyses ...................................................................................................... 56
CHAPTER 6: CONCLUSIONS ...................................................................................... 64
LITERATURE CITED .................................................................................................... 69

vii
LIST OF FIGURES
Fig. 1: Alpha and beta glucose molecules. .................................................................... 11
Fig. 2: (2a) glucose molecule, (2b) galactose molecule and (2c) lactose formation. ..... 12
Fig. 3: Chromosome 2 with marked location of the Lactase Gene ................................ 15
Fig. 4: MCM6 gene and associated polymorphisms: C-14010, G-13915, T13910 and
G13907. ........................................................................................................................ 17
Fig. 5: Histograms exhibiting the frequency distributions for T-13910 and lactase
persistence. ................................................................................................................... 43
Fig. 6: Revised histograms exhibiting the frequency distributions for T-13910 and
lactase persistence based on regional sections. ........................................................... 47
Fig. 7: T-13910 frequency distribution. .......................................................................... 58
Fig. 8: T-13910 frequency gradient. .............................................................................. 58
Fig. 9: A-22018 frequency distribution. .......................................................................... 59
Fig. 10: C-14010 frequency distribution. ........................................................................ 60
Fig. 11: G-13915 frequency distribution. ....................................................................... 61
Fig. 12: G-13907 frequency distribution. ....................................................................... 61
Fig. 13: C-13913 frequency distribution. ........................................................................ 62
Fig. 14: Lactase persistence frequency distribution. ..................................................... 63
Fig. 15: Lactase persistence frequency gradient. .......................................................... 63

viii
LIST OF TABLES
Table 1: Lactose presence in various dairy products ...................................................... 8
Table 2: Combined data records. .................................................................................. 35
Table 3: Geographical location estimates and sources for latitude and longitude. ........ 37
Table 4: One-Sample Kolmogorov-Smirnov test for the full data set. ............................ 44
Table 5: Mann-Whitney test at 0% or > 0% ................................................................... 45
Table 6: Mann-Whitney test at ≤ 5% or > 5% ................................................................ 46
Table 7: Spearman’s rho correlation between T-13910 and lactase persistence. ......... 46
Table 8: One-Sample Kolmogorov-Smirnov test for the revised data set. ..................... 48
Table 9: One-Sample T-test for revised data set ........................................................... 49
Table 10: Paired Samples T-test for the revised data set .............................................. 49
Table 11: Pearsons Correlation between T-13910 and LP in the revised data set. ....... 50
Table 12: Data samples of the C-14010 polymorphism................................................. 52
Table 13: C-14010 regression / correlation analysis. .................................................... 52
Table 14: Data samples of the G-13915 polymorphism. ............................................... 53
Table 15: G-13915 regression / correlation analysis. .................................................... 53
Table 16: Data samples of the G-13907 polymorphism. ............................................... 54
Table 17: G-13907 regression / correlation analysis. .................................................... 54
Table 18: Data samples of the C-13913 polymorphism................................................. 55
Table 19: C-13913 regression / correlation analysis. .................................................... 55
Table 20: A-22018 regression / correlation analysis. .................................................... 56
1
CHAPTER 1: INTRODUCTION
The evolutionary process of human adaptation is an important premise of the
study of physical anthropology. Understanding the role of natural selection as one of the
key forces in adaptation is essential to determining the causes of diversity in the human
species. The idea that we may have a recently evolved phenotypic adaptation, lactase
persistence, which developed under tremendous selective pressure warrants a much
closer examination. The forces behind this pressure most likely lie in a combination of
natural and cultural adaptive processes that collectively fall under the umbrella of
natural selection.
All mammals are capable of lactation, allowing a greater period of growth and
development for offspring after birth. Lactose sugar is an excellent source of energy and
is used to spur this postnatal development in nearly all mammals. The lactase enzyme
required to digest the lactose sugar is produced in the intestinal tract of the human child
until approximately 5 years of age, at which time it begins to taper off (Montgomery et
al., 2007). When this downregulation of lactase does not occur, the individual is said to
be “lactase persistent” (LP) (Swallow, 2003). People who are lactase persistent are able
to digest milk products throughout adulthood.
Studies in the last two decades have increasingly addressed the existence of
lactase persistence, and questions pertaining to the origin and cause of persistence
have attracted a great deal of attention. Some of the research has revealed single
nucleotide polymorphisms (SNP’s) that appear to be causal, particularly a
polymorphism referred to as T-13910 due to its location 13,910 base pairs upstream

2
from the gene that codes for lactase (LAC or LCT gene) (Swallow, 2003). This study will
focus mainly on the T-13910 allele as a potential causal element in lactase persistence,
while also determining its origin and spread, addressing the role of natural selection in
this process. The possibility of convergent evolution in regions that do not exhibit the T-
13910 SNP will also be examined.
Research questions and hypothesis
Three general research areas will be addressed. The first considers whether
current studies indicate that lactase persistence is caused by different genetic mutations
in different populations, generally located in separate geographical regions. The second
examines the relationship between lactase persistence and the development of dairy
consumption. The third examines the role of natural selection in the expansion of
lactase persistence. If the research indicates the T-13910 mutation evolved under
selective pressure, we can use it to predict lactase persistence in European
populations. However, in African and Asian populations this allele does not appear at a
high enough frequency to predict the persistence found in some populations of nomadic
pastoralists, therefore the results should also indicate whether possible convergent
evolution exists for this phenotypic trait.
Material sources
Most of the background source material used for this thesis will consist of peer-
reviewed articles published by experts in this field. Research studies contained in these
publications will be analyzed collectively to expose any consistencies or inconsistencies
that may indicate convergent evolution or, alternatively, genetic drift. Statistical analyses

3
will be conducted to reveal correlations between lactase persistence and suspected
causal polymorphisms, particularly the T-13910 mutation. Should this mutation not
appear to associate with lactase persistence in African and Asian populations, we will
need to consider the possibility of phenotypic convergent evolution and examine other
potential polymorphisms.
Analysis strategy
Using data from previous studies a comparison and analysis will be conducted
across populations. The main focus will be the correlation of lactase persistence with
the T-13910 SNP. Other researched polymorphisms will be briefly analyzed for
additional correlations. These additional polymorphisms include A-22018, C-14010, G-
13915, G-13917 and C-13913. This type of meta-analysis should reveal convergent
evolutionary trends between Europe, Africa and Asia.
Analyses of data contained in published studies will be used to determine the
most likely area of the origination of persistence. This can be compared to
archaeological evidence of dairy consumption across the European region with the T-
13910 mutation to indicate whether selective pressure was probably occurring in
relationship to milk-consumption.
Frequency and gradient maps can be created between the T-13910 SNP,
persistence and dairy consumption using ArcGIS and Mapviewer. This will allow for
visualization of the evolution of persistence in Europe. Additional correlation maps may
be included to examine the geographical relationship between the other polymorphisms
included in this study and the evidence of lactase persistence outside of Europe.
4
CHAPTER 2: THE BASICS OF LACTOSE AND LACTASE
Most of us are already familiar with the term “lactose” and have been for much of
our lives. Although today lactose is found in many types of commonly ingested
substances, we are generally led to equate it with milk and other dairy products since
lactose is the basic carbohydrate found in milk (Hollox et al., 1999). Human milk
contains approximately 72 g of lactose per liter, and cow’s milk (which is consumed by
adults in many societies) about 47 g per liter (Lomer et al., 2008). The overall taste,
while far less sweet than sucrose and about half as sweet as glucose, has a hint of
sweetness, adding an overall palatability in addition to its value as a carbohydrate
energy source.
Lactose is a disaccharide consisting of the bonded sugar molecules glucose and
galactose. Though found minutely in a variety of natural sources, lactose is present in
large quantities in most mammalian milk, reaching as high as 75 g per liter in some
species, with humans in the highest production range (Campbell et al., 2009; Lomer et
al., 2008). As a common component of dairy products, the lactose sugar offers an
excellent nutritional advantage to humans, particularly cultures that have domesticated
high volume milk-producing animals.
Lactase is found in the mammalian small intestine and is the enzyme responsible
for processing the lactose sugar found in the milk. The enzyme projects from the brush
border of the intestinal lining into the lumen, where it can attach to and hydrolyze
ingested lactose (Swallow, 2003). The lactase, also known as a β-galactosidase for its
ability to hydrolyze a disaccharide, breaks down the lactose through hydrolysis into its

5
separate sugar molecules, providing a usable source of nutrition for the mammalian
organism (Swallow, 2003; Hollox, 1999).
The roles of lactose and lactase in mammalian growth and development
Lactose and lactase molecules are key components of mammalian growth and
survival. Nearly all newborn mammals rely completely on mother’s milk containing the
lactose disaccharide for the first part of life, necessitating the lactase enzyme to
separate the sugars for absorption into the bloodstream from the small intestine
(Swallow, 2003). This lactose-lactase molecular codependency exists only in
mammalian species. Once the sugars are divided into the monosaccharides glucose
and galactose, they can be easily absorbed into the blood to provide a carbohydrate
form of energy during the newborn and infancy stages of life. During late infancy the
young are gradually weaned from mother’s milk as they become reliant on the natural
food sources of the species. This reduction in milk consumption, and therefore dietary
lactose, generally coincides with a decline in lactase production as well. While the terms
“nonpersistence” or “impersistence” denotes this reduction of lactase in humans,
“lactose intolerance” refers to the gastrointestinal symptoms caused by the inability to
digest lactose (Wiley, 2004).
Throughout fetal development the levels of lactase increase, peaking in humans
at about 34 weeks of gestation (Lomer et al., 2008). Levels remain high until weaning
for most mammals, at which time they decline rapidly to a minimal presence (Swallow,
2003). Humans, however, currently exhibit delayed or nonexistent reduction of lactase
in some populations, leading to investigations of the development of lactase
6
persistence. This persistence allows many people to continue producing high levels of
lactase throughout their lifetimes.
The actual correlation of milk products with the symptoms of intolerance were
first noted by Hippocrates over 2,000 years ago (Campbell et al., 2009). Up until the late
1960’s, however, the common belief regarding lactase persistence was that it was the
normal biological process (Wiley, 2004). Studies conducted during this time period
indicated this was incorrect, concluding that nonpersistence was normal. These studies
revealed the chemical process that led to intolerance and the ethnic relationships
among populations (Campbell et al., 2009). Eventually the realization that the difference
was genetically determined became the accepted theory.
Sources of lactase nonpersistence
Lactase nonpersistence in humans is due to one of three main sources:
congenital, primary or secondary. Congenital hypolactasia is evident at birth and
exhibits the lowest level of lactase activity (Lomer et al., 2008). Primary hypolactasia is
a result of the normal downregulation upon weaning. Secondary hypolactasia occurs
following intestinal damage caused by an illness, virus, trauma or infection. Congenital
and secondary hypolactasia are less common than primary and are not relevant to the
downregulation function of the lactase gene. Primary hypolactasia is the main focus
from an anthropological point of view of examining adaptive mutational frequencies
guided by selective pressures.
Congenital Lactase Deficiency. Human babies born with little or no functional
lactase, Congenital Lactase Deficiency (CLD), are generally subject to dehydration and

7
malnutrition due to the inability to digest the mammalian milk (Torniainen et al., 2009). It
has been discovered that many mutations that lie within the lactase gene itself lead to
the inability to produce more than a trace of lactase, suggesting that any coding change
to the lactase gene will most likely result in a severe reduction or complete lack of the
lactase enzyme. The effects of normal downregulation after weaning actually leave
much more lactase action in the intestine than CLD.
Primary lactase deficiency. The natural reduction of lactase in the human
intestine can lead to digestion difficulties when consuming lactose, especially in the high
quantities found in fresh dairy products (Table 1). As the bacteria existing within the
colon ferments the undigested lactose, many people who are lactase nonpersistent
experience extremely uncomfortable symptoms (Ingram et al., 2009a). Water travels
from the body into the intestinal lumen and various gasses and fatty acids are released
leading to bloating, diarrhea, flatulence and general abdominal discomfort. People who
experience these symptoms due to lactose consumption are said to be “lactose
intolerant.” Though these symptoms are extremely uncomfortable in contemporary
Homo sapiens sapiens, they may be more serious or fatal for less well-nourished or
healthy individuals due to dehydration and weakness. Furthermore, the calories
consumed from the milk remain predominantly unavailable, providing little or no
nutritional benefit.

8
Table 1: Lactose presence in various dairy products
Food* Lactose % by Weight
Human milk 7.2 Horse milk 6.5 Ice cream – vanilla 5.2 Sheep milk 5.1 Processed Cheese Slices 5.0 Yak milk 4.9 Cow milk – Skimmed 4.8 Yogurt – plain 4.7 Cow milk – Whole 4.6 Goat milk 4.4 Cottage cheese 3.1 Sour cream 2.7 Kurut 2.2 Feta cheese 1.4 Cheddar cheese 0.1 Mozzarella cheese Trace Edam/gouda cheese Trace Cream cheese Trace
*Fermented products have less lactose due to microbial breakdown of the molecules.
(Lomer et al., 2008; McKinnon and Voss, 1993; Swallow, 2003; Wu et al., 2009)
Secondary lactase deficiency. Secondary hypolactasia is most commonly
associated with intestinal issues such as giardiasis, coeliac disease, cow milk allergies
or viral infections (Lomer et al., 2008; Crittendon & Bennett, 2005; Campbell et al.,
2009). Though the symptoms are the same as primary hypolactasia, this type is usually
reversible once the root cause is diagnosed and corrected (Lomer et al., 2008). As with
primary hypolactasia, secondary usually still allows for a greater lactase production than
CLD.

9
Health effects of milk
Attempts have also been made to associate numerous other pathologies with
lactose intolerance, lactase persistence or lactase nonpersistence. Lactase activity was
found to increase in diabetics, indicating a possible risk factor, although an association
with lactase persistence genotypes could not be established (Enattah et al., 2004).
Correlations between increased consumption of dairy foods and colorectal cancer
mortality, supported by an inverse relationship between the cancer and lactase
nonpersistence, suggests a potential connection as well (Szilagyi et al., 2006). Loss of
bone density from insufficient calcium intake due to lactase nonpersistence has been
tentatively put forth (Laaksonen et al., 2008). Bladder cancer in a Japanese study
showed a reduced risk by intake of fermented milk (Salminen et al., 2004). Breast,
ovarian, prostate, lung and stomach cancers, Crohn’s disease, colitis and more have all
been closely studied in an effort to discover lactose and lactase correlations (Shrier et
al., 2008).
Alternatively, when included as a nutritional component of a human diet, dairy
products, especially fresh milk, can provide calcium, vitamins (A, B group, C),
phosphorus, magnesium, zinc and even a small amount of essential fatty acids (Shortt
et al., 2004). The nutrients found in dairy, especially calcium, can help increase bone
density and avoid weakening and fracturing of bone material later in life. For example,
the calcium content per 100 g of fresh milk is 119 mg, yogurt 121 mg, and cheddar 729
mg (Kitts & Kwong, 2004). In addition, symptoms of lactose intolerance can generally be
avoided by consuming only small quantities of dairy products, especially fresh milk.

10
Fermented dairy also tends to have less actual lactose due to bacterial action (Salminen
et al., 2004). This makes items, such as yogurt and cheese, more tolerable than milk to
individuals with little lactase activity, enabling them to take advantage of the nutritional
value of dairy products.
Lactose structure, function and formation
Carl Scheele began research on lactose in the late 1700’s (Fox, 2009) and we
now have an extensive knowledge of its molecular structure and function. Lactose is a
disaccharide, or double sugar, consisting of a glucose and a galactose molecule
(Swallow, 2003). The combined monosaccharides form a compound molecule designed
in most mammals to provide a sustaining food source through mother’s milk until the
young are old enough to survive on the normal food substance of the species. The
glucose provides energy, while the galactose is used in forming glycolipids and
glycoproteins used in other biological functions (Lomer et al., 2008). The lactose
carbohydrate found in mammalian milk “provides an excellent source of energy at a
time of rapid growth and development” (Lomer et al., 2008).
Lactose is often used as filler in pharmaceuticals and processed foods (Lomer et
al., 2008). It may also be used as a browning agent, an emulsifier or a bulking agent.
Bread, processed meats, soft drinks and lager beers may all contain lactose. In the
United States alone lactose production increased from 50 million kg per year in 1979 to
300 million kg per year in 2004.
Lactose is found in combination with polysaccharides, glycoproteins and
glycolipids throughout the natural world (Campbell et al., 2009). Free lactose, however,

11
is mainly found in mammalian milk in a combination of alpha and beta forms. α-lactose
is different from β-lactose in the placement of the –OH on Carbon 1 in relation to
Carbon 6 of the glucose molecule leading to a change in the rotation of the molecule
(Fox, 2009). The alpha version exhibits the –OH on the opposite side of the molecular
ring, while beta is on the same side as Carbon 6 (Fig. 1).
Lactose is a reducing sugar with an aldehyde group that allows a ring structure to
form and open, interchanging between alpha and beta versions (Fox, 2009). This
mutarotation leads to a fluctuating ratio of concentrations between the two versions
based on the effects of temperature and acidity (Choi, 1958). The two isomers of
lactose have different rotation and solubility properties, with β-lactose being more
soluble, as well as slightly sweeter (Choi et al., 1949; Fox, 2009).
The glucose and galactose molecules are both sugars and therefore have similar
atomic structures (Sinnott, 2007). The basic structure of the glucose ring consists of 5
Carbon atoms and 1 Oxygen atom bonded in a closed circle. Several Hydrogen and –
OH groups as well as a sixth Carbon atom extend from this basic ring (Fig. 2a). The
galactose molecule is also based on a carbon ring with a slightly different atomic
Fig. 1: Alpha and beta glucose molecules.
H
H
O OH
OH
O
Glucose Molecule,
α-version
Glucose Molecule,
β-version
C6H2OH C6H2OH
C1 C1

12
structure (Fig. 2b). The two molecules form a bond at the Oxygen atom that extends
from Carbon 1 with a β1,4 glycosidic bond to create the lactose disaccharide (Fig. 2c).
In an interesting twist, the galactose molecule used in lactose is actually a
converted molecule of glucose (Fox, 2009). Other than the minor assistance in
glycolipid and glycoprotein production, it is not yet known why this conversion occurs
since it costs energy to conduct this process, however the supposition is that there is a
yet-to-be-found benefit to supplying lactose in milk, as opposed to maltose which
consists of two glucose molecules. It is possible that there may be some relation to the
maintenance of osmotic pressure. Lactose maintains enough pressure to keep
mammalian milk at a usable viscosity. However, mammals in northern climates have
little or no lactose, so they require adequate concentrations of inorganic salts to perform
the same function in place of the missing lactose. Therefore an inverse relationship is
also seen between lactose and inorganic salts in mammalian milk.
2a.
Fig. 2: (2a) glucose molecule, (2b) galactose molecule and (2c) lactose formation. (2a, 2b) http://www.azaquar.com/en/iaa/index.php?cible=ca_glucides
(2c) http://image.wistatutor.com/content/feed/tvcs/sugar20bond.gif
2c. 2b.

13
Lactation begins in the mammary gland in late pregnancy. Lactose is
synthesized in the epithelial cells of the mammary gland and appears in mammalian
milk directly and inversely proportionate to lipid concentration of the milk (Fox, 2009).
Lipids are another source of energy contained in milk, and they provide twice the energy
of lactose sugar. For this reason, mammals in colder climates generally have little or no
lactose but do have high lipid concentrations in their milk. This includes sea lions, polar
bears, seals and walruses.
Prior to the branching off of the first mammals, a non-mammalian housekeeping
gene that produced the enzyme designated β1,4-galactosyltransferase (β4GalT-I) in
vertebrates was recruited for the synthesis of lactose (Shaper et al., 1998). Research
shows that β1,4-galactosyltransferase is a glycoprotein that is the precursor to lactose
production in mammals (Shaper et al., 1997). Additional changes to the gene producing
this enzyme eventually led to the specific cellular function of lactose production. Thus
lactation became possible, leading to the genesis of the mammalian branch.
The β1,4-galactosyltransferase enzyme is also found in certain plant species,
indicating the presence of the gene can be dated to before the divergence of animals
about 1 billion years ago (Shaper et al., 1998). β1,4-galactosyltransferase is a common
glycoprotein in the vertebrate system designed to catalyze galactose into biologically
usable glycolipids and glycoproteins (Rajput et al., 1995). The β4GalT-I gene is
generally considered a “housekeeping” gene, particularly in light of the high level of
saturation of this enzyme throughout the vertebrate cellular structure. In mammals and
14
mammals alone, the same gene that codes for β4GalT-I was enlisted to perform the
vital function of lactose production in the mammary gland.
Lactose production begins as the β4GalT-I enzyme joins with α-lactalbumin to
form lactose synthetase (a protein heterodimer) (Rajput et al., 1995). Exon 1 of the
β4GalT-I gene (as shown in both murine and bovine species) contains two separate
start sites for RNA transcription. The protein formed by using the first start site (4.1 kb)
is found in all somatic cells, and is the main form used in all cells except those of the
lactating mammary gland. In this gland the second start site at 3.9 kb becomes
dominant, indicating its functional role in lactose biosynthesis. Each version of mRNA is
transcribed based on specific and complex sequences of promoters for tissue-specific
or housekeeping functions. It is also theorized that in nonmammary gland cells an active
down-regulation occurs to the tissue-specific 3.9 kb protein, possibly by the GCBF
protein which exists in large quantities in somatic tissues with low levels of mRNA
production.
Control of the production of lactose in milk appears to be mainly based on the
amount of available α-lactalbumin (Fox, 2009). α-lactalbumin is only created in the
epithelial cells of the mammary gland (Rajput et al. 1995). An increase in β4GalT-I
enzymes in these cells occurs in mid-pregnancy, stimulating lactose production.
Hormone levels of insulin, prolactin and hydrocortisone also play key roles in the
regulation of lactose production.

15
The lactase gene
The Lactase gene, often designated as either LAC or LCT, occupies
approximately 50 kb on the long arm (q) of Chromosome 2, on the long arm (q), reverse
strand (Campbell et al., 2009; Swallow, 2003). The location is formally referred to as
2q21 (Fig. 3). The gene contains 17 exons and transcribes to an mRNA section of 6,274
bases, which is reduced to a pre-proprotein of 1,927 amino acids. Following two
separate cleavages and glycosylation the resulting protein contains 1,059 amino acids.
Fig. 3: Chromosome 2 with marked location of the Lactase Gene. Genecards version 3, http://www.genecards.org/pics/loc/LCT-gene.png
The production of lactase from this gene is naturally downregulated following
weaning, however it remains active on a small scale for a specific biological purpose.
The lactase enzyme contains a second site that is a competitive inhibitor of the lactase,
designed to hydrolyze an aryl glycoside known a phlorizin (Campbell et al., 2009).
Phlorizin was originally discovered in apple bark, and is made up of molecules of
glucose and phloretin, a glucose transport inhibitor.
Individuals who retain normal or nearly normal function of the lactase gene
without downregulation of production are considered persistent. The cause of lactase
persistence does not appear to come from within the LCT gene itself, but rather within a
maintenance gene located directly before the LCT gene. Some of the key genetic
polymorphisms associated with lactase persistence are in the neighboring MCM6
(Minichromosome Maintenance 6) gene. This gene is part of a complex associated with

16
DNA helicase activity and (in conjunction with MCM genes 2, 3, 4, 5, and 7) is
responsible for the initiation of DNA replication by unwinding the DNA strands (You et
al., 1999). MCM6 occupies 36 kb containing at least 43 SNP’s and 9 insertion/deletions
(Enattah et al., 2002). Combined information for linkage disequilibrium,
haplotype/geographic association and correlations with persistence led to the
conclusion that the T-13910 and A-22018 were strongly associated with, if not causal
for, lactase persistence in Europe (Harris and Meyer, 2006). Further studies have
identified additional SNP’s that appear to associate with persistence in other areas of
the Old World as well, all residing within the MCM6 gene (Fig. 4). Subsequent in-vitro
studies support these elements as causal through transcription enhancement by
promoting the binding of the Oct-1 transcription factor, a protein responsible for initiating
lactase production (Ingram et al., 2007; Ingram et al., 2009a; Olds et al., 2011).

17
Fig. 4: MCM6 gene and associated polymorphisms: C-14010, G-13915, T13910 and G13907.

18
CHAPTER 3: NATURAL SELECTION
Determining the effects of natural selection on the human genome is a
complicated process. It is estimated that 4 non-synonymous mutations arise in the
human genome in each generation (Bamshad & Wooding, 2003). Many are negative
mutations, usually removed immediately from the population due to low survival rates.
Others are neutral and cause no effects that change the “fitness” of an individual. Some
are beneficial and may quickly spread toward fixation. This may appear as a correlation
between the environment and a specific trait, or a gene with an additional adopted
function.
Distinguishing natural selection from demographic influences
Unfortunately factors of demography often exhibit the same outcomes as natural
selection. Two-thirds of the genes that appear subject to selection may only be the
result of demographic influences (Akey et al., 2004). Population expansion, bottlenecks,
gene flow and genetic drift all contribute to the variation of the human genome and can
leave footprints very similar to that of selection (Harris & Meyer, 2006). Some of the
methods we can use to determine which factors are in effect include close examination
of amino acid substitutions, diversity, linkage disequilibrium (LD), and substitution rates
between species.
Amino acid substitution rates will appear irregular in the case of natural selection
(Bamshad & Wooding, 2003). As the mutation enters different environments the amino
acid substitution may be selected against due to adverse environmental conditions, or
favored due to an advantage. In the negative environments, the mutation will move
19
toward deletion, while moving toward fixation in the advantageous environments.
Diversity will be reduced as linked sites to the mutation are removed (background
selection) or retained (genetic hitchhiking) in accordance with the mutation itself.
Linkage disequilibrium decay can be compared to normal recombination rates to
look for positive selection (Harris & Meyer, 2006). When DNA recombination occurs, the
unlinked background regions surrounding the mutation will change composition as a
mutation is selected for or against. Positive natural selection will allow the surrounding
regions to travel with the mutation, decreasing diversity in those regions. Negative
natural selection will lead to a reduction of the surrounding regions, also decreasing
diversity. This also allows us to create haplotypes for a specific mutation, since far less
recombination will have occurred, and we can often trace the mutation back to the root
haplotype. A long block of LD around the mutation combined with a high frequency in
the population is highly suggestive of positive selection (Bamshad & Wooding, 2003).
Between species substitution rates can be used to recognize selective action by
comparing the ratio of nonsynonymous (ka) to synonymous (ks) mutations (Hu &
Banzhaf, 2008). Mutations that are nonsynonymous result in a change of an amino acid,
leading to a protein change. Most are unfavorable and are quickly removed through
negative selection. Those few that are advantageous begin moving toward fixation. By
examining the ratio of ka/ks, assuming a neutral value of 1, we can interpret a high ratio
as leading toward fixation while a low ratio is being removed from the gene pool.
According to the Neutral Theory, the latter is most often the case (Doyle & Gaut, 2000).
The Neutral Theory of molecular evolution predicts that synonymous mutations will have

20
no functional effect while the nonsynonymous would usually be disadvantageous,
leading to a more common ratio of less than one.
If we have some prior information about the demography of a population we can
use tests of neutrality that take them into consideration. Tajima’s D is often used to
measure the polymorphic diversity within a species (Harris & Meyer, 2006). Tajima’s D
finds the mean difference between DNA samples and returns a difference between
them based on a neutral value of zero. However, in 2000 Justin Fay and Chung-I Wu
recognized the inability of this test to identify the action of natural selection as opposed
to demographic effects, so they developed a more reliable version, Fay and Wu’s H,
which compared data from related species to search for high frequency mutations.
In 1951 Sewall Wright developed the fixation index, Fst, to measure differentiation
within populations (Harris & Meyer, 2006). Fst tests, such as ANOVA can show evidence
of selection by comparing population data (Holsinger & Weir, 2009). Excessively high
rates of alleles or traits reveal themselves among the populations tested. Geographical
clines may also become evident. Both these factors can help to identify potential
selective action, however errors may be introduced due to gene flow or genetic drift,
necessitating additional testing to develop more support for results being attributable or
not attributable to natural selection.
Identifying natural selection for lactase persistence
The next step is to use the methods of identifying natural selection on lactase
persistence. We already know the obvious advantages to persistence, such as better
nutrition, hydration, and calcium intake, so we have valid reasons to believe a causal

21
mutation could survive and move toward fixation. Additional studies also reveal a milk-
protein diversity in cattle that likely involved deliberate selection for greater milk yield
and protein composition (Beja-Pereira et al., 2003).
Haplotype studies of a 60 kb region surrounding the lactase gene reveal four
global versions: A, B, C and U (Hollox et al., 2001). All four differ from each other at
three or more sites but are found in nearly all populations. The diversity within each
haplotype is due to recent events affecting only a single population or subset. One
probable cause is the selection for lactase persistence. The older events leading to
these four major haplotypes, however, occurred prior to the spread across Eurasia and
were more likely related to a combination of bottleneck and genetic drift.
Haplotype A is the most common, particularly in the European populations,
although not as prevalent in the Sub-Saharan African populations. Haplotype B is found
in all but the Bantu-speaking South African populations, but is most common in Papua
New Guinea. Although also found in all populations, Haplotype C is not prevalent in
European areas. Haplotype U is absent in European and Indian populations, but
appears in Sub-Saharan Africa and East Asia with high frequencies.
Of these Haplotype A strongly correlates with the areas associated with lactase
persistence in Europe, suggesting a mutation in this haplotype that is causal of
persistence (Hollox et al., 2001). Linkage disequilibrium studies found a 1 Mb block at a
frequency of 77% in northern Europeans, revealing that this haplotype is recent and
was probably under intense positive selection to reach such a high frequency in less
than 10,000 years (Hollox et al., 2005).
22
Fst testing was used to examine this area of linkage disequilibrium by first testing
the values at 28,440 markers genome wide, then comparing with Fst values at markers
located near the Lactase gene (Bersaglieri et al., 2004). The resulting p-value of .002
suggests a high significance in the distribution, clearly underlining a difference between
genome wide frequencies and the local frequencies within and surrounding the Lactase
gene. This also supports the likelihood of natural selection for lactase persistence in
European populations.
In African populations the results are not as clear. It may be that results in
European populations are highly significant due to a different set of selective pressures
that forced a rapid adaptation, resulting in strong signatures (Akey et al., 2004). Various
statistical tests offered similar results for multiple genes: Tajima’s D, Fu and Li’s D, Fu
and Li’s F and Fay and Wu’s H. The identification of multiple genes that contain
signatures of selection, yet are not shared between the non-African and African
populations, also indicates different pressures upon the groups after humans migrated
out of Africa.
Theories of lactase persistence expansion
We do not yet know what the main cause for the spread of lactase persistence
was; however two leading theories have been suggested to explain the expansion of
this phenotypic trait. The Culture-historical hypothesis was independently put forward by
Simoons and McCracken in the early 1970’s (Bloom and Sherman, 2005). The
indication is that persistence leads to a selective advantage, therefore the lactase
persistence mutation existed in rare proportions prior to fresh dairy consumption, then

23
increased substantially in populations that adopted dairy farming. Alternatively, the
Reverse-cause hypothesis states that the persistence mutation(s) arose first, then
spread to higher frequencies before the advent of dairy consumption (Burger et al.,
2007).
The Culture-historical hypothesis. This hypothesis is based on the premise
that persistence mutational polymorphisms were rare but rose quickly to higher
frequencies through selective pressures (Burger et al., 2007; Swallow, 2003). This led
to an increase in persistence for dairy consuming pastoralists as milk-dependence
became an integral part of the culture. Gerbault et al. (2009) studied 25 African
populations and found evidence supporting this hypothesis by showing a high
correlation between lactase persistence and pastoralism with clear genetic boundaries
between pastoralists and non-pastoralists. Additional evidence of gene-culture
coevolution between the milk protein genes in European cattle stock and human lactase
persistence also supports the concept of intentional selection for milk protein genes by
dairying cultures (Beja-Pereira et al., 2003). Finally, genetic studies of Neolithic human
bones in Europe found no evidence of the T-13910 allele (Burger et al., 2007), believed
to be the putative cause of persistence in this region of the world. For these reasons,
the Culture-historical hypothesis is supported to some extent.
The Reverse-cause hypothesis. According to the Reverse-cause hypothesis,
the mutations were already established; therefore the practice of dairying was adopted
by those populations for which the frequency was high enough to sustain milk-
dependence (Burger et al., 2007). This much differentiation prior to dairy consumption

24
would probably not allow for the genetic boundaries that exist between neighboring
populations that do or do not rely on dairy. So far, though it cannot be disproved,
evidence undermines this hypothesis yet continues to accrue in support of the Culture-
historical. The genetic boundaries, cattle coevolution, Neolithic DNA evidence and
extended linkage disequilibrium of the lactase gene area (indicating recent expansion)
all suggest the Reverse-cause hypothesis is relatively unlikely when compared to
Culture-historical.
Regional variation and additional hypotheses. The Culture-historical and
Reverse-cause hypotheses are not designed to explain the regional variation that
occurs in the practice of dairying across all continents. Certain factors may contribute
heavily to the sustainability of herding milk-producing animals, such as climate, forage
and pathogens (Bloom and Sherman, 2005). For example, it may be too difficult to keep
domestic animals alive in climates that become extreme for certain periods of the year.
Many cultures are nomadic pastoralists for this reason, however if an area does not
have a safe region to move to during inclement months, the herds would not survive.
Food and water availability also are essential to maintaining livestock, and endemic
diseases, such as sleeping sickness, can lead to decimation of the herd. Overall the
expansion of lactase persistence appears to follow the Culture-historical process,
however many specific regional landscapes may have resulted in the widely diverse
range of frequencies.
Several ideas have been presented to explain the selective pressures that led to
the expansion of the lactase persistence phenotype. Flatz and Ratthauwe (1973)
25
presented the concept of milk consumption to boost calcium absorption in higher
latitudes where sunlight was less available. In 1975, Cook and al-Torki developed the
Arid Climate hypothesis, postulating that milk - specifically that of camels - is an
excellent substitute for food and water in desert areas. Anderson and Vullo (1994)
alternatively attempted to explain nonpersistence as a function of malarial conditions,
since flavins, found in high quantities in milk, increase the risk of malarial infection.
Identification of lactase persistence mutations
Montgomery et al. (2007) hypothesize the production of repressors begin at
about five years of age in a human child. These repressors act to prevent the lactase
gene from manufacturing any significant amounts of lactase by effectively “switching off”
production. Persistence is partly rooted in blocking these repressors, allowing the
lactase gene to continue functioning. Additional studies suggest the T-13910 allele is
also directly responsible for enhancing the production of lactase when it binds to the
Oct-1 transcription factor (Enattah et al., 2007).
Many studies have been conducted in search of the causal genetic variant of
lactase persistence. The T-13910 polymorphism is the one of the most promising
associations found to date, lying 13,910 base pairs upstream from the Lactase (LCT)
gene (Swallow, 2003). A strong correlation can be drawn between this allele and
prevalence of persistence in Europe. Lactase persistence studies indicate the largest
frequency of this SNP occurs in North Europe, decreasing geographically to the south
and east, with minimal or no appearance in African and Asian regions.
26
The original genetic structure, or “wild-type,” of nonpersistence is determined by
a pair of cytosines (CC) at this location. When Scandinavian studies revealed a thymine
replacement of one or both cytosines in this position that almost completely correlated
with persistence, investigations quickly began to determine if it could be the cause of
persistence in these individuals (Swallow 2003). In addition, persistence existed in both
heterozygous and T-homozygous individuals, suggesting that if this was a causal
polymorphism, the thymine expressed dominance.
An additional mutation found in the same area is A-22018. This SNP has a
relatively strong, though incomplete, association with persistence (Enattah et al., 2007).
A small variation seems to occur in nonpersistent groups with CC-13910, with 2.5 to
11% of nonpersistent individuals exhibiting the G/A-22018 genotype.
In Africa there are a number of pastoralist cultures that exhibit lactase
persistence, yet do not have the T-13910 (or A-22018) polymorphism, indicating
another variant or variants must be associated. Subsequently additional variants were
located that may be associated with persistence (Ingram et al., 2008). Two
polymorphisms, C-14010 and C-13913, reveal a correlation with persistence in areas of
Africa (Imtiaz et al., 2007). Two other variants, G-13915 and G-13907, do not appear to
show the same level of association as the European SNP T-13910 (Ingram et al., 2008;
Tishkoff et al., 2007). Geographically it appears that G-13915 originated in the Middle
East while the other three SNP’s arose in East Africa.
Comparisons of linkage disequilibrium tracts suggest the C-14010 was subject to
strong positive selection, even more so than the T-13910 SNP (Tishkoff et al., 2007).

27
With a high frequency, as high as 27%, and an average homozygous tract length of 1.8
Mb, compared to T/T-13910 average of 1.4 Mb, there is good evidence for selection.
Additional research should be conducted to develop broad-based statistical support for
natural selection.
Little progress has been made in determining the causes of lactase persistence
in Asian populations, though there are relatively few persistent cultures. The A-22018
allele, already known for some association in European populations, appears to
correlate with persistence in several of the northern Chinese populations (Xu et al.,
2009). None of the other polymorphisms, however, were found in high enough
frequencies to indicate cause of persistence.

28
CHAPTER 4: ARCHAEOLOGICAL DATA
Finding evidence of dairy production in the archaeological record is both easy
and difficult at the same time. Evidence of dairy use certainly exists, however it is nearly
impossible to determine how early the practice started. Sherrat’s 1981 model of the
“Secondary Products Revolution” surmised that dairy production originated in the 4th
millennium in the Middle East, and the 3rd millennium in Europe, as “technical
innovations” secondary to meat production (Vigne & Helmer, 2007). However, the
earliest evidence now pushes the extensive use of milk from domesticated animals in
the Middle East as far back as the 7th millennium (Evershed et al., 2008) narrowing the
gap between origination of animal domestication and secondary dairy production. Actual
domestication of goats and sheep, followed by cattle, is estimated to have occurred in
the 8th millennium in the Middle East area, spreading outward into Central and North
Europe.
Methods of detecting domestic animal strategies
One of the commonly used methods to determine the usage of domesticated
animals is that of kill-off profiles. Domestic animal strategies can be deduced by
examining the culling practices used (Greenfield et al., 1988). Age and sex distributions
of slaughtered animals reveal patterns that work better for specific production
strategies. Milk production may be indicated by the culling of young male stock,
particularly first year, to ensure more grazing ground for lactating females. After the
infant/juvenile age is passed, butchering dramatically decreases.

29
Other physical evidence of domestication can help us by identifying the use of
secondary products, particularly dairy. For example, cheese strainers were found in
Neolithic sites of Britain dating to 4,500 BC (Dudd and Evershed, 1998), while images
and written records existed from upper Africa and Mesopotamia as early as 4,000 BC
that confirmed dairy production.
Another line of evidence that uses the analysis of pottery sherd residue has
become a popular method of detecting milk consumption. Recent understandings of
lipid residue decay have opened up a new avenue for detecting dairy usage in
prehistoric cultures. Stable carbon isotope analysis and lipid analysis can be used to
test ancient unglazed pottery sherds for lipid compositions that were absorbed into the
pottery material (Evershed et al., 2008).
Fresh milk contains short chain fatty acids and triacylglycerols that are key
identifiers of dairy products (Craig et al., 2005). Burial, however, leads to decay and
degradation of these identifiers resulting in alterations of the fatty acids and
disappearance of the triacylglycerols, leaving a residue that is chemically very similar to
adipose fats. The resulting saturated mid-chain fatty acids, however, will reveal differing
carbon ratios of C16 to C18 (Carbon chain lengths of 16 or 18 atoms) between dairy and
adipose fats, allowing us to use compound-specific measurements that can identify
individual mid-chain fatty acids based on the number of carbon atoms. In dairy residue,
the ratio of C16 to C18 is different from adipose residue with as much as 7% fewer C18
isotopes. The differences in carbon composition reveal ruminant versus nonruminant
fats, as well as adipose fats versus dairy fats. Testing sherds for dairy fats allows us to

30
trace dairy consumption to an earlier time period than originally surmised, possibly to
the very beginning era of animal domestication during the Neolithic period.
Dairy residue studies
Craig et al. (2005) selected two Neolithic sample sites in the Danube basin
specifically to test for dairy residues. Schela Cladovei lies on the Romanian side of the
Danube and the pottery samples were taken from a period between 5,950 and 5,500
BC. Ecsegfalva 23 is found on the Hungarian side of the Danube in the Great
Hungarian Plain and was occupied from 5,800 to 5,700 BC. Both sites are in areas that
are believed to have influenced agricultural and pastoral development in Central and
Northwest Europe.
The sherd samples tested from both sites revealed the processing of ruminant
fats, both adipose and dairy. A small amount of intact triacylglycerols were also found,
confirming the containment of milk in those vessels. This strongly suggests that dairy
production was quite early in the domestication timeline, which is estimated at about
10,000 years ago for sheep and goats in the Middle East (Haenlein, 2007). Kill-off
profiles also suggest that dairying and meat production were mixed in these Neolithic
sites (Craig et al., 2005). It is likely that household pastoralism was more common than
large community herds, as indicated by microwear on sheep teeth that is caused from
enclosed overgrazing.
Additional findings include mid-chain ketones, which are produced by heating
milk. Applying heat may help reduce the lactose content, allowing intolerant individuals
to consume more dairy, as well as improve storage potential of dairy products. This
31
offers an explanation of dairy consumption prior to lactase persistent mutations by
allowing non-persistent people to consume large quantities of dairy without the
debilitating side effects of intolerance. In addition, the use of bacterial fermentation
would greatly reduce the lactose content and allow higher dairy consumption in
nonpersistent individuals (Wiley, 2004). Based on these concepts, dairy production was
not necessarily a function of lactase persistence.
The evidence from these studies suggests milk was in use prior to 6,000 BC in
this area. Another stable carbon isotope study (Evershed et al., 2008) examined sherds
from 23 sites in central and southeastern Europe, Greece, Anatolia and the Levant, and
results push this estimate further back to sometime well before 6,500 BC. All of the sites
had sherds that tested positive for dairy residue, with Northwestern Anatolia revealing
intensive processing by the 7th millennia BC (70% of the sherds were positive). A
positive correlation between sherds with dairy residue and cattle bones also appears,
linking the importance of cattle to milk production. Kill-off profiles suggest a mixture of
meat and dairy production was used, with higher values placed on dairy in sites with
higher proportions of cattle.
Though evidence of ketones was not reported, it is highly likely that the milk was
processed for consumption and storage as cheese, ghee or other less perishable
products, particularly considering the intense consumption in the Anatolia region. This
usage of dairy also precedes the pottery production in the area, making it difficult to find
earlier evidence of milk consumption. It certainly must have occurred relatively close to
the beginnings of domestication in the 8th millennium.

32
Development of animal domestication
Currently most archaeological dairy usage studies concentrate on the Middle
East and European regions. Animal domestication for meat is believed to have
originated in the Middle East about 10,000 years ago, spreading into Europe and other
areas of the Eastern Hemisphere over the next few thousand years (Evershed et al.,
2008, Haenlein, 2006). Dairy domestication followed this sometime later, with current
archaeological evidence indicating goat and/or sheep milk was heavily used in the
Middle East by 8,500 years ago. Over time, additional evidence attained in Africa, Asia
and the Middle East will greatly contribute to the knowledge base of Neolithic and
Mesolithic dairy consumption.

33
CHAPTER 5: MATERIALS AND METHODS
Evaluating the origin and spread of lactase persistence requires an extensive
database of information. Datasets were collected from numerous sources to create a
more comprehensive set of samples for analysis. A total of 73 population samples have
been assembled from all regions excluding the New World and Australia. This provides
T-13910 frequency data for more than 12,000 individuals, and lactase persistence
frequency data for almost 10,000. For populations that did not provide the numbers of
heterozygous and homozygous individuals, these numbers were obtained using Hardy
Weinberg calculations of p2+2pq+q2=1, with C-frequency as p and T-frequency as q.
New World samples were removed from the original database since the recent
influx of Old World populations scattered throughout the American continents would be
nearly impossible to follow, and would probably not reveal any evolutionary processes
in such a short span of time. Data were not included for Australia either due to a lack of
substantial information.
Haplotype distribution
Examination of the long stretch of linkage disequilibrium surrounding the lactase
gene revealed four common global haplotypes that exist at 5% or greater frequency: A,
B, C and U (Hollox et al., 2001; Swallow, 2003). Haplotypes A, B and C are all found in
European populations; however, haplotype A comprises the greatest part of Europe.
The T-13910 SNP is found only on this haplotype (Harvey et al., 1998).

34
Additional regional polymorphisms
Data are also included for other polymorphisms suspected of associating with
lactase persistence. A-22018 is found on the same haplotype (A) as the T-13910
polymorphism and shows a correlation with persistence, although far less robust
(Swallow, 2003; Enattah et al., 2007), and appears to correlate with persistence in
northern Chinese populations. In East-Central and Southern Africa the C-14010
polymorphism (on haplotype B) seems to be a strong indicator of lactase persistence
(Coelho et al., 2009; Enattah et al., 2008; Ingram et al., 2009a). The G-13915 SNP is
found on the C haplotype and is common in the North African and Middle Eastern
regions (Ingram et al., 2007; Gerbault et al., 2009). G-13907 is found on the A
Haplotype and exists mainly in the Ethiopia/Sudan region (Ingram et al., 2009a).
Data adjustments
In many cases samples were combined from multiple sources to create better
regional representation or a more complete record for a given population. For example,
since two population studies for the Hezhen of China were included in the study, they
were combined into one record as a more efficient way to examine the data. Details of
these actions are noted in Table 2.

35
Table 2: Combined data records.
Morocco The Saharawi culture occupies a large area of Morocco and was combined with the sample for Morocco from source Enattah et al. 2007
Hezhen Data pooled from sources Bersaglieri et al. 2004 and Sun et al. 2007 Oroqen Data pooled from sources Bersaglieri et al. 2004 and Sun et al. 2007 Han Data pooled from sources Enattah et al. 2007 and Bersaglieri et al. 2004 French Basque
Data pooled from sources Bersaglieri et al. 2004, Itan et al. 2009 and Enattah et al. 2007
England Data pooled from sources Smith et al. 2009, Gerbault et al. 2009 and Itan et al. 2009
France (main)
Data pooled from sources Bersaglieri et al. 2004, Enattah et al. 2007 and Itan et al. 2009
Greece Data pooled from sources Anagnostou et al. 2009 and Itan et al. 2009 Iran Data pooled form sources Enattah et al. 2007 and Gerbault et al. 2009 Ireland Data pooled from sources Itan et al. 2009 and Gerbault et al. 2009 Israel Data combined for multiple populations in Israel listed in Bersaglieri et
al. 2004. Italy Data pooled from sources Bersaglieri et al. 2004, Anagnostou et al.
2009, Itan et al. 2009, Bersaglieri et al. 2004, Coelho et al. 2005 and Gerbault 2009
Orkney Data pooled from sources Itan et al. 2009 and Bersaglieri et al. 2004 Pakistan Data pooled from sources Bersaglieri et al. 2004 and Enattah et al. 2007 Scandinavia Data pooled from sources Itan et al. 2009, Coelho et al. 2007, Swallow
2003, Enattah et al. 2007 and Bersaglieri et al. 2004 Spain Data pooled from sources Gerbault et al. 2009 and Agueda et al. 2010 Melanesia Data combined for Papuan and Melanesian listed in Bersaglieri et al.
2004.
In cases of more distinct populations it makes less sense to combine them within
a region. The Saami culture of the Northern Scandinavian Peninsula seems to be
distinct from the rest of the Scandinavian region so was kept as a population sample.
The Basque area between France and Spain also remains distinct from either neighbor
so was included for analysis. A wide variety of Chinese and Russian populations were
also retained to represent the large regional differences in populations and cultures for
36
those countries. The other population records used were generally defined by country of
origin.
In many cases the literature sources did not include complete information for
both the T-13910 polymorphism and lactase persistence frequencies; therefore the
information was obtained from different sources. The same situation applies to
additional polymorphisms suspected to play a role in lactase persistence that will be
included in this study.
Each population was designated a latitude and longitude location for mapping
purposes. Populations which did not include the original locations were assigned based
on central location or large city centers using Google Earth. Though this does leave
some room for error, the adjustment to larger regions by combining data and using
country of origin representation allows for a wider possible area of collection, reducing
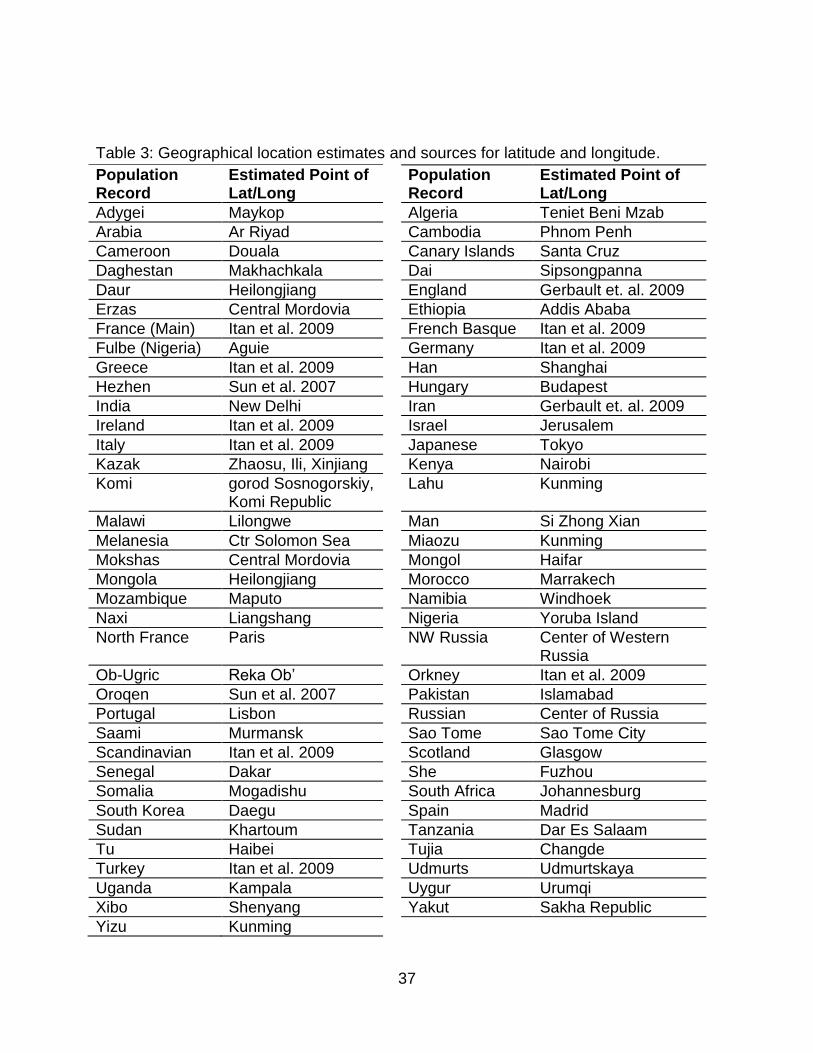
error margins. The estimated latitude and longitude locations are indicated in Table 3.
37
Table 3: Geographical location estimates and sources for latitude and longitude.
Population Record
Estimated Point of Lat/Long
Population Record
Estimated Point of Lat/Long
Adygei Maykop Algeria Teniet Beni Mzab
Arabia Ar Riyad Cambodia Phnom Penh
Cameroon Douala Canary Islands Santa Cruz
Daghestan Makhachkala Dai Sipsongpanna
Daur Heilongjiang England Gerbault et. al. 2009
Erzas Central Mordovia Ethiopia Addis Ababa
France (Main) Itan et al. 2009 French Basque Itan et al. 2009
Fulbe (Nigeria) Aguie Germany Itan et al. 2009
Greece Itan et al. 2009 Han Shanghai
Hezhen Sun et al. 2007 Hungary Budapest
India New Delhi Iran Gerbault et. al. 2009
Ireland Itan et al. 2009 Israel Jerusalem
Italy Itan et al. 2009 Japanese Tokyo
Kazak Zhaosu, Ili, Xinjiang Kenya Nairobi
Komi gorod Sosnogorskiy, Komi Republic
Lahu Kunming
Malawi Lilongwe Man Si Zhong Xian
Melanesia Ctr Solomon Sea Miaozu Kunming
Mokshas Central Mordovia Mongol Haifar
Mongola Heilongjiang Morocco Marrakech
Mozambique Maputo Namibia Windhoek
Naxi Liangshang Nigeria Yoruba Island
North France Paris NW Russia Center of Western Russia
Ob-Ugric Reka Ob’ Orkney Itan et al. 2009
Oroqen Sun et al. 2007 Pakistan Islamabad
Portugal Lisbon Russian Center of Russia
Saami Murmansk Sao Tome Sao Tome City
Scandinavian Itan et al. 2009 Scotland Glasgow
Senegal Dakar She Fuzhou
Somalia Mogadishu South Africa Johannesburg
South Korea Daegu Spain Madrid
Sudan Khartoum Tanzania Dar Es Salaam
Tu Haibei Tujia Changde
Turkey Itan et al. 2009 Udmurts Udmurtskaya
Uganda Kampala Uygur Urumqi
Xibo Shenyang Yakut Sakha Republic
Yizu Kunming
38
Regional designations
Each sample record was assigned a regional designation. These designations
will allow the creation of a base map that can be used to show isoclines for the analyzed
alleles and persistence frequencies. The regional designations include North Africa,
Middle East, East Africa, China, Western Russia, Asia (excludes China), the Caucasus,
Western Europe, Eastern Europe, Indonesia and Sub-Saharan Africa.
Hardy Weinberg equilibrium
Hardy Weinberg equations were formulated for all population records for the
13910 polymorphic frequencies to help identify discrepancies in equilibrium. Using the
Hardy Weinberg Equilibrium (HWE) formula p2 + 2pq + q2 = 1, expected homozygous
values were calculated based on the number (N) multiplied by the square of the CC or
TT frequency, while heterozygous values were calculated as 2N*CCfreq*TTfreq. By
subtracting the observed number of each allelic type from the expected number
calculated the trend toward allele fixation can be identified and graded for strength.
Hardy Weinberg equilibrium relies on a strict set of assumptions and most likely
one or more will be violated. Mutations, gene flow, genetic drift, small populations and
nonrandom mating will lead to deviation from equilibrium (Dvorak, 2009). This allows
the results to be examined for changes that reveal the direction of evolutionary trends
for an individual SNP. Increases in heterozygosity suggests a rare allele that is either
moving toward fixation or toward extinction.
39
Methods of testing lactose metabolism in included studies
Multiple testing methods are available to determine lactase persistence. Tests
range from non-invasive to extremely invasive depending on how the results are
gathered. However, most tests only measure lactase activity and cannot distinguish
between natural and pathological reductions of lactase, making them less reliable for
subjects that may have other intestinal issues, such as IBS or giardiasis. To
substantiate test results, studies are generally conducted using a minimum of two
methods.
Hydrogen Breath Test. The Hydrogen Breath Test (HBT) is a non-invasive test
that is one of the most commonly used methods of detecting lactase nonpersistence.
Several hours after administering a lactose load, hydrogen levels in the exhaled breaths
reveal carbohydrate digestion or maldigestion based on changes in elevation (Lomer et
al., 2008). This test is cost-effective and relatively reliable, although reliability is
questionable if certain protocols are not observed. As much as 20% of intolerant
individuals have been known to provide false-negatives if conditions are not carefully
followed. A study by Avallone et al. (2010) provides substantial evidence that, prior to
the lactose load, a 24 hour period of carbohydrate restriction followed by 12 hours of
fasting should be observed. This dramatically reduces false-negative errors. In addition,
antibiotics should be avoided for several weeks prior to the test since they affect
intestinal bacterial levels.
Most HBT tests begin with a basal H2 level recorded for each individual, followed
by an oral lactose load of 50g, as found in about a liter of milk (Lomer et al., 2008).
40
Breath excretions are taken at defined increments, usually 30 minutes, for 3-6 hours
and submitted to gas chromatography analysis to measure H2 in ppm. An increase
exceeding 20 ppm is considered a positive response and indicates much of the lactose
consumed is undigested and is being fermented by intestinal bacteria, releasing large
quantities of H2 that is partially absorbed into the bloodstream and subsequently
excreted in the breath.
Lactose Tolerance Test. The Lactose Tolerance Test (LTT) uses a blood
sample following a lactose load to measure glucose levels in the blood. As the lactose
disaccharide is digested in the intestinal tract, the resulting glucose and galactose
sugars are absorbed into the bloodstream. A rise in blood glucose greater than 1.1
mmol/l and galactose greater than 0.3 mmol/l is indicative of lactase persistence (Seppo
et al., 2008). The reliability of the LTT can also be slightly increased by adding a small
amount of ethanol (300 mg/kg of body weight) to the load. Unfortunately for the test
subjects, both this and the HBT tests involve a lactose load, which can lead to extreme
discomfort for intolerant individuals.
Jejunal biopsies. Although considered the “golden standard,” jejunal biopsies to
test for lactase activity are highly invasive and alternate methods are usually preferred
(Vonk et al., 2001). Small samples are sectioned from the jejunum portion of the small
intestine and analyzed for lactase concentrations. Although biopsies provide a reliable
indicator of lactase activity, they cannot provide conclusive evidence that a lack of
lactase is due to natural downregulation as opposed to a pathological illness or
infection.

41
Methods of DNA sampling in included studies
Genotyping uses a simple blood test or buccal swab to genotype the regions
suspected of affecting lactase production. The results can clearly identify a causal
polymorphism, however the polymorphism must be known first. Swallow (2003) was
able to demonstrate a complete association with T-13910 in Finnish studies, yet the
absence of this SNP in other regions, such as Africa and Asia, indicates the need for
determining putative polymorphisms with substantially supporting evidence in different
regions. The genotyping assays also reveal the large section of linkage disequilibrium
containing lactase gene, suggesting not only strong selection, but also that the cause of
persistence does lie within this region in all four main haplotypes (Swallow, 2003).
Pinpointing the actual causal polymorphism(s), however, is much more difficult.
Statistical evaluations
All statistical analyses were conducted with PASW Statistics 18, Release 18.0.0.
The data set analyzed contains 73 population records, with a total count of 12,371
individuals. The population samples were drawn from areas throughout Africa, Europe
and Asia, with one addition from Indonesia. No populations were included from the New
World, Australia, Greenland or Iceland. Of the 73 populations, 44 contained information
regarding lactase persistence frequencies (9,682 individuals).
The ideal statistical evaluations are the parametric versions which model the
magnitude of associations between variables, as opposed to the nonparametric which
are based on ranking mechanisms that compare the variables. Parametric tests,
however, often have a specific set of requirements that must be met to obtain valid
42
results, particularly a normal distribution of the data. Therefore, the first step in
completing statistical analyses is to determine if the data for the variables to be tested
are normally distributed. This can be done with two methods, one graphical and the
other calculated.
The graphical method of examining variables for normal distribution is the
histogram. When we look at the T-13910 (variable T-13910 freq) and the lactase
persistence (variable LP freq) frequencies from the populations within the data set, the
distribution does not appear normal for the T-allele frequency based on the normal
curve shown (Fig. 5). The lactase persistence frequency, however, appears much
closer to the normal curve, though there are some discrepancies.

43
Fig. 5: Histograms exhibiting the frequency distributions for T-13910 and lactase persistence. The normal curves are shown.
44
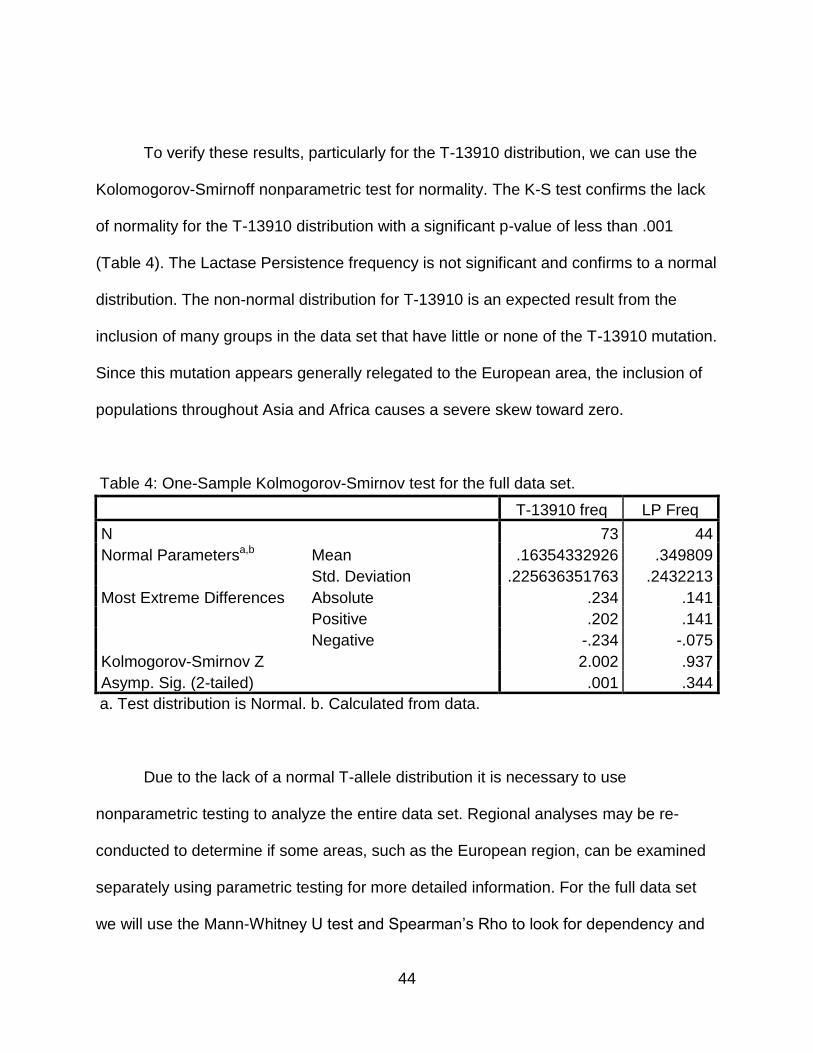
To verify these results, particularly for the T-13910 distribution, we can use the
Kolomogorov-Smirnoff nonparametric test for normality. The K-S test confirms the lack
of normality for the T-13910 distribution with a significant p-value of less than .001
(Table 4). The Lactase Persistence frequency is not significant and confirms to a normal
distribution. The non-normal distribution for T-13910 is an expected result from the
inclusion of many groups in the data set that have little or none of the T-13910 mutation.
Since this mutation appears generally relegated to the European area, the inclusion of
populations throughout Asia and Africa causes a severe skew toward zero.
Table 4: One-Sample Kolmogorov-Smirnov test for the full data set.
T-13910 freq LP Freq
N 73 44
Normal Parametersa,b Mean .16354332926 .349809
Std. Deviation .225636351763 .2432213
Most Extreme Differences Absolute .234 .141
Positive .202 .141
Negative -.234 -.075
Kolmogorov-Smirnov Z 2.002 .937
Asymp. Sig. (2-tailed) .001 .344
a. Test distribution is Normal. b. Calculated from data.
Due to the lack of a normal T-allele distribution it is necessary to use
nonparametric testing to analyze the entire data set. Regional analyses may be re-
conducted to determine if some areas, such as the European region, can be examined
separately using parametric testing for more detailed information. For the full data set
we will use the Mann-Whitney U test and Spearman’s Rho to look for dependency and

45
correlation between the T-13910 and lactase persistence variables. For a regional
analysis, should the distributions be normal, we can use the parametric versions which
are the T-test and Pearson’s Correlation.
Full data set analysis
The Mann-Whitney U Test is designed to determine if the samples used are
drawn from populations with the same mean, in this case of lactase persistence
frequency. Only cases that have a value for the lactase persistence variable were used.
The first test was conducted using groups based on the absence (≤ 0%) versus the
presence of the T-13910 allele (Table 5). The second test was also grouped by the T-
13910 variable, with all cases below a frequency 5% (≤ 5%) tested against the cases
5% or greater (Table 6). In both tests the results are significant with a p-value of less
than .001, revealing the observations are not equally mixed and are from different
populations. Although the samples are pulled from the same data set, the frequencies of
lactase persistence do not overlap between the groups with little or no presence of the
T-allele and the appearance of it at a significant level.
T-13910
freq
Mann-Whitney U .000
Wilcoxon W 276.000
Z -6.937
Asymp. Sig. (2-
tailed)
.000
Table 5: Mann-Whitney test at 0% or > 0%
Freq var
N
Mean
Rank
Sum of
Ranks
T-
13910
freq
dimen
sion1
≤ 0% 23 12.00 276.00
> 0% 50 48.50 2425.00
Total 73

46
Table 6: Mann-Whitney test at ≤ 5% or > 5%
Freq var
N
Mean
Rank
Sum of
Ranks
T-
13910
freq
dimen
sion1
≤ 5% 35 18.00 630.00
> 5% 38 54.50 2071.00
Total 73
To examine the correlation between the two variables, T-13910 and LP, we use
the Spearman’s Rho analysis (Table 7). The result of .706 correlation coefficient (R2 =
.4984) suggests about half of the cases of persistence are associated with the presence
of the T-allele. Some of the leftover variance is likely due to statistical and measurement
errors. Statistical errors may occur due to the difference between the actual population
frequencies and those recorded in the studies. Measurement errors may occur when
testing for lactase persistence. Though this indicates that there are many other
relationships outside of the T-allele that predict lactase persistence, at nearly 50% we
still see a strong correlation between these two variables.
Table 7: Spearman’s rho correlation between T-13910 and lactase persistence.
T-13910 freq LP Freq
Spearman's rho T-13910 freq Correlation Coefficient 1.000 .706**
Sig. (2-tailed) . .000
N 73 44
LP Freq Correlation Coefficient .706** 1.000
Sig. (2-tailed) .000 .
N 44 44
T-13910
freq
Mann-Whitney U .000
Wilcoxon W 630.000
Z -7.460
Asymp. Sig. (2-
tailed)
.000

47
Revised data set analysis
In a separate study adjustments were made to the data set to compensate for
regional differences. All cases were removed other than populations in the regions of
Europe, North Africa, Western Russia, the Russian Caucasus and the Middle East.
Removing the cases in Asia and Sub-Saharan/East Africa trims 38 populations (2,935
individuals). The included 35 populations (9,436 individuals) extend outward from the
northwestern areas of Europe into North Africa, the Middle East and the western and
southern portions of Russia. We can now use parametric testing to establish the
correlation between the T-13910 allele and lactase persistence and establish the
strength of the correlation between them as applicable to these combined regions. The
histograms now produce a more normal distribution for this allele, while maintaining a
relatively normal distribution for lactase persistence (Fig. 6).
Fig. 6: Revised histograms exhibiting the frequency distributions for T-13910 and lactase persistence based on regional sections. The normal curves are shown.
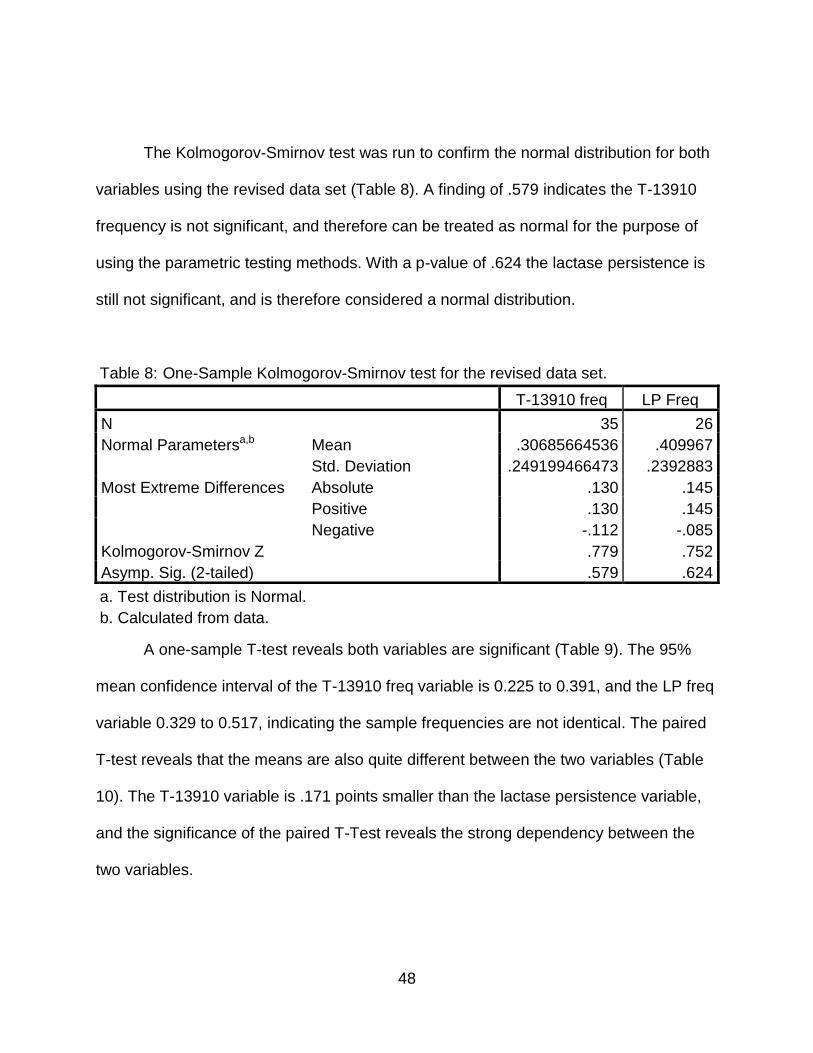
48
The Kolmogorov-Smirnov test was run to confirm the normal distribution for both
variables using the revised data set (Table 8). A finding of .579 indicates the T-13910
frequency is not significant, and therefore can be treated as normal for the purpose of
using the parametric testing methods. With a p-value of .624 the lactase persistence is
still not significant, and is therefore considered a normal distribution.
Table 8: One-Sample Kolmogorov-Smirnov test for the revised data set.
T-13910 freq LP Freq
N 35 26
Normal Parametersa,b Mean .30685664536 .409967
Std. Deviation .249199466473 .2392883
Most Extreme Differences Absolute .130 .145
Positive .130 .145
Negative -.112 -.085
Kolmogorov-Smirnov Z .779 .752
Asymp. Sig. (2-tailed) .579 .624
a. Test distribution is Normal.
b. Calculated from data.
A one-sample T-test reveals both variables are significant (Table 9). The 95%
mean confidence interval of the T-13910 freq variable is 0.225 to 0.391, and the LP freq
variable 0.329 to 0.517, indicating the sample frequencies are not identical. The paired
T-test reveals that the means are also quite different between the two variables (Table
10). The T-13910 variable is .171 points smaller than the lactase persistence variable,
and the significance of the paired T-Test reveals the strong dependency between the
two variables.

49
Table 9: One-Sample T-test for revised data set
Test Value = 0
t df
Sig. (2-
tailed)
Mean
Difference
95% Confidence Interval of
the Difference
Lower Upper
T-13910
freq
7.531 34 .000 .308229886143 .22505367861 .39140609367
LP Freq 9.242 25 .000 .4233115 .328976 .517647
Table 10: Paired Samples T-test for the revised data set
Paired Differences
t df
Sig.
(2-
tailed) Mean
Std.
Deviation
Std.
Error
Mean
95% Confidence
Interval of the
Difference
Lower Upper
Pair
1
T-13910,
LP Freq
-.14917 .118288 .023198 -.19695 -.10139 -6.43 25 .000
Pearson’s correlation analysis is then conducted to determine the correlation
coefficient for this restricted data set (Table 11). The correlation between the T-13910
allele and lactase persistence is at .877, which is squared to provide a coefficient of
.769. We now know that about 80% of the lactase persistence in this regional data set
can be explained by the presence of the T-allele. Though this does not prove causation,
it does indicate a strong association in a large region encompassing all of Europe and
parts of Africa and the Middle East. However we also note the T-allele is not completely
in association with persistence, suggesting other causes may be found.

50
Table 11: Pearsons Correlation between T-13910 and LP in the revised data set.
T-13910 freq LP Freq
T-13910 freq Pearson Correlation 1 .877**
Sig. (2-tailed) .000
N 35 26
LP Freq Pearson Correlation .877** 1
Sig. (2-tailed) .000
N 26 26
**. Correlation is significant at the 0.01 level (2-tailed).
Using the correlation tests for both the full data set and the regional data set
demonstrates a powerful geographical association with lactase persistence for both the
T-13910 allele and other unexplained factors, possibly additional polymorphisms. The
demonstration of a reduction in the correlation coefficient between Europe and
neighboring regions, as compared to lower African and Asian territories, reveals a
higher concentration of the T-allele proceeding toward Europe. The association
between the variables exhibited in the Mann-Whitney and T-Tests also suggests the T-
allele may be used as a predictor of lactase persistence in European populations.
Additional polymorphisms analyzed
Outside of the European and neighboring regions the T-13910 allele appears at
very low frequencies or does not exist. Since lactase persistence does exist in some
populations in these areas, convergent evolution of the phenotype is indicated. Several
other single nucleotide polymorphisms (mutations) have been discovered that may be
linked to persistence in these regions. Research in these areas is limited; therefore only
five potential candidates have been included in this study: C-14010, G-13915, G-13907,

51
C-13913 and A-22018. All except the A-22018 are located in close proximity to the T-
13910 allele.
Multiple populations are included in the tables indicating available information for
each of the additional African polymorphisms, however the statistical analyses of these
polymorphisms, as well as A-22018, only includes the studies that reveal a frequency
greater than zero. The areas outside of the region where the polymorphism is found are
therefore eliminated, removing data that would cause excessive skews. This provides a
more accurate picture of the polymorphism correlations with lactase persistence.
C-14010. The C-14010 mutation so far has only been found in the eastern area
of Africa including Ethiopia, Uganda, and Kenya (Table 12). Five additional areas of
study involving 2,214 individuals revealed no frequency in Europe, the Middle East or
Sub-Saharan Africa. A linear regression reveals nearly complete correlation in those
regions between the C-14010 allele and lactase persistence (Table 13). The data
strongly indicate that this mutation is a predictor of lactase persistence, however, with
only three positive samples totaling 1,544 individuals, more studies should be
conducted to strengthen the correlation.

52
Table 12: Samples of the C-14010 polymorphism.
Population C-14010
Frequency Sample Number Study Source(s)
Arabia 0.000 1206 Ingram et al 2009b, Imtiaz et al 2001 and Enattah et al 2008
Italy 0.000 66 Ingram et al. 2009b
Israel 0.000 262 Bersaglieri et al. 2004 and Ingram et al. 2009b
Sudan 0.000 562 Tishkoff et al. 2007, Enattah et al. 2008 and Ingram et al. 2009b
Senegal 0.000 118 Ingram et al. 2009b
Ethiopia* 0.006 1080 Jones et al. 2009 in Itan et al. 2010 in Itan et al. 2010, Ingram et al. 2009b
Uganda* 0.030 76 Jones et al. 2009 in Itan et al. 2010
Kenya* 0.273 388 Tishkoff et al. 2007 *Populations included in regression / correlation analysis.
Table 13: C-14010 regression / correlation analysis.
Model
R R Square
Adjusted R
Square
Std. Error of the
Estimate
Dimension0 1 .999a .999 .998 .0072386
a. Predictors: (Constant), C-14010
G-13915. The G-13915 polymorphism is recorded in the Middle East, North
Africa and East Africa, overlapping to some extent with the C-14010 mutation (Table
14). Areas located in Europe or the western region of Africa as well as areas south or
west of Kenya reported no occurrence of the G-13915 allele. With six positive
population studies totaling 3,522 individuals, this allele has more strength than the C-
14010 allele, however it would still be better understood with additional population
studies in Africa and the Middle East. Unlike the C-14010 allele, the G-13915 mutation
does not appear to associate with lactase persistence (Table 15). The correlation

53
coefficient, R2, is 0.157, explaining persistence in less than 16% of the population.
Based on these studies, this polymorphism does not predict lactase persistence.
Table 14: Samples of the G-13915 polymorphism.
Population G-13915
Frequency Sample Number Study Source(s)
Italy 0.000 66 Ingram et al. 2009b
Senegal 0.000 118 Ingram et al. 2009b
Uganda 0.000 76 Jones et al. 2009 in Itan et al. 2010
Scandinavia 0.000 1876 Enattah et al. 2008
Tanzania 0.000 512 Tishkoff et al. 2007
Kenya* 0.039 388 Tishkoff et al. 2007
Israel* 0.061 262 Bersaglieri et al. 2004 and Ingram et al. 2009b
Ethiopia* 0.072 1080 Jones et al. 2009 in Itan et al. 2010, Ingram et al. 2009b
Morocco* 0.083 24 Enattah et al. 2008
Sudan* 0.137 562 Tishkoff et al. 2007, Enattah et al. 2008 and Ingram et al. 2009b
Arabia* 0.582 1206 Ingram et al 2009b, Imtiaz et al 2001 and Enattah et al 2008
*Populations included in regression / correlation analysis.
Table 15: G-13915 regression / correlation analysis.
Model
R R Square
Adjusted R
Square
Std. Error of the
Estimate
dimension0 1 .396a .157 -.012 .1861636
a. Predictors: (Constant), G-13915
G-13907. A third African polymorphism is G-13907, found almost exclusively in
the East African coastal countries (Table 16). The linear regression for this
polymorphism establishes less than 1% correlation in a total positive sample group of

54
3,748 individuals (Table 17). Based on these results it is fairly conclusive that the G-
13907 is neither causal nor predictive of persistence.
Table 16: Samples of the G-13907 polymorphism.
Population G-13907
Frequency Sample Number Study Source(s)
Italy 0.000 66 Ingram et al. 2009b
Senegal 0.000 118 Ingram et al. 2009b
Uganda 0.000 76 Jones et al. 2009 in Itan et al. 2010
Scandinavia 0.000 1876 Enattah et al. 2008
Israel 0.000 262 Bersaglieri et al. 2004 and Ingram et al. 2009b
Morocco 0.000 24 Enattah et al. 2008
Arabia* 0.002 1206 Ingram et al 2009b, Imtiaz et al 2001 and Enattah et al 2008
Sudan* 0.023 562 Tishkoff et al. 2007, Enattah et al. 2008 and Ingram et al. 2009b
Kenya* 0.023 388 Tishkoff et al. 2007
Ethiopia* 0.094 1080 Jones et al. 2009 in Itan et al. 2010, Ingram et al. 2009b
Tanzania* 0.293 512 Tishkoff et al. 2007 *Populations included in regression / correlation analysis.
Table 17: G-13907 regression / correlation analysis.
Model
R R Square
Adjusted R
Square
Std. Error of the
Estimate
Dimension0 1 .030a .001 -.332 .2348980
a. Predictors: (Constant), G-13907
C-13913. The C-13913 mutation has only been found so far at minimal
frequencies in Sudan and Ethiopia (Table 18). Though the correlation is much higher for
this polymorphism, 40% (Table 19), the lack of data and extremely low frequencies
make this unlikely to have a strong enough association with persistence to use for

55
prediction. More data would be necessary to make a more conclusive determination,
particularly through the North African and Middle Eastern areas.
Table 18: Samples of the C-13913 polymorphism.
Population C-13913
Frequency Sample Number Study Source(s)
Scandinavia 0.000 1876 Enattah et al. 2008
Israel 0.000 132 Ingram et al. 2007
Morocco 0.000 24 Enattah et al. 2008
Arabia 0.000 248 Enattah et al. 2008
Sudan 0.005* 185 Ingram et al. 2007
Cameroon 0.017* 117 Ingram et al. 2007
Ethiopia 0.026* 38 Ingram et al. 2007
*Populations included in regression / correlation analysis.
Table 19: C-13913 regression / correlation analysis.
Model R R Square Adjusted R Square Std. Error of the Estimate
Dimension0 1 .632a .400 -.201 .2931602
a. Predictors: (Constant), C-13913
A-22018. Another allele that also appears to highly correlate with persistence is
found in high association with the T-13910 allele. The A-22018 has been widely studied
in European populations. Enattah et al. (2007) notes that the A-22018 allele, though not
entirely associated, is certainly strongly associated with persistence. It is also noted that
the allele may simply have hitchhiked due to the long region of linkage disequilibrium.
Xu et al. (2010), however, has found a correlation with populations in North China in
which the T-13910 allele is not significantly present. In these populations the A-22018
allele appears to mirror the frequency of persistence. When analyzed by linear
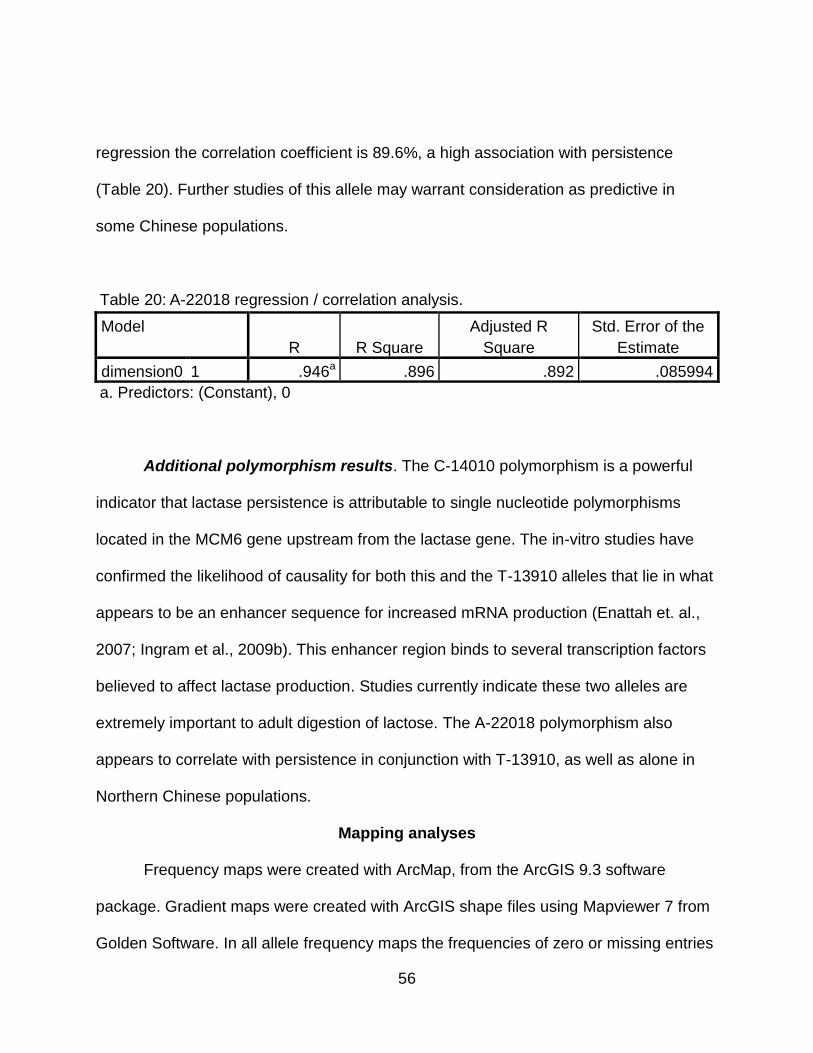
56
regression the correlation coefficient is 89.6%, a high association with persistence
(Table 20). Further studies of this allele may warrant consideration as predictive in
some Chinese populations.
Table 20: A-22018 regression / correlation analysis.
Model
R R Square
Adjusted R
Square
Std. Error of the
Estimate
dimension0 1 .946a .896 .892 .085994
a. Predictors: (Constant), 0
Additional polymorphism results. The C-14010 polymorphism is a powerful
indicator that lactase persistence is attributable to single nucleotide polymorphisms
located in the MCM6 gene upstream from the lactase gene. The in-vitro studies have
confirmed the likelihood of causality for both this and the T-13910 alleles that lie in what
appears to be an enhancer sequence for increased mRNA production (Enattah et. al.,
2007; Ingram et al., 2009b). This enhancer region binds to several transcription factors
believed to affect lactase production. Studies currently indicate these two alleles are
extremely important to adult digestion of lactose. The A-22018 polymorphism also
appears to correlate with persistence in conjunction with T-13910, as well as alone in
Northern Chinese populations.
Mapping analyses
Frequency maps were created with ArcMap, from the ArcGIS 9.3 software
package. Gradient maps were created with ArcGIS shape files using Mapviewer 7 from
Golden Software. In all allele frequency maps the frequencies of zero or missing entries

57
were removed to clarify the geographical cline. The strength of the frequency is visually
represented by the size of the box, with the largest boxes indicating the highest
frequencies. The gradient maps interpolate the same data to indicate high to low
frequencies, with missing areas filled in as a gradual decrease from the neighboring
frequencies to no information (gray). For this reason these maps are also predictive for
areas between and surrounding sample locations.
The first map (Fig. 7) indicates a decline in frequency of the T-13910 allele
geographically from Europe toward Africa and Asia. However, traces of the
polymorphism are found in the farthest reaches of these continents, suggesting either
convergent evolution or, more likely, a rapid surge of the mutation across great
distances, probably through migration. This map offers a strong visual reference for the
origin of this allele as somewhere on the Western European coastline, most likely on the
British Isles or Scandinavian Peninsula. The gradient map (Fig. 8) shows the high
frequency areas and the spread outward and is consistent with the area of origin.
A single outlier location in Sudan has a much higher than expected frequency
and may need to be further examined. One possible cause for this could be an
excessively high rate of inbreeding within the tested population. However, the Hardy
Weinberg expected homozygosity for CC is 1.10, and TT is 0.86, whereas inbreeding
would have resulted in a higher rate of TT homozygotes. Another possibility is an influx
of European genotypes that are not historically recorded, allowing the concentration of
T-13910 to rise as it mixed with indigenous populations. The only other feasible answer
would be errors of testing incorporated into the study itself. More studies need to be
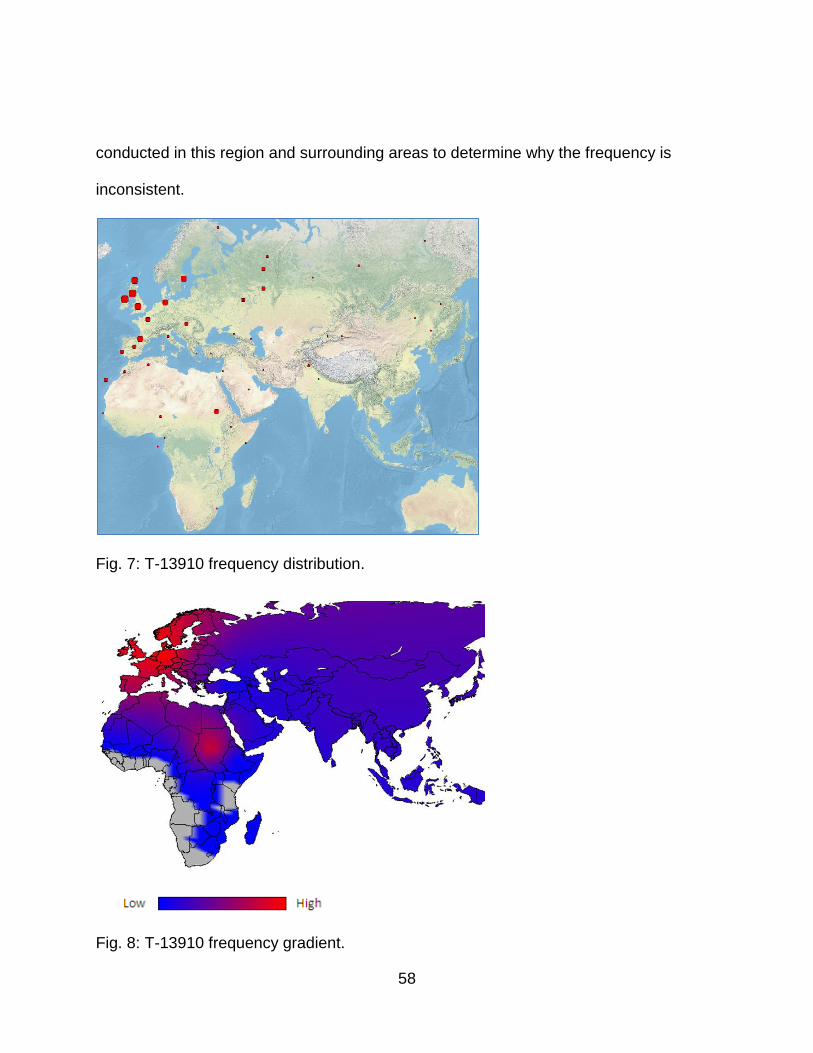
58
conducted in this region and surrounding areas to determine why the frequency is
inconsistent.
Fig. 7: T-13910 frequency distribution.
Fig. 8: T-13910 frequency gradient.
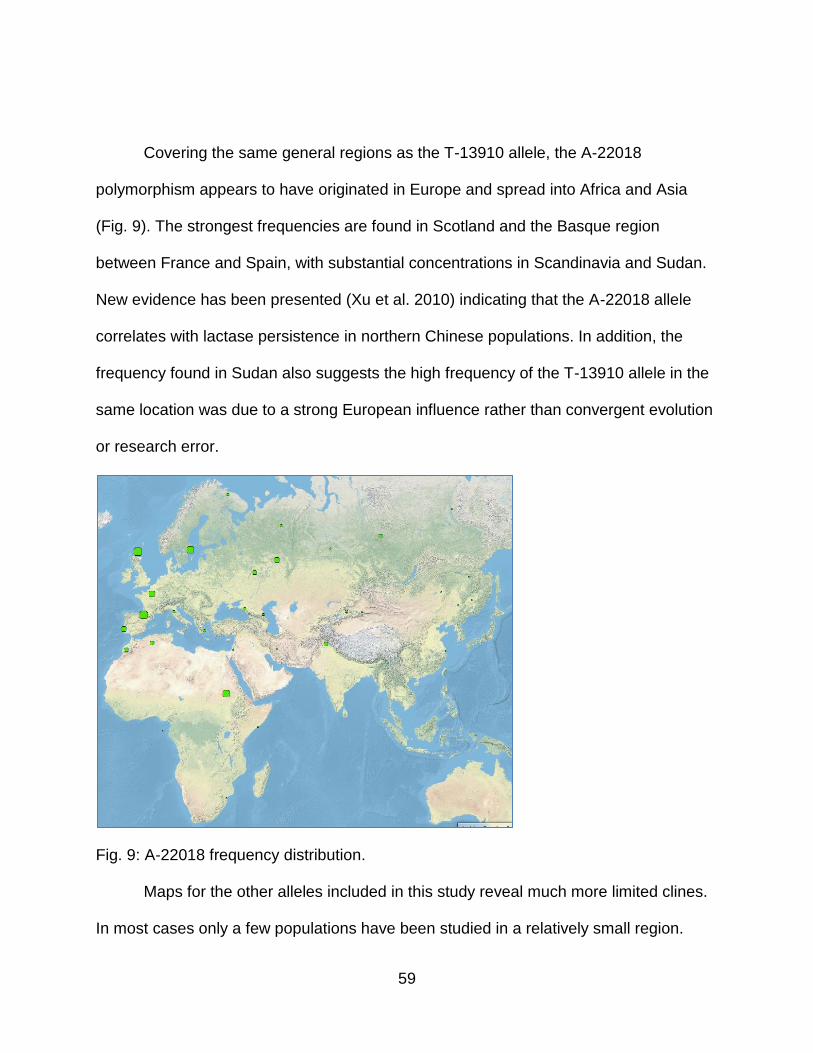
59
Covering the same general regions as the T-13910 allele, the A-22018
polymorphism appears to have originated in Europe and spread into Africa and Asia
(Fig. 9). The strongest frequencies are found in Scotland and the Basque region
between France and Spain, with substantial concentrations in Scandinavia and Sudan.
New evidence has been presented (Xu et al. 2010) indicating that the A-22018 allele
correlates with lactase persistence in northern Chinese populations. In addition, the
frequency found in Sudan also suggests the high frequency of the T-13910 allele in the
same location was due to a strong European influence rather than convergent evolution
or research error.
Fig. 9: A-22018 frequency distribution.
Maps for the other alleles included in this study reveal much more limited clines.
In most cases only a few populations have been studied in a relatively small region.
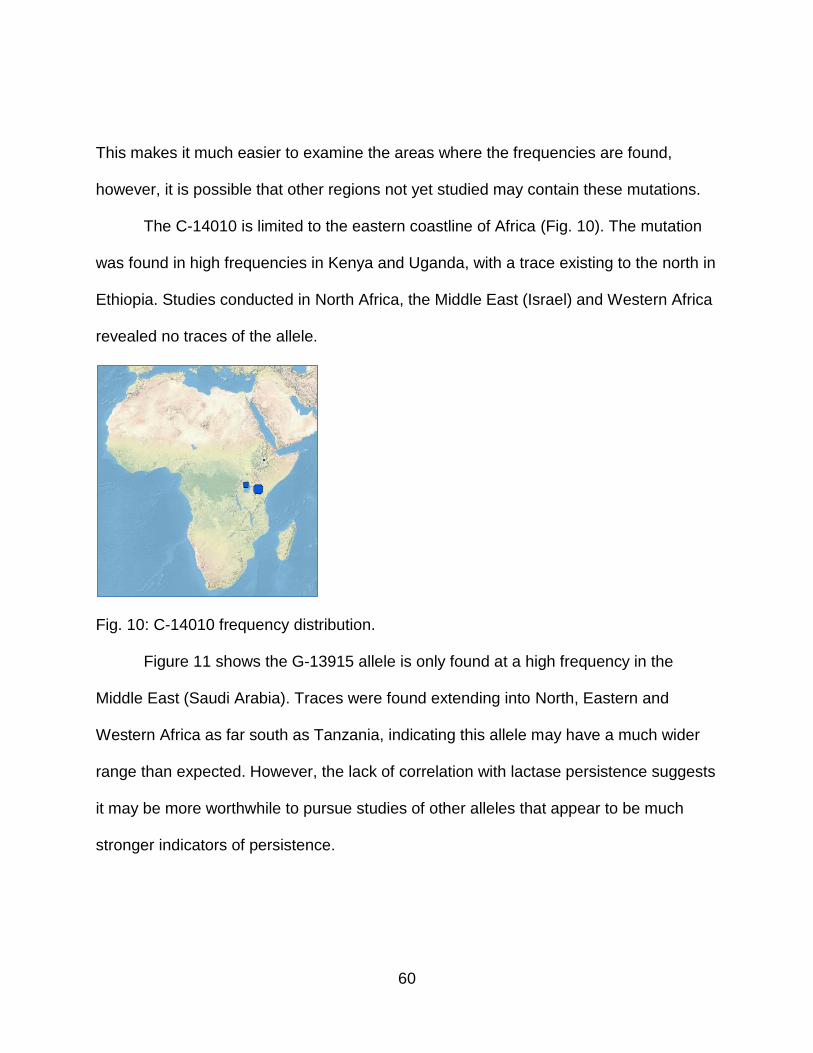
60
This makes it much easier to examine the areas where the frequencies are found,
however, it is possible that other regions not yet studied may contain these mutations.
The C-14010 is limited to the eastern coastline of Africa (Fig. 10). The mutation
was found in high frequencies in Kenya and Uganda, with a trace existing to the north in
Ethiopia. Studies conducted in North Africa, the Middle East (Israel) and Western Africa
revealed no traces of the allele.
Fig. 10: C-14010 frequency distribution.
Figure 11 shows the G-13915 allele is only found at a high frequency in the
Middle East (Saudi Arabia). Traces were found extending into North, Eastern and
Western Africa as far south as Tanzania, indicating this allele may have a much wider
range than expected. However, the lack of correlation with lactase persistence suggests
it may be more worthwhile to pursue studies of other alleles that appear to be much
stronger indicators of persistence.
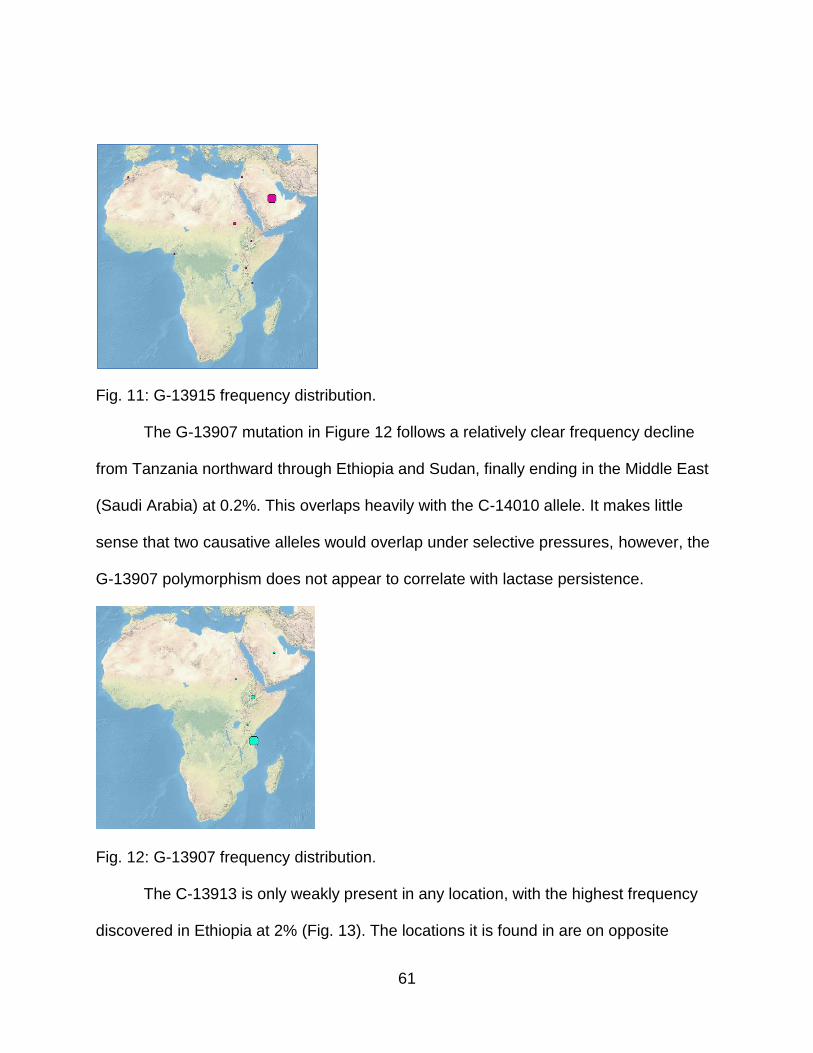
61
Fig. 11: G-13915 frequency distribution.
The G-13907 mutation in Figure 12 follows a relatively clear frequency decline
from Tanzania northward through Ethiopia and Sudan, finally ending in the Middle East
(Saudi Arabia) at 0.2%. This overlaps heavily with the C-14010 allele. It makes little
sense that two causative alleles would overlap under selective pressures, however, the
G-13907 polymorphism does not appear to correlate with lactase persistence.
Fig. 12: G-13907 frequency distribution.
The C-13913 is only weakly present in any location, with the highest frequency
discovered in Ethiopia at 2% (Fig. 13). The locations it is found in are on opposite

62
coasts, with 1.7% found in Cameroon. The allele was not found in Middle East samples,
however, very little information is available yet on this allele and many more studies are
needed to determine if there is a presence in other locations.
Fig. 13: C-13913 frequency distribution.
When viewing lactase persistence on a separate frequency map we see a similar
cline to the T-13910 and A-22018 alleles with higher frequencies generally found in
Europe, spreading east and south into Asia and Africa (Fig. 14). The gradient map
indicates strong European frequencies with some high frequency locations scattered
throughout Africa and moderate frequencies ranging throughout Asia (Fig. 15). Much of
the frequency range through Asia is predictive based on the available data. The East
African coast where the C-14010 is found also demonstrates persistence frequencies
that uphold the correlation between this mutation and lactase persistence.
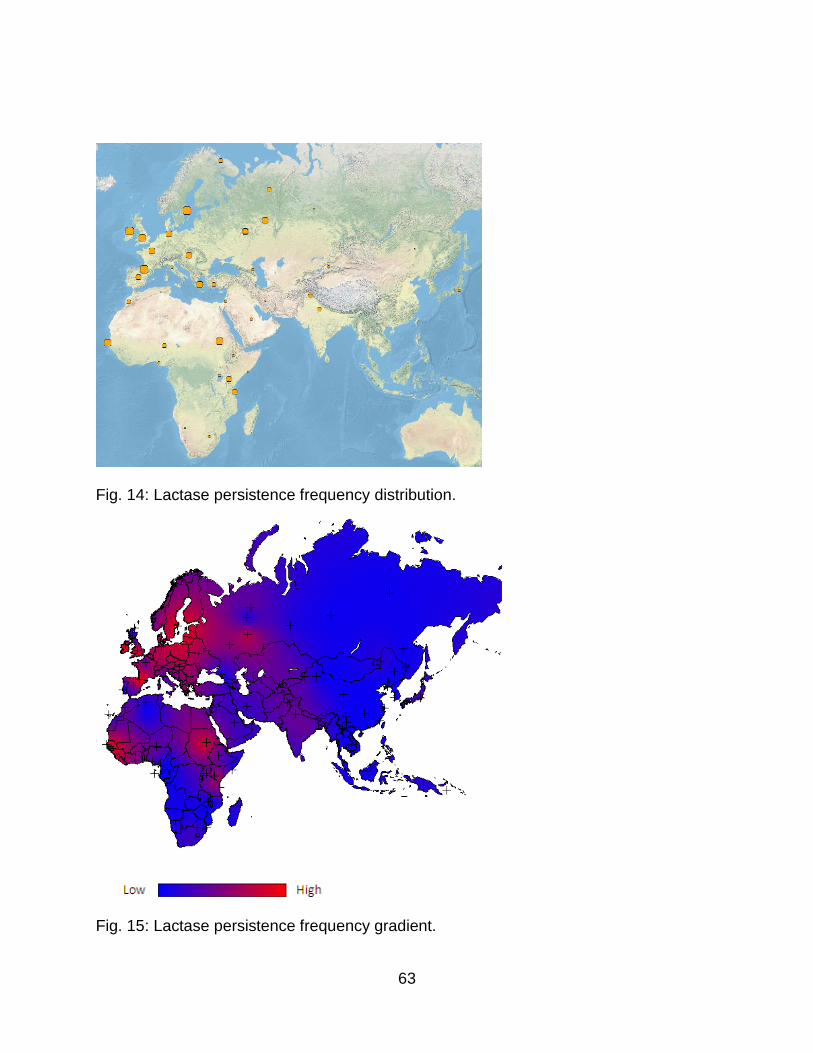
63
Fig. 14: Lactase persistence frequency distribution.
Fig. 15: Lactase persistence frequency gradient.
64
CHAPTER 6: CONCLUSIONS
Collecting individual data would better reveal clusters within populations,
however, the impossibility of using individual data for studying large populations led to
the use of population samples from published studies. The large geographical area
covered further increases the difficulty of individual assessments, since the overall
regions examined include billions of individuals. Using population samples may
introduce some error due to a variation in sample sizes; however, this offers a more
manageable representation of the frequency distributions throughout the Old World.
The origin of the T-13910 polymorphism, based on the map analysis appears to
have begun in the coastal area of Western Europe, probably in the British Isles or
nearby mainland coast. The mutation spread rapidly south and east, reaching notable
frequencies in Western Russia and Northwestern Africa, with trace frequencies found
extending into Northeastern China and Southeastern Africa. Population movements
through the Eurasian steppes following horse domestication over the last six thousand
years or more (Anthony, 2007) likely contributed to the traces seen in the far reaches of
Asia, nearly reaching the Pacific. Slave trade and European colonization undoubtedly
distributed some frequencies in the Sub-Saharan African region as well.
Examination of the lactase persistence frequencies indicates a similar
geographical spread, confirming the high correlation of the mutation with persistence.
The few cases in the European region with T-13910 frequencies that are high yet
persistence frequencies are low may be a reflection of a variation in the subsets of the

65
populations used in different studies that were then combined. Alternatively they may be
a reflection of secondary nonpersistence factors.
The large area of linkage disequilibrium surrounding the lactase gene suggests a
recent, rapid increase in the lactase persistence adaptation. Based on the Culture-
historical hypothesis, this rise in frequency occurred in conjunction with, or immediately
following, the spread of dairy consumption, naturally selecting for the change as
populations quickly adopted dairy pastoralism. However, archaeological evidence
indicates the use of dairy during the Neolithic period, prior to the appearance of the T-
13910 mutation, beginning at least 8,500 years ago and spreading from the Middle East
region into Europe, reaching Britain by the 5th millennium BC. All evidence collected
indicates the T-13910 allele originated in Western Europe, then spread into Russia, the
Middle East and North Africa. Based on the Culture-historical hypothesis, since the two
clines flow in opposing directions the T-13910 mutation was probably much more recent
than dairy pastoralism, and selection was even stronger than expected. Although the
Culture-historical hypothesis applies to the concept of a rise in frequency after dairy
practices are adopted, it should be noted that lactase persistence occurred and spread
well after dairying, from Western Europe to the Middle East.
Haplotype A in the European area is the carrier of the T-13910 mutation and the
widespread focus of lactase persistence correlation studies. The large block of linkage
disequilibrium surrounding the lactase gene in 77% of the Europeans exhibiting this
haplotype is another piece of evidence supporting intense selection of this region. Fst
tests reveal a highly significant distribution between genome wide markers and the

66
markers surrounding the lactase gene proving this block consists of about one million
bases.
Between species studies that compare the lactase gene region of humans with
other primates were used to determine the ancestral human haplotypes (Enattah et al.,
2007). This allows an age estimate to be calculated for the T-13910 allele. Using a 25
year generation coefficient, Enattah et al. (2007) revealed the probable age as
approximately 5,000 to 9,000 years in Finnish populations. In evolutionary terms this is
an extremely rapid acceleration of an adaptive trait. This rate of adaptation is highly
unlikely to have occurred without potent selective pressure.
Examining Hardy Weinberg Equilibrium equations in the populations that contain
the T-13910 polymorphism reveals an average heterozygosity excess of 13%. An
excess of heterozygotes is another indicator of natural selection as the new allele
begins to move toward fixation. When comparing the homozygosity of the C-13910
allele, recessive for nonpersistence, to the expected Hardy Weinberg Equilibrium, a
67% deficiency is revealed. This not only indicates selective pressures, but the direction
they are moving.
The analyses of several additional alleles suspected of association with
persistence in the Middle East and Africa reveal what is most likely convergent evolution
on a phenotypic level only. A robust correlation can be drawn between C-14010 and
persistence, as well as a weaker correlation between C-13913 and persistence. The
evidence of the T-13910 polymorphism in a Fulani Sudanese population was potentially
a case of genotypic convergent evolution, however, the A-22018 polymorphism,

67
predominantly located in the same European regions as T-13910, exhibits a presence
consistent with the European genotype. It is highly unlikely two alleles would evolve
collectively in two geographically separated populations.
Statistical analyses support the correlation between the T-13910, A-22018,
C-14010 and C-13913 alleles and lactase persistence. In-vitro tests conducted on the
T-13910, C-14010 and C-13913 polymorphisms suggest these alleles not only correlate
with persistence, but are causal. This lends even greater importance to the correlation
of these mutations, as opposed to only markers, with persistence, and allows them to
be used for predictive purposes. Based on these in-vitro studies, the region containing
these alleles appears to act as an enhancer region to the lactase gene. Transcriptional
enhancers usually span 100 – 2,000 bases, and lay within 100,000 bases of the gene
they affect (Arnosti and Kulkarni, 2005). Regardless of the distance between them, the
nonlinear folding of DNA allows the enhancer to exist in close proximity to the gene it
augments. Studying enhancers helps with understanding the interaction between
genes, and the regulation of those genes.
Combining the data from different analyses and examinations including maps,
linkage disequilibrium studies, haplotype studies, archaeological data, statistical
analyses and Hardy Weinberg equations offers a detailed insight into the evolution of
the T-13910 allele and lactase persistence in general. Assuming causality for the T-
13910, C-14010 and C-13913 polymorphisms, the geographical correlation with
persistence allows both prediction and identification of the presence of additional causal
alleles through unexplained persistence frequencies. The effects of natural selection

68
can never be proven absolutely, however a clear footprint exists in the data collected
and analyzed for this study.
If the T-13910 allele were not subject to natural selection, we would see several
differences in the data obtained. Although haplotype A would still be dominant in
Europe, since the spread into Eurasia occurred after the four global haplotypes came
into existence, we would see a greater diversity in the lactase gene region. The large
region of linkage disequilibrium would be far smaller or nonexistent. The frequency of
the mutation would take far longer to reach appreciable levels within the population of
origin, and would be much more likely to reach equilibrium without becoming excessive
for homozygosity. Migration across wide geographical regions may still take place but
on a much slower and more sporadic scale, with more isolated populations less likely to
be affected. To reach the high frequencies we see, as much as 77% in Europeans,
would most likely require longer than the 35,000 (minimum) years humans have been in
Europe.
The actual selective pressures have yet to be identified, although theories have
been put forth regarding calcium intake in northern latitudes, food and water sources in
desert regions or malarial prevention (as nonpersistence). However, it is more likely that
different pressures would apply in different geographical locations. Further studies and
examinations of specific geographical locations may help identify more potential causal
factors and clarify the reasons for the strong selection for lactase persistence.
69
LITERATURE CITED
Akey JM, Eberle MA, Rieder MJ, Carlson CS, Shriver MD, Nickerson DA, Kruglyak L.
2004. Population history and natural selection shape patterns of genetic variation in 132
genes. PLoS Biol 2(10):1591-1599.
Anagnostou P, Battaggia C, Voia V, Capelli C, Fabbri C, Pettener D, Destro-Bisol G,
Luiselli D. 2009. Tracing the distribution and evolution of lactase persistence in
Southern Europe through the study of the T-13910 variant. Am J Hum Biol 21(2):217-219.
Anderson B, Vullo C. 1994. Did malaria select for primary adult lactase deficiency? Gut
35:1487-1489.
Anthony DW. 2007. The horse, the wheel and language: How bronze-age riders from
the Eurasian steppes shaped the modern world. Princeton, New Jersey: Princeton
University Press.
Arnosti DN, Kulkarni MM. 2005. Transcriptional enhancers: Intelligent enhanceosomes
or flexible billboards? J Cell Biochem 94:890-898.
Avallone EV, De Carolis A, Loizos P, Corrado C, Vernia P. 2010. Hydrogen breath test -
diet and basal H2 excretion: A technical note. Digestion 82:39-41.
Bamshad M, Wooding SP. 2003. Signatures of natural selection in the human genome.
Nature Rev Genet 4(2):99.

70
Beja-Pereira A, Luikart G, England PR, Bradley DG, Jann OC, Bertorelle G,
Chamberlain AT, Nunes TP, Metodiev S, Ferrand N, Erhardt G. 2004. Erratum: Gene-
culture coevolution between cattle milk protein genes and human lactase genes. Nat
Genet 36(1):106-106.
Bersaglieri T, Sabeti PC, Patterson N, Vanderploeg T, Schaffner SF, Drake JA, Rhodes
M, Reich DE, Hirschhorn JN. 2004. Genetic signatures of strong recent positive
selection at the lactase gene. Am J Hum Genet 74(6):1111-1120.
Bloom G, Sherman PW. 2005. Dairying barriers affect the distribution of lactose
malabsorption. Evol Hum Behav 26(4):301-312.
Burger J, Kirchner M, Bramanti B, Haak W, Thomas MG. 2007. Absence of the lactase-
persistence-associated allele in early Neolithic Europeans. PNAS 104(10):3736-3641.
Campbell AK, Waud JP, Matthews SB. 2009. The molecular basis of lactose
intolerance. Science Prog 92(3-4):241-288.
Choi RP. 1958. Lactose symposium: Physical and chemical aspects of lactose. J Dairy
Sci 41:319-324.
Choi RP, Tatter CW, O'Malley CM, Fairbanks BW. 1948. A solubility method for the
determination of alpha and beta lactose in dry products of milk. J Dairy Sci 32(5):391-
397.

71
Coelho M, Sequeira F, Luiselli D, Beleza S, Rocha J. 2009. On the edge of Bantu
expansions: MtDNA, Y chromosome and lactase persistence genetic variation in
Southwestern Angola. BMC Evol Biol 9:1-18.
Cook GC, al-Torki MT. 1975. High intestinal lactase concentrations in adult Arabs in
Saudi Arabia. Br Med J 3:135-136.
Craig OE, Chapman J, Heron C, Willis LH, Bartosiewicz L, Taylor G, Whittle A, Collins
M. 2005. Did the first farmers of Central and Eastern Europe produce dairy foods?
Antiquity 79:882-894.
Crittendon RG, Bennett LE. 2005. Cow's milk allergy: A complex disorder. J Am Coll
Nutr 24(90006):582S-591S.
Doyle JJ, Gaut BS. 2000. Evolution of genes and taxa: A primer. Plant Mol Biol 42:1-23.
Dudd SN, Evershed RP. 1998. Direct demonstration of milk as an element of
archaeological economies. Science 282(5393):1478-1481.
Enattah NS, Jenson TGK, Nielsen M, Lewinski R, Kuokkanen M, Rasinperä H, El-
Shanti H, Seo JK, Alifrangis M, Khalil IF, Natah A, Ali A, Natah S, Comas D, Mehdi SQ,
Groop L, Vestergaard EM, Imtiaz F, Rashed MS, Meyer B, Treelson J, Peltonen L.
2008. Independent introduction of two lactase-persistence alleles into human
populations reflects different history of adaptation to milk culture. Am J Hum Genet
82:57-72.
72
Enattah NS, Forsblom C, Rasinperä H, Tuomi T, Groop PH, Järvelä I. 2004. The
genetic variant of lactase persistence C (-13910) T as a risk factor for type I and II
diabetes in the Finnish population. Eur J Clin Nutr 58(9):1319-1322.
Enattah NS, Sahi T, Savilahti E, Terwilliger JD, Peltonen L, Järvelä I. 2002.
Identification of a variant associated with adult-type hypolactasia. Nat Genet 30(2):233.
Enattah NS, Trudeau A, Pimenoff V, Maiuri L, Auricchio S, Greco L, Rossi M, Lentze M,
Seo JK, Rahgozar S, Khalil I, Alifrangis M, Natah S, Groop L, Shaat N, Kozlov A,
Verschubskaya G, Comas D, Bulayeva K, Mehdi SQ, Terwilliger JD, Sahi T, Savilahti E,
Perola M, Sajantila A, Järvelä I, Peltonen L. 2007. Evidence of still-ongoing
convergence evolution of the lactase persistence T-13910 alleles in humans. Am J Hum
Genet 81(3):615-625.
Evershed RP, Payne S, Sherratt AG, Copley MS, Coolidge J, Urem-Kotsu D, Kotsakis
K, Özdoğan M, Özdoğan AE, Nieuwenhuyse O, Akkermans PMMG, Bailey D,
Andeescu R, Campbell S, Farid S, Hodder I, Yalman N, Özbaşaran M, Biçakci E,
Garfinkel Y, Lefy T, Burton MM. 2008. Earliest date for milk use in the Near East and
Southeastern Europe linked to cattle herding. Nature 455(25):528-531.
Flatz G, Schildge C, Sekou H. 1986. Distribution of adult lactase phenotypes in the
Tuareg of Niger. Am J Hum Genet 38:515-520.

73
Fox PF. 2009. Lactose: Chemistry and properties. In: McSweeney P, Fox PF, editors.
Advanced Dairy Chemistry, Volume 3: Lactose water, salts and minor constituents. New
York, NY: Springer Science+Business Media, LLC. p 1-15.
Gerbault P, Moret C, Currat M, Sanchez-Mazas A. 2009. Impact of selection and
demography on the diffusion of lactase persistence. PLoS ONE 4(7):e6369.
Greenfield HJ, Chapman J, Clason AT, Gilbert AS, Hesse B, Milisauskas S. 1988. The
origins of milk and wool production in the Old World: A zooarchaeological perspective
from the Central Balkans. Curr Anthropol 29(4):573-593.
Haenlein GFW. 2007. About the evolution of goat and sheep milk production. Small
Ruminant Res 68:3-6.
Harris EE, Meyer D. 2006. The molecular signature of selection underlying human
adaptations. Yearb Phys Anthropol 49:89-130.
Harvey CB, Hollox EJ, Poulter M, Wang Y, Rossi M, Auricchio S, Iqbal TH, Cooper BT,
Barton R, Sarner M, Korpela R, Swallow DM. 1998. Lactase haplotype frequencies in
Caucasians: Association with the lactase Persistence/Non-persistence polymorphism.
Ann Hum Genet 62(3):215-223.
Hollox EJ, Poulter M, Zvarik M, Ferak V, Krause A, Jenkins T, Saha N, Kozlov AI,
Swallow D, M. 2001. Lactase haplotype diversity in the Old World. Am J Hum Genet
68:160-172.
74
Hollox E. 2005. Evolutionary genetics: Genetics of lactase persistence - fresh lessons in
the history of milk drinking. Eur J Human Genet 13(3):267-269.
Hollox EJ, Poulter M, Wang Y, Krause A, Swallow DM. 1999. Common polymorphism in
a highly variable region upstream of the human lactase gene affects DNA-protein
interactions. Eur J Human Genet 7(7):791.
Holsinger KE, Weir BS. 2009. Genetics in geographically structured populations:
Defining, estimating and interpreting FST. Nature Rev Genet 10(9):639-650.
Hu T, Banzhaf W. 2008. Nonsynonymous to synonymous substitution ratio ka/ks:
Measurement for rate of evolution in evolutionary computation. In: Anonymous Parallel
Problem Solving From Nature. Heidelberg: Springer Berlin. p 448-457.
Imtiaz F, Savilahti E, Sarnesto A, Trabzuni D, Al-Kahtani, K, Kagevi I, Rashed MS,
Meyer BF, Järvelä I. 2007. The T/G-13915 variant upstream of the lactase gene (LCT)
is the founder allele of lactase persistence in an urban Saudi population. J Med Genet
44(10):e89.
Ingram CJE, Elamin MF, Mulcare CA, Weale ME, Tarekegn A, Raga TO, Bekele E,
Elamin FM, Thomas MG, Bradman N, Swallow DM. 2007. A novel polymorphism
associated with lactose tolerance in Africa: Multiple causes for lactase persistence?
Hum Genet 120:779-788.

75
Ingram CJE, Mulcare CA, Itan Y, Thomas MG, Swallow DM. 2009a. Lactose digestion
and the evolutionary genetics of lactase persistence. Hum Genet 124(6):579-591.
Ingram CJE, Raga TO, Tarekegn A, Browning SL, Elamin MF, Bekele E, Thomas MG,
Weale ME, Bradman N, Swallow DM. 2009b. Multiple rare variants as a cause of a
common phenotype: Several different lactase persistence associated alleles in a single
ethnic group. J Mol Evol 69(6):579-588.
Itan Y, Jones B, L., Ingram CJE, Swallow DM, Thomas MG. 2010. A worldwide
correlation of lactase persistence phenotype and genotypes. BMC Evol Biol 10(36):1-
11.
Itan Y, Powell A, Beaumont MA, Burger J, Thomas MG. 2009. The origins of lactase
persistence in Europe. PLoS Comput Biol 5(8):1-13.
Kitts D, D., Kwong W. 2004. Calcium bioavailability of dairy components. In: Shortt C,
O'Brien J, editors. Handbook of Functional Dairy Products. Boca Raton: CRC Press. p
169-197.
Laaksonen MML, Impivaara O, Sievänen H, Viikari JSA, Lehtimäki TJ, Lamberg-Allardt
C, Kärkkäinen MUM, Välimäki M, Heikkinen J, Kröger LM, Kröger HPJ, Jurvelin JS,
Kähönen MAP, Raitakari OT. 2009. Associations of genetic lactase non-persistence and
sex with bone loss in young adulthood. Bone 44(5):1003-1009.
76
Lomer MCE, Parkes GC, Sanderson JD. 2008. Review article: Lactose intolerance in
clinical practice – myths and realities. Aliment Pharmacol Ther 27(2):93-103.
McKinnon AO, Voss JL. 1993. Equine reproduction. Ames, Iowa: Blackwell Publishing
Professional.
Montgomery RK, Krasinski SD, Hirschhorn JN, Grand RJ. 2007. Lactose and lactase -
who is lactose intolerant and why. J Pediatr Gastroenterol Nutr 45:S131-S137.
Olds LC, Ahn JK, Sibley E. 2011. -13910*G DNA polymorphism associated with lactase
persistence in Africa interacts with Oct-1. Hum Genet 129:111-113.
Rajput B, Shaper NL, Shaper JH. 1995. Transcriptional regulation of murine B1,4-
galactosyltransferase in somatic cells. J Biol Chem 271(9):5131-5142.
Salminen S, Playne M, Lee YK. 2004. Successful probiotic lactobacilli: Human studies
on probiotic efficacy. In: Shortt C, O'Brien J, editors. Handbook of Functional Dairy
Products. Boca Raton: CRC Press. p 13-32.
Seppo L, Tuure T, Korpela R, Järvelä I, Rasinperä H, Sahi T. 2008. Can primary
hypolactasia manifest itself after the age of 20 years? A two-decade follow-up study.
Scand J Gastroenterol 43(9):1082-1087.
Shaper NL, Charron M, Lo N, Shaper JH. 1998. B1,4-galactosyltransferase and lactose
biosynthesis: Recruitment of a housekeeping gene from the nonmammalian vertebrate

77
gene pool for a mammary gland specific function. J Mammary Gland Biol Neoplasia
3(3):315-324.
Shaper NL, Meurer JA, Joziasse DH, Chou TD, Smith EJ, Schnaar RL, Shaper JH.
1997. The chicken genome contains two functional nonallelic B1,4-
galactosyltransferase genes: Chromosomal assignment to syntenic regions tracks fate
of the two gene lineages in the human genome. J Biol Chem 272(50):31389-31399.
Shortt C, Shaw D, Mazza G. 2004. Overview of opportunities for health-enhancing
functional dairy products. In: Shortt C, O'Brien J, editors. Handbook of Functional Dairy
Products. Boca Raton: CRC Press. p 1-12.
Shrier I, Szilagyi A, Correa JA. 2008. Impact of lactose containing foods and the
genetics of lactase on diseases: An analytical review of population data. Nutr Cancer
60(3):292-300.
Sinnott M. 2007. Carbohydrate chemistry and biochemistry: Structure and mechanism.
Cambridge, United Kingdom: Royal Society of Chemistry.
Smith GD, Lawlor DA, Timpson NJ, Baban J, Kiessling M, Day INM, Ebrahim S. 2009.
Lactase persistence-related genetic variant: Population substructure and health
outcomes. Eur J Human Genet 17(3):357-367.

78
Sterchi EE, Mills PR, Fransen JAM, Hauri H, Lentze MJ, Naim HY, ginsel L, Bond J.
1990. Biogenesis of intestinal lactase-phlorizin hydrolase in adults with lactose
intolerance. J Clin Invest 86:1329-1337.
Sun H, Qiao Y, Feng C, Xu L, Jing B, Fu S. 2007. The lactase gene -13910T allele can
not predict the lactase-persistence phenotype in North China. Asia Pac J Clin Nutr
16(4):598-601.
Swallow DM. 2003. Genetics of lactase persistence and lactose intolerance. Annu Rev
Genet 37(1):197-219.
Szilagyi A, Nathwani U, Vinokuroff C, Correa JA, Shrier I. 2006. Evaluation of
relationships among national colorectal cancer mortality rates, genetic lactase non-
persistence status, and per capita yearly milk and milk product consumption. Nutr
Cancer 55(2):151-156.
Tag CG, Schifflers M, Mohnen M, Gressner AM, Weiskirchen R. 2007. A novel proximal
–13914G>A base replacement in the vicinity of the common-13910T/C lactase gene
variation results in an atypical LightCycler melting curve in testing with the MutaREAL
lactase test. Clin Chem 53:146-148.
Tishkoff SA, Reed FA, Ranciaro A, Voight BF, Babbitt CC, Silverman JS, Powell K,
Mortensen HM, Hirbo JB, Osman M, Ibrahim M, Omar SA, Lema G, Nyambo TB, Ghori
J, Bumpstead S, Pritchard JK, Wray GA, Deloukas P. 2007. Convergent adaptation of
human lactase persistence in Africa and Europe. Nat Genet 39(1):31-40.
79
Torniainen S, Freddara R, Routi T, Gijsbers C, Catassi C, Höglund P, Savilahti E,
Järvelä I. 2009. Four novel mutations in the lactase gene (LCT) underlying congenital
lactase deficiency (CLD). BMC Gastrolenterol 9(8).
Vigne J, Helmer D. 2007. Was milk a "secondary product" in the Old World
neolithisation process? Its role in the domestication of cattle, sheep and goats.
Anthropozoologica 42(2):9-40.
Vonk RJ, Stellaard F, Priebe MG, Koetse HA, Hagedoorn RE, de Bruijn S, Elzinga H,
Lenoir-Wijnkoop I, Antoine J-. 2001. The 13C/2H-glucose test for determination of small
intestinal lactase activity. Eur J Clin Invest 31:226-233.
Wiley AS. 2004. "Drink milk for fitness": The cultural politics of human biological
variation and milk consumption in the United States. AA 106(3):506-517.
Wu X, Luo Z, Luo L, Ren F, Han B, Nout MJR. 2009. A survey on composition and
microbiota of fresh and fermented yak milk at different tibetan altitudes. Dairy Sci
Technol 89:201-209.
Xu L, Sun H, Zhang X, Wang J, Sun D, Chen F, Bai J, Fu S. 2010. The -22018A Allele
matches the lactase persistence phenotype in Northern Chinese populations. Scand J
Gastroenterol 45:168-174.
You Z, Komamura Y, Ishimi Y. 1999. Biochemical analysis of the intrinsic Mcm4-Mcm6-
Mcm7 DNA helicase activity. Mol Cell Biol 19(12):8003-8015.