the other end of the spear: the tooth- to-tail ratio (t3r ... · john mcgrath’s the other end of...
TRANSCRIPT
The Other End of the Spear: The Tooth-to-Tail Ratio (T3R) in Modern Military
Operations
John J. McGrath
The Long War SeriesOccasional Paper 23
Combat Studies Institute PressFort Leavenworth, Kansas
OP 23
Report Documentation Page Form ApprovedOMB No. 0704-0188
Public reporting burden for the collection of information is estimated to average 1 hour per response, including the time for reviewing instructions, searching existing data sources, gathering andmaintaining the data needed, and completing and reviewing the collection of information. Send comments regarding this burden estimate or any other aspect of this collection of information,including suggestions for reducing this burden, to Washington Headquarters Services, Directorate for Information Operations and Reports, 1215 Jefferson Davis Highway, Suite 1204, ArlingtonVA 22202-4302. Respondents should be aware that notwithstanding any other provision of law, no person shall be subject to a penalty for failing to comply with a collection of information if itdoes not display a currently valid OMB control number.
1. REPORT DATE 2007 2. REPORT TYPE
3. DATES COVERED 00-00-2007 to 00-00-2007
4. TITLE AND SUBTITLE The Other End of the Spear: The Tooth-to-Tail Ratio (T3R) in ModernMilitary Operations
5a. CONTRACT NUMBER
5b. GRANT NUMBER
5c. PROGRAM ELEMENT NUMBER
6. AUTHOR(S) 5d. PROJECT NUMBER
5e. TASK NUMBER
5f. WORK UNIT NUMBER
7. PERFORMING ORGANIZATION NAME(S) AND ADDRESS(ES) Cpmabt Studies Institute,Fort Leavenworth,KS,66027
8. PERFORMING ORGANIZATIONREPORT NUMBER
9. SPONSORING/MONITORING AGENCY NAME(S) AND ADDRESS(ES) 10. SPONSOR/MONITOR’S ACRONYM(S)
11. SPONSOR/MONITOR’S REPORT NUMBER(S)
12. DISTRIBUTION/AVAILABILITY STATEMENT Approved for public release; distribution unlimited
13. SUPPLEMENTARY NOTES
14. ABSTRACT
15. SUBJECT TERMS
16. SECURITY CLASSIFICATION OF: 17. LIMITATION OF ABSTRACT Same as
Report (SAR)
18. NUMBEROF PAGES
125
19a. NAME OFRESPONSIBLE PERSON
a. REPORT unclassified
b. ABSTRACT unclassified
c. THIS PAGE unclassified
Standard Form 298 (Rev. 8-98) Prescribed by ANSI Std Z39-18
Military History / General
The Long War SeriesOccasional Paper 23
Combat Studies Institute PressFort Leavenworth, Kansas
The Long War Series O
ccasional Paper 23M
cGrath
CSI Press

The Other End of the Spear: The Tooth-to-Tail Ratio (T3R) in Modern Military
Operations
John J. McGrath
Combat Studies Institute PressFort Leavenworth, Kansas
23OP

Library of Congress Cataloging-in-Publication Data
McGrath, John J., 1956- The Other end of the spear : the tooth-to-tail ratio (T3R) in modern military operations / John J. McGrath. p. cm. Includes bibliographical references and index.1. Deployment (Strategy)--Case studies. I. Title. U163.M393 2007 355.4--dc22
2007028234
CSI Press publications cover a variety of military history topics. The views expressed in this CSI Press publication are those of the author(s) and not necessarily those of the Department of the Army or the Department of Defense. A full list of CSI Press publications, many of them available for downloading, can be found at http://usacac.army.mil/CAC/csi/RandP/CSIpubs.asp.
The seal of the Combat Studies Institute authenticates this document as an offi cial publication of the CSI. It is prohibited to use the CSI offi cial seal on any republication of this material without the expressed written permission of the Director of CSI.
This is the Offi cial US Government edition of this publication and is herein identifi ed to certify its authenticity. Use of the 978-0-16-078944-1 ISBN prefi x is for US Government Printing Offi ce Offi cial Editions only. The Superintendent of Documents of the US Government Printing Offi ce
requests that any reprinted edition clearly be labeled as a copy of the authentic work with a new ISBN.
iii
ForewordJohn McGrath’s The Other End of the Spear is a timely historical
analysis and an important follow-on work to his earlier analysis of troop density trends in CSI Occasional Paper 16, Boots on the Ground. As that work showed, this paper also shows the timeless value of history and its relevance to current events. Boots on the Ground analyzed the ratio between the numbers of troops employed in military operations relative to the population in a number of irregular confl icts. This study analyzes the composition of such forces to answer the question: what have been the historical trends in the ratio of deployed forces directly engaged in fi ghting, relative to those engaged in noncombat functions? This ratio is commonly, if inaccurately, called the “tooth-to-tail ratio.”
McGrath’s study fi nds that the tooth-to-tail ratio, among types of deployed US forces, has steadily declined since World War II, just as the nature of warfare itself has changed. At the same time, the percentage of deployed forces devoted to logistics functions and to base and life support functions have both increased, especially with the advent of the large-scale of use of civilian contractors.
A segment of American military historians and policy makers has long been enamored with a genre of military history that seeks to quantify war, to reduce it to known variables, and to posit solutions to future military confl icts based on mathematical formulae. The practice of war contains a strong element of science, but in the end, the practice of war is an art. This study cannot be used to guarantee victory simply by composing a force of the proportional fi gures presented in the conclusion. However, it does provide a good baseline, based on historical precedent, for future planning.
This work, coupled with Boots on the Ground, provides a unique analysis of the size and composition of military forces as found in historical patterns. Policy makers, commanders, and staff offi cers should use these two studies as a basis from which to begin their analysis of the particular campaign at hand. They will then need to apply their understanding of the objectives, the nature of the confl ict, and local and regional culture and conditions to the analysis to create a winning military plan. It is our belief at CSI that this kind of historical analysis will inform and educate today’s military and civilian leaders as they carry out our nation’s most important policies. CSI—The Past is Prologue!
Timothy R. ReeseColonel, ArmorDirector, Combat Studies Institute


v
Acknowledgments
This work marks my second foray into the fi eld of quantitative analy-sis of military history. As such, it serves as a companion volume to my previous such work, Boots on the Ground: Troop Density in Contingency Operations. The latter work studied the question of “how many troops do we need?” This volume analyzes the question “what kind of troops do we need?” While the tooth-to-tail ratio is a topic often discussed in military circles, found far less frequently are detailed analyses of the proportions of various elements within military force. I hope that this work fi lls that void. Despite the quantitative nature of this work, the mathematics used is of the elementary level, familiar even to most historians like myself.
I must acknowledge the pioneer of quantitative analysis of military history, the late Colonel Trevor Dupuy, as well as recent contributors to this fi eld including Dr. Robert Rush of the US Army Center of Military History and Niklas Zetterling of the Swedish National Defense College.
Kendall Gott of the Combat Studies Institute’s Research and Publications Team provided excellent support and guidance on this project as did colleagues, superiors and associates within CSI. Contributing greatly to the success of this project has been its editor, Jennifer Lindsey, whose skill at the intricacies of composition and layout are evident in every line and graphic of this work. Publication was also greatly assisted by the efforts of Betty Weigand, Robin Kern and Michael Brooks.
The soldiers of the United States Army and the members of the other armed services require specifi c acknowledgment. It is my hope, that in some small way, this study will augment their superb efforts.
John J. McGrath Combat Studies Institute Fort Leavenworth, Kansas


vii
ContentsPage
Foreword ................................................................................................. iiiAcknowledgments .....................................................................................vList of Figures ....................................................................................... viii
List of Tables .............................................................................................x
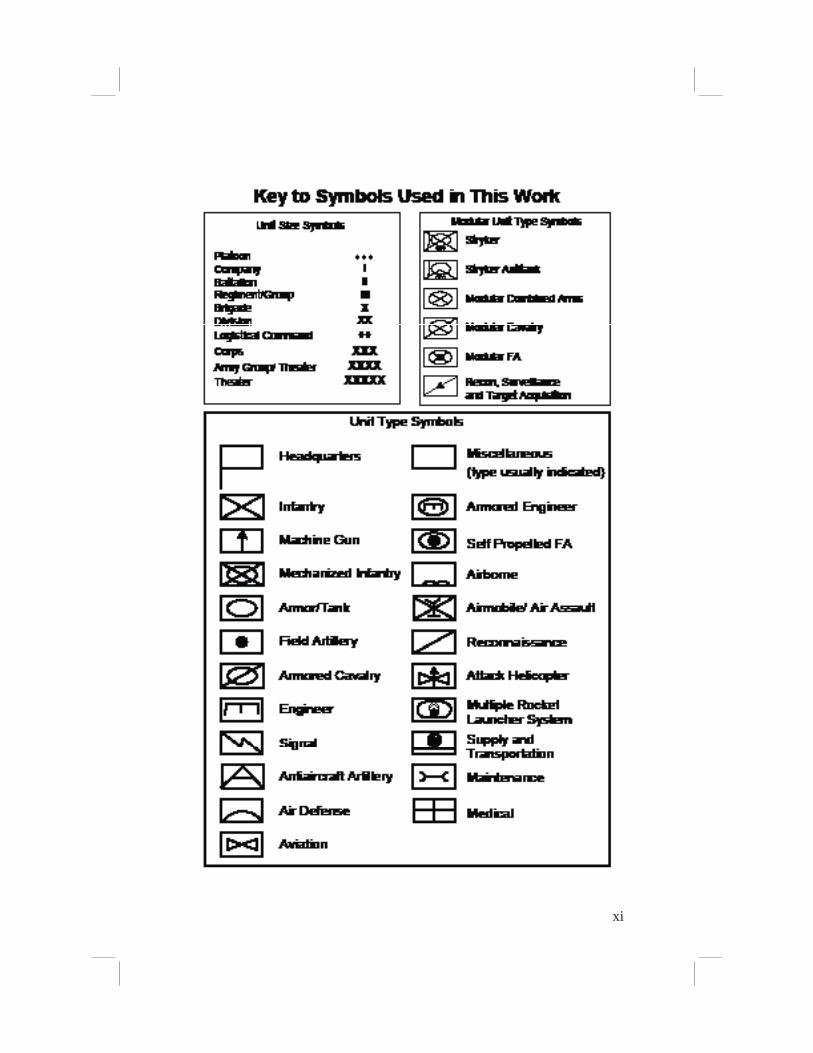
Keys to Symbols Used in this Work ........................................................xiChapter 1. Introduction ............................................................................. 1
Methodology ........................................................................... 2Functional Tooth-to-Tail Categories ....................................... 4Combat Elements .................................................................... 4Noncombat Elements .............................................................. 5
Logistical Elements ............................................................ 5Life Support Elements ........................................................ 6Headquarters and Administrative Elements ....................... 7
Chapter 2. Historical Experience .............................................................11World War I ............................................................................11
Theater Level ....................................................................11The AEF Division ............................................................ 13
World War II .......................................................................... 16Overall Planning Estimates ............................................. 16The European Theater of Operations (ETO) ................... 18Divisions in the ETO ....................................................... 21
Korean War ........................................................................... 24Vietnam War .......................................................................... 28The Cold War Era, 1974 ........................................................ 32
The Nunn Amendment .................................................... 32ROAD Armored Division ................................................ 36
Division 86/Army of Excellence/DESERT STORM 1991 ... 39The Modular Army and the New Millennium....................... 43
Stryker Brigades .............................................................. 44Modular Brigades ............................................................ 45
Iraq and the Tooth-to-Tail Ratio ............................................ 50Summary ............................................................................... 55
Chapter 3. Analysis ................................................................................. 63Overview ............................................................................... 63Combat Elements .................................................................. 65Noncombat Elements ............................................................ 67
viii
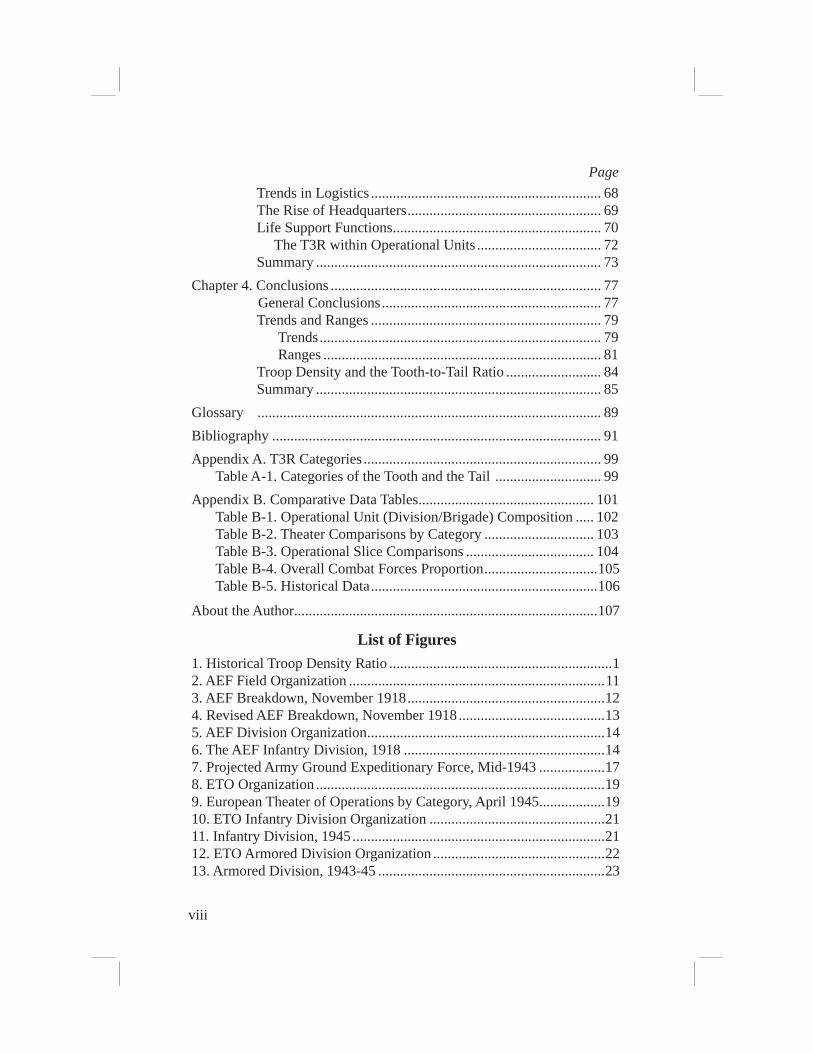
PageTrends in Logistics ............................................................... 68The Rise of Headquarters ..................................................... 69Life Support Functions ......................................................... 70
The T3R within Operational Units .................................. 72Summary .............................................................................. 73
Chapter 4. Conclusions .......................................................................... 77General Conclusions ............................................................ 77Trends and Ranges ............................................................... 79
Trends ............................................................................. 79Ranges ............................................................................ 81
Troop Density and the Tooth-to-Tail Ratio .......................... 84Summary .............................................................................. 85
Glossary .............................................................................................. 89Bibliography .......................................................................................... 91Appendix A. T3R Categories ................................................................. 99
Table A-1. Categories of the Tooth and the Tail ............................. 99Appendix B. Comparative Data Tables ................................................ 101
Table B-1. Operational Unit (Division/Brigade) Composition ..... 102Table B-2. Theater Comparisons by Category .............................. 103Table B-3. Operational Slice Comparisons ................................... 104Table B-4. Overall Combat Forces Proportion ...............................105Table B-5. Historical Data ..............................................................106
About the Author ...................................................................................107
List of Figures1. Historical Troop Density Ratio .............................................................12. AEF Field Organization ......................................................................113. AEF Breakdown, November 1918 ......................................................124. Revised AEF Breakdown, November 1918 ........................................135. AEF Division Organization .................................................................146. The AEF Infantry Division, 1918 .......................................................147. Projected Army Ground Expeditionary Force, Mid-1943 ..................178. ETO Organization ...............................................................................199. European Theater of Operations by Category, April 1945 ..................1910. ETO Infantry Division Organization ................................................2111. Infantry Division, 1945 .....................................................................2112. ETO Armored Division Organization ...............................................2213. Armored Division, 1943-45 ..............................................................23

ix
Page14. Korean War Theater Organization, 1953 ..........................................2515. Korea, July 1953 ...............................................................................2516. Korea, July 1953, including Japan Base ...........................................2617. Korean War Infantry Division Organization .....................................2718. Infantry Division, July 1953 .............................................................2719. Vietnam War Theater Organization 1968 ..........................................2920. Vietnam War Infantry Division Organization ...................................3021. ROAD Light Infantry Division, Vietnam 1968 ................................3122. US Army, Vietnam, April 1968 .........................................................3123. Germany 1974 and 1976 Organization .............................................3324. US Army in Germany, March 1974 ..................................................3425. The Nunn Amendment Tooth-to-Tail Ratio ......................................3526. Armored Division Organization, 1974 ..............................................3627. ROAD Armored Division, 1974 .......................................................3728. Armored Division Organization, 1986 ..............................................4029. AOE Armored Division, 1986 ...........................................................4130. Kuwaiti Theater of Operations (KTO), March 1991 ........................4231. Stryker Brigade Organization, 2004 .................................................4432. Stryker Brigade, 2004 .......................................................................4533. Notional Modular Division Organization, 2004 ...............................4634. Notional Modular Heavy Division, 2004 ..........................................4735. Combined Arms Modular Brigade, 2004 ..........................................4836. Modular Combined Arms Brigade, 2004 ..........................................4837. Iraq, January 2005 .............................................................................5138. Army Forces in Iraq, January 2005 ...................................................5139. Army Forces in Iraq including Contractor Support, January 2005 ...5240. Army Forces in Iraq including Contractor Support, Consolidated
by Category, January 2005 ...........................................................5341. Army Forces in Iraq by Category, including Contractor Support
and Forces in Kuwait, January 2005 ...........................................5442. Operational T3R Trends, 1917-2005 ................................................6343. Functional T3R Overview, 1917-2005 ..............................................6444. Combat Proportion of the Army, 1917-2005 ....................................6545. Combat Trends, 1917-2005 ...............................................................6646. Noncombat Trends, 1917-2005 .........................................................6747. Logistical Trends, 1917-2005 ...........................................................6848. Headquarters Trends, 1917-2005 ......................................................7049. Life Support Trends, 1917-2005 .......................................................7150. Operational Unit Functional T3R, 1918-2005 ..................................7251. Functional T3R Averages, 1945-2007 ..............................................80

x
Page
52. Combat Trends Since 1941 ............................................................... 8153. Functional T3R Trendlines ............................................................... 8254. Maximum and Minimum Functional T3R Levels ............................ 8355. T3R and Troop Density ..................................................................... 84
List of Tables1. AEF Operational Slice ........................................................................ 162. WW II US Army Operational Slice .................................................... 183. Korean War US Army Operational Slice ............................................ 284. Vietnam War US Army Operational Slice .......................................... 325. Cold War 1974 US Army Operational Slice ....................................... 386. DESERT STORM US Army Operational Slice .................................. 437. Modular Army Projected Brigade Operational Slice, 2007 ................ 508. Iraq, January 2005, US Army Operational Slice ................................. 549. Range of Functional T3R Percentages by Category ........................... 7310. Range of Functional T3R Percentages Based on Minimum
and Maximum Combat Percentages ................................................. 83
xi


1
Chapter 1
IntroductionThis work is a companion to a previous volume entitled Boots on the
Ground: Troop Density in Contingency Operations. Boots on the Ground analyzed historical precedent to develop a planning factor or average fi g-ure for the number of troops employed in successful contingency opera-tions. The emphasis in that work was on the total number of troops needed, not the specifi c type of troops within that total. The historical examples represented various counterinsurgency, occupation and peacekeeping op-erations since 1900. It also looked at the organization and size of contem-porary police forces, whose operations generally resemble counterinsur-gency and peacekeeping activities.
Boots on the Ground concluded that a force of 13.26 troops per one thousand of local population was the minimum size needed based on his-torical precedent, with a minimum of 4.1 (roughly one-third of the force) devoted to police (i.e., combat in a counterinsurgency environment) du-ties. The rest of the force (9.16) could also conduct police duties or any other types of tasks that the force needed (Figure 1).
POLICEAND OTHER
DUTIES9.16
POLICETYPE
DUTIES4.1
13.26 PER THOUSAND
Figure 1. Historical Troop Density Ratio.

2
These conclusions were, at best, only a partial solution. They did not really address (aside from the minimum number of police troops) the com-position of such a force, be it the historically based correct size. Theoreti-cally, the composition of such an adequately sized force could consist of an inadequate proportion of elements to complete its assigned missions. To complete the picture, the current work looks at the composition of forces in historical campaigns or deployments, rather than their total numbers. It analyzes the composition of forces from historical US Army expeditionary operations using a quantitative methodology similar to that found in Boots on the Ground. This book looks at several troop categories based on pri-mary function and analyzes the ratio between these categories to develop a general historical ratio.1
This ratio is called the Tooth-to-Tail Ratio (T3R). By defi nition, the T3R refers to the number of troops in a military organization employed in combat duties versus the number functioning in noncombat roles. Through historical analysis, this volume will develop trends concerning the T3R in modern military forces. The book presumes that historical trends provide insight into the typical or most desirable T3R and that conclusions based on historical trends can be drawn.
MethodologyIn certain respects, the methodology in this work differs from that in
Boots on the Ground. While Boots used historical averages of force sizes from contingency operations and police forces, this work analyzes several expeditionary operations and deployments since World War I, rather than just contingency operations. The reason for this shift is the author’s belief that in any operation requiring the employment of an armed force (i.e., combat elements), while its size may differ based on the mission type, the internal T3R of such forces remains similar.
Additionally, while this work will also develop historical averages be-cause of the ranges of its factors, this volume also focuses on historical trends. In most cases, US forces were assembled for specifi c expeditionary operations or deployments. Force planners in the past designed the mix between combat and noncombat elements generally based on prior experi-ence or around the number of combat forces.
The methodology in this work depends on documentary sources, pri-marily those of force orders of battle, offi cial histories and tables of orga-nization. Undoubtedly unnoticed in documentary sources is the common practice found in modern armies called taking “out of hide.” Out of hide is the tasking of individuals and groups from combat units to perform non-

3
combat functions, while still being retained in the organizational structure as combat troops. In such instances, the tooth-to-tail ratio may actually be higher (i.e., the tail being larger) than is apparent from the types and num-bers deployed. Where possible, anecdotal evidence has been examined to determine whether out of hide issues were present in a particular historical deployment.
The following chapter examined the evolution and proportional dis-tribution of the combat and noncombat elements in US Army expedition-ary operations. Specifi c case studies include World War I; the European Theater of World War II; Vietnam; Cold War Germany 1974; the Division 86 organizational change; DESERT STORM 1990; the modular Army or-ganizational structure; and the deployment to Iraq, using January 2005 as the snapshot. Except in the case of purely organizational changes, the examination of each historical example looked at two levels: theater and division. In this work, the T3R was investigated for each level, using or-ders of battle and troop lists as source documents. Specifi c instances in the historical record where the tooth-to-tail ratio became an issue, such as in the 1944 European Theater infantry shortage, were analyzed as well.
Each historical scenario was examined from two angles. The fi rst was the operational approach (operational T3R) and the second was by individ-ual unit or category (functional T3R). In the former, the T3R was looked at Army wide. Army force planners organize the force into basic operational units to fi ght wars or conduct operations. For most of the period covered, this unit was the division. Under the US Army’s modular concept devel-oped early in the 21st century, the brigade replaced the division in this role. In either case, a comparison of the Army’s basic operational units and their proportion of the Army and theater forces provided a general appraisal of what portion of the army is in its basic combat elements. This work looked at the operational unit proportion for each scenario presented.
The operational unit approach, heretofore referred to as the opera-tional T3R, is less exact than the second, unit or category approach. In this approach, which will be referred to as functional T3R, Army units of battalion and above were divided internally, while company-size units were classifi ed as a whole, into specifi c categories based on their primary function. After a unit-by-unit compilation, the proportion of the categories to each other was determined for each scenario to establish the scenario’s functional T3R. The next section of this chapter details the categories.
Following this look at the historical case studies, the scenarios are examined as a whole for historical commonalities and trends. From this analysis were drawn general historical trends and conclusions.

4
Functional Tooth-to-Tail CategoriesUsually T3R refers to the contrast between fi ghters (combat troops)
and support or logistical troops. However, in modern expeditionary war-fare, the variety of troops who serve in units or elements whose direct pri-mary mission is not to fi ght the enemy has grown to include such person-nel as those operating life support functions at bases, reporting events for service publications, and those serving in headquarters elements at levels removed from the likelihood of direct combat action. Therefore, in terms of functional T3R, this work looks at four specifi c categories of troops: combat, headquarters or administrative, logistical, and life support. These categories are summarized in the table in appendix A.
Combat ElementsThe category of combat pertains to elements whose primary mission
is to fi ght the enemy. While this includes the traditional combat arms of infantry, armor, cavalry, fi eld and air defense artillery, it may also include many other elements organized or dragooned into a primary role of fi ghting the enemy. Combat support units, such as combat engineers, assault helicopter units, antitank units and reconnaissance elements in noncavalry combat units are also inherently defi ned as combat elements (in comparison to the noncombat elements discussed below).
In 1974, the US Congress codifi ed what it considered to be the combat component of the Army. This classifi cation included battalion and smaller units of infantry, armor, fi eld artillery, air defense artillery, combat engineers, Special Forces and aviation.2 However, since there are sizable headquarters and logistical contingents even in combat battalions, this work makes a fi ner distinction. For example, an infantry battalion with four rifl e companies has more combat power than one with only three rifl e companies. But such a battalion has the same support and headquarters elements. Accordingly, battalion-level support and headquarters elements are also factored into the analysis. Additionally, there are some elements which may or may not be considered to be combat elements based on the overall situation and their employment. Such units are considered as part of the combat category only if their primary role was the conduct of combat operations. For example, in a counterinsurgency operation where there is not a rear area, military police (MP) units operating as convoy security are conducting combat operations. However, MP units guarding a prison that houses US prisoners awaiting court-martial are not.
Consequently, this work includes as combat components company-size and above, units of infantry, armor, cavalry, fi eld artillery, air defense

5
artillery, attack and assault aviation, and combat engineers. Also included in this category are special operations forces (SOF) units of any size (which possess only small headquarters and logistics elements), and advisors supporting the combat units of foreign armies, as well as military police and other units providing convoy protection (not self-protection, an inherent function of all deployed Army units) in forward areas. While unit headquarters and headquarters companies (HHC) primarily consist of noncombat headquarters elements, combat elements found in such units, for example a scout platoon in an armored battalion HHC, for the sake of this work, are categorized as combat elements.
Noncombat ElementsNoncombat elements are the “tail” in the tooth-to-tail ratio.
Traditionally, the tail has been considered to be the logistical element, such as supply trains and maintenance workshops supporting a force. But in modern expeditionary armies, the noncombat component is more complicated. Supporting troops may be divided into those elements directly supporting a combat organization, here referred to by category as logistical elements, and the support troops who run the base camps and provide other support (such as post newspapers, base infrastructure, theater infrastructure, base construction) that is separate from the conduct of operational missions. In this work, troops and units involved in such activities are called life support elements.
All Army units, whether combat, logistical or life support in function, have headquarters and administrative elements to direct their operations. In 1974, Congress recognized such units, usually found in the form of headquarters companies or detachments, to be noncombat elements, at levels above battalion. Although defi ned down to a lower level than that of Congress, this is the third category of noncombat elements.3
Logistical ElementsThe category of logistical elements consists of military units whose
primary mission is to provide support to combat units and to other logistical units providing support to combat units. Falling into this category are most Army combat service support units: quartermaster, supply, service, maintenance, ordnance, ammunition support, adjutant general, transportation, medical, and small fi nance detachments. Excluded from this category are the headquarters elements of such units whose primary mission is to control such units. Also included in this category are the internal logistical elements in both combat and logistical battalions. Medical hospital units are specially organized to establish and run hospitals.

6
Accordingly, while such units have headquarters elements, these elements are an integral part of the functioning of the hospital and are considered as logistical elements rather than headquarters elements. In this work, aviation units with medical evacuation or heavy-lift missions are also considered to be part of the logistical category. Despite their prominent role in counterinsurgency operations, civil affairs units, because of the way they are organized, equipped and deployed, are considered also to fall within this category.
The type and quantity of equipment found in the combat elements being supported has a direct impact on the size of logistical forces. For example, units outfi tted with armored vehicles need larger contingents of maintenance support and ammunition-carrying vehicles. This study looks at trends in the proportion of logistical forces based on the development of large motorized and mechanized forces.
Life Support ElementsLife support elements are those that provide infrastructure support
that is generally separate from the support provided to combat units. This category includes the establishment of semipermanent camps and bases as well as morale, welfare and recreation (MWR) facilities. Life support elements, designated as a separate noncombat category, is a particular characteristic of the US Army. In their large expeditionary operations in Europe in World War II, in Vietnam in the 1960s and Iraq in the present day, US forces established huge infrastructure organizations in the respective theaters. Where troop deployments were executed as part of a rotational scheme, this infrastructure remained in place as the troops rotated and were replaced.4
In most cases, life support functions are not operationally essential to the completion of the missions of the combat units. Types of units falling into this category include: base command and support units, signal infrastructure units, engineer units with primary missions of infrastructure construction and support, fi nance offi ces, judge advocate general offi ces, labor service support units, base public information units, and contracting units. Medical units running facilities such as base dispensaries, which function separately from the operational medical support system, are also included in this category.
Units and elements devoted primarily to life support functions are sometimes, particularly in earlier periods, diffi cult to discern from logistical elements in documentary records and troop lists. In the historical survey in the following chapter where this occurs, the categories of logistical and life support are merged into a single category called logistical.
7
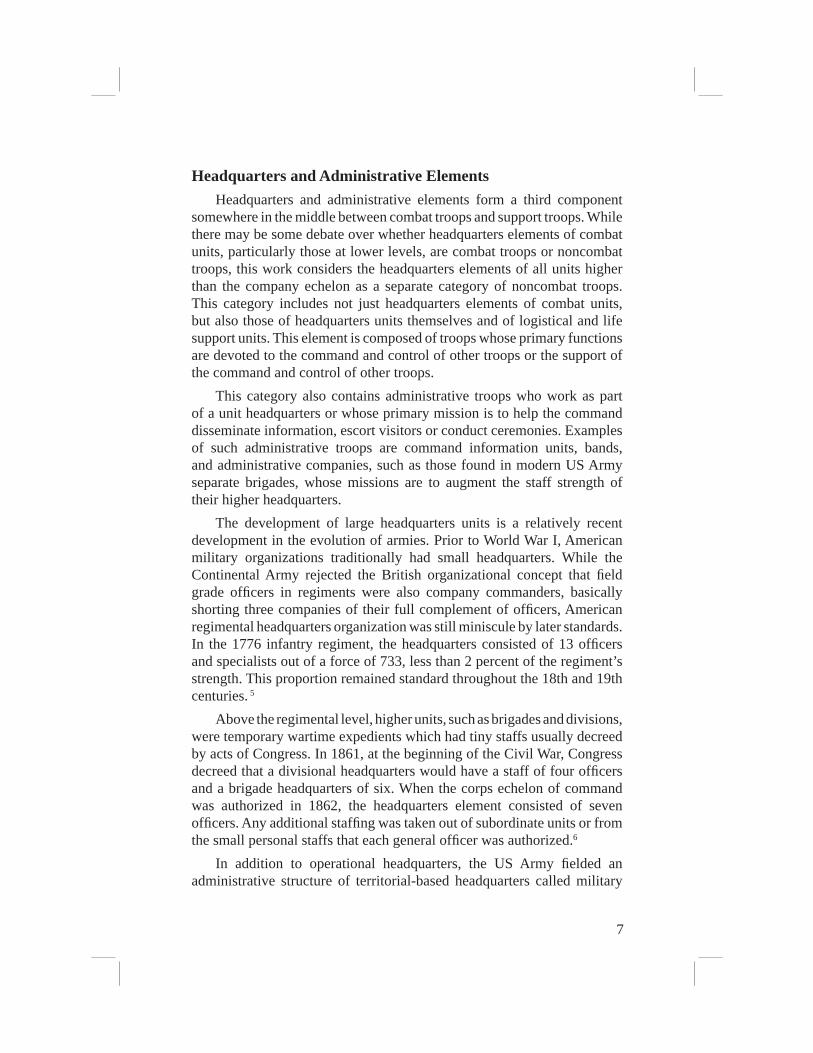
Headquarters and Administrative ElementsHeadquarters and administrative elements form a third component
somewhere in the middle between combat troops and support troops. While there may be some debate over whether headquarters elements of combat units, particularly those at lower levels, are combat troops or noncombat troops, this work considers the headquarters elements of all units higher than the company echelon as a separate category of noncombat troops. This category includes not just headquarters elements of combat units, but also those of headquarters units themselves and of logistical and life support units. This element is composed of troops whose primary functions are devoted to the command and control of other troops or the support of the command and control of other troops.
This category also contains administrative troops who work as part of a unit headquarters or whose primary mission is to help the command disseminate information, escort visitors or conduct ceremonies. Examples of such administrative troops are command information units, bands, and administrative companies, such as those found in modern US Army separate brigades, whose missions are to augment the staff strength of their higher headquarters.
The development of large headquarters units is a relatively recent development in the evolution of armies. Prior to World War I, American military organizations traditionally had small headquarters. While the Continental Army rejected the British organizational concept that fi eld grade offi cers in regiments were also company commanders, basically shorting three companies of their full complement of offi cers, American regimental headquarters organization was still miniscule by later standards. In the 1776 infantry regiment, the headquarters consisted of 13 offi cers and specialists out of a force of 733, less than 2 percent of the regiment’s strength. This proportion remained standard throughout the 18th and 19th centuries. 5
Above the regimental level, higher units, such as brigades and divisions, were temporary wartime expedients which had tiny staffs usually decreed by acts of Congress. In 1861, at the beginning of the Civil War, Congress decreed that a divisional headquarters would have a staff of four offi cers and a brigade headquarters of six. When the corps echelon of command was authorized in 1862, the headquarters element consisted of seven offi cers. Any additional staffi ng was taken out of subordinate units or from the small personal staffs that each general offi cer was authorized.6
In addition to operational headquarters, the US Army fi elded an administrative structure of territorial-based headquarters called military

8
divisions (usually commanded by a major general) and departments (subordinate to military divisions and usually commanded by a brigadier general). During wartime, department commanders usually also commanded the operational forces within their department and led them in the fi eld. In peacetime, where there was no operational level of command above the regiment, military division and departmental commanders were responsible for the operational employment and activities of all Army units stationed within the geographical limits of their commands. Division and departmental commanders were taken from the small corps of general offi cers. If there was no available general offi cer, a senior colonel was detailed from his regiment to fi ll the post.
From World War I to the present, with the US Army involved in extensive expeditionary operations across the globe, its headquarters elements have evolved and grown. An evolution of communications technology has paralleled this growth, leading ultimately to the present digital age and modular (at the brigade level) organization of the Army. With enhanced communications, however, there has not been a concurrent decrease in the size of headquarters, but the complete opposite. This development is discussed later in this work.
This chapter established terms and methodology to be used in looking at the operational and functional T3R. The next chapter applies this methodology to a sampling of major US Army expeditionary operations and deployments since 1917.
9
Notes
1. Boots on the Ground looked at contingency operations. Assuming that tooth-to-tail ratios are applicable to all expeditionary operations, the analysis in this work will not be restricted to just contingency operations.
2. John B. Wilson, Maneuver and Firepower: The Evolution of Divisions and Separate Brigades, Army Lineage Series (Washington, DC: US Army Center of Military History, 1998), 366, 376 note 31.
3. Ibid.4. As the Operation IRAQI FREEDOM deployment extended into a second
and third troop rotation, many casual observers (without historical backgrounds) commented on the American building of permanent bases in Iraq. For examples, see Erik Leaver, “Building Permanent US Bases in Iraq Sends Wrong Signal,” Seattle Post-Intelligencer, 15 May 2005 [article on-line] available at http://seattlepi.nwsource.com/opinion/224055_iraqbases.html; Internet; accessed on 21 March 2007; Doug Giebel, “Permanent Bases, Leave Iraq? Hell No, We Won’t Go!” Counterpunch, 6 January 2004 [article on-line] available at http://www.counterpunch.org/giebel01062004.html; Internet; accessed on 21 March 2007. These observers failed to realize that since World War II, the Americans have established such elaborate infrastructure wherever US forces were deployed for an extended period of time and that while the facilities often looked like a permanent US presence, this was not the intent. By 2007, most of the permanent US facilities had been handed over to the Iraqis.
5. Robert Wright, The Continental Army (Washington, DC: US Army Center of Military History, 1983), 47.
6. Revised United States Army Regulations of 1861 (Washington, DC: Government Printing Offi ce, 1863), 506, 539; Robert M. Epstein, “The Creation and Evolution of the Army Corps in the American Civil War,” The Journal of Military History 55 (January 1999), 34.


11
Chapter 2
Historical Experience
World War I
Theater LevelWhen the United States entered World War I, its Army had had only
limited experience with expeditionary warfare and no experience in the type of warfare being fought in France. Accordingly, the types of support units needed in France were created from scratch. American planners made force development estimates based on the general principles found in the Army’s fi eld service regulations and from looking at the example of the composition of the French and British forces (Figure 2). The early T3R projection was that support elements would be 20 percent (or a ratio of 4:1 combat versus support) of the expeditionary force. But, as the organization developed, this percentage estimate was increased in September 1917 to 33 percent (or a ratio of 2:1 combat versus support).1
A look at the AEF as fi elded in November 1918 (Figure 3) shows that the logistical structure ended up being close to the September 1917 estimate, with 32 percent of the force devoted to what was then called “line of communications” operations. The US troops who deployed to
Figure 2. AEF Field Organization.
HEADQUARTERS
CATEGORY- PRIMARY MISSION
COMBAT LOGISTICAL
XXXXXAEF
XXXX
X X X
X X
x2
x7
x30
X XDEPOT x6
X Xx7
SKELETONIZED
x7+ +SOS
X
fromDepot Division
Artillery Brigades
CORPSARTY
+ +SOS
SOS = Services of Supply
additionalnon-divisionalcombat units
HEADQUARTERS
CATEGORY- PRIMARY MISSION
COMBAT LOGISTICAL
XXXXXAEF
XXXXXAEF
XXXXXXXX
X X XX X X
X X
x2
x7
x30
X XDEPOT x6X X
DEPOT x6
X Xx7
SKELETONIZED
X Xx7
SKELETONIZED
x7+ +SOS+ +SOS
X
fromDepot Division
Artillery Brigades
CORPSARTY
+ +SOS+ +SOS
SOS = Services of Supply
additionalnon-divisionalcombat units

12
France in 1917 and 1918 fl owed into a mature, fully developed theater. It is therefore diffi cult to separate life support activities from logistical ones. Accordingly, the two are joined in the analysis of the proportional ratio in the American Expeditionary Force (AEF).2
Headquarters at all levels of the AEF were austere. For example, in an organization of 1,866,184, only 31,813, or 1.7 percent, were found in headquarters units. Together with troops supporting headquarters operations, the headquarters category comprised only 3 percent of the force. The AEF itself maintained a headquarters of 4,271, less than 1 percent of the total AEF. Divisions with a size of 28,105 in November 1918, only had a headquarters element of 304 (1.1 percent). Infantry brigade headquarters controlled an organization with a strength of 8,072 with only 25 personnel (less than 1 percent). Infantry regimental headquarters were staffed with 349 personnel for a command of 3,770 (9 percent), of which 209 (or 5 percent) were staff personnel, while infantry battalion headquarters had a staff of 3 to lead a unit of 1,027 (less than 1 percent).4
At the theater level, the functional T3R was 1.8 to 1 in favor of combat elements. Combat units (i.e., divisions) were 65 percent of the AEF force breakdown in November 1918. These units also had their own logistical and headquarters elements. Figure 4 shows the theater level adjusted for the noncombat elements found in the divisions. Combat elements still
Figure 3. AEF Breakdown, November 1918.3
Logistics &Life Support
32%
77%
9%14%
Combat
HQ/AdminLogistics
3%
HQ/Admin
Combat Units65%

13
made up more than half (53 percent) of the AEF’s force structure, with a function`al T3R of 1.1 to 1. Logistical elements formed slightly over a third of the revised structure (39 percent), while headquarters elements formed less than 1 in 10 (8 percent) of the deployed soldiers.6
The AEF DivisionThe AEF division (Figure 5) had an even higher functional T3R than
the AEF as a whole. As shown in Figure 6, 78 percent of divisional assets were devoted to combat operations (a ratio of 3.5 to 1 in favor of combat troops). Divisional headquarters elements roughly matched the proportion found at the theater level (9 percent versus 8 percent), but logistical elements within the division were a lot more austere (14 percent) to similar elements at the theater level (39 percent).7
Despite this high proportion of combat troops in the division, there was soon a shortage of infantry troops, forcing the AEF command to turn some deployed divisions into depot organizations to process replacements and to skeletonize others. Of the 42 divisions operational in France in 1917 and 1918, only 30 actually fought in the front lines, with 6 being converted to depot divisions and an additional 5 broken up to provide replacements for the 30 fi ghting divisions. Even the logistical forces eventually suffered from shortages. In November 1918, the AEF broke up a newly arrived
Figure 4. Revised AEF Breakdown, November 1918.5
8%
39%
Combat
Logistics
HQ/Admin
Combat
Logistics
HQ/Admin53%

14
HEADQUARTERS
CATEGORY- PRIMARY MISSION
COMBAT LOGISTICALX X
Xx2
IIIx4
I Ix12
I Ix3
X I Ix7
IIIx3
I I
I I I
XTRAINS
HEADQUARTERS
CATEGORY- PRIMARY MISSION
COMBAT LOGISTICALX XX XX X
Xx2
XXXx2
IIIx4
IIIIIIIIIx4
I II Ix12
I II Ix3
XX I Ix7
IIIx3
IIIIIIx3
I II I
I I II I I
XTRAINS
Figure 5. AEF Division Organization.
Figure 6. The AEF Infantry Division, 1918.8
Combat
Logistics
HQ/Admin
Combat
Logistics
HQ/Admin78.4%
7.2%
14.4%

15
combat division, using its personnel as reinforcements for the Services of Supply logistical command.9
Even though the AEF division was austere in terms of headquarters elements, it provides a good example of how command and control headquarters can be interjected into force structure when it is unneeded operationally. When the AEF was organized, planners wanted to place a machine gun company within every infantry battalion. However, Congress, in the National Defense Act of 1916, had restricted the infantry regiment to a specifi c size. If the Army had assigned three machine gun companies to an infantry regiment, the regiment would then lose two of its rifl e companies. To bypass this restriction, force developers arrayed machine gun companies at three echelons: regiment, brigade and division. The infantry regiment received the one machine gun company it could keep within the restrictions. The brigade had a three-company battalion. Accordingly, between the regiment and brigade, there were available machine gun companies for fi ve of the six infantry battalions in the brigade. To provide for this remaining battalion, the division had a four-company machine gun battalion, which provided two of its companies to fi ll out the machine gun company requirements for the two brigades in the division. In 1918, these two companies were assigned directly to the brigade machine gun battalion, raising it to four companies. Although the machine gun companies were almost always used in direct support of infantry battalions, making the machine gun battalion headquarters unnecessary, the AEF still maintained the headquarters.10
As mentioned in the introduction, one method to look at T3R trends, fi rst used in World War II, but which can be retroactively applied to World War I, is to determine what percentage of the Army formed the portion of it organized specifi cally to execute combat operations. In this work, this is the operational T3R. The Army employed specifi c units, divisions or brigades, as its basic fi ghting elements. These are called the operational units. The proportion of the Army organized in such units provides an indicator of what percentage of Army forces are in the fi ghting echelon. In this work, this portion is called the operational slice. Its size is determined by dividing the total strength of the Army by the number of operational units in the Army’s force structure. This number is then compared to the operational unit’s authorized strength. The result is the proportion of the Army contained in the operational units. While the nondivisional elements can include headquarters and logistical elements, as well as nondivisional combat elements, they provide a useful guideline in determining trends in the relative number of troops in the force in comparison to those actually

16
in the operational combat units (divisions). Table 1 shows that divisions formed 50 percent of the whole Army and 45 percent of the AEF.
While the World War I US division is considered to be gigantic in size, in terms of the functional tooth-to-tail ratio it was austere in noncombat elements. Deployment to a developed theater with excellent infrastructure already in place assisted the AEF in retaining an austerity of noncombat elements. The next time the United States deployed a comparable expeditionary force, it was not so lucky.
World War IIWorld War II was the United States’ ultimate experience with
expeditionary warfare. The war the Army fought was completely overseas and US forces were the main component in all theaters except China-India-Burma and Russia. The largest theater in terms of troops deployed was the European Theater of Operations (ETO). Troops in the ETO fought the war across France and into the heart of Germany in 1944-45. This section uses the example of the ETO to explore the expeditionary aspects of the T3R in World War II.
Overall Planning EstimatesAs in World War I, the basic operational element in the US Army in
World War II was the combat division. During the war, Army leadership
g.Non-
DivisionalPercentageof the AEF
(f/d)
f.Non-
DivisionalSlice(d - c)
e.OperationalPercentage
(c/d)
d.Operational
Slice(a/b)
c.AEF
DivisionSize
b.AEF
Divisions
a.AEF
Strength
5534,1004562,20528,105301,866,164
5027,6105055,71528,105432,395,742
g.Non-
DivisionalPercentageof the Army
(f/d)
f.Non-
DivisionalSlice(d - c)
e.OperationalPercentage
(c/d)
d.Operational
Slice(a/b)
c.AEF
DivisionSize
b.Total
Divisions11
a.Army
Strength
g.Non-
DivisionalPercentageof the AEF
(f/d)
f.Non-
DivisionalSlice(d - c)
e.OperationalPercentage
(c/d)
d.Operational
Slice(a/b)
c.AEF
DivisionSize
b.AEF
Divisions
a.AEF
Strength
5534,1004562,20528,105301,866,164
5027,6105055,71528,105432,395,742
g.Non-
DivisionalPercentageof the Army
(f/d)
f.Non-
DivisionalSlice(d - c)
e.OperationalPercentage
(c/d)
d.Operational
Slice(a/b)
c.AEF
DivisionSize
b.Total
Divisions11
a.Army
Strength
Total Army
AEF
Table 1. AEF Operational Slice

17
made a deliberate decision to limit the number of divisions created in order to maintain a large industrial base in the civilian sector and large numbers of air force and logistical troops in the military sector. Accordingly, the Army raised only 89 divisions to fi ght in the war. Of these 89 divisions, 83 (16 armored divisions and 67 infantry divisions) possessed extensive organic logistical assets of their own as the bulk of the Army was motorized. When heavy casualties affected the combat elements of the divisions, a personnel crisis ensued in late 1944 that required the conversion of thousands of supporting troops to combat jobs.12
As part of the process of creating and fi elding the 89 divisions, the Army Ground Forces (AGF), under Lieutenant General Lesley J. McNair, was the War Department agency responsible for developing the ground force including the correct mix between combat elements and supporting units. As such, the AGF became the agency most responsible for setting the tooth-to-tail ratio for the World War II Army. In planning, there was a great tendency for the tail to expand. McNair often fought his staff’s recommendations on this point. In mid-1943, when the AGF was activating the last of the 89 divisions, McNair felt the projected expeditionary force structure (Figure 7) was askew. Only 29 percent of the force designated to fi ght the enemy was found in divisions. While McNair did not use the
Figure 7. Projected Army Ground Expeditionary Force, Mid-1943.13
0
10
20
30
40
50
60
70
TotalCombat
TheaterOverhead
ServiceSupport
29% 33%COMBAT
UNITS(DIVISIONS)
NON-DIVISIONAL
COMBAT TOTALCOMBAT
65%
2%
PER
CEN
T
36%
0
10
20
30
40
50
60
70
TotalCombat
TheaterOverhead
ServiceSupport
29% 33%COMBAT
UNITS(DIVISIONS)
NON-DIVISIONAL
COMBAT TOTALCOMBAT
65%
2%
PER
CEN
T
36%

18
same categories found in this work and he deliberately sought economy in tables of organization and equipment, giving divisions minimal organic elements, he did recognize that the proportion of the organization found in divisions was a direct indicator of the amount of combat power represented in the Army.14
McNair’s concerns were well founded. The projected 65-percent level of combat elements (before subtracting organic headquarters and logistics elements) was, in fact, never met when the Army’s ground forces actually deployed. By the end of the war, the ground forces operational slice had risen to 67,900, with only 20 percent of ground troops found in divisions (Table 2).
The European Theater of Operations (ETO)The place to where most of the divisions (72 percent), which the AGR
raised, were deployed was in the European Theater of Operations (ETO) (Figure 8). Into this largest of all theaters, 64 divisions deployed and defeated Germany in an 11-month campaign. Theater-wide, the functional T3R at the end of the campaign is depicted by category in Figure 9. Within the theater, the ratio between combat and noncombat elements was 1 to 1.6.
Compared with the AEF in the same general theater, ETO forces contained 14 percent fewer combat elements. This was double the percentage of headquarters elements (16 versus 8) and an increase of 6 percent among logistical/life support elements. That there were larger logistical elements than in World War I can be expected considering that the ETO deployed by assault into a theater with minimal infrastructure in place, while the AEF deployed into a mature theater secured by Allies. But why did the number of headquarters double proportionally?
8054,1002067,90013,800896,042,277
g.Non-
DivisionalPercentageof the Army
(f/d)
f.Non-
DivisionalSlice(d - c)
e.Division
Percentageof the Army
(c/d)
d.Operational
Slice(a/b)
c.Standardized
DivisionSize
b.Number ofDivisions
a.Total
Strength
8054,1002067,90013,800896,042,277
g.Non-
DivisionalPercentageof the Army
(f/d)
f.Non-
DivisionalSlice(d - c)
e.Division
Percentageof the Army
(c/d)
d.Operational
Slice(a/b)
c.Standardized
DivisionSize
b.Number ofDivisions
a.Total
Strength
Table 2. WW II US Army Operational Slice15

19
Figure 8. ETO Organization.
Figure 9. European Theater of Operations by Category, April 1945.16
16%
45% 39% Life Support
HQ/Admin
Combat
Logistics/Life Support
HQ/Admin
Combat
Logistics/
HEADQUARTERSCATEGORY- PRIMARY MISSION
COMBAT LOGISTICALXXXXXX
SHAEF/ETO
XXXXx5
X X Xx15
X Xx45
+ +COMZ
+ +COMZ
SHAEF = Supreme Command Allied Expeditionary ForceCOMZ = Communications ZoneTD = Tank DestroyerTC = Transportation Corps
TD 13FA 82AAA 48ENG 91
XXXXXx2
X Xx15
X Xx4
I I Ix234*
ENG 62ENG RGTS 53TC 22
I Ix641
* INCLUDES BRIGADE HEADQUARTERS
I Ix137
TD 50FA 257AAA 165ENG 169
HEADQUARTERSCATEGORY- PRIMARY MISSION
COMBAT LOGISTICALXXXXXX
SHAEF/ETOSHAEF/ETOSHAEF/ETO
XXXXx5
XXXXXXXXx5
X X Xx15
X X XX X Xx15
X Xx45
X XX Xx45
+ +COMZ+ +
COMZ
+ +COMZ+ +
COMZ
SHAEF = Supreme Command Allied Expeditionary ForceCOMZ = Communications ZoneTD = Tank DestroyerTC = Transportation Corps
TD 13FA 82AAA 48ENG 91
XXXXXx2
XXXXXXXXXXx2
X Xx15
X Xx15
X Xx4
X Xx4
X XX Xx4
I I Ix234*
I I II I Ix234*
ENG 62ENG RGTS 53TC 22
I Ix641
* INCLUDES BRIGADE HEADQUARTERS
I Ix137
I Ix137
TD 50FA 257AAA 165ENG 169

20
While a factor in the doubling of headquarters size was surely an increase in higher headquarters organizations brought about by the number of forces employed and by the inclusion of headquarters elements in the larger logistics element, the Army’s basic philosophy of organization may have also had something to do with the growth. As mentioned above, AGF head McNair believed in economizing tables of organization and equipment (TOEs). He also felt that divisions should be organized with only the minimum elements necessary for most operations and that additional elements would be attached to divisions only as necessary. While in practice, this system, called streamlining and pooling, usually resulted in the semipermanent assignment of many of the pooled elements to divisions. It also meant that the pooled elements required administrative headquarters to command and control them while in pooled status. Accordingly, in the ETO, there were 234 such headquarters controlling pooled units. To facilitate pooling, on 24 December 1942, the Army adopted a new organizational system where it reorganized so that regiments were replaced by separate battalions in all arms and services except the infantry. Whereas battalions under regiments had had small headquarters and usually no organic logistical elements, the separate battalions, because of their possible independent employment, had sizable contingents of both. In the ETO, there were 725 such battalions. Together, pooled headquarters and separate battalion headquarters elements consisted of 145,359 troops, forming 42 percent of the headquarters element slice of the ETO pie.17
At the theater level, logistical/life support elements were 45 percent of the total troops employed. The level of these elements seems to have been devised based on a combination of the number of troops to be supported (usually addressed in terms of specifi c unit types [army, corps, division] to be supported) and guesswork. For example, predeployment guidance called for ordnance (ammunition and maintenance) units to compose 6 percent of the total number of troops in a theater of operations. In the ETO, this goal was exceeded, with ordnance troops reaching 7.1 percent of the total deployed troop force. Several postwar studies considered that ETO support levels were adequate based simply on the overall success of the campaign. Nevertheless, they recommended modest increases in the size of logistical elements (Figure 10).
For instance, one study recommended a 12.5 percent increase in the number of service troops assigned to an army group. Despite this, studies of the ETO generally warned that no defi nitive conclusions concerning the T3R could be drawn from the ETO because of its unique nature.18
21
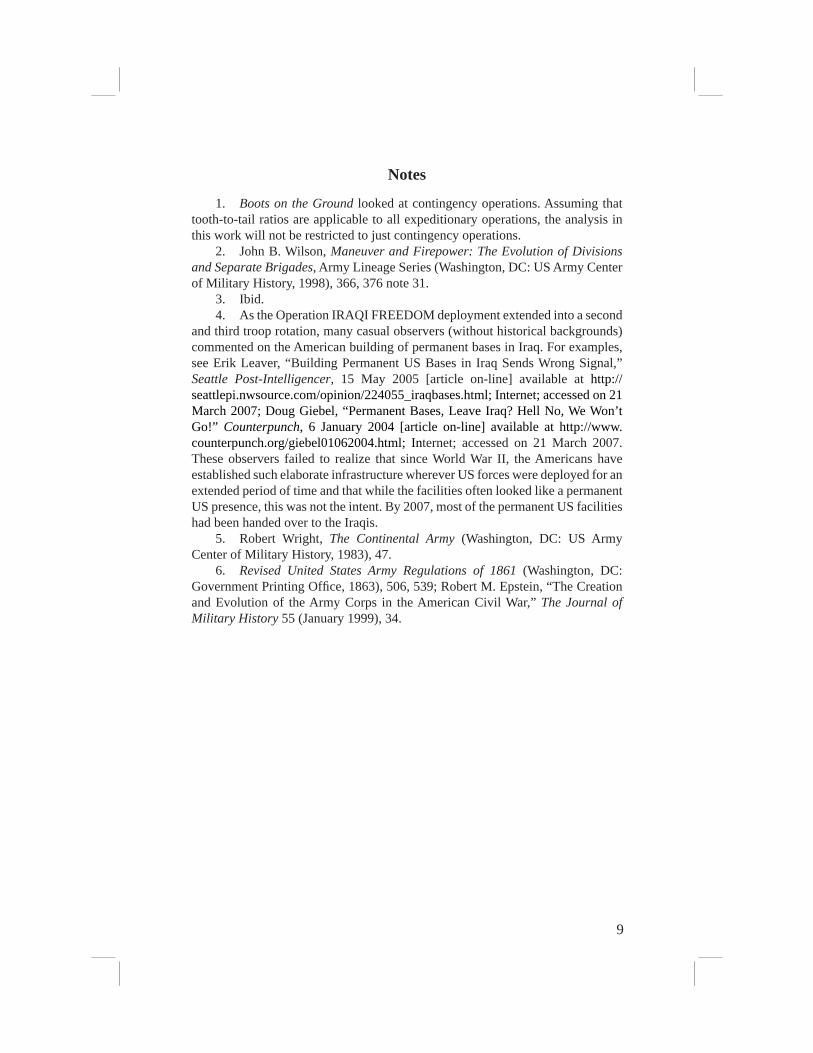
Divisions in the ETODeployed in the ETO were a total of 62 divisions: 45 infantry, 15
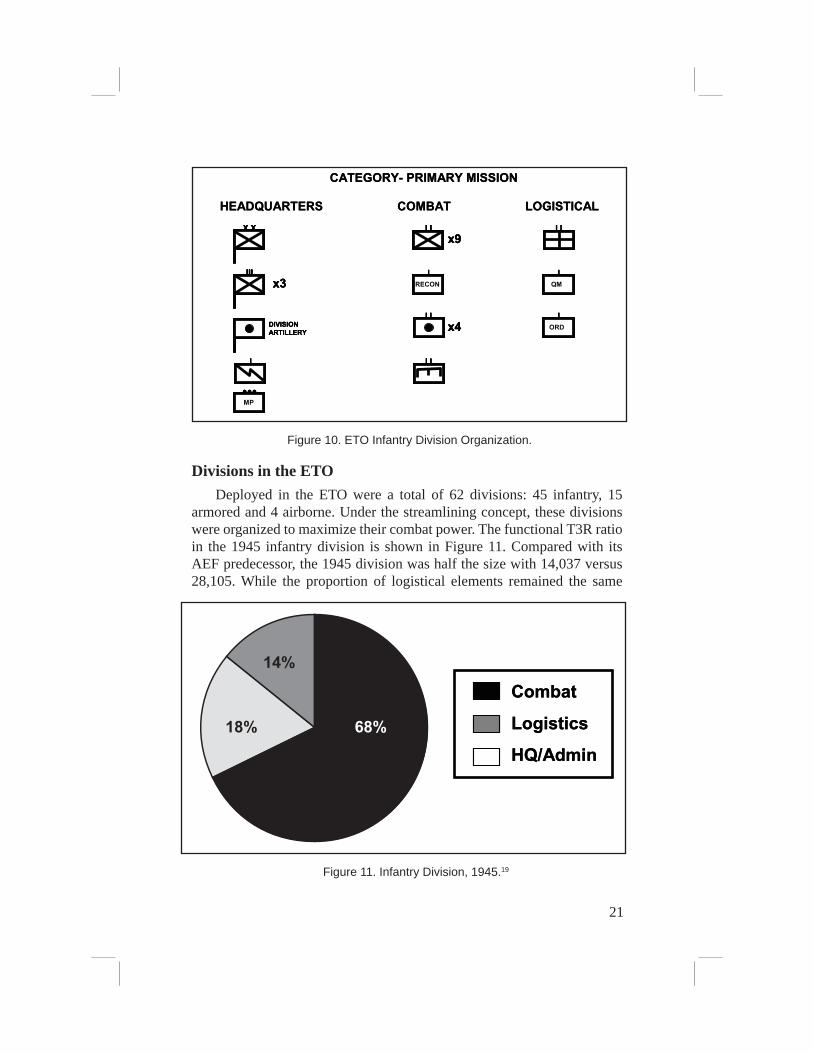
armored and 4 airborne. Under the streamlining concept, these divisions were organized to maximize their combat power. The functional T3R ratio in the 1945 infantry division is shown in Figure 11. Compared with its AEF predecessor, the 1945 division was half the size with 14,037 versus 28,105. While the proportion of logistical elements remained the same
HEADQUARTERS
CATEGORY- PRIMARY MISSION
COMBAT LOGISTICALX X
IIIx3
I Ix9
I Ix4
I I I
DIVISIONARTILLERY
IRECON
IORD
IQM
●●●MP
I I
HEADQUARTERS
CATEGORY- PRIMARY MISSION
COMBAT LOGISTICALX XX XX X
IIIx3
IIIIIIIIIx3
I Ix9
I II Ix9
I Ix4
I Ix4
II I II I
DIVISIONARTILLERYDIVISIONARTILLERY
IRECON
IRECON
IORD
IORD
IQM
IQM
●●●MP●●●MP
I II I
Figure 10. ETO Infantry Division Organization.
Figure 11. Infantry Division, 1945.19
14%
68%
Combat
Logistics
HQ/Admin
Combat
Logistics
HQ/Admin18%

22
in both divisions (14 percent), the combat element in the 1945 division was 9 percent smaller, with the difference being found in an increased headquarters element. Although the World War II division had eliminated an echelon of command (the brigade), its headquarters staffs had increased. A general expansion in the size of headquarters elements can account for part of this increase. The reorganization of the division’s artillery, where separate battalions and a divisional artillery headquarters had replaced an artillery regiment with organic battalions, also played a role. Despite the expansion of command and control elements, the World War II infantry division was still primarily a combat organization, with one and a half combat soldiers for every support soldier (Figure 12).
The armored division was a new type of unit in the US Army when fi elded in World War II. The ETO divisions came in two organizational varieties: the older heavy division, which retained dual regimental and combat command headquarters and a large number of combat battalions and the new light division that was smaller. Of the 15 divisions in the ETO, 13 were of the light variety, so it is that organization which is discussed here. Figure 13 shows the proportional organization for the armored division (light TOE).
HEADQUARTERS
CATEGORY- PRIMARY MISSION
COMBAT LOGISTICAL
x3
x3
I
DIVISIONARTILLERY
I IORD
I IQM
●●●MP
I IX X I I
I Ix3
I IX COMBATCOMMAND x3
I I
I IXTRAINS
HEADQUARTERS
CATEGORY- PRIMARY MISSION
COMBAT LOGISTICAL
x3
x3
II
DIVISIONARTILLERYDIVISIONARTILLERY
I IORD
I IORD
I IQMI I
QM
●●●MP●●●MP
I II IX XX X I II I
I Ix3
I Ix3
I II IXX COMBATCOMMAND x3
I II I
I II IXTRAINS
XTRAINS
Figure 12. ETO Armored Division Organization.

23
As would be expected in an organization with almost all of its combat elements mounted on tracked vehicles and almost all of its other elements mounted on wheeled vehicles, the logistical element in the armored division was larger than that in the infantry division. The armored division support element was one-third larger than that of an infantry division (21 percent to 14 percent). With the expanded mobility of the division, often resulting in the organization being spread out across large areas and with its combat elements (tank and armored infantry) being organized into separate battalions, support elements were more compartmentalized and expanded than in the infantry division.
Similar to events in 1918, once combat operations in the ETO commenced, a personnel crisis soon ensued. In both cases, the problem was that forward combat elements, particularly the infantry, took losses at a higher rate than their proportion in the force, while there was no large pool of trained replacements. Almost from the start in July 1944, ETO infantry casualties were higher than projected. To keep up with losses, such a pool needed to be larger than the combined strength of the infantry in the operational units. In World War I, the AEF broke up uncommitted divisions to provide replacements. In World War II, however, the 89-division plan made this unfeasible as all the divisions were needed operationally and were supposed to be kept at full strength through a constant fl ow of individual replacements.21
Figure 13. Armored Division 1943-45.20
21%
58%
Combat
Logistics
HQ/Admin
Combat
Logistics
HQ/Admin21%

24
The Army resolved the July crisis by depleting most of the pool of available infantry replacements. However, this left inadequate replacements if the current rate of losses continued. Therefore, as a start, excessive replacements in combat branches were retrained as infantry and the allocation of replacements in training was adjusted. These measures did not resolve the problem, but it was partially ameliorated because infantry casualties fell from August through October 1944 below the July rate. But casualties rose again in November and the Battle of the Bulge in December turned the replacement shortfall into a crisis. The Army initiated programs to alleviate the shortage including the transfer of participants of several specialist programs to infantry replacement training and also transferring the reassignment of several divisions originally earmarked for the Pacifi c to Europe. But the ETO was forced to take more immediate measures, primarily through fi nding new infantrymen from theater assets. Most were being taken from logistical and headquarters elements, via calls for volunteers. In January 1944, the ETO headquarters centralized the effort to fi nd new infantrymen from within theater assets. At the same time, Lieutenant General John Lee, the commander of the Communications Zone (COMZ), the ETO’s theater logistical headquarters, gave each of his subordinate units quotas to produce infantry candidates. In mid-January, the ETO declared all enlisted men assigned to noncombat units, within certain conditions, to be eligible for transfer to the infantry. These measures from inside and outside the ETO, along with a shift in operations from the high intensity battles as in the Ardennes, ended the crisis. The ETO and War Department had underestimated the attrition rate in the tooth and had to draw from apparently redundant assets in the tail to make up the difference.22
Korean War Beginning only 5 years after the end of World War II, the Korean War
was fought with many of the same organizational structures and equipment as the earlier confl ict. Accordingly, the functional T3R in Korea should resemble that of the ETO in World War II. The troops assembled in the Korean peninsula reached their height in July 1953, at the time of the signing of the armistice ending the confl ict (Figure 14).
Figure 15 shows the functional tooth-to-tail ratio for the US Army units deployed to South Korea at that time. In comparison to 1945, the combat portion of the force had gone up 3 percent, while headquarters elements had proliferated an additional 5 percent. To make up for the increase in combat elements, logistics/life support actually declined from World War II by 8 percent. The expansion of headquarters elements is

25
Figure 15. Korea, July 1953.23
32% 42%
21%
Combat
Logistics
HQ/Admin
Life Support
Combat
Logistics
HQ/Admin
Life Support
5%
Figure 14. Korean War Theater Organization, 1953.
HEADQUARTERSCATEGORY- PRIMARY MISSION
COMBAT LOGISTICAL
XXXX
X X Xx3
X Xx7
+ +KCOMZ
+ +KCOMZ
Cited battalions are battalion equivalentsAAA = Antiaircraft Artillery MED = MedicalAG = Adjutant Genera MI = Military IntelligenceAV = Aviation MP = Military PoliceCHEM = Chemical ORD = OrdnanceENG = Engineer QM = QuartermasterFA = Field Artillery SC = Signal CorpsFEC = Far East Command STA = Station Complement unitKCOMZ = Korea Communications Zone DET = DetachmentTC = Transportation Corps TK = Tank
AAA 4 TC 2FA 4 QM 3MP 1 ORD 3ENG 8 SC 6
I I Ix1
I I Ix32*
ENG 11MP 15AV 1SC 4QM 17MED 20HOSPITALS 12CHEM 3
I Ix48
* INCLUDES BRIGADE HEADQUARTERS
I Ix83
CHEM 2 INF 1TK 1 FA 23AAA 10 ENG 11
XXXXX
FEC
+ +JapanBase
+ +JapanBase
LIFE SUPPORT
I Ix29 MI 5 ENG 8
FA 1 TC 2MP 1 QM 11SC 1
DETx49
STA x6
SC 1FIN 7ENG 8MED 23AG 10
I I Ix1
I I
EIGHTH
HEADQUARTERSCATEGORY- PRIMARY MISSION
COMBAT LOGISTICAL
XXXXXXXXXXXX
X X Xx3
X X XX X Xx3
X Xx7
X XX Xx7
+ +KCOMZ
+ +KCOMZ
+ +KCOMZ
Cited battalions are battalion equivalentsAAA = Antiaircraft Artillery MED = MedicalAG = Adjutant Genera MI = Military IntelligenceAV = Aviation MP = Military PoliceCHEM = Chemical ORD = OrdnanceENG = Engineer QM = QuartermasterFA = Field Artillery SC = Signal CorpsFEC = Far East Command STA = Station Complement unitKCOMZ = Korea Communications Zone DET = DetachmentTC = Transportation Corps TK = Tank
AAA 4 TC 2FA 4 QM 3MP 1 ORD 3ENG 8 SC 6
I I Ix1
I I Ix1
I I II I Ix1
I I Ix32*
I I II I Ix32*
ENG 11MP 15AV 1SC 4QM 17MED 20HOSPITALS 12CHEM 3
I Ix48
I Ix48
* INCLUDES BRIGADE HEADQUARTERS
I Ix83
I Ix83
CHEM 2 INF 1TK 1 FA 23AAA 10 ENG 11
XXXXX
FECXXXXX
FEC
+ +JapanBase
+ +JapanBase
+ +JapanBase
+ +JapanBase
LIFE SUPPORT
I Ix29
I II Ix29 MI 5 ENG 8
FA 1 TC 2MP 1 QM 11SC 1
DETx49
DETx49
STA x6STA x6
SC 1FIN 7ENG 8MED 23AG 10
I I Ix1
I I II I Ix1
I II II I
EIGHTH

26
evident in the order of battle by the presence of an army headquarters, three corps and seven division headquarters, and a communications zone headquarters controlling several major logistical headquarters elements. But the decline of logistic elements appears curious considering trends since World War I and the expeditionary nature of the Korean operation.
The context of the war helps to explain the situation. While 276,581 soldiers, including 89,361 logistical troops were in fact deployed to South Korea, the Army maintained a large logistical base in nearby Japan and many of the theater support elements were located there instead of in Korea itself. Figure 16 shows the functional T3R with the inclusion of the 78,079 logistical troops (and their headquarters elements) in Japan. With the addition of the Japanese base, the Korean War functional T3R more closely resembles the World War II ETO fi gures in terms of logistics: 43 percent to 45 percent in the ETO. Headquarters elements had still expanded by 8 percent from ETO totals, mostly at the expense of the combat elements, which declined by 6 percent. While in the ETO there was one headquarters soldier for every seven total soldiers, in Korea, this ratio had climbed to one headquarters staffer for every four soldiers. The ratio of combat to noncombat soldiers was one to three in Korea in 1953.
Since 1945, the Army had done away with some aspects of McNair’s pooling concept. This resulted in additional divisional combat elements, primarily in the form of increased fi eld artillery cannons in each battery and the addition of an antiaircraft artillery (AAA) battalion and a tank
Figure 16. Korea, July 1953, including Japan Base.24
37%33%
24%
Combat
Logistics
HQ/Admin
Life Support
Combat
Logistics
HQ/Admin
Life Support
6%

27
battalion. Accordingly, the Korean War infantry division was one-third larger than its 1945 equivalent, with a strength of 20,036 compared to the 14,037 of its predecessor organization.25
Figure 17 depicts the categories in the 1953 infantry division while Figure 18 shows the functional T3R ratio. While the gross number of combat troops increased within the division, so too did logistical and
HEADQUARTERS
CATEGORY- PRIMARY MISSION
COMBAT LOGISTICALX X
IIIx3
I Ix9
I Ix4
I I I
DIVISIONARTILLERY
IRECON
I IORD
IQM
IMP
I I
IREPL
I I
I IAW AW = Automatic Weapons
REPL = Replacement
HEADQUARTERS
CATEGORY- PRIMARY MISSION
COMBAT LOGISTICALX XX XX X
IIIx3
IIIIIIIIIx3
I Ix9
I II Ix9
I Ix4
I Ix4
II I II I
DIVISIONARTILLERYDIVISIONARTILLERY
IRECON
IRECON
I IORD
I IORD
IQM
IQM
IMP
IMP
I II I
IREPL
IREPL
I II I
I IAW
I IAWAW AW = Automatic Weapons
REPL = Replacement
Figure 17. Korean War Infantry Division Organization.
Figure 18. Infantry Division, July 1953.26
18%
20%
Combat
Logistics
HQ/Admin
Combat
Logistics
HQ/Admin62%
28
headquarters elements. Additional combat elements required additional headquarters. And the additional combat elements were also equipped with vehicles and equipment, increasing the divisional logistical component. Combat elements in the division declined by 6 percent from 1945 and headquarters elements increased by 2 percent and logistical elements by 4 percent. The biggest change in the division’s logistical structure was the expansion of the divisional ordnance (i.e., maintenance) company to a battalion and the addition of a replacement company, whose strength could fl uctuate from 41 to over a thousand, depending on the replacement status of the division.27
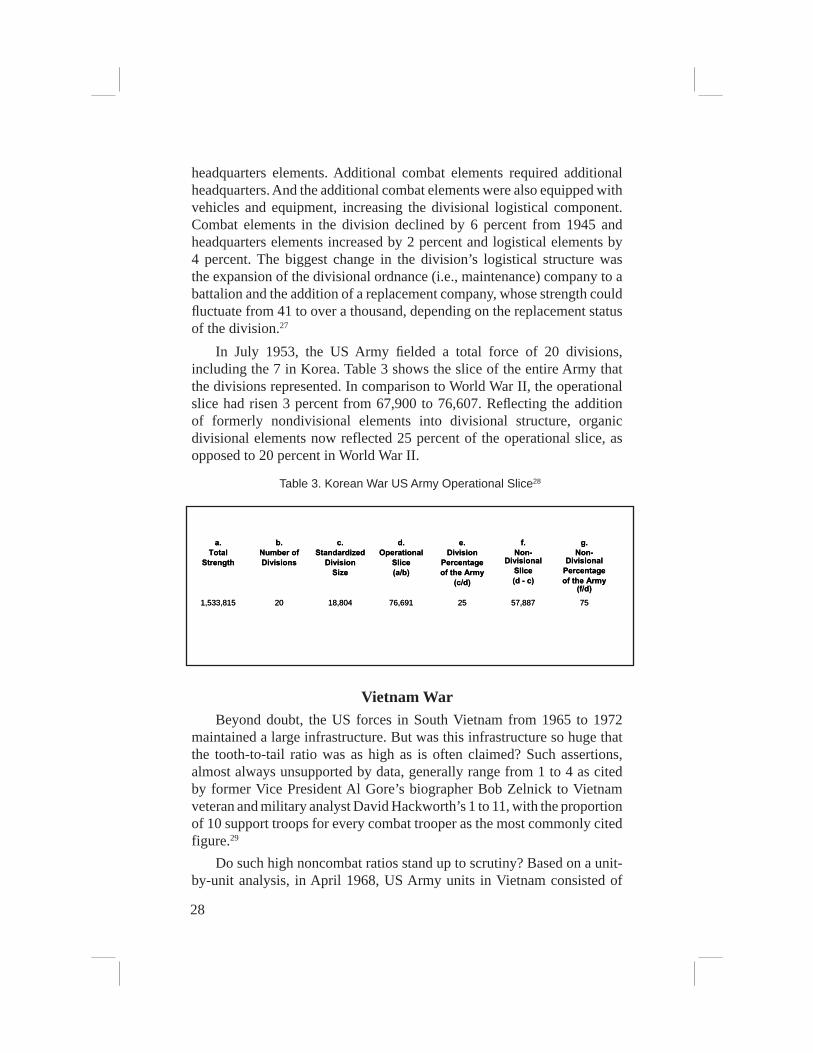
In July 1953, the US Army fi elded a total force of 20 divisions, including the 7 in Korea. Table 3 shows the slice of the entire Army that the divisions represented. In comparison to World War II, the operational slice had risen 3 percent from 67,900 to 76,607. Refl ecting the addition of formerly nondivisional elements into divisional structure, organic divisional elements now reflected 25 percent of the operational slice, as opposed to 20 percent in World War II.
Vietnam WarBeyond doubt, the US forces in South Vietnam from 1965 to 1972
maintained a large infrastructure. But was this infrastructure so huge that the tooth-to-tail ratio was as high as is often claimed? Such assertions, almost always unsupported by data, generally range from 1 to 4 as cited by former Vice President Al Gore’s biographer Bob Zelnick to Vietnam veteran and military analyst David Hackworth’s 1 to 11, with the proportion of 10 support troops for every combat trooper as the most commonly cited figure.29
Do such high noncombat ratios stand up to scrutiny? Based on a unit-by-unit analysis, in April 1968, US Army units in Vietnam consisted of
7557,8872576,69118,804201,533,815
g.Non-
DivisionalPercentageof the Army
(f/d)
f.Non-
DivisionalSlice(d - c)
e.Division
Percentageof the Army
(c/d)
d.Operational
Slice(a/b)
c.Standardized
DivisionSize
b.Number ofDivisions
a.Total
Strength
7557,8872576,69118,804201,533,815
g.Non-
DivisionalPercentageof the Army
(f/d)
f.Non-
DivisionalSlice(d - c)
e.Division
Percentageof the Army
(c/d)
d.Operational
Slice(a/b)
c.Standardized
DivisionSize
b.Number ofDivisions
a.Total
Strength
Table 3. Korean War US Army Operational Slice28

29
305,156 troops. For a 10-to-1 ratio to be an accurate proportion, only 33,618 of these troops would have been serving in a combat capacity. But there were seven divisions deployed in the country (and the equivalent of one and two-thirds more in separate brigades.) Even excluding any nondivisional combat troops, this results in each division fi elding only 4,802 combat troops. However, the typical infantry division used in Vietnam, organized under the Reorganization Objective Army Division (ROAD) confi guration (Figure 19) consisted of about 16,902 soldiers. The Army reconfi gured infantry divisions deployed to Vietnam into a “light” structure, which deleted much of the heavy equipment found in the division’s logistics tail and its combat elements, while adding additional companies and battalions to its infantry component.
Based on the table of organization, the combat component of such divisions, while not as high as the World War II division’s 68 percent or the Korean War’s 62 percent, was approximately 9,769 troops or 58 percent of the divisional totals. Accordingly, the 7 divisions alone accounted for roughly 68,383 combat personnel. Within the division, headquarters units accounted for 31 percent and logistical elements were 11 percent of the total personnel based on function (Figure 20).30
Consequently, with over double the number of combat troops (68,383 versus 33,618), the functional tooth-to-tail ratio in Vietnam in April 1968
Figure 19. Vietnam War Theater Organization, 1968.
HEADQUARTERSCATEGORY- PRIMARY MISSION
COMBAT LOGISTICAL
X X Xx3
+ +1st LOG
Cited battalions are battalion equivalents1st LOG = 1st Logistical CommandAC = Air Cavalry ADA = Air Defense ArtilleryADV = Advisors AG = Adjutant GeneralAV = Aviation ENG = EngineersFA = Field Artillery MED = MedicalMI = Military Intelligence MP = Military PoliceMT = Maintenance ORD = OrdnanceS&S = Supply and Service SC = Signal CorpsSPT = Support TC = Transportation Corps
AV 6 TC 1SPT 11 MI 1S&S 3 ORD 1MED 5 MP 1FA 7 ADA 1
I I Ix37*
AG 6AV 7S&S 19MT 7MED 5HOSPITALS 27TC 33ORD 5
I Ix48
I Ix109
AV 12AC 5FA 26ADA 5
XXXXXMACV
I Ix89 AV 26 MI 10
AG 2 TC 26MT 10 ORD 4MED 4 MP 7
I Ix60
SC 8MP 9ENG 37AG 6
Xx4
X Xx5
X Xx2
XXXXUSARV
I I I
LIFE SUPPORT
* INCLUDES BRIGADE AND SUPPORT COMMAND HEADQUARTERS
+ +1st LOG
SF
ADV
+ +1st LOG
HEADQUARTERSCATEGORY- PRIMARY MISSION
COMBAT LOGISTICAL
X X Xx3
X X XX X Xx3
+ +1st LOG
+ +1st LOG
Cited battalions are battalion equivalents1st LOG = 1st Logistical CommandAC = Air Cavalry ADA = Air Defense ArtilleryADV = Advisors AG = Adjutant GeneralAV = Aviation ENG = EngineersFA = Field Artillery MED = MedicalMI = Military Intelligence MP = Military PoliceMT = Maintenance ORD = OrdnanceS&S = Supply and Service SC = Signal CorpsSPT = Support TC = Transportation Corps
AV 6 TC 1SPT 11 MI 1S&S 3 ORD 1MED 5 MP 1FA 7 ADA 1
I I Ix37*
I I II I Ix37*
AG 6AV 7S&S 19MT 7MED 5HOSPITALS 27TC 33ORD 5
I Ix48
I Ix48
I Ix109
I Ix109
AV 12AC 5FA 26ADA 5
XXXXXMACV
XXXXXMACV
I Ix89
I II Ix89 AV 26 MI 10
AG 2 TC 26MT 10 ORD 4MED 4 MP 7
I Ix60
I Ix60
SC 8MP 9ENG 37AG 6
Xx4
XXx4
X Xx5
X XX Xx5
X Xx2
X Xx2
X XX Xx2
XXXXUSARVXXXXXXXXXXXX
USARV
I I II I II I I
LIFE SUPPORT
* INCLUDES BRIGADE AND SUPPORT COMMAND HEADQUARTERS
+ +1st LOG
+ +1st LOG
SF
ADV
+ +1st LOG
+ +1st LOG
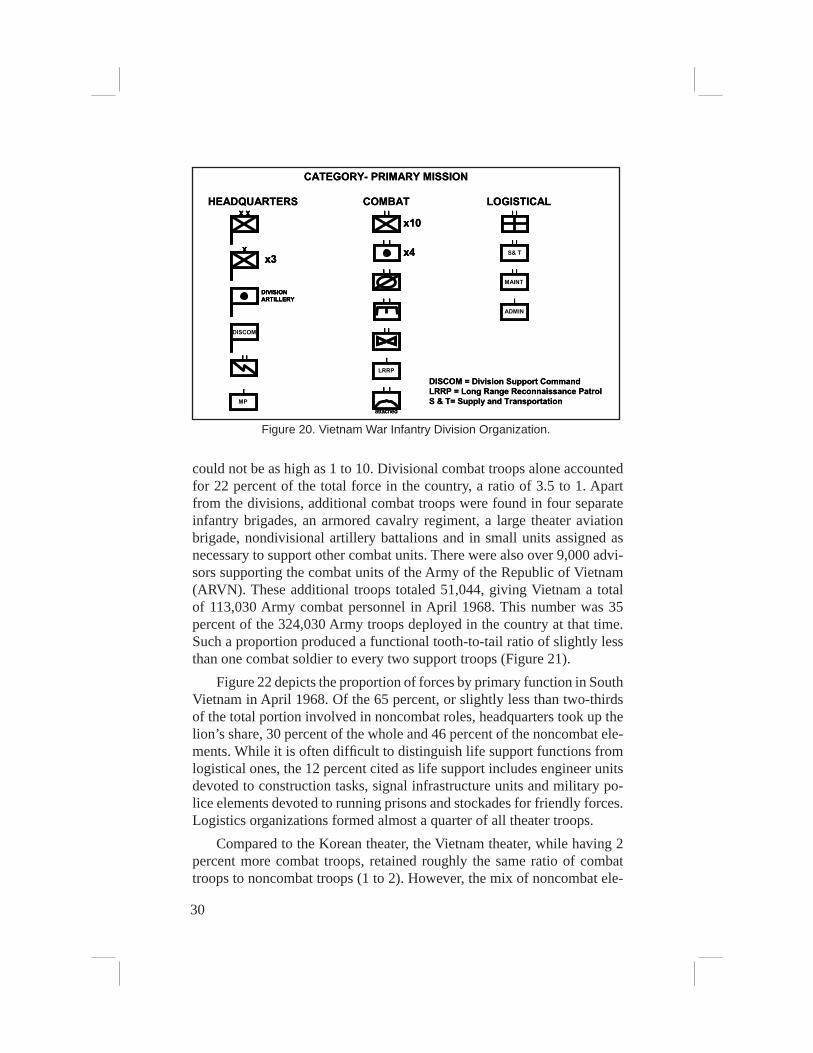
30
could not be as high as 1 to 10. Divisional combat troops alone accounted for 22 percent of the total force in the country, a ratio of 3.5 to 1. Apart from the divisions, additional combat troops were found in four separate infantry brigades, an armored cavalry regiment, a large theater aviation brigade, nondivisional artillery battalions and in small units assigned as necessary to support other combat units. There were also over 9,000 advi-sors supporting the combat units of the Army of the Republic of Vietnam (ARVN). These additional troops totaled 51,044, giving Vietnam a total of 113,030 Army combat personnel in April 1968. This number was 35 percent of the 324,030 Army troops deployed in the country at that time. Such a proportion produced a functional tooth-to-tail ratio of slightly less than one combat soldier to every two support troops (Figure 21).
Figure 22 depicts the proportion of forces by primary function in South Vietnam in April 1968. Of the 65 percent, or slightly less than two-thirds of the total portion involved in noncombat roles, headquarters took up the lion’s share, 30 percent of the whole and 46 percent of the noncombat ele-ments. While it is often diffi cult to distinguish life support functions from logistical ones, the 12 percent cited as life support includes engineer units devoted to construction tasks, signal infrastructure units and military po-lice elements devoted to running prisons and stockades for friendly forces. Logistics organizations formed almost a quarter of all theater troops.
Compared to the Korean theater, the Vietnam theater, while having 2 percent more combat troops, retained roughly the same ratio of combat troops to noncombat troops (1 to 2). However, the mix of noncombat ele-
Figure 20. Vietnam War Infantry Division Organization.
HEADQUARTERS
CATEGORY- PRIMARY MISSION
COMBAT LOGISTICALX X
Xx3
I Ix10
I Ix4
I I
I IDIVISIONARTILLERY
ILRRP
I IMAINT
I IS& T
IMP
I I
IADMIN
DISCOM = Division Support CommandLRRP = Long Range Reconnaissance PatrolS & T= Supply and Transportation
DISCOM
I I
I I
I I
attached
HEADQUARTERS
CATEGORY- PRIMARY MISSION
COMBAT LOGISTICALX XX XX X
Xx3
XXXx3
I Ix10
I II Ix10
I Ix4
I Ix4
I II I
I II IDIVISIONARTILLERYDIVISIONARTILLERY
ILRRP
ILRRP
I IMAINT
I IMAINT
I IS& TI I
S& T
IMP
IMP
I II I
IADMIN
IADMIN
DISCOM = Division Support CommandLRRP = Long Range Reconnaissance PatrolS & T= Supply and Transportation
DISCOMDISCOM
I II II I
I II I
I I
attached
I II I
attached

31
ments had changed. Headquarters elements continued their trend of ex-pansion, increasing 4 percent from Korea (and 14 percent from the ETO in World War II). Life support elements increased in Vietnam by 6 percent from Korea. Much of the increase in life support was seemingly at the expense of logistical elements. This may indicate the blurred line between these two elements, rather than an actual decline in logistical elements be-cause of a life support increase. Overall, logistical and life support eleents
Figure 21. ROAD Light Infantry Division, Vietnam 1968.31
11%
31%
Combat
Logistics
HQ/Admin
Combat
Logistics
HQ/Admin58%
Figure 22. US Army, Vietnam, April 1968.32
23% 35%
30%
Combat
Logistics
HQ/Admin
Life Support
Combat
Logistics
HQ/Admin
Life Support
12%

32
represented 35 percent of total theater forces in 1968 Vietnam. This was a decrease from 42 percent in Korea and 45 percent in World War II. The decrease is accounted for by a concurrent increase in headquarters ele-ments.
In 1968, the US Army fi elded 19 divisions, of which 7 were in Vietnam. Additionally, there were six separate combat brigades, roughly the equivalent of two more divisions. Table 4 shows how the divisions compared to the total size of the Army. The resulting operational slice of 74,778 is roughly 1 percent less than the equivalent fi gure from the Korean War. The percentage of divisional elements in the slice decreased by 3 percent as well.33
The Cold War Era, 1974
The Nunn AmendmentAs the Cold War confrontation with the Soviet Union evolved into
an extended stand-off, occupation forces in Germany and Japan became defensive forces. During the Vietnam War, the demands for troops and equipment in Southeast Asia partially depleted the US units in Germany. At the same time, however, the Soviets conducted a unilateral build up of their forces in central Europe. They had upgraded all their tanks to newer models and increased the number of tanks in their motorized rifl e divisions. At the same time, fi ve tank divisions were added to the troops arrayed against North Atlantic Treaty Organization (NATO) units. Along with this numerical increase, the 1968 Warsaw Pact invasion of Czechoslovakia caught NATO planners and intelligence analysts by surprise. It seemed that the Soviets were building up for a surprise attack in Germany. Further signs of renewed Soviet aggressiveness were apparent in Kremlin threats to intervene in the crisis precipitated by the 1973 Yom Kippur War.35
7858k,3032274,77816,475211,570,343
g.Non-
DivisionalPercentageof the Army
(f/d)
f.Non-
DivisionalSlice(d - c)
e.Division
Percentageof the Army
(c/d)
d.Operational
Slice(a/b)
c.Standardized
DivisionSize
b.Number ofDivisions
a.Total
Strength
7858k,3032274,77816,475211,570,343
g.Non-
DivisionalPercentageof the Army
(f/d)
f.Non-
DivisionalSlice(d - c)
e.Division
Percentageof the Army
(c/d)
d.Operational
Slice(a/b)
c.Standardized
DivisionSize
b.Number ofDivisions
a.Total
Strength
Table 4. Vietnam War US Army Operational Slice.34

33
that the Soviets were building up for a surprise attack in Germany. Further signs of renewed Soviet aggressiveness were apparent in Kremlin threats to intervene in the crisis precipitated by the 1973 Yom Kippur War.35
Therefore, new emphasis was placed on the American ground forces in Germany. Four combat divisions (two armored, two mechanized infan-try), two separate brigades and two armored cavalry regiments had been stationed there since the 24th Infantry Division (Mechanized) had been transferred to Fort Riley in 1968. With Army troops in Germany since 1945, a large support structure had built up over the years. Figure 23 shows the Army forces in Germany in 1974 and 1976 by functional category.36
As part of the Army’s post-Vietnam reduction and conversion to an all-volunteer force, members of Congress expressed some concerns about the post-drawdown tooth-to-tail ratio.37 Congress had the constitutional responsibility to authorize the armed forces’ budget. It typically used this responsibility as a means to provide oversight of the armed forces and often attached specifi c provisions as amendments to the act approving the budget. In 1974, when members of the US Congress looked at the military
HEADQUARTERS
CATEGORY- PRIMARY MISSION
COMBAT LIFE SUPPORT
X X Xx2
+ +TASCOM
Cited battalions are battalion equivalents
TASCOM = Theater Army Support CommandADA = Air Defense Artillery AG = Adjutant GeneralAV = Aviation CEG = Combat Equipment GroupENG = Engineers FA = Field ArtilleryFIN = Finance NF = InfantryMED = Medical MI = Military IntelligenceMP = Military Police MT = MaintenanceORD = Ordnance PSOP = Psychological OperationsSF = Special Forces S&S = Supply and ServiceSC = Signal Corps SPT = SupportTC = Transportation Corps
AV 1 TC 2SPT 3 MI 4ORD 15 MED 1MP 6 AG 1FA 13 ADA 4SC 27 QM 2ENG 10
I I Ix89*
AG 6AV 4S&S 3MP 1MT 14MED 4HOSPITALS 16TC 12ORD 8ENG 3FIN 3
I Ix49
I Ix74
AV 3INF 1FA 27ADA 17SF 1
XXXXUSAREUR
& 7A
I Ix62
AV 3 MI 8 MT 10AG 1 TC 5 ORD 5MED 3 MP 4 SC 15SPT 2 QM 1 PSOP 1ENG 4
I Ix21
MED 14MP 7
x2
* INCLUDES BRIGADE AND COMMAND HEADQUARTERS
X X
X Xx2
Xx1
Xx1
I I Ix2
+ +TASCOM
I I ICEG
DEPOTS x8
LOGISTICAL
x5
Xx2
1976TASCOMMERGED
WITHUSAREUR
1976
Non-combatelements
reduced by12,175
1976
HEADQUARTERS
CATEGORY- PRIMARY MISSION
COMBAT LIFE SUPPORT
X X Xx2
X X XX X Xx2
+ +TASCOM
+ +TASCOM
Cited battalions are battalion equivalents
TASCOM = Theater Army Support CommandADA = Air Defense Artillery AG = Adjutant GeneralAV = Aviation CEG = Combat Equipment GroupENG = Engineers FA = Field ArtilleryFIN = Finance NF = InfantryMED = Medical MI = Military IntelligenceMP = Military Police MT = MaintenanceORD = Ordnance PSOP = Psychological OperationsSF = Special Forces S&S = Supply and ServiceSC = Signal Corps SPT = SupportTC = Transportation Corps
AV 1 TC 2SPT 3 MI 4ORD 15 MED 1MP 6 AG 1FA 13 ADA 4SC 27 QM 2ENG 10
I I Ix89*
I I II I Ix89*
AG 6AV 4S&S 3MP 1MT 14MED 4HOSPITALS 16TC 12ORD 8ENG 3FIN 3
I Ix49
I Ix49
I Ix74
I Ix74
AV 3INF 1FA 27ADA 17SF 1
XXXXUSAREUR
& 7A
I Ix62
I II Ix62
AV 3 MI 8 MT 10AG 1 TC 5 ORD 5MED 3 MP 4 SC 15SPT 2 QM 1 PSOP 1ENG 4
I Ix21
I Ix21
MED 14MP 7
x2
* INCLUDES BRIGADE AND COMMAND HEADQUARTERS
X XX X
X Xx2
X Xx2
Xx1
Xx1
Xx1
Xx1
I I Ix2
I I II I II I Ix2
+ +TASCOM
I I ICEGI I I
CEG
DEPOTSDEPOTS x8
LOGISTICAL
x5
Xx2
Xx2
1976TASCOMMERGED
WITHUSAREUR
1976
Non-combatelements
reduced by12,175
1976
Figure 23. Germany 1974 and 1976 Organization.

34
force structure in Europe, it was perceived to be too fat in support and headquarters elements in comparison to its combat elements. Senator Sam Nunn of Georgia sponsored and Congress passed a provision specifi cally designed to correct this perceived defi ciency for the Fiscal Year 1975-76 budget which stated “the non-combat component of the total United States military strength in Europe authorized as of June 30, 1974, shall be re-duced by 18,000.” The Army’s share of this total was 12,175. The amend-ment also allowed the Army to replace the noncombat components with combat elements. These were defi ned in particular as battalion-size units of infantry, armor, fi eld artillery, air defense artillery, cavalry, engineers, special forces, and aviation.38
According to the Army’s Active Army Troop List, dated 31 March 1974, there were 186,822 troop positions authorized in Germany. This allotment of soldiers consisted of an authorized 51,170 combat troops (27 percent), 70,455 headquarters or headquarters support personnel (38 percent) and 65,094 positions (35 percent) for logistical or life support type positions (Figure 24).39
Congress required reductions in the 73 percent which did not consist of combat elements. The Nunn Amendment allowed for two courses of action: the elimination of the 12,175 noncombat positions outright or their replacement by combat positions. Both actions had to be completed within 2 years. Naturally, the Army chose the latter and instituted the short-lived Brigade-75 and Brigade-76 programs to produce the lion’s share of the positions.40 With these two choices, the Nunn Amendment’s provisions
Figure 24. US Army in Germany, March 1974.
35%
38% 27%
Life Support
HQ/Admin
Combat
Logistics/Life Support
HQ/Admin
Combat
Logistics/

35
provided a tooth-to-tail spread allowing combat elements to be between 29 and 34 percent of the total organization in Europe (Figure 25). This yielded ratios between combat and noncombat forces of 1 to 2.4 and 1 to 1.9. Congress, accordingly, in 1974 considered an acceptable tooth-to-tail ratio to be roughly two noncombat soldiers for every combat soldier.
There is no direct indication as to how Congress determined its tooth-to-tail ratio. It seems to have been a combination of factors. The fear of the Soviet threat in central Europe drove much of the discussion. After the Vietnam drawdown, it seemed essential to get the most combat power out of the available manpower. Congressional reports produced in 1973 and 1974 also made it clear that Congress was most concerned with what it saw as a proliferation of headquarters organizations. A third, and possibly key point, was that at the height of the Vietnam deployment, as previously discussed, combat troops made up 36 percent of forces, a higher ratio of combat troops than the 27 percent found in Germany in 1974 and even higher than that required by the Nunn Amendment’s top fi gure (34 percent). The difference in fi gures may be ascribed to a greater need for life support in Germany. Unlike in Vietnam, many families of soldiers
Figure 25. The Nunn Amendment Tooth-to-Tail Ratio.
020406080
100120140160180200
Total
Non-Combat
Combat
1974NUNN
REDUCTIONSNUNN
REDUCTIONS W/CBT PLUS UP
73%
29% 34%27%
66%71%
THO
USA
ND
SO
FTR
OO
PS
020406080
100120140160180200
Total
Non-Combat
Combat
1974NUNN
REDUCTIONSNUNN
REDUCTIONS W/CBT PLUS UP
73%
29% 34%27%
66%71%
THO
USA
ND
SO
FTR
OO
PS

36
accompanied them to Germany and lived in government-provided housing facilities. These facilities required a proportion of support that had not been necessary in Vietnam.41
ROAD Armored DivisionThe 1974 Cold War Army still used the ROAD structure, as employed
in Vietnam. While most of the units in Vietnam were light infantry divisions, the divisions in Germany either were all mechanized infantry or armored. For the sake of this work, the Vietnam infantry division was compared with the 1974 ROAD armored division. Figure 26 categorizes the divisional elements. Figure 27 shows this armored division proportionally divided into combat, logistical and headquarters categories. With attachments for combat, usually aviation elements, the Vietnam divisions were 1,843 larger than their counterparts in Germany. Additionally, while 1968 Vietnam divisions usually had 11 combat battalions (10 infantry and 1 cavalry), and the two 1974 armored divisions in Germany had 12 combat battalions (6 tank, 5 mechanized infantry, 1 cavalry), the combat slice in the 1974 division was smaller by 3,059. Some of these differences may be accounted for by the difference in size between tank units and infantry units. Tank battalions were only about two-thirds of the size of infantry battalions. As expected of a unit equipped largely with mechanized vehicles, logistical
HEADQUARTERS
CATEGORY- PRIMARY MISSION
COMBAT LOGISTICAL
I Ix4
I I
I I
DIVISIONARTILLERY
I IMAINT
I IS& T
IMP
I I
IADMIN
DISCOM = Division Support CommandFIN =FinanceChap = ChaparralS & T = Supply and Transportation
DISCOM
I I
I
X X
I Ix5
I Ix6
Xx3
I IVULCAN/CHAP
IFIN
HEADQUARTERS
CATEGORY- PRIMARY MISSION
COMBAT LOGISTICAL
I Ix4
I Ix4
I II I
I II I
DIVISIONARTILLERYDIVISIONARTILLERY
I IMAINT
I IMAINT
I IS& TI I
S& T
IMP
IMP
I II I
IADMIN
IADMIN
DISCOM = Division Support CommandFIN =FinanceChap = ChaparralS & T = Supply and Transportation
DISCOMDISCOM
I II II I
II
X XX X
I Ix5
I Ix5
I II Ix5
I Ix6
I II Ix6
Xx3
Xx3
I IVULCAN/CHAP
I II II IVULCAN/CHAP
IFIN
IFIN
Figure 26. Armored Division Organization, 1974.

37
personnel account for most (9 percent) of the 13 percent difference in combat strength between the Vietnam division and the 1974 organization. However, not all of the difference consists of logistical elements. Four percent of the difference was in a proportional increase in the size of headquarters. Of course, logistical elements had their own headquarters units to control their operations.42
In a comparison with the 1943-45 armored division, the ROAD 1974 armored division was 40 percent larger with 4,369 additional personnel spaces. But within these additions, the combat element had been proportionally reduced by 13 percent, while the headquarters slice increased by 14 percent. Even though World War II armored divisions only had 6 combat maneuver battalions (3 tank and 3 armored infantry) compared to 11 (6 tank and 5 mechanized infantry) in the ROAD division, the larger battalions in the World War II division totaled 2,736 combat positions as opposed to 4,237 combat slots in the 1974 counterpart. For a 120 percent increase in the number of maneuver battalions, the ROAD division only contained a 55 percent augmentation in combat troops. The ROAD division was organized into smaller units with a proportional increase in headquarters elements and decrease in combat positions.43
The Nunn Amendment related to the operational slice. It ultimately ended up being an attempt to increase the number of division equivalents in the force structure without expanding the overall strength of the organization. Between 1974 and 1976, the Army did increase its number
Figure 27. ROAD Armored Division, 1974.
35%
20%
Combat
Logistics
HQ/Admin
Combat
Logistics
HQ/Admin45%

38
of division equivalents by 2.5, with basically the same overall strength. Table 5 shows the operational slice for 1974 and 1976. The original slice, condemned by Congress, was actually smaller by almost 17,000 (or the equivalent of one division) than the equivalent fi gure during the Vietnam and Korea eras. The percentage of the slice containing divisional troops was actually 6 percent higher than during the Vietnam War and 3 percent higher than that of Korea. By 1976, the Army had expanded to 16 divisions. This expansion was done largely by merely moving some logistical and combat elements to the reserve components. Nevertheless, the operational slice was reduced by almost 11,000 troops, with the proportion of the Army found in combat divisions being increased by 6 percent. However, many senior Army offi cials felt the tail had been reduced below minimal levels. In 1980, General Edward Meyer, the then Army Chief of Staff, even referred to the Army at the time in a famous comment as being “hollow,” referring to defi ciencies in equipment, manning and modernization.44
The Congressional foray into the tooth-to-tail ratio, aside from establishing a general mandate of 34 percent combat troops, also provided one of the fi rst realizations that headquarters units, even those headquarters commanding combat troops, were not part of the tooth, but the tail. Despite this realization, when the Army conducted its next major force structure reorganization, the Division 86/Army of Excellence Program, headquarters elements were increased, not decreased. While providing an interesting look at the T3R and the only publicly prescribed minimum ratio in the modern era, the Nunn Amendment seemed to have no lasting effect on the way Army force planners designed units.
Table 5. Cold War, 1974 US Army Operational Slice
6632,2393448,71416,47516779,417
7241,5492858,02416,47513.5783,330
g.Non-
DivisionalPercentageof the Army
(f/d)
f.Non-
DivisionalSlice(d - c)
e.Division
Percentage(c/d)
d.Operational
Slice(a/b)
c.Standardized
DivisionSize
b.Number ofDivisions
a.Total
Strength
6632,2393448,71416,47516779,417
7241,5492858,02416,47513.5783,330
g.Non-
DivisionalPercentageof the Army
(f/d)
f.Non-
DivisionalSlice(d - c)
e.Division
Percentage(c/d)
d.Operational
Slice(a/b)
c.Standardized
DivisionSize
b.Number ofDivisions
a.Total
Strength

39
Division 86/Army of Excellence/DESERT STORM 1991Starting in the late 1970s, with the projected fi elding of new weapons
systems including the M1 tank, the M2 infantry fi ghting vehicle and the AH-64 Apache attack helicopter, US Army force planners began looking at an organizational structure to replace the ROAD confi guration. This redesign was originally called “Division 86” and then later, when extended to the Army as a whole, as “the Army of Excellence.” In redesigning the division, Army planners were given an operational concept, which was projected to produce the following rough ratio between its components in a division about 17,500 in size: combat—77.5 percent, headquarters—9.7 percent, and logistics—12.8 percent.45
Planners only classifi ed the division and brigade headquarters companies and the signal battalion as headquarters elements. Such elements in combat battalions and in logistical units were considered to be combat and logistical elements. Accordingly, a direct comparison with the ROAD structure is not possible. Discounting headquarters and logistical elements in combat battalions and headquarters elements in logistical units, a ROAD division possessed 45 percent of its strength in combat elements, 35 percent in headquarters elements and 20 percent in logistical elements. One thing is clear from the Division 86 planning guidance: logistical elements, already smaller than under ROAD, even including their headquarters units, were projected to be streamlined in the new organization.
Army force developers also accounted for an additional 29,500 nondivisional combat and combat service support elements designated to support each division. Of this total 47,000-troop package, divisional elements were projected to form 37 percent.46
The Division 86/Army of Excellence (AOE) reorganization went through many permutations before the fi rst divisions converted to the new confi guration in 1983. While the AOE reorganized all the types of divisions found under ROAD (infantry, light infantry, air assault, airborne, armored and mechanized infantry), this work focuses on the armored division (Figure 28) because it was the most common type of division used in DESERT STORM, the case study for the employment of the AOE structure. In a nutshell, the reorganization removed support elements from the company level in maneuver combat battalions while adding combat power with the addition of a company to each tank and mechanized infantry battalion, and two additional cannons to each fi eld artillery howitzer battery. An aviation brigade was also added to each division with one or two attack helicopter battalions and other aviation elements. Concurrently, divisional service

40
support elements were streamlined into multifunctional units groomed specifi cally to support particular division combat elements.47
Figure 29 shows the functional T3R in the AOE armored division as it was fi nally fi elded in 1986. With roughly the same number of personnel, the new organization increased the combat portion of the division by 4 percent, while reducing the headquarters portion by 10 percent, despite the addition of the aviation brigade headquarters. Logistics increased by 6 percent. This could be credited at least partially to increased maintenance and supply requirements for the newly fi elded equipment such as the M1 tank. Additionally, the increase in helicopters in the division brought with it increased aircraft maintenance requirements. At the division level, the Army of Excellence program successfully streamlined the division.48
External to the division, combat service support assets were also reorganized. Most corps-level service support units were organized into corps support groups (CSG) which controlled nondivisional logistical units within a geographical area. For the most part, one CSG was paired with each division as part of a concept called “fi x forward,” which pushed nondivisional direct support and general support logistical activities
HEADQUARTERSCATEGORY- PRIMARY MISSION
COMBAT LOGISTICAL
I Ix3
I I
I I
DIVISIONARTILLERY
I IMSB
I IFSB
IMP
IADMIN
DISCOM
I I
I
X X
I Ix4
I Ix6
Xx3
I I
INBC
I ICEWI
X
I
I
I Ix2
IAVIM
DISCOM = Division Support CommandCEWI = Combat Electronic Warfare & IntelligenceFSB = Forward Support BattalionMSB = Main Support BattalionNBC = Nuclear, Biological, ChemicalAVIM = Aviation Intermediate Maintenance
HEADQUARTERSCATEGORY- PRIMARY MISSION
COMBAT LOGISTICAL
I Ix3
I Ix3
I II I
I II I
DIVISIONARTILLERYDIVISIONARTILLERY
I IMSBI I
MSB
I IFSBI I
FSB
IMP
IMP
IADMIN
IADMIN
DISCOMDISCOM
I II II I
II
X XX X
I Ix4
I Ix4
I II Ix4
I Ix6
I II Ix6
Xx3
Xx3
I II II I
INBC
INBC
I ICEWI
I ICEWI
XX
II
II
I Ix2
I Ix2
IAVIM
IAVIM
DISCOM = Division Support CommandCEWI = Combat Electronic Warfare & IntelligenceFSB = Forward Support BattalionMSB = Main Support BattalionNBC = Nuclear, Biological, ChemicalAVIM = Aviation Intermediate Maintenance
Figure 28. Armored Division Organization, 1986.
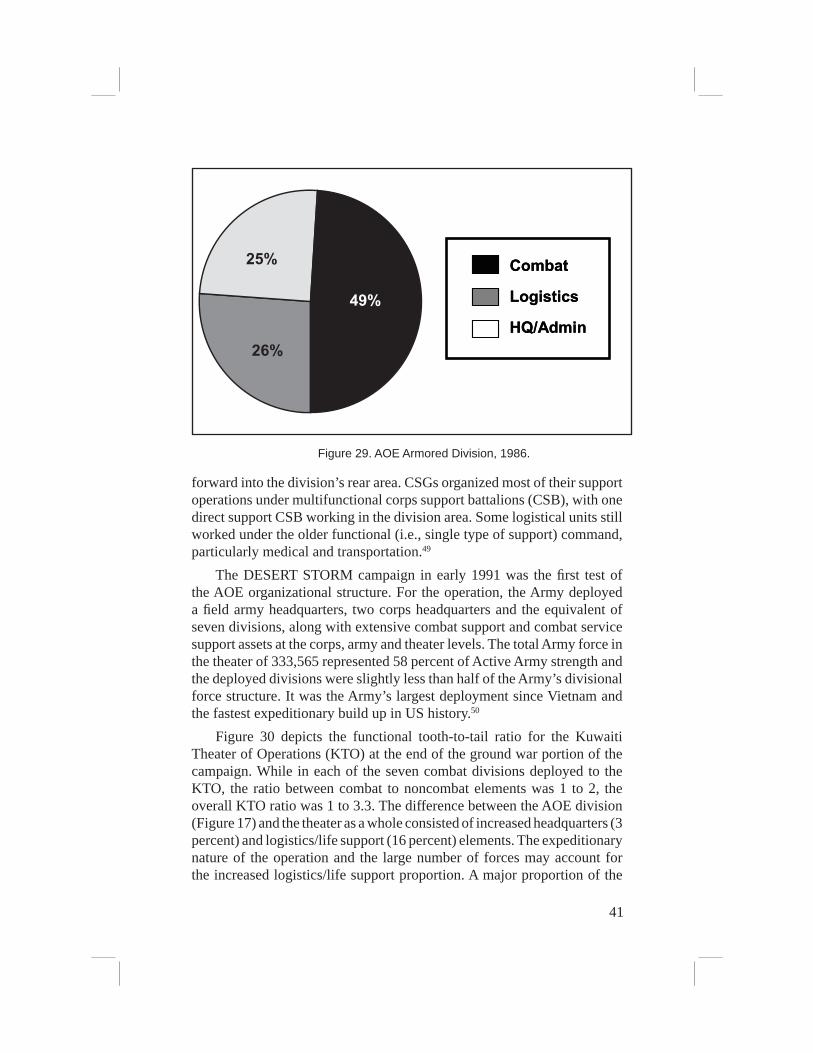
41
forward into the division’s rear area. CSGs organized most of their support operations under multifunctional corps support battalions (CSB), with one direct support CSB working in the division area. Some logistical units still worked under the older functional (i.e., single type of support) command, particularly medical and transportation.49
The DESERT STORM campaign in early 1991 was the fi rst test of the AOE organizational structure. For the operation, the Army deployed a fi eld army headquarters, two corps headquarters and the equivalent of seven divisions, along with extensive combat support and combat service support assets at the corps, army and theater levels. The total Army force in the theater of 333,565 represented 58 percent of Active Army strength and the deployed divisions were slightly less than half of the Army’s divisional force structure. It was the Army’s largest deployment since Vietnam and the fastest expeditionary build up in US history.50
Figure 30 depicts the functional tooth-to-tail ratio for the Kuwaiti Theater of Operations (KTO) at the end of the ground war portion of the campaign. While in each of the seven combat divisions deployed to the KTO, the ratio between combat to noncombat elements was 1 to 2, the overall KTO ratio was 1 to 3.3. The difference between the AOE division (Figure 17) and the theater as a whole consisted of increased headquarters (3 percent) and logistics/life support (16 percent) elements. The expeditionary nature of the operation and the large number of forces may account for the increased logistics/life support proportion. A major proportion of the
Figure 29. AOE Armored Division, 1986.
25%
26%
Combat
Logistics
HQ/Admin
Combat
Logistics
HQ/Admin49%

42
logistical piece was found in medical units, as US planners expected heavy casualties. Surprisingly, the headquarters element was 10 percent smaller than in Cold War Germany (Figure 11) and the logistics/life support portion was 7 percent higher. The latter statistic may be partially accounted for in the large amount of host nation support available to logistical elements in Germany.51
However, the proportions in the KTO are not that different from the ratios in the previous similar US Army expeditionary operation, the deployment to Vietnam (Figure 22). In Vietnam, combat troops were 35 percent of the total, while the KTO fi gure was a decrease of 5 percent. Headquarters elements decreased by 2 percent in the KTO deployment compared to Vietnam, while logistical/life support elements increased from Vietnam to the KTO operation by 7 percent.
Some Army offi cers, particularly logisticians, feared that the T3R in the post-Nunn Amendment era had been tilted in favor of combat forces to an extent where the logistical forces had become a “thin line . . . behind the combat forces.”52 In 1987, LTC John Vann observed negatively that Army logistical unit levels had never been restored to the levels before and during Vietnam, and had actually declined. The operational slice from 1991 (Table 6) clearly refl ects Vann’s assessment. Army wide, the slice, at 39,046, was the lowest it had ever been since the Army fi elded the division as its basic operational unit. This meant that divisions took up the largest proportion of Army strength ever since World War I at 44 percent. However, the slice for the divisions deployed to Southwestern Asia for
Figure 30. Kuwaiti Theater of Operations (KTO), March 1991.
28%
42%30%
Life Support
HQ/Admin
Combat
Logistics/Life Support
HQ/Admin
Combat
Logistics/

43
DESERT STORM was 5 percent and 8,606 soldiers higher. This refl ected the Army’s deployment of a larger proportion of nondivisional forces to SWA than was normally found overall, with divisions forming 37 percent of the Gulf force, while they formed 44 percent of the Army as a whole.
The Modular Army and the New MillenniumAfter DESERT STORM, the Army retained the AOE structure
throughout the 1990s, tweaking it primarily by removing antitank companies from mechanized infantry battalions, deleting one of the line companies from the tank and mechanized infantry battalions, and adding an engineer battalion and a motorized reconnaissance troop to each brigade. In the latter part of the decade, the perceived impact of digital communications resulted in the development of a streamlined version of the AOE called Force XXI. The primary distinctive feature of the Force XXI concept was that logistical activities were consolidated in the units of the division support command (DISCOM). Digital communications were considered capable enough of tracking logistical needs to allow for the consolidation of the traditional unit and direct support echelons of combat service support and most logistical elements were deleted completely from combat battalions. The Force XXI changes were not completely implemented, only being fi elded in one division and parts of a second, before the program was supplanted with the modular Army concept.
Unlike the AOE change, which was basically a streamlined version of the ROAD structure, the shift to the modular structure in the early years of the new millennium was a conceptual shift from the division to the brigade as the basic operational organization. The development of the brigade-based Stryker program was its direct precursor.
Table 6. DESERT STORM US Army Operational Slice53
6430,5483647,65217,1047333,565
5621,9454439,04617,10414.66572,423
g.Non-
DivisionalPercentageof the Army
(f/d)
f.Non-
DivisionalSlice(d - c)
e.Division
Percentage(c/d)
d.Operational
Slice(a/b)
c.Standardized
DivisionSize
b.Number ofDivisions
a.Total
Strength
6430,5483647,65217,1047333,565
5621,9454439,04617,10414.66572,423
g.Non-
DivisionalPercentageof the Army
(f/d)
f.Non-
DivisionalSlice(d - c)
e.Division
Percentage(c/d)
d.Operational
Slice(a/b)
c.Standardized
DivisionSize
b.Number ofDivisions
a.Total
Strength
Worldwide
DESERT STORM
Worldwide
DESERT STORM

44
Stryker BrigadesThe modular Army had its origins in the development of the Stryker
Brigade. The creation of Stryker units began in 1999 as the latest in a series of Army attempts to develop an acceptable light armored wheeled vehicle to equip infantry units. Such a vehicle gave infantry much more of the fi repower and survivability inherent in heavy (mechanized infantry and armored) units while retaining most of the strategic mobility of light infantry units. The program soon developed the Stryker combat vehicle as its basic piece of equipment. The biggest departure from the past was the use of the brigade, rather than the division, as the basic operational unit in the Stryker program. While most Stryker brigades retained divisional designations, the brigades were organized as completely self-contained units with all the supporting divisional elements being part of the organization (Figure 31). For this reason, the brigades were usually referred to as brigade combat teams (BCT). Reinforcing this notion, as of early 2007, no Stryker brigade had yet been employed operationally under its titular division headquarters.
Stryker brigades used the digital packages developed for Force XXI to enhance their fi ghting and command and control capabilities. Accordingly, the headquarters elements in the Stryker brigades were reduced by 7 percent
HEADQUARTERS
CATEGORY- PRIMARY MISSION
COMBAT LOGISTICAL
SPT = SupportMI = Military Intelligence
I I
x3X
I I
I
I I
SPTI I
I
MII
I
HEADQUARTERS
CATEGORY- PRIMARY MISSION
COMBAT LOGISTICAL
SPT = SupportMI = Military Intelligence
I I
x3I I
x3XXXXX
I II I
II
I II II I
SPTSPTI I
II
MII
MIMII
II
Figure 31. Stryker Brigade Organization, 2004.

45
proportionally from headquarters in the AOE division. This decrease was split almost in half between the brigade’s logistical and combat elements, with combat forces increasing by 3 percent and logistical elements by 4 percent. The ratio between combat and noncombat elements is shown in Figure 32.
Modular BrigadesAs early as 2002, the Army began developing plans to expand the
Stryker organizational structure to the rest of the Army. Starting in early 2004, these designs were implemented in a construct known as the modular Army. The modular Army changed the basic operational unit from the division to the brigade, but did not remove the division from the organizational structure. Under modularity, divisions acted primarily as command and control headquarters with their subordinate elements tailored based on the division’s mission. However, when AOE divisions converted to the new structure, most of the former divisional elements remained under their old division. This gave a notional modular division organization as shown by category in Figure 33.
Such a division consisted of a division headquarters, four combined arms brigades (from the division’s three former maneuver brigades), and one each of the following: a fi res brigade (the former division artillery headquarters with a multiple rocket launcher system (MLRS) battalion; an aviation brigade (former divisional aviation brigade); a reconnaissance,
Figure 32. Stryker Brigade, 2004.
18%
30%
Combat
Logistics
HQ/Admin
Combat
Logistics
HQ/Admin52%

46
surveillance, and target acquisition (RSTA) brigade (an expansion of the former divisional military intelligence battalion); a sustainment brigade (the former division support command headquarters with division-level support elements); and a combat support or maneuver enhancement brigade (containing former divisional elements such as the air defense artillery (ADA) and engineer battalion and an expanded nuclear, biological, chemical (NBC) company).54
The notional modular division, containing almost all the elements found in the AOE division, was larger by 5,127 positions, an increase of 30 percent. Headquarters elements formed more than half (56 percent) of this increase, while most of the rest (41 percent) was an increase in logistical elements. A task-organized modular division was slated to be even larger with additional battalions typically attached to the brigades (Figure 34).55
Because it was a system based on brigades, that echelon was key to the modular concept. The modular nature of the concept was the ability to employ, organize and move around Army operational forces based on standardized brigade organizations, a smaller and therefore more operationally fl exible unit than the division. The brigades were reorganized into three basic types: light (light infantry), heavy (tanks and mechanized infantry) and medium (the Stryker brigades that were being developed separately). Within these types, the brigades were also designed to be
HEADQUARTERS
CATEGORY- PRIMARY MISSION
COMBAT LOGISTICALXX X
x4X
X
I Ix1-3MI
I Ix1-3
X
I I
I Ix1-2
X I Ix2-4SPT
SUST
XCS I I
x1-2I I
I ICA
MI = Military IntelligenceCS = Combat SupportSUST = SustainmentSPT = Support
HEADQUARTERS
CATEGORY- PRIMARY MISSION
COMBAT LOGISTICALXXXX X
x4X
x4x4X
XX
I Ix1-3MI
I Ix1-3MI
I Ix1-3
I II Ix1-3
XX
I I
I Ix1-2
I II I
I Ix1-2
I Ix1-2
XX I Ix2-4SPT
SUST
XCS
XCS I II I
x1-2I II II I
I ICAI I
CA
MI = Military IntelligenceCS = Combat SupportSUST = SustainmentSPT = Support
Figure 33. Notional Modular Division Organization, 2004.
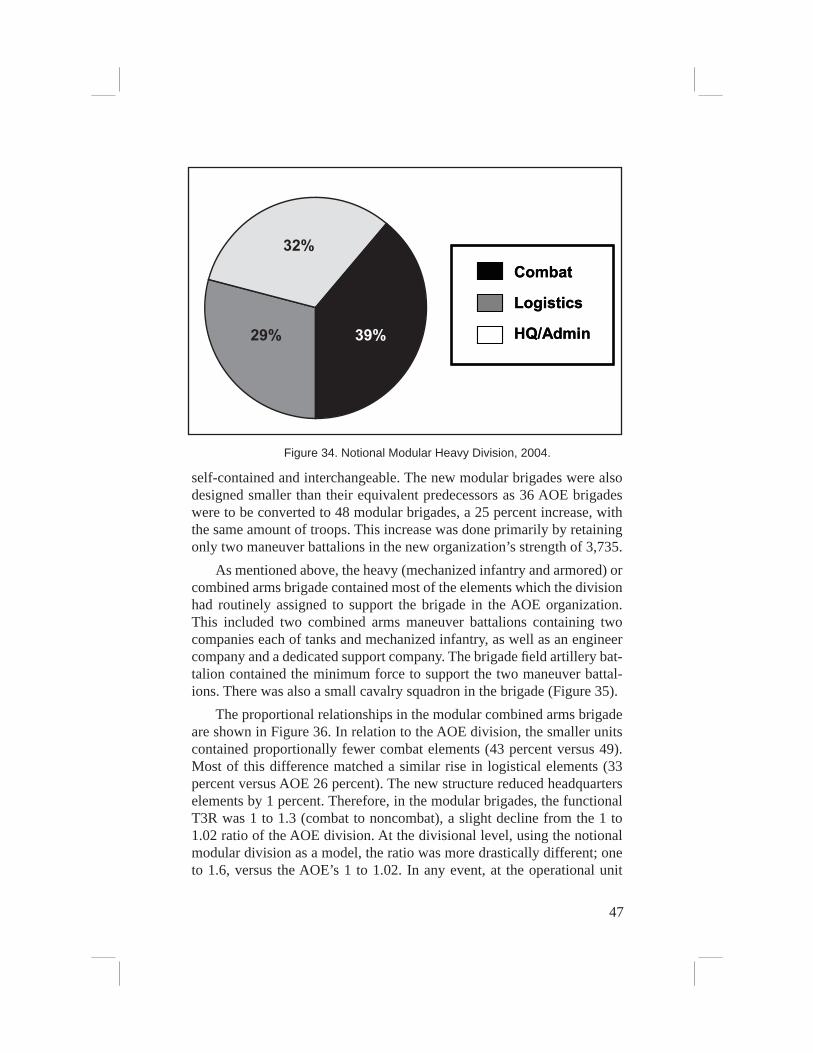
47
self-contained and interchangeable. The new modular brigades were also designed smaller than their equivalent predecessors as 36 AOE brigades were to be converted to 48 modular brigades, a 25 percent increase, with the same amount of troops. This increase was done primarily by retaining only two maneuver battalions in the new organization’s strength of 3,735.
As mentioned above, the heavy (mechanized infantry and armored) or combined arms brigade contained most of the elements which the division had routinely assigned to support the brigade in the AOE organization. This included two combined arms maneuver battalions containing two companies each of tanks and mechanized infantry, as well as an engineer company and a dedicated support company. The brigade fi eld artillery bat-talion contained the minimum force to support the two maneuver battal-ions. There was also a small cavalry squadron in the brigade (Figure 35).
The proportional relationships in the modular combined arms brigade are shown in Figure 36. In relation to the AOE division, the smaller units contained proportionally fewer combat elements (43 percent versus 49). Most of this difference matched a similar rise in logistical elements (33 percent versus AOE 26 percent). The new structure reduced headquarters elements by 1 percent. Therefore, in the modular brigades, the functional T3R was 1 to 1.3 (combat to noncombat), a slight decline from the 1 to 1.02 ratio of the AOE division. At the divisional level, using the notional modular division as a model, the ratio was more drastically different; one to 1.6, versus the AOE’s 1 to 1.02. In any event, at the operational unit
Figure 34. Notional Modular Heavy Division, 2004.
32%
29%
Combat
Logistics
HQ/Admin
Combat
Logistics
HQ/Admin39%

48
(i.e., brigade) level, combat elements in the new millennium were not far removed from being on par with noncombat elements.
As part of its adoption of the modular brigade as the basic operational unit, the Army also instituted a program called Force Stabilization or Unit Focused Stability. Unit Focused Stability supplanted the individual
Figure 35. Combined Arms Modular Brigade, 2004.
HEADQUARTERS
CATEGORY- PRIMARY MISSION
COMBAT LOGISTICALI I
BSB
I I
I I
XI
MI
I
I IBTB
I Ix2
two firing batteriesI I
Ix2
Ix2
I
IFSC
attached from BSB
I
I IBSB
IFSC
FA (Fires) BN
x2
IFSC
Cav Sqn
I
I
BTB = Brigade Troops BattalionBSB = Brigade Support BattalionFSC = Forward Support Company
IFSC
Combined Arms BNs
HEADQUARTERS
CATEGORY- PRIMARY MISSION
COMBAT LOGISTICALI I
BSBI I
BSB
I II I
I I
XI
MI
I
XXI
MII
MI
II
I IBTB
I IBTB
I Ix2
two firing batteriesI I
Ix2
Ix2
I
IFSC
I I
Ix2
Ix2
I
I II I
Ix2
Ix2
Ix2
Ix2
II
IFSC
IFSC
attached from BSB
II
I IBSBI I
BSBI I
BSB
IFSC
IFSC
FA (Fires) BN
x2
IFSC
IFSC
Cav Sqn
II
III
BTB = Brigade Troops BattalionBSB = Brigade Support BattalionFSC = Forward Support Company
IFSC
IFSC
Combined Arms BNs
Figure 36. Modular Combined Arms Brigade, 2004.
24%
33%
Combat
Logistics
HQ/Admin
Combat
Logistics
HQ/Admin43%
49
replacement system in the new modular brigade combat teams with a unit manning life cycle at the brigade level. Once the system was implemented, the cycle for each brigade would be 3 years, ensuring that brigade soldiers served together for that period. The Army coupled stabilization with another new program called “home basing.” Home basing was designed to ensure that new soldiers remained at the same post for at least 6 or 7 years when they joined the Army, except when deployed overseas. The two programs together were focused on the brigade as the stabilized and home-based unit. 56
Another characteristic of the modular organization was an overhaul of headquarters to structure them to match actual fi eld employment. Head-quarters at the brigade, division and corps levels were organized by func-tion and most units considered in this work to be headquarters elements, such as signal and military intelligence (MI) organizations, were consoli-dated under a headquarters or troops battalion. At the brigade level, the former headquarters company was replaced by a brigade troops battalion (BTB) of about 500 that included headquarters staffs for both the brigade and the troops battalion, as well as an MI company and a signal company. Under the BTB’s brigade headquarters company, there were two command posts (CP), a small tactical (TAC) CP and larger main CP, and a mobile command group (MCG). The brigade commander headed the MCG, while the newly created position of deputy commander headed the TAC CP and the brigade executive offi cer (XO) the main CP. 57
At the division level, with a staff of about 1,000 soldiers, a headquar-ters and headquarters battalion replaced the former HHC and was orga-nized around four command and control elements, two TAC CPs, a main CP and a MCG. The personnel in these command posts were organized under an HHC, while support personnel, such as cooks and vehicle me-chanics, were in a separate headquarters support company. A signal and security company fi lled out the battalion. At the corps level, troop strength was about the same as at the division at around 1,000. The headquarters was organized within a troops battalion and contained four headquarters elements, a MCG equipped with its own aviation assets, an Early Entry Command Post (EECP), an operational CP and a main CP. The corps lo-gistical commander headed the main CP and usually operated out of a semipermanent fi xed location. The EECP was a subcomponent of the op-erational CP, acting as the advance party for that element. The operational CP was the forward headquarters, while the MCG was the small group centered on the corps commander. Corps headquarters were designed to command joint forces and, if necessary, to be the senior headquarters in a theater. 58
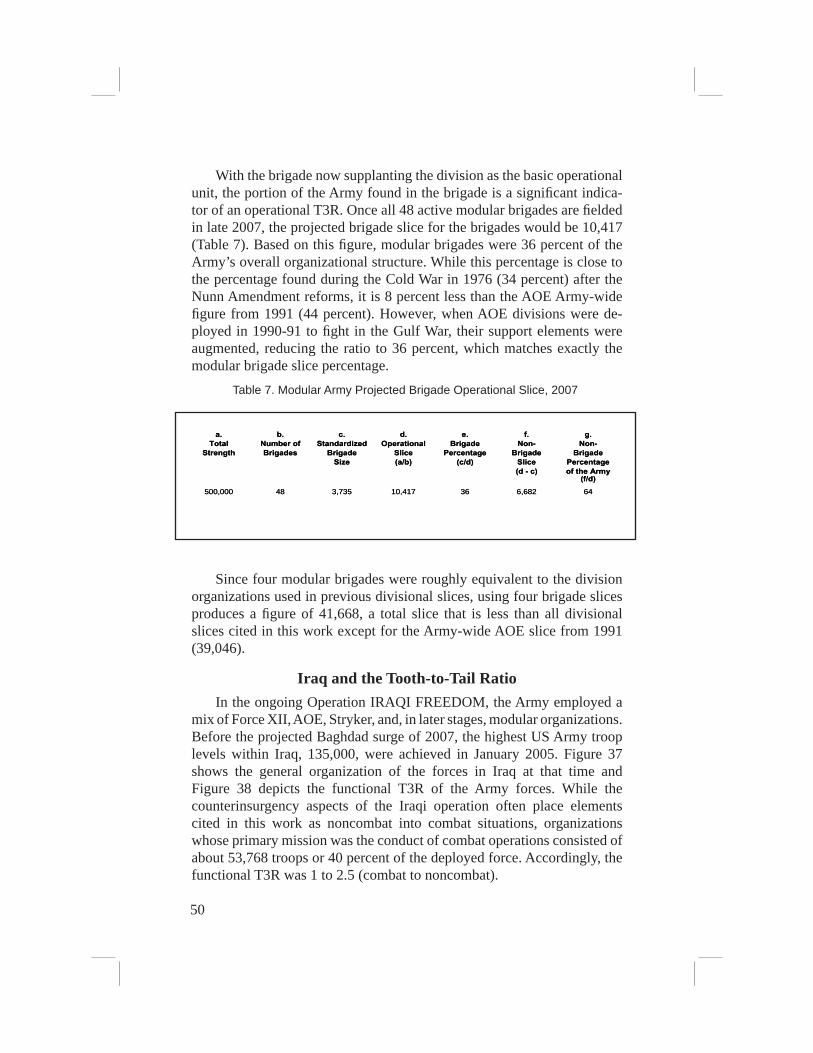
50
With the brigade now supplanting the division as the basic operational unit, the portion of the Army found in the brigade is a signifi cant indica-tor of an operational T3R. Once all 48 active modular brigades are fi elded in late 2007, the projected brigade slice for the brigades would be 10,417 (Table 7). Based on this fi gure, modular brigades were 36 percent of the Army’s overall organizational structure. While this percentage is close to the percentage found during the Cold War in 1976 (34 percent) after the Nunn Amendment reforms, it is 8 percent less than the AOE Army-wide fi gure from 1991 (44 percent). However, when AOE divisions were de-ployed in 1990-91 to fi ght in the Gulf War, their support elements were augmented, reducing the ratio to 36 percent, which matches exactly the modular brigade slice percentage.
Since four modular brigades were roughly equivalent to the division organizations used in previous divisional slices, using four brigade slices produces a fi gure of 41,668, a total slice that is less than all divisional slices cited in this work except for the Army-wide AOE slice from 1991 (39,046).
Iraq and the Tooth-to-Tail RatioIn the ongoing Operation IRAQI FREEDOM, the Army employed a
mix of Force XII, AOE, Stryker, and, in later stages, modular organizations. Before the projected Baghdad surge of 2007, the highest US Army troop levels within Iraq, 135,000, were achieved in January 2005. Figure 37 shows the general organization of the forces in Iraq at that time and Figure 38 depicts the functional T3R of the Army forces. While the counterinsurgency aspects of the Iraqi operation often place elements cited in this work as noncombat into combat situations, organizations whose primary mission was the conduct of combat operations consisted of about 53,768 troops or 40 percent of the deployed force. Accordingly, the functional T3R was 1 to 2.5 (combat to noncombat).
Table 7. Modular Army Projected Brigade Operational Slice, 2007
646,6823610,4173,73548500,000
g.Non-
BrigadePercentageof the Army
(f/d)
f.Non-
BrigadeSlice(d - c)
e.Brigade
Percentage(c/d)
d.Operational
Slice(a/b)
c.Standardized
BrigadeSize
b.Number ofBrigades
a.Total
Strength
646,6823610,4173,73548500,000
g.Non-
BrigadePercentageof the Army
(f/d)
f.Non-
BrigadeSlice(d - c)
e.Brigade
Percentage(c/d)
d.Operational
Slice(a/b)
c.Standardized
BrigadeSize
b.Number ofBrigades
a.Total
Strength
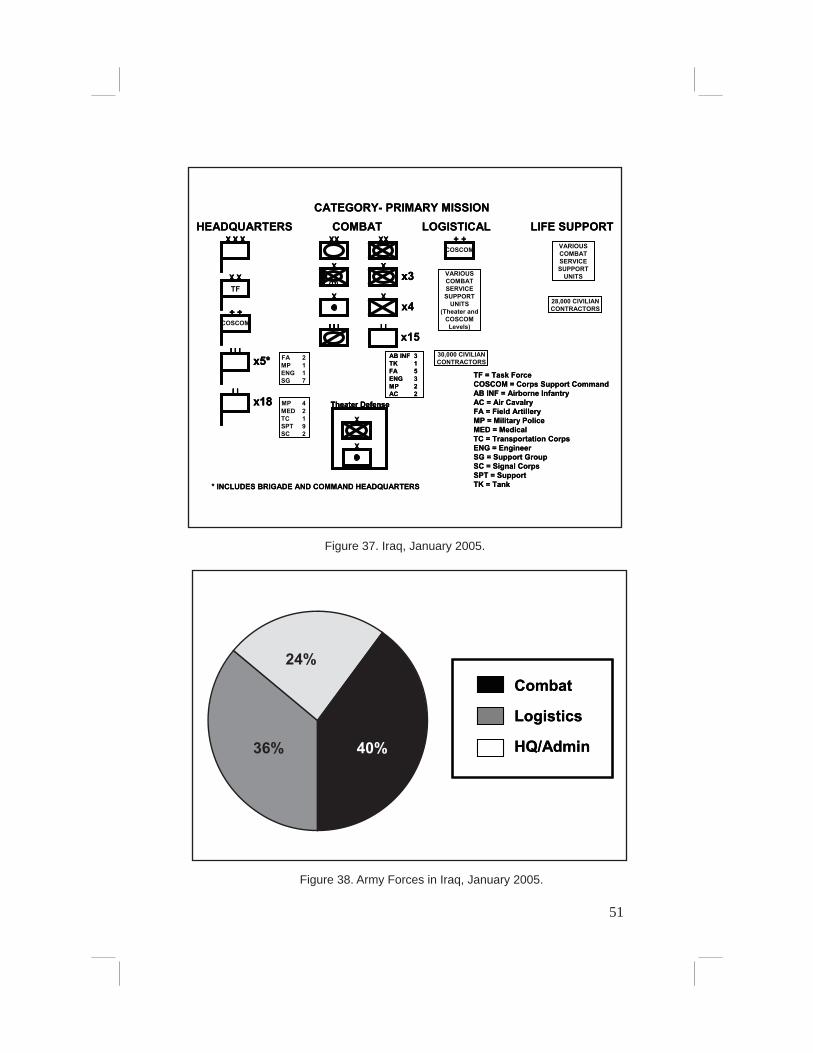
51
HEADQUARTERSCATEGORY- PRIMARY MISSION
COMBAT LOGISTICALXXXX
x4
X
X
+ +COSCOM
X X X
X XTF
I I
FA 2MP 1ENG 1SG 7
I I Ix5*
I Ix18 MP 4
MED 2TC 1SPT 9SC 2
* INCLUDES BRIGADE AND COMMAND HEADQUARTERS
+ +COSCOM
X
x3X
Theater Defense
X
X
x15AB INF 3TK 1FA 5ENG 3MP 2AC 2
I I I
VARIOUSCOMBATSERVICESUPPORT
UNITS(Theater and
COSCOMLevels)
28,000 CIVILIANCONTRACTORS
LIFE SUPPORTVARIOUSCOMBATSERVICESUPPORT
UNITS
30,000 CIVILIANCONTRACTORS
TF = Task ForceCOSCOM = Corps Support CommandAB INF = Airborne InfantryAC = Air CavalryFA = Field ArtilleryMP = Military PoliceMED = MedicalTC = Transportation CorpsENG = EngineerSG = Support GroupSC = Signal CorpsSPT = SupportTK = Tank
HEADQUARTERSCATEGORY- PRIMARY MISSION
COMBAT LOGISTICALXXXXXXXX
x4
XX
XX
+ +COSCOM
X X XX X XX X X
X XTFX XTF
I II I
FA 2MP 1ENG 1SG 7
I I Ix5*
I I II I Ix5*
I Ix18
I II Ix18 MP 4
MED 2TC 1SPT 9SC 2
* INCLUDES BRIGADE AND COMMAND HEADQUARTERS
+ +COSCOM
+ +COSCOM
XX
x3X
x3XX
Theater Defense
X
X
Theater Defense
XX
XX
x15AB INF 3TK 1FA 5ENG 3MP 2AC 2
I I II I II I II I I
VARIOUSCOMBATSERVICESUPPORT
UNITS(Theater and
COSCOMLevels)
28,000 CIVILIANCONTRACTORS
LIFE SUPPORTVARIOUSCOMBATSERVICESUPPORT
UNITS
30,000 CIVILIANCONTRACTORS
TF = Task ForceCOSCOM = Corps Support CommandAB INF = Airborne InfantryAC = Air CavalryFA = Field ArtilleryMP = Military PoliceMED = MedicalTC = Transportation CorpsENG = EngineerSG = Support GroupSC = Signal CorpsSPT = SupportTK = Tank
Figure 37. Iraq, January 2005.
Figure 38. Army Forces in Iraq, January 2005.
24%
36%
Combat
Logistics
HQ/Admin
Combat
Logistics
HQ/Admin40%

52
This proportion was 10 percent higher than the 1991 KTO deployment and was comparable to combat proportion in the ETO in World War II (39 percent). It was a considerably higher proportion of combat troops than in Vietnam (35 percent) and Korea (33 percent) and the Nunn Amendment minimum acceptable level of between 29 and 34 percent. Yet, many commentators have cited the extensive life support activities occurring concurrent with combat operations throughout Iraq.59
It is diffi cult to cull life support elements from those conducting logis-tical activities. Unique from previous historical examples discussed in this work, the extensive use of civilian contractors in Iraq has muddied the wa-ters in relation to the functional tooth-to-tail ratio. Estimates of the number of contractors in Iraq in January 2005 vary. The commander of the Army’s major theater-level logistical organization cited a fi gure of 9,000 civil-ians working in his organization and a total of 30,000 logistics contractors working throughout Iraq. In Boots on the Ground, a total contractor fi gure of 58,000 was used. That fi gure is retained here, divided for 30,000 logisti-cal and 28,000 life support contractors.60
Adding the 58,000 contractors to the functional T3R equation produces the pie chart depicted in Figure 39. The 58,000 are divided almost evenly between the logistical and life support categories. This increase (shown by category in Figure 40) raises the overall logistical element level to 41 percent from 33, while reducing headquarters elements proportionally by 7 percent and combat elements by 12 percent. Contractor inclusion adds a
Figure 39. Army Forces in Iraq including Contractor Support, January 2005.
CivilianContractors31%
Combat28%
Logistics/Life Support
24%HQ/
Admin17%
Logistics16%
Life Support15%
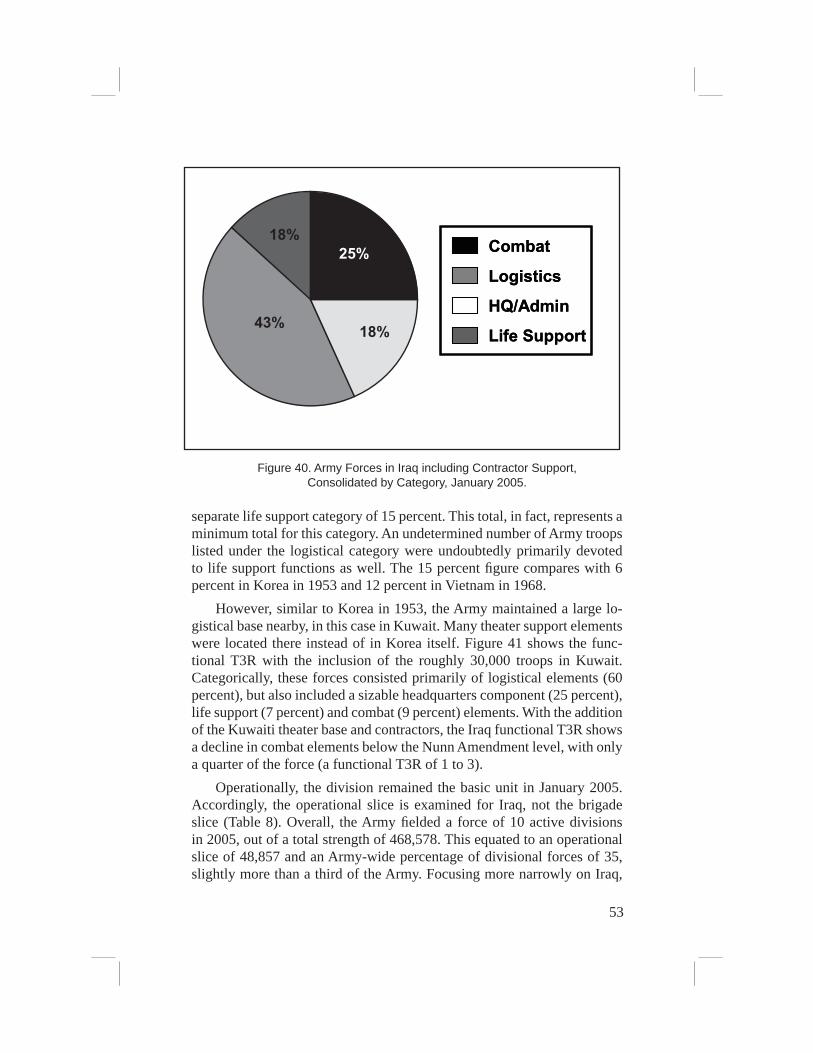
53
separate life support category of 15 percent. This total, in fact, represents a minimum total for this category. An undetermined number of Army troops listed under the logistical category were undoubtedly primarily devoted to life support functions as well. The 15 percent fi gure compares with 6 percent in Korea in 1953 and 12 percent in Vietnam in 1968.
However, similar to Korea in 1953, the Army maintained a large lo-gistical base nearby, in this case in Kuwait. Many theater support elements were located there instead of in Korea itself. Figure 41 shows the func-tional T3R with the inclusion of the roughly 30,000 troops in Kuwait. Categorically, these forces consisted primarily of logistical elements (60 percent), but also included a sizable headquarters component (25 percent), life support (7 percent) and combat (9 percent) elements. With the addition of the Kuwaiti theater base and contractors, the Iraq functional T3R shows a decline in combat elements below the Nunn Amendment level, with only a quarter of the force (a functional T3R of 1 to 3).
Operationally, the division remained the basic unit in January 2005. Accordingly, the operational slice is examined for Iraq, not the brigade slice (Table 8). Overall, the Army fi elded a force of 10 active divisions in 2005, out of a total strength of 468,578. This equated to an operational slice of 48,857 and an Army-wide percentage of divisional forces of 35, slightly more than a third of the Army. Focusing more narrowly on Iraq,
Figure 40. Army Forces in Iraq including Contractor Support,Consolidated by Category, January 2005.
43%
25%18%
Combat
Logistics
HQ/Admin
Life Support
Combat
Logistics
HQ/Admin
Life Support18%
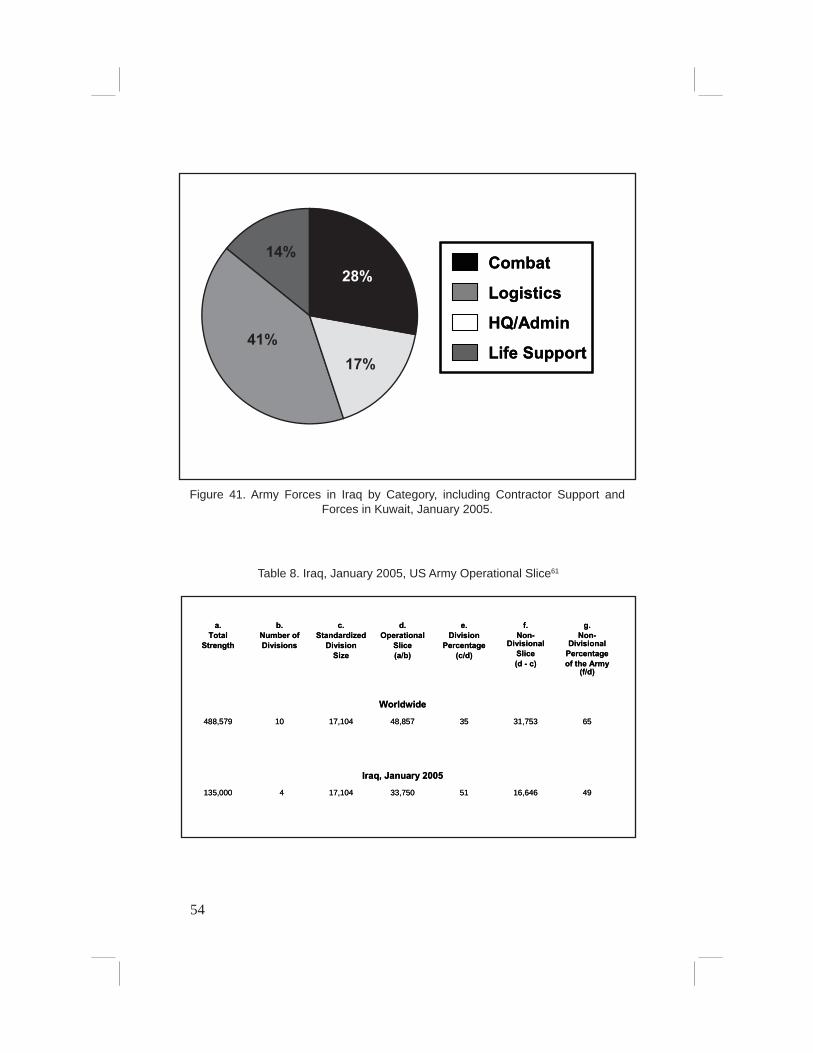
54
Table 8. Iraq, January 2005, US Army Operational Slice61
4916,6465133,75017,1044135,000
6531,7533548,85717,10410488,579
g.Non-
DivisionalPercentageof the Army
(f/d)
f.Non-
DivisionalSlice(d - c)
e.Division
Percentage(c/d)
d.Operational
Slice(a/b)
c.Standardized
DivisionSize
b.Number ofDivisions
a.Total
Strength
4916,6465133,75017,1044135,000
6531,7533548,85717,10410488,579
g.Non-
DivisionalPercentageof the Army
(f/d)
f.Non-
DivisionalSlice(d - c)
e.Division
Percentage(c/d)
d.Operational
Slice(a/b)
c.Standardized
DivisionSize
b.Number ofDivisions
a.Total
Strength
Worldwide
Iraq, January 2005
Worldwide
Iraq, January 2005
Figure 41. Army Forces in Iraq by Category, including Contractor Support and Forces in Kuwait, January 2005.
41%
28%
17%
Combat
Logistics
HQ/Admin
Life Support
Combat
Logistics
HQ/Admin
Life Support
14%

55
the four division equivalents deployed to Iraq in January 2005 equated to a theater operational slice of 33,750. Accordingly, 51 percent, slightly more than half, of the troops in Iraq were found in divisional organizations.
SummaryThe historical examples cited in this chapter provide a series of case
studies that can be readily compared and examined collectively to discover organizational trends, develop historically based force development estimates and provide an understanding of T3R development since 1917. This analysis is presented in the next chapter.

56
Notes
1. US War Department, The US Army in the World War, 1917-1919, Volume 1, “The Organization of the American Expeditionary Forces” (Washington, DC: US Army Center of Military History, 1988), 144-5 [hereafter “The Organization of the American Expeditionary Forces”].
2. The AEF maintained a force of nondivisional Corps of Engineers units consisting of 241,613 troops, representing 12 percent of the total AEF force. Cat-egorizing this force is problematic. I have chosen to place the whole engineer ele-ment in the combat category, but undoubtedly, at least some of this force belongs in the logistical category as the engineers also maintained the railroads. However, determining what portion of the 241,613 belonged in which category would re-quire a level of research beyond the scope of this work. The placement of the 241,613 in the combat category is, therefore noted. Accordingly, up to 13 percent of the total of combat troops could possibly be placed in the logistical category instead. See “The Organization of the American Expeditionary Forces,” 8; COL Carl Schmidt, “The Operational Slice in Two World Wars,” Military Review 31 (October 1951), 56.
3. US War Department, Order of Battle of the United States Land Forces in the World War, American Expeditionary Forces: General Headquarters, Armies, Army Corps, Services of Supply, Separate Forces (hereafter Order of Battle), Vol-ume 1, 8.
4. “The Organization of the American Expeditionary Forces,” 141; Order of Battle, Volume 1, 8; 446-7; US War Department, Order of Battle of the United States Land Forces in the World War, American Expeditionary Forces: Divisions (hereafter Order of Battle: Divisions), Volume 2, 446-7. The infantry regimental headquarters company was so much larger proportionally because it contained a signal platoon that provided communications for the entire regiment. See US War Department, United States Army in the World War 1917-1919, Organization of the American Expeditionary Forces, Vol. 1 (Washington, DC: US Army Center of Military History, 1988), Table 6, 345.
5. Ibid.; “The Organization of the American Expeditionary Forces,” 141; US War Department, Order of Battle, Volume 1, 8; 446-7.
6. Order of Battle: Divisions, Volume 2, 446-7.7. Order of Battle: Divisions, Volume 2, 446-7; John B. Wilson, Maneuver
and Firepower: The Evolution of Divisions and Separate Brigades, Army Lin-eage Series (Washington, DC: US Army Center of Military History, 1998), 55.
8. Order of Battle: Divisions, Volume 2, 446-7.9. “The Organization of the American Expeditionary Forces,” 142; Wilson,
68-71. The cited division was the 87th.10. “The Organization of the American Expeditionary Forces,” 142; Wil-
son, 53, 67; John McGrath, The Brigade: A History (Fort Leavenworth: Combat Studies Institute Press, 2004), 33-4.
11. This figure includes 13 divisions formed and training in the United States as of November 1918.
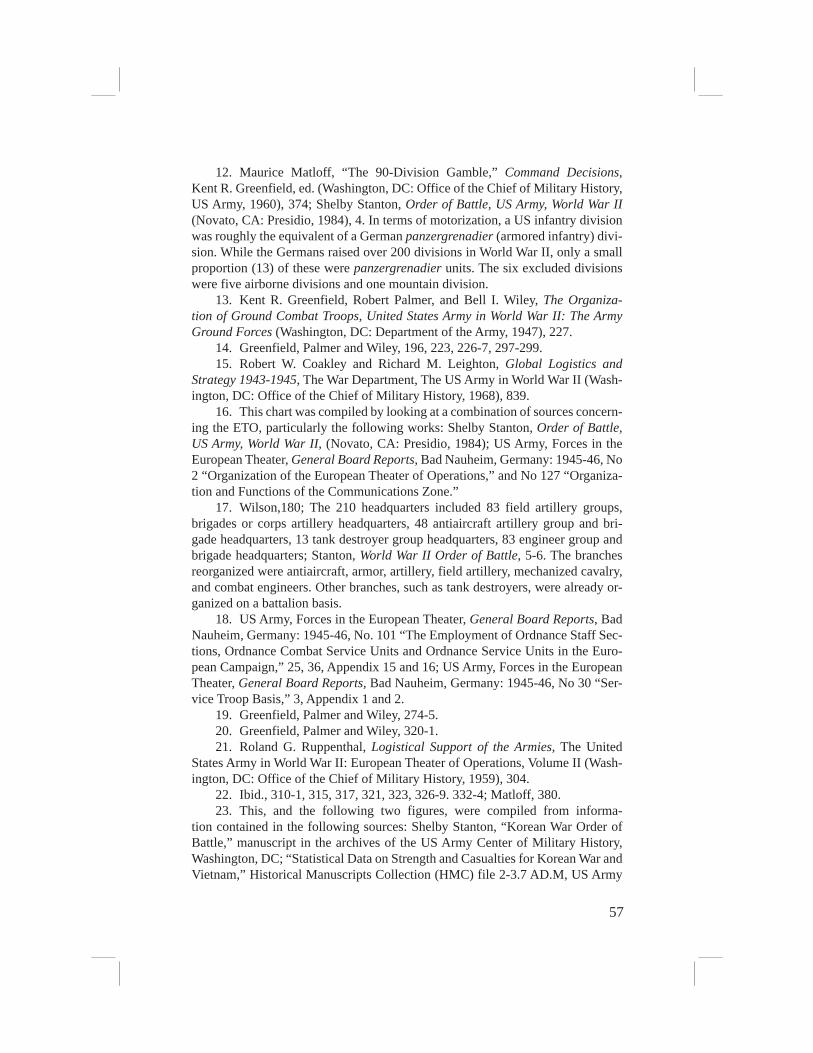
57
12. Maurice Matloff, “The 90-Division Gamble,” Command Decisions, Kent R. Greenfield, ed. (Washington, DC: Office of the Chief of Military History, US Army, 1960), 374; Shelby Stanton, Order of Battle, US Army, World War II (Novato, CA: Presidio, 1984), 4. In terms of motorization, a US infantry division was roughly the equivalent of a German panzergrenadier (armored infantry) divi-sion. While the Germans raised over 200 divisions in World War II, only a small proportion (13) of these were panzergrenadier units. The six excluded divisions were five airborne divisions and one mountain division.
13. Kent R. Greenfield, Robert Palmer, and Bell I. Wiley, The Organiza-tion of Ground Combat Troops, United States Army in World War II: The Army Ground Forces (Washington, DC: Department of the Army, 1947), 227.
14. Greenfield, Palmer and Wiley, 196, 223, 226-7, 297-299.15. Robert W. Coakley and Richard M. Leighton, Global Logistics and
Strategy 1943-1945, The War Department, The US Army in World War II (Wash-ington, DC: Office of the Chief of Military History, 1968), 839.
16. This chart was compiled by looking at a combination of sources concern-ing the ETO, particularly the following works: Shelby Stanton, Order of Battle, US Army, World War II, (Novato, CA: Presidio, 1984); US Army, Forces in the European Theater, General Board Reports, Bad Nauheim, Germany: 1945-46, No 2 “Organization of the European Theater of Operations,” and No 127 “Organiza-tion and Functions of the Communications Zone.”
17. Wilson,180; The 210 headquarters included 83 field artillery groups, brigades or corps artillery headquarters, 48 antiaircraft artillery group and bri-gade headquarters, 13 tank destroyer group headquarters, 83 engineer group and brigade headquarters; Stanton, World War II Order of Battle, 5-6. The branches reorganized were antiaircraft, armor, artillery, field artillery, mechanized cavalry, and combat engineers. Other branches, such as tank destroyers, were already or-ganized on a battalion basis.
18. US Army, Forces in the European Theater, General Board Reports, Bad Nauheim, Germany: 1945-46, No. 101 “The Employment of Ordnance Staff Sec-tions, Ordnance Combat Service Units and Ordnance Service Units in the Euro-pean Campaign,” 25, 36, Appendix 15 and 16; US Army, Forces in the European Theater, General Board Reports, Bad Nauheim, Germany: 1945-46, No 30 “Ser-vice Troop Basis,” 3, Appendix 1 and 2.
19. Greenfield, Palmer and Wiley, 274-5.20. Greenfield, Palmer and Wiley, 320-1.21. Roland G. Ruppenthal, Logistical Support of the Armies, The United
States Army in World War II: European Theater of Operations, Volume II (Wash-ington, DC: Office of the Chief of Military History, 1959), 304.
22. Ibid., 310-1, 315, 317, 321, 323, 326-9. 332-4; Matloff, 380.23. This, and the following two figures, were compiled from informa-
tion contained in the following sources: Shelby Stanton, “Korean War Order of Battle,” manuscript in the archives of the US Army Center of Military History, Washington, DC; “Statistical Data on Strength and Casualties for Korean War and Vietnam,” Historical Manuscripts Collection (HMC) file 2-3.7 AD.M, US Army
58
Center of Military History. Categorized as life support were only units whose primary mission was clearly that of life support functions. Some units, therefore, categorized as logistical may have also actually been committed to life support functions.
24. Ibid. 25. Wilson, 225-7.26. Stanton, “Korean War Order of Battle”; “Statistical Data on Strength and
Casualties for Korean War and Vietnam.” 27. Stanton, “Korean War Order of Battle,” Book V, Part XIC, 21-27; Wil-
son, 225-7.28. Stanton, “Korean War Order of Battle”; “Statistical Data on Strength and
Casualties for Korean War and Vietnam.”29. Bob Zelnick, “Soldier Gore: The Story of the Veep and Vietnam,” Na-
tional Review (22 November 1999) [article on-line], available at http://www.find-articles.com/p/articles/mi_m1282/is_22_51/ai_57436684; Internet; accessed on 20 March 2007; for 11 to 1, see David Hackworth, “Needed: More Warriors, not Military Toys,” Defending America, 26 July 1994 [article on-line] available at http://www.hackworth.com/26jul94.html; Internet; accessed on 20 March 2007.
30. Ibid. Wilson, 333-6. Since Korea, the Army had reorganized its divisions twice, first to the short-lived Pentomic structure in the late 1950s, then in the early 1960s to the ROAD organization. ROAD basically applied the World War II light armored division structure to all divisions, with an increased number of combat battalions. The ROAD organization received its baptism of fire in Vietnam.
31. Shelby Stanton, Vietnam Order of Battle (Washington, DC: US News Books, 1981), 7, 69-230 passim.
32. Stanton, Vietnam Order of Battle, 1-385 passim.33. Wilson, 333, 336-339.34. Stanton, “Korean War Order of Battle”; “Statistical Data on Strength and
Casualties for Korean War and Vietnam.”35. Major Paul Herbert, Deciding What Has to Be Done: General William
E. DePuy and the 1976 Edition of FM 100-5, Operations, Leavenworth Paper Number 16 (Fort Leavenworth: Combat Studies Institute, 1988), 5-6.
36. Wilson, 336-7.37. Michael J. Meese, “Defense Decision Making under Budget Stringency:
Explaining Downsizing in the United States Army,” (PhD diss., Princeton Uni-versity, 2000), 240-242; Major Creighton A., Abrams, Jr. “The Sixteen Division Force: Anatomy of a Decision.” (MMAS thesis, US Army Command and General Staff College, 1975)`, 27-30.
38. [US Army] Chief of Staff Memo 74-5-70 for Heads of Army Staff Agen-cies, Subject: Increased Combat Capability in Europe, 2 August 1974, Brigade 75 file, Force Structure and Unit History Branch, US Army Center of Military His-tory; “How DoD is Improving the Combat Proportions of U.S. Forces in Europe,” Commander’s Digest 18 (20 November 1975), 2-3; Wilson, 366, 376 note 31; Abrams, Jr., 27-30.

59
39. “US Department of the Army Force Accounting System, Active Army Troop List,” as of 31 March 1974, Part IV, Active Army Troop List, 3-6, 8-9, 13-28, 44-45. This document is found in the archives of the US Army Center of Military History. This computation differs from the rationale used by the Nunn Amendment (but not different from that used throughout this work) by figuring in the headquarters and support elements of battalion-size units, as well as units larger than battalions.
40. These programs set up two brigades whose combat troops rotated through Germany without their dependents for 6-month periods. The rotation concept was soon abandoned and the additional brigades, with dependents, were permanently stationed at Wiesbaden and Garlstedt.
41. Abrams, 15, 19, 26-8.42. The differences between the 1968 Vietnam US Army infantry division
and the 1974 US Army armored division are outlined in the following table:
43. Statistical comparison between the 1943-45 armored division and the 1974 armored division:
The comparison between the maneuver battalions of the 1943-45 armored division and the 1974 armored division:
44. George C. Wilson, “Joint Chiefs of Staff Break with Carter on Budget Planning,” Washington Post, 30 May 1980, A1.
45. John Romjue, “A History of Army 86, Volume 1 Division 86: The De-velopment of the Heavy Division September 1978-October 1979.” (Fort Monroe,
+55+1,501+184+54,2376,950112,7365,0856Total
+66+934+67+22,3353,83051,4012,9853Armored/Mech Inf
+42+567+100+31,9023,12061,3352,1003Tank
%CbtTotal
%BnsCbtTotalNoCbtTotalNoCombatBns
+55+1,501+184+54,2376,950112,7365,0856Total
+66+934+67+22,3353,83051,4012,9853Armored/Mech Inf
+42+567+100+31,9023,12061,3352,1003Tank
%CbtTotal
%BnsCbtTotalNoCbtTotalNoCombatBns
Difference(AD 43/45 – AD 74)
Armored Division 1974Armored Division 1943-45 Difference(AD 43/45 – AD 74)
Armored Division 1974Armored Division 1943-45
+4+78355,279315,201HQ
+9+1,138203,070111,932Log
-13-3,059456,710589,769Combat
NA-1,84310015,05910016,902Total
PercentNumberPercentNumberPercentNumber
+4+78355,279315,201HQ
+9+1,138203,070111,932Log
-13-3,059456,710589,769Combat
NA-1,84310015,05910016,902Total
PercentNumberPercentNumberPercentNumber
Difference (ID - AD)Armored Division 1974Infantry Division 1968 Difference (ID - AD)Armored Division 1974Infantry Division 1968
+14+3,014355,279212,265HQ
-1+845203,070212,225Log
-13+530456,710586,180Combat
NA+4,36910015,05910010,670Total
PercentNumberPercentNumberPercentNumber
+14+3,014355,279212,265HQ
-1+845203,070212,225Log
-13+530456,710586,180Combat
NA+4,36910015,05910010,670Total
PercentNumberPercentNumberPercentNumber

60
VA: US Army Training and Doctrine Command, 1980), 37. These ratios have been adjusted to fit the categories used in this work.
46. John L. Romjue, The Army of Excellence: The Development of the 1980s Army (Fort Monroe, VA: US Army Training and Doctrine Command, 2004), 51-2, 204-5. The rough figures were as follows:
47. Romjue, The Army of Excellence, 89.48. The standard figure for the ROAD armored division total strength was
16,475, while the AOE division strength was 17,104. For ROAD strength, see “Active Army Troop List,” 31 March 1974; for AOE strength see Romjue, The Army of Excellence, 195.
49. Department of the Army, FM 54-30 Corps Support Groups (Washington DC: Department of the Army, 1993), 1-4, 1-5,1-8, 1-17; LTC John Vann, “The Forgotten Forces,” Military Review (August 1987), 11.
50. The figure of 58 percent is slightly skewed. The Army mobilized Army National Guard and Army Reserve units, whose strengths are included in the DESERT STORM totals but not in the total size of the Army. In actuality, the portion of the Active Army strength deployed to Southwest Asia was probably closer to 50 percent of its total strength, a size that meshes with the deployment of 7 out of 14.66 divisions, whose elements all came from the Active Army. The build up to over 300,000 troops took place in less than 180 days and was actually two consecutive 90-day deployments” XVIII Airborne Corps, August-November 1990 and VII Corps, November 1990-February 1991.
51. Thomas D. Dinackus, Order of Battle: Allied Ground Forces of Opera-tion Desert Storm (Central Point, OR: Hellgate Press, 2000), 6-7; Vann, 12.
52. Vann, 2.53. The Army had been using the concept of the operational slice since
World War II to determine how many troops in the total force were needed to field the Army’s basic operational organization. But after Vietnam planners developed an additional conceptual slice—the division force equivalent (DFE). The DFE was devised by adding the strength of the division to the nondivisional forces dedicated to support it in combat. The nondivisional portion of the DFE was divided into combat and service support increments. While the DFE was tailored for particular theaters, Army-wide, its service support increment (called the tactical support increment), represented primarily by the corps support group, had risen to over 20,000. The DFE for armored or mechanized infantry divisions projected to deploy to Southwestern Asia (SWA) was 41,000. In 1983, the DFE was reevaluated as the Army Chief of Staff, General John Wickham, did not believe it accurately represented the T3R in the division and its supporting forces. The Army’s Training and Doctrine Command, therefore, devised a new methodology,
Divisional Elements 17,500 37
Non-Divisional Combat Elements 7,800 16
Non-Divisional Support Elements 22,100 47
Total 47,000 100

61
which did reflect the T3R more in line with the findings in this work. The new planning concept was called the “operational slice.” The table below shows the differences between the two concepts. See Romjue, The Army of Excellence, 29-30, 54, 204-5. The new usage of the expression operational slice referred to only a comparison of a predetermined slice of the Army designed to support a division (including the division itself). In this work, operational slice will still refer to a comparison of the forces contained in a division versus the total strength of the Army.
54. US Army Training and Doctrine Command (TRADOC) Pamphlet 525-3-90, O & O, The United States Army Objective Force Operational and Organi-zational Plan for Maneuver Unit of Action, (Fort Monroe, VA: TRADOC, 2005), 25, 41, 47; Task Force Modularity, US Army Training and Doctrine Command, “Army Comprehensive Guide to Modularity, Version 1.0” (Fort Monroe, VA: 2004), vi, 5-4.
55. “Army Comprehensive Guide to Modularity,” 5-5.56. Joe Burlas, “Force Stabilization Increases Readiness, Predictability,”
Army News Service, 9 February 2004 [article on-line] available at http://www4.army.mil/ocpa/read.php?story_id_key=5653; Internet; accessed on 10 April 2007.
57. “Army Comprehensive Guide to Modularity,” 8-2; John McGrath, Crossing the Line of Departure: Battle Command on the Move: A Historical Per-spective (Fort Leavenworth: Combat Studies Institute Press, 2006), 226-230.
58. Department of the Army, Force Development Division, “Modular Divi-sion 87000G900 Modularity Note 36A,” 8 March 2006, PowerPoint Briefing; “Comprehensive Guide to Army Modularity,” 4-3, 4-4, 5-7, 5-8, 5-9, 5-10,5-11, 8-2; McGrath, Crossing the Line of Departure, 226-230.
59. See note 4, Chapter 1.60. BG Yves J. Fontaine and MAJ Donald K. Wols, “Sustaining the
Momentum: The 1st Corps Support Command in Iraq, Army Logistician 38 (March-April 2006), 3-8; John McGrath, Boots on the Ground: Troop Density in Contingency Operations, Global War on Terrorism Occasional Paper 16 (Fort Leavenworth: Combat Studies Institute Press, 2006), 135. Some contractors were undoubtedly employed in headquarters activities and supporting the Iraqi
3722,1007,80017,50047,400 3722,1007,80017,50047,400
e.Division
Percentage(b/a)
d.TacticalSupport
Increment
c.Non-Divisional
CombatIncrement
b.Division
Increment
a.Total
e.Division
Percentage(b/a)
d.TacticalSupport
Increment
c.Non-Divisional
CombatIncrement
b.Division
Increment
a.Total
3120,2007,90012,90041,000 3120,2007,90012,90041,000
Division Force Equivalent
Revised as “Operational Slice”
Division Force Equivalent
Revised as “Operational Slice”

62
armed forces. However, since these forces usually remained on bases guarded by uniformed personnel, such contractors are included in the life support category.
61. Betty Maxfield, “Army Profile FY 05” (Washington, DC: Department of the Army, Army G1, 2005), 2. Army National Guard (33,177) and Army Reserve (189,005) strength is not included in these totals even though parts of both of these components were activated in 2005. While several divisions were reconfig-uring into the AOE structure in 2005, the AOE strength is used as all divisions in Iraq in January 2005 were of the AOE structure.

63
Chapter 3
AnalysisOverview
As mentioned in the Introduction, T3R can be analyzed on two levels: by operational slice (operational T3R) and by overall proportion (func-tional T3R). The operational slice ratio is signifi cant because it shows or-ganizationally what portion of the force the Army organized into its basic fi ghting units. For most of the period between 1917 and 2007, the basic unit was the division. Under the modular system, fully implemented in 2007, the brigade replaced the division. Figure 42 shows a comparison of the operational slices for the Army in the various historical examples discussed in this work.
Division percentages as part of the total force ranged from a high of 45 percent in World War I to a low of 20 percent in the McNair/World War II era. Divisions, therefore, varied from almost half of the Army strength to a fi fth. Since the implementation of the Nunn Amendment in the mid-1970s, division/brigade proportional strength had risen from the lows of
Figure 42. Operational T3R Trends, 1917-2005.1
Thou
sand
s
01020304050607080
Wor
ldW
arI
Wor
ldW
arII
Kor
ea
Viet
nam
Col
dW
ar19
74
Col
dW
ar19
76
Div
8619
91
KTO
1991
Arm
y20
05
Mod
ular
(200
7)
NON-DIV/BDEDIV/BDE
64%56%72%75%55% 78% 66% 65%80%
36%44%28%25%45% 20% 22% 34% 35%64%36%
Thou
sand
s
01020304050607080
Wor
ldW
arI
Wor
ldW
arII
Kor
ea
Viet
nam
Col
dW
ar19
74
Col
dW
ar19
76
Div
8619
91
KTO
1991
Arm
y20
05
Mod
ular
(200
7)
NON-DIV/BDEDIV/BDE
64%56%72%75%55% 78% 66% 65%80%
36%44%28%25%45% 20% 22% 34% 35%64%36%

64
the Vietnam era. In the Gulf War, the proportion was 36 percent or slightly more than a third of the force, a ratio maintained by the brigades under the modular Army structure.
While operational unit proportion gives a good general indication as to the T3R of the Army overall, the operational units themselves do not consist entirely of combat elements and some combat elements are not found in divisions or brigades. For example, the World War II operational slice was so low because AGF Commander Lieutenant General Lesley McNair organized divisions with minimal organic elements. This pooled many combat and support elements, which in other eras were intrinsic parts of the division.
Accordingly, the overall proportion system, or functional T3R, which analyzes deployments unit-by-unit and categorizes them into one combat and three noncombat elements, is a more precise indicator of the tooth-to-tail ratio. Figure 43 gives an overview of the functional T3R in these categories for the case studies examined in this work.2 Since 1917, com-bat elements have remained between 20 and 50 percent of the total force. Since the mechanized/motorized era (1941), the proportion has remained roughly between 30 and 40 percent, until the mass employment of con-tractors in Iraq. A more detailed examination of trends in each category follows.
Figure 43. Functional T3R Overview, 1917-2005.
COMBAT
Perc
ent
TOTAL NON-
COMBAT
0
20
40
60
80
Wor
ldW
arI
Wor
ldW
arII
Kor
ea
Viet
nam
Col
dW
ar19
74
KTO
1991
Iraq
2005
Iraq
2005
(mod
)COMBAT
Perc
ent
TOTAL NON-
COMBAT
0
20
40
60
80
Wor
ldW
arI
Wor
ldW
arII
Kor
ea
Viet
nam
Col
dW
ar19
74
KTO
1991
Iraq
2005
Iraq
2005
(mod
)

65
Combat ElementsCombat elements progressively declined from over 50 percent in 1918
to 33 percent in Korea, 35 percent in Vietnam and 27 percent in 1974 Cold War Germany. Levels then rose with the adoption of an all-volunteer Army. Congress intervened to enforce economy and mandate a minimum level of combat elements of 29-34 percent. It is uncertain where Congress, led by Senator Sam Nunn, came up with this fi gure. But since 1918, Army combat forces in the historical examples examined in this work only dipped below the 29 percent fi gure twice. This occurred once in 1974 when Nunn enacted his amendment and again in 2005 in Iraq if contractors and the theater base in Kuwait are included in the totals.
Looking at combat elements in relation to the whole Army shows how small the combat forces actually were in proportion to the whole force (Figure 44). The pure combat portion of the Army was as low as 6.5 percent in the 1974 Cold War. However, these fi gures are slightly skewed because they only account for the portion of the Army’s combat forces committed to the theaters of war studied in this work. Forces held
Figure 44. Combat Proportion of the Army, 1917-2005.
Perc
ent
64%56%
66%30
40
50
Wor
ldW
arI
Wor
ldW
arII
Viet
nam
KTO
1991
28%
2019% 17%
107.2%
07.5%
Kor
ea
6.5%
Col
dW
ar19
74
11%
Iraq
2005
Perc
ent
64%56%
66%30
40
50
Wor
ldW
arI
Wor
ldW
arII
Viet
nam
KTO
1991
28%
2019% 17%
107.2%
07.5%
Kor
ea
6.5%
Col
dW
ar19
74
11%
Iraq
2005

66
in reserve or in inactive theaters are not accounted for except in the AEF and ETO examples. In the case of the AEF, there were essentially no inactive theaters. In the ETO example, total strength was reduced to the proportional percentage (72) of divisions sent to that theater. While the US Army had worldwide commitments unaccounted for in the Korea, Vietnam, and Germany case studies, the operations in Kuwait in 1991 and in Iraq in 2005 were the Army’s main focus, refl ecting their higher totals. Accordingly, the trend has been for raw combat forces to have hovered between 10 and 20 percent of the total size of the Army.
Historical precedent, as depicted in Figure 45, shows that since 1917 combat elements have only dipped below 30 percent of the total deployed force on two occasions. In the fi rst instance, during the immediate post-Vietnam period in 1974, Congress immediately noticed and intervened to raise the combat level. In the second instance, the modifi ed 2005 Iraq example, the Army employed a large number of civilian contractors as part of the force to conduct noncombat activities.
In the modern era of mass motorization and mechanization, which be-gan with World War II, the proportion of combat elements has only varied between 40 and 25 percent of the deployed force. The Nunn Amendment
Figure 45. Combat Trends, 1917-2005.
Perc
ent
ERA OF MASS MOTORIZATION/ MECHANIZATION
0
10
20
30
40
50
60
Wor
ldW
arI
Wor
ldW
arII
Kor
ea
Viet
nam
Col
dW
ar19
74
KTO
1991
Iraq
2005
Iraq
2005
(mod
)
Nunn Amendmentminimal standard
29-34%
Perc
ent
ERA OF MASS MOTORIZATION/ MECHANIZATION
0
10
20
30
40
50
60
Wor
ldW
arI
Wor
ldW
arII
Kor
ea
Viet
nam
Col
dW
ar19
74
KTO
1991
Iraq
2005
Iraq
2005
(mod
)
Nunn Amendmentminimal standard
29-34%

67
of 1974, with its minimum-prescribed range for combat forces proportion (28-34 percent), provided a proportion slightly higher than the combat lev-els in Iraq in 2005. Combat force levels there were already 3 percent lower than Nunn’s worst-case proportion, and lower than they have ever been since 1917. The range of combat elements in the modern era (i.e., since 1941) has been, therefore, between a high of 39 percent, or 1 to 1.6, and a low of 25 percent or 1 to 3.3
Noncombat ElementsIn terms of range, noncombat elements have been, obviously, the in-
verse of the combat elements (Figure 46). Since 1941, they have ranged from a low of about 60 percent to a high of 75 percent of the total force. The proportion of noncombat elements since 1917 has progressively increased from under 50 percent to over 70 percent in DESERT STORM. In Iraq in 2005, military logistical forces declined by 10 percent from 1991, but the extensive use of civilian contractors in support roles formerly manned by soldiers accounts primarily for this decline. By including contractors and support elements in Kuwait in the totals, noncombat elements rose to 75 percent, levels exceeding those of pre-Nunn Amendment Germany. Each noncombat element is examined separately in the following sections.
Figure 46. Noncombat Trends, 1917-2005.
Perc
ent
40
45
50
55
60
65
70
75
80
Wor
ldW
arI
Wor
ldW
arII
Kor
ea
Viet
nam
Col
dW
ar19
74
KTO
1991
Iraq
2005
Iraq
2005
(mod
)
Perc
ent
40
45
50
55
60
65
70
75
80
Wor
ldW
arI
Wor
ldW
arII
Kor
ea
Viet
nam
Col
dW
ar19
74
KTO
1991
Iraq
2005
Iraq
2005
(mod
)

68
Trends in LogisticsLogistical and life support elements together rose from under 40 per-
cent to about 45 percent of the total force after World War I, with the de-velopment of mass Army mechanization and motorization. Together, these two elements hovered in the range between 45 and 47 percent. This is be-tween one-third and one-half of the force, for the rest of the period studied (Figure 47). Fluctuations in the size of logistical elements undoubtedly refl ects factors such as host nation support in Germany and in Iraq in 2005, where civilian contractors assumed responsibility for many logistical (and life support) functions. To approximately account for these factors, it seems that the higher range (40-45 percent) of the historical size of logistical ele-ments, including life support, which will be discussed separately below, is a good guideline for a minimum proportional fi gure. In support of this, one postwar study presented a fi gure of 44 percent as the appropriate level of logistical support for a division from all theater assets.4
Figure 47. Logistical Trends, 1917-2005.
20
25
30
35
40
45
50
55
60
Wor
ldW
arI
Wor
ldW
arII
Kor
ea
Viet
nam
Col
dW
ar19
74
KTO
1991
Iraq
2005
Iraq
2005
(mod
)
Extensive Useof Civilian
Contractors
LOGISTICAL &
LIFE SUPPORT
ExtensiveUse of Host
NationSupport
LOGISTICAL &
LIFE SUPPORT
CivilianContractorsincluded in
total
20
25
30
35
40
45
50
55
60
Wor
ldW
arI
Wor
ldW
arII
Kor
ea
Viet
nam
Col
dW
ar19
74
KTO
1991
Iraq
2005
Iraq
2005
(mod
)
Extensive Useof Civilian
Contractors
LOGISTICAL &
LIFE SUPPORT
ExtensiveUse of Host
NationSupport
LOGISTICAL &
LIFE SUPPORT
CivilianContractorsincluded in
total

69
Trends in logistical strength do not seem to have kept up with the growth of logistical support requirements. These requirements increased markedly during the course of the 20th century and on into the 21st, due largely to advancements in weapons technology. Weapons became pro-gressively larger, more complex and more mobile, theoretically requiring a larger number of logistical troops to support them. The M1 tank, for instance, required three times the fuel of its predecessor, the M60. And between 1970 and 1991, the necessary minimum stockage level for equip-ment repair and spare parts increased by 20 percent (or one-fi fth larger). However, logistical elements only rose about 5 percent proportionally dur-ing this period.5
Logistical elements were surprisingly one area where the Army often chose to economize, particularly in the 1970s and in later force design ini-tiatives. This led some logisticians to fear that logistical elements had been proportionally reduced to a dangerous level. However, trends in Iraq, with the extensive use of host nation support and civilian contractors, seem to have mitigated these fears as the logistical proportion of the force rose to levels not seen since World War II.6
Since motorization in 1941, logistical elements (including life sup-port) ranged between 36 and 57 percent of the total force or between about half to three-fourths of all noncombat elements. The variation seems de-pendent on the availability of host nation support and civilian contractors. The higher fi gure of 57 percent does, in fact, include civilian contractors. Overall, including contractors, logistical elements have seen a steady in-crease, particularly since 1974.
The Rise of HeadquartersThe proliferation of headquarters is a long-recognized feature of mod-
ern armies. Such headquarters have not just expanded to command and control combat elements, but have also risen to manage noncombat ele-ments. A good example of this was the creation of the materiel manage-ment center in ROAD divisions in the 1970s, an agency responsible for managing the assets and functions of divisional and nondivisional logisti-cal units. In this work, the headquarters elements of all units, battalion and above, have been taken into account, no matter what type of overall primary mission the unit had. In the early 1970s, Congress was the fi rst to defi ne headquarters elements, even those controlling combat unit opera-tions, as rightfully belonging to the tail rather than the tooth in the T3R. Congress, however, unlike this work, did not include headquarters ele-ments at battalion level as part of this equation.

70
Headquarters elements rose from a level below 10 percent in World War I to a height of almost 40 percent in the 1974 Cold War period in Ger-many. Since 1974, via various organizational restructurings, the propor-tion of headquarters elements has progressively declined to a level of 18 percent in Iraq in 2005 (Figure 48). Since motorization in 1941, the range of proportional size of headquarters varied between 16 and 38 percent. Surprisingly, considering the apparent proliferation of headquarters in or-ganizational changes since 1974, there may have been more headquarters (such as aviation and engineer brigade headquarters in AOE divisions), but these headquarters were overall smaller in size than when there were fewer, but larger headquarters in Korea, Vietnam and pre-1976 Cold War Germany.
Life Support FunctionsThe last noncombat category is life support. Expeditionary operations,
particularly extended expeditionary operations, require a certain proportion of the deployed force be employed in infrastructure and other support missions, which, while not directly supporting combat operations, provide MWR and base camp support of various types. In a theater where troops
Figure 48. Headquarters Trends, 1917-2005.
Perc
ent
0
10
20
30
40
50
Wor
ldW
arI
Wor
ldW
arII
Kor
ea
Viet
nam
Col
dW
ar19
74
KTO
1991
Iraq
2005
Iraq
2005
(mod
)
Perc
ent
0
10
20
30
40
50
Wor
ldW
arI
Wor
ldW
arII
Kor
ea
Viet
nam
Col
dW
ar19
74
KTO
1991
Iraq
2005
Iraq
2005
(mod
)

71
or units are rotated on a regular schedule, life support provides continuity between the rotations by providing preexisting camps and services (Figure 49).
Although generally removed from direct combat, life support func-tions can have an indirect effect on the combat element of a force, as well. For example, in the Iraqi deployment in 2005 two combat brigades were virtually permanently devoted to guarding major installations and their life support activities. In recent deployments, civilian contractors have played an increased role in life support functions. Since traditionally such person-nel are not soldiers, they need someone to protect them whenever they are doing their functions. This study considers such contractors, except those conducting logistical missions, to be part of the life support element.
Units performing primary missions of life support are often diffi cult to determine from looking at orders of battle or other documentary materi-als. Accordingly, as highlighted in the logistical elements section of this chapter, life support functions have often been consolidated with logisti-cal ones. In several case studies, (Korea, Vietnam, Iraq), examination has
Figure 49. Life Support Trends, 1917-2005.
Perc
ent
0
2
4
6
8
10
12
14
16W
orld
War
I
Wor
ldW
arII
Kor
ea
Viet
nam
Col
dW
ar19
74
KTO
1991
Iraq
2005
Iraq
2005
(mod
)
Perc
ent
0
2
4
6
8
10
12
14
16W
orld
War
I
Wor
ldW
arII
Kor
ea
Viet
nam
Col
dW
ar19
74
KTO
1991
Iraq
2005
Iraq
2005
(mod
)

72
discerned separate elements with primarily life support missions. In these cases, life support functions varied between 6 percent and 14 percent (Fig-ure 47).
The Functional T3R within Operational UnitsThe previous discussion of operational units (divisions, brigades) in
this chapter stressed their relationship to the Army as a whole. However, the internal composition of these organizations also contained both com-bat and noncombat elements. The preceding chapter discussed this internal functional T3R in each presented historical example. Figure 50 summa-rizes the proportional fi gures from these case studies. Average percentages for the post-1918 era were 54 percent for combat elements, 22 percent for logistical components and 24 percent for the headquarters portion.
The post-1918 functional T3R average for combat elements of 54 per-cent, or slightly more than half of the soldiers in divisions and brigades, were 21.5 percent higher than similar fi gures throughout the force or the-ater. In the latter cases, combat forces were about a third of the force. At the same time, Army or theater-wide, noncombat elements formed, on an
Figure 50. Operational Unit Functional T3R, 1917-2005.
Perc
ent
0
10
20
30
40
50
60
70
80
AEF
Div
isio
n19
18
InfD
iv19
45
Arm
Div
1945
InfD
iv19
53
LtIn
fDiv
1968
Arm
Div
1974
Arm
Div
1986
Stry
kerB
de20
04
Mod
ular
CA
Bde
2007
COMBATLOGISTICALHEADQUARTERS
AVERAGES SINCE 194554 COMBAT22 LOGISTICAL24 HEADQUARTERS
Perc
ent
0
10
20
30
40
50
60
70
80
AEF
Div
isio
n19
18
InfD
iv19
45
Arm
Div
1945
InfD
iv19
53
LtIn
fDiv
1968
Arm
Div
1974
Arm
Div
1986
Stry
kerB
de20
04
Mod
ular
CA
Bde
2007
COMBATLOGISTICALHEADQUARTERS
COMBATLOGISTICALHEADQUARTERS
AVERAGES SINCE 194554 COMBAT22 LOGISTICAL24 HEADQUARTERS
AVERAGES SINCE 194554 COMBAT22 LOGISTICAL24 HEADQUARTERS

73
average, about two-thirds of the whole force. In the division/brigades, they formed less than half. Among the noncombat elements, headquarters ele-ments were approximately the same size in operational units as overall (24 versus 27 percent). But the average strength of the logistics elements was more than 20 percent lower (22 versus 47.5 percent combined life support and logistical proportion). Combat elements had been, therefore, increased primarily at the expense of logistical elements in division/brigades.
SummarySince 1917, the US Army’s functional tooth-to-tail ratio has
progressively risen in favor of noncombat elements until 1974. The Congressionally mandated T3R of that year temporarily slowed this trend. However, by 2005, noncombat elements had risen proportionally to three-fourths of the force size, primarily because of the mass employment of civilian contractors in Iraq in the new millennium. Each of the categories (combat, logistical, headquarters and life support) has shown an overall range of values since 1941 as indicated in Table 9.
Column c is the average fi gure of the high and low values. Column d adjusts these fi gures to a sum of 100 percent, using the average combat fi gure as an unchanging baseline (see note 7). The fi gures in column d provide a snapshot of what the noncombat factors would be based on his-torical average when the combat element is at its historical average. This is useful because it provides the mean percentage or mean functional T3R found in the US Army from 1945 to the present.
This work has provided a quick look at the tooth-to-tail ratio since 1917. The biggest shift in the functional T3R ratio was between World War I and World War II. Refl ecting the effects of mass motorization and
Table 9. Range of Functional T3R Percentages by Category7
910614Life Support
24.5271638Headquarters
3437.53243Logistical8
67.574.5(60)(76)TotalNoncombat
32.532.52539Combat
d.AdjustedAverage
c.Average
b.LowestPercent
a.HighestPercent
910614Life Support
24.5271638Headquarters
3437.53243Logistical8
67.574.5(60)(76)TotalNoncombat
32.532.52539Combat
d.AdjustedAverage
c.Average
b.LowestPercent
a.HighestPercent

74
mechanization, the percentage of combat forces fell from 53 percent to 39 percent. While a drop of 14 percent is not as great as the post-World War I range (15 percent—see Table 9) of combat values, never do combat fi gures rise higher than 40 percent again. This provides a range or band of combat and noncombat values. Using average fi gures, combat forces have been about a quarter of the force, while logistics elements were roughly a third of the force or half of the noncombat elements. On an average, head-quarters elements composed a quarter of the force (or slightly more than a third of all combat elements). Units or contractors providing life support functions formed less than 10 percent of the total force and slightly more than a tenth of all noncombat elements.
While combat elements averaged 32.5 percent and ranged between 40 and 25 percent since 1941, recent trends in combat forces are weighted toward the lower end of the range, rather than the higher end or even the average. When civilian contractors are included, combat elements, with the exception of a Congressionally mandated increase in the mid-1970s, have progressively declined since 1945. This, and other issues, are discussed in the next chapter.

75
Notes
1. The data used to make this graphic is found in Table B-3.2. The column marked, “Iraq 2005 (mod),” on this and subsequent charts
refer to the Iraqi deployment in January 2005, including contractors and troops in Kuwait.
3. In this calculation, the 40 percent figure for Iraq excluding contractors and the Kuwait base is not used as the high figure because when modified, with these additions, it is reduced to 25 percent. Similarly, the 42 percent for Korea in 1953 without the Japan base is also not used because it too, upon modification is reduced, in this case, to 33 percent.
4. LTC Harry Page and LTC Lawrence Fuller, “Use of ‘Operational Slice’ Factors,” Military Review 28 (January 1949), 42.
5. Vann, 10-11.6. Ibid.7. The noncombat figures in this column are adjusted proportionally in or-
der to attain a total percentage of 100. Unadjusted, the percentage is 107 percent. In order to attain 100 percent, the average combat figure of 32.5 is retained as a baseline. The noncombat elements, accordingly, need to be reduced together from their sum of 74.5 to 67.5 percent. This adjustment factor is 0.906402 (67.5/74.5). In other words, the noncombat factors in column c are multiplied by this factor to produce the figures in column d, which represent 91 percent of the averages in column c.
8. Life support elements are not included in this figure as they were in the sectional discussion.


77
Chapter 4
ConclusionsGeneral Conclusions
As highlighted in the last chapter, combat elements have progressively declined as a proportion of the total force since 1945. This trend is dis-cussed in detail in the next section of this chapter. Apart from the decline of combat forces, there are several other general conclusions that can be drawn based on the historical study of the tooth-to-tail ratio.
The Impact of Mass Motorization Caused the Largest Shift in T3R
While in general terms, the creation of the AEF marked the creation of the modern US Army, particularly in organizational terms, as far as the functional T3R. The level of noncombat elements was far lower (47 percent) than it has ever been since then. While logistical troops formed over a third of the force (39 percent), headquarters were tiny (9 percent), far smaller than the modern (post-1941) range of 16-38 percent. When the Army expanded and reorganized to fi ght World War II in 1940-41, the Army Ground Forces introduced motorization and mechanization across the board. Ironically, this transformation affected logistics the least. Lo-gistical/life support elements rose only 6 percent (39 to 45) to 1945 and an average increase of 8.5 percent (47.5) in the period since 1941. At the same time, headquarters doubled in size, proportionally, between 1918 and 1945 (8 to 16 percent) and continued to rise after World War II, with an average increase of 19 percent (37.5).
The T3R in Vietnam Was Not AbnormalThe paucity of combat elements in Vietnam has been cited publicly so
often, and usually without attribution, that to many military observers, the low proportion of combat troops in that confl ict has become axiomatic. However, an analysis of the US Army order of battle in South Vietnam after the Tet Offensive in 1968 reveals that combat troops actually formed a third (33 percent) of the force deployed in country. This total was actu-ally slightly higher than the combat troop average (32.5 percent) since 1945. While life support elements were slightly higher than the post-1941 average (13 versus 10 percent), the logistical component was actually 7.5 percent lower than that average (30 versus 37.5). In terms of the functional tooth-to-tail ratio, Vietnam was well within the range of postwar propor-tions. The ratio of combat versus noncombat elements was 1 to 2.

78
Headquarters Expansion Was Not as High as Could Be Expected from Observing US Army Reorganizations since 1941
Almost every US Army reorganization since the beginning of World War II has entailed the expansion of headquarters elements. General Les-ley McNair’s pooling created a number of separate battalions, each with headquarters elements roughly equivalent to the size and role of regimen-tal headquarters prior to 1941. McNair also created numerous group head-quarters to control separate battalions. Later reorganizations added logisti-cal, aviation, engineer and artillery headquarters, both to the division and nondivisional forces. This expansion reached a height of 38 percent in the Army in Cold War Germany in 1974. But the major lasting effect of the Nunn Amendment was, perhaps at least in spirit, a trend in headquarters reduction. After 1974, headquarters proportional size progressively de-clined, fi rst to 28 percent in the 1991 Gulf War, then to 18 percent in Iraq in 2005. The latter fi gure was only 2 percent higher than that of the 1945 Army (18 versus 16 percent).
Life Support Elements Are Hard to DifferentiateIn all modern expeditionary operations, the presence of life support el-
ements is apparent in the infrastructure of camps and their intrinsic support elements. However, interpreting which units are primarily conducting life support operations, as opposed to logistical support operations, is diffi cult to discern from orders of battle. Accordingly, in this work, these two ele-ments often had to be merged. In the 2005 Iraq deployment, a large num-ber (28,000) of civilian contractors performed life support operations.
The Logistical Component Continues to RiseWhile this point may seem obvious, in the 1980s, some senior offi cers
commented on fears that the Army or the Department of Defense had re-duced logistics elements to dangerously low levels.1 These fears proved unfounded. While logistical/life support elements did decline to a low of 35 percent in Germany in 1974, deployments in Saudi Arabia in 1991 (42 percent) and in Iraq and Kuwait (57 percent), where large numbers of troops were dispatched to areas without previous US-style infrastructure, the logistical/life support elements rose to their highest levels ever. Since 1991, there has been a great expansion in the use of civilian contractors, most of whom are employed in logistical or life support functions.
Divisions and Brigades Contain a Higher Combat Functional T3R than the Army as a Whole
As shown in Figure 50 (page 72), the functional T3R for Army divi-sions (1945-2005) and brigades (2004-07) averages 54 percent in combat
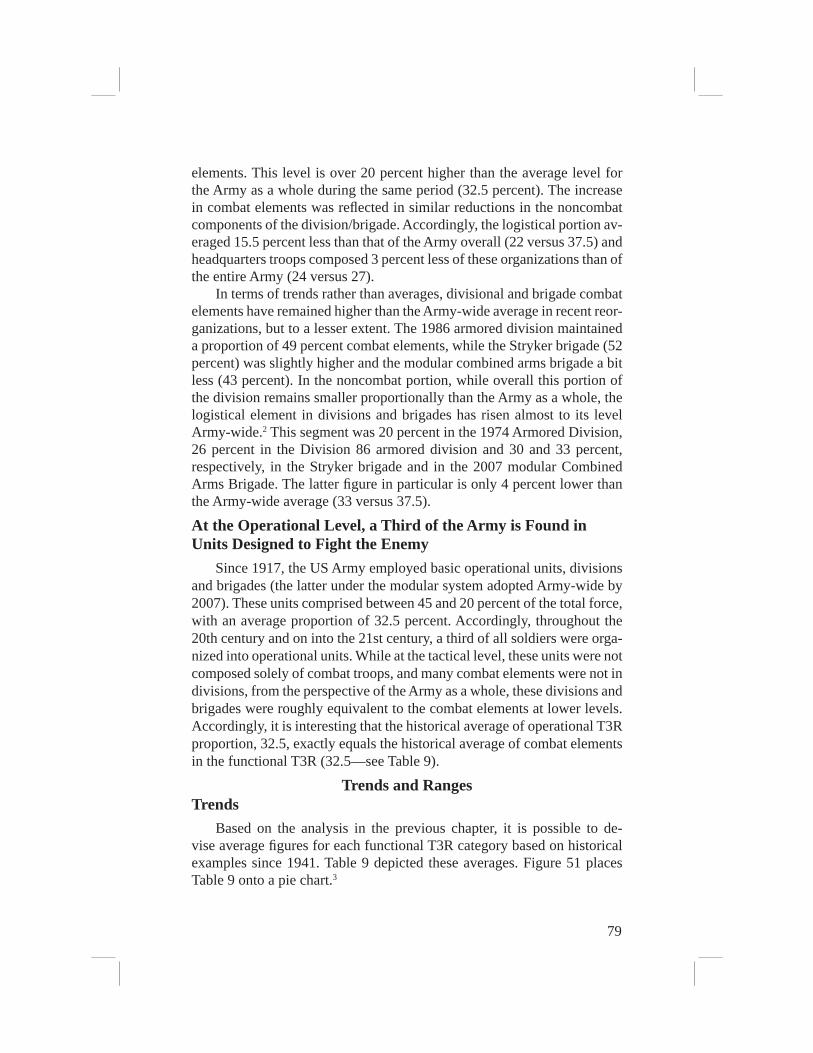
79
elements. This level is over 20 percent higher than the average level for the Army as a whole during the same period (32.5 percent). The increase in combat elements was refl ected in similar reductions in the noncombat components of the division/brigade. Accordingly, the logistical portion av-eraged 15.5 percent less than that of the Army overall (22 versus 37.5) and headquarters troops composed 3 percent less of these organizations than of the entire Army (24 versus 27).
In terms of trends rather than averages, divisional and brigade combat elements have remained higher than the Army-wide average in recent reor-ganizations, but to a lesser extent. The 1986 armored division maintained a proportion of 49 percent combat elements, while the Stryker brigade (52 percent) was slightly higher and the modular combined arms brigade a bit less (43 percent). In the noncombat portion, while overall this portion of the division remains smaller proportionally than the Army as a whole, the logistical element in divisions and brigades has risen almost to its level Army-wide.2 This segment was 20 percent in the 1974 Armored Division, 26 percent in the Division 86 armored division and 30 and 33 percent, respectively, in the Stryker brigade and in the 2007 modular Combined Arms Brigade. The latter fi gure in particular is only 4 percent lower than the Army-wide average (33 versus 37.5).
At the Operational Level, a Third of the Army is Found in Units Designed to Fight the Enemy
Since 1917, the US Army employed basic operational units, divisions and brigades (the latter under the modular system adopted Army-wide by 2007). These units comprised between 45 and 20 percent of the total force, with an average proportion of 32.5 percent. Accordingly, throughout the 20th century and on into the 21st century, a third of all soldiers were orga-nized into operational units. While at the tactical level, these units were not composed solely of combat troops, and many combat elements were not in divisions, from the perspective of the Army as a whole, these divisions and brigades were roughly equivalent to the combat elements at lower levels. Accordingly, it is interesting that the historical average of operational T3R proportion, 32.5, exactly equals the historical average of combat elements in the functional T3R (32.5—see Table 9).
Trends and RangesTrends
Based on the analysis in the previous chapter, it is possible to de-vise average fi gures for each functional T3R category based on historical examples since 1941. Table 9 depicted these averages. Figure 51 places Table 9 onto a pie chart.3
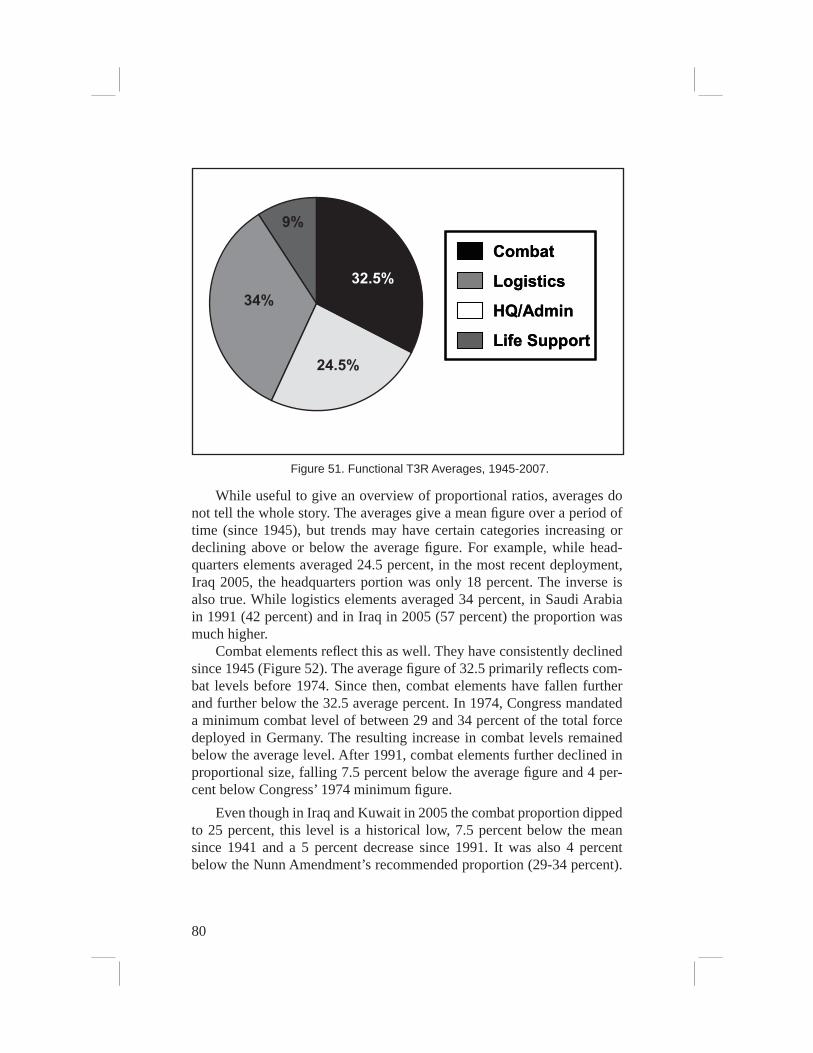
80
While useful to give an overview of proportional ratios, averages do not tell the whole story. The averages give a mean fi gure over a period of time (since 1945), but trends may have certain categories increasing or declining above or below the average fi gure. For example, while head-quarters elements averaged 24.5 percent, in the most recent deployment, Iraq 2005, the headquarters portion was only 18 percent. The inverse is also true. While logistics elements averaged 34 percent, in Saudi Arabia in 1991 (42 percent) and in Iraq in 2005 (57 percent) the proportion was much higher.
Combat elements refl ect this as well. They have consistently declined since 1945 (Figure 52). The average fi gure of 32.5 primarily refl ects com-bat levels before 1974. Since then, combat elements have fallen further and further below the 32.5 average percent. In 1974, Congress mandated a minimum combat level of between 29 and 34 percent of the total force deployed in Germany. The resulting increase in combat levels remained below the average level. After 1991, combat elements further declined in proportional size, falling 7.5 percent below the average fi gure and 4 per-cent below Congress’ 1974 minimum fi gure.
Even though in Iraq and Kuwait in 2005 the combat proportion dipped to 25 percent, this level is a historical low, 7.5 percent below the mean since 1941 and a 5 percent decrease since 1991. It was also 4 percent below the Nunn Amendment’s recommended proportion (29-34 percent).
Figure 51. Functional T3R Averages, 1945-2007.
34%32.5%
24.5%
Combat
Logistics
HQ/Admin
Life Support
Combat
Logistics
HQ/Admin
Life Support
9%
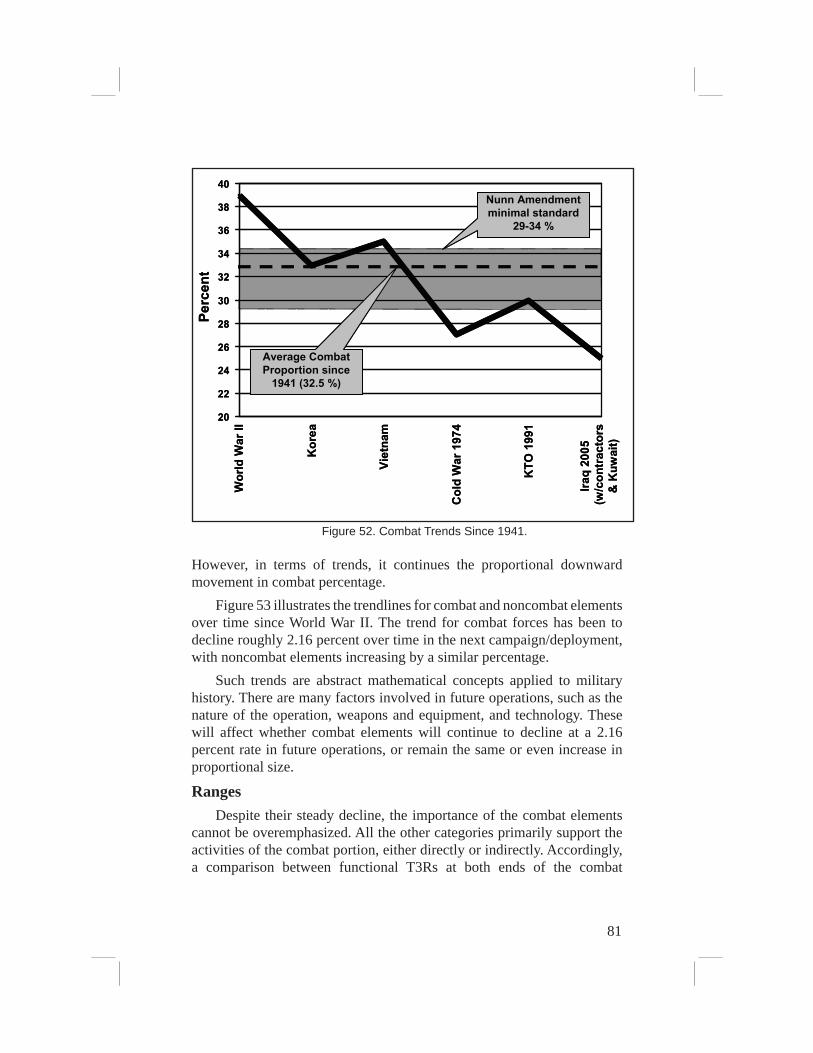
81
However, in terms of trends, it continues the proportional downward movement in combat percentage.
Figure 53 illustrates the trendlines for combat and noncombat elements over time since World War II. The trend for combat forces has been to decline roughly 2.16 percent over time in the next campaign/deployment, with noncombat elements increasing by a similar percentage.
Such trends are abstract mathematical concepts applied to military history. There are many factors involved in future operations, such as the nature of the operation, weapons and equipment, and technology. These will affect whether combat elements will continue to decline at a 2.16 percent rate in future operations, or remain the same or even increase in proportional size.
Ranges Despite their steady decline, the importance of the combat elements
cannot be overemphasized. All the other categories primarily support the activities of the combat portion, either directly or indirectly. Accordingly, a comparison between functional T3Rs at both ends of the combat
Figure 52. Combat Trends Since 1941.
Perc
ent
20
22
24
26
28
30
32
34
36
38
40
Wor
ldW
arII
Kor
ea
Viet
nam
Col
dW
ar19
74
KTO
1991
Iraq
2005
(w/c
ontr
acto
rs&
Kuw
ait)
Nunn Amendmentminimal standard
29-34 %
Average CombatProportion since
1941 (32.5 %)
Perc
ent
20
22
24
26
28
30
32
34
36
38
40
Wor
ldW
arII
Kor
ea
Viet
nam
Col
dW
ar19
74
KTO
1991
Iraq
2005
(w/c
ontr
acto
rs&
Kuw
ait)
Nunn Amendmentminimal standard
29-34 %
Average CombatProportion since
1941 (32.5 %)

82
proportional range provides insight into the size of the noncombat elements and their fractional relationship to the combat portion. Figure 54 illustrates the proportions using the minimum (Iraq 2005) and maximum (ETO 1945) combat fi gures in the motorization era to illustrate the extreme ends of the combat spectrum as illustrated in the examples used in this work. In the maximum value, logistical and life support elements are combined based on the availability of data from the ETO deployment.
Figure 53. Functional T3R Trendlines.
Wor
ldW
arII
Kor
ea
Viet
nam
Col
dW
ar19
74
KTO
1991
Iraq
2005
(w/c
ontr
acto
rs&
Kuw
ait)
Perc
ent
20
22
24
26
28
30
32
34
36
38
40
Wor
ldW
arII
Kor
ea
Viet
nam
Col
dW
ar19
74
KTO
1991
Iraq
2005
(w/c
ontr
acto
rs&
Kuw
ait)
Perc
ent
20
22
24
26
28
30
32
34
36
38
40
Perc
ent
TOTAL NON-COMBAT
LOGISTICAL &
LIFE SUPPORT
HEADQUARTERS
20
30
40
50
60
70
80
Wor
ldW
arII
Kor
ea
Viet
nam
Col
dW
ar19
74
KTO
1991
Iraq
2005
(w/c
ontr
acto
rs&
Kuw
ait)
Perc
ent
TOTAL NON-COMBAT
LOGISTICAL &
LIFE SUPPORT
HEADQUARTERS
20
30
40
50
60
70
80
Wor
ldW
arII
Kor
ea
Viet
nam
Col
dW
ar19
74
KTO
1991
Iraq
2005
(w/c
ontr
acto
rs&
Kuw
ait)

83
In these examples, the variations between the minimum and maximum values give the ranges for each category (Table 10). While both combat and logistical/life support ranges varied by more than 10 percent, headquarters values remained within a range of 2 percent in both the minimum and maximum examples. This would tend to indicate that within the functional T3R framework, headquarters elements can be expected to form about 17 percent of the force under most conditions, despite a general trend to increase by 3.3 percent.
Figure 54. Maximum and Minimum Functional T3R Levels.
18%25%
43%
Combat
Logistics
HQ/Admin
Life Support
Combat
Logistics
HQ/Admin
Life Support
13%
16%39%
45%
MINIMUMCOMBAT
MAXIMUMCOMBAT
IRAQ 2005 ETO 1945
Logistical &Life SupportCombined
56%
Table 10. Range of Functional T3R Percentages Based on Minimum and Maximum Combat Percentages
21816Headquarters
115645Logistical &Life Support
147561TotalNoncombat
142539Combat
c.Range
VariationTrend
b.MinimumCombat
a.MaximumCombat
21816Headquarters
115645Logistical &Life Support
147561TotalNoncombat
142539Combat
c.Range
VariationTrend
b.MinimumCombat
a.MaximumCombat

84
Troop Density and the Tooth-to-Tail RatioAs mentioned, this study is a companion volume to a previous work,
Boots on the Ground, which looked at the number of troops (or troop den-sity) required to successfully conduct contingency operations. While that study estimated a proportion of 13.26 troops per 1,000 of civilian popula-tion, it did not detail the composition of the 13.26. In general terms, this work fi lls that void. Although Boots only addressed contingency opera-tions and this work looks at major deployments of all types, military forces employed in contingency operations are always general purpose forces rather than specialized troops. The forces studied in this volume were also general purpose troops. Accordingly, T3R ranges and trends developed from the study of such operations may also be applicable to contingency operations. Figure 55 places the minimum and maximum percent pie charts from Figure 54 into the numerical context of the 13.26 troop level.4
Boots on the Ground postulated, based on the force levels of con-temporary urban police departments, that in a contingency operation, a minimum of 4.1 soldiers per thousand of population were recommended to be devoted to the conduct of police-type (i.e., combat) operations.6 The
Figure 55. T3R and Troop Density.5
Combat
Logistics
HQ/Admin
Life Support
Combat
Logistics
HQ/Admin
Life SupportPOLICE
AND OTHERDUTIES9.16%
MINIMUMCOMBAT
MAXIMUMCOMBAT
13.26 BYCATEGORY
13.26 PERTHOUSAND 5.17
2.12
5.97
4.102.12
5.51 1.53
Logistical &Life SupportCombined
7.04
TROOP DENSITY
T3R
POLICETYPE
DUTIES4.1

85
4.1 fi gure is part of the overall ratio of 13.26 per thousand of population. While the combat number in the maximum example exceeds this fi gure (5.17), the proportional total in the minimum sample (13.26 x 25% or 3.3) was below the fi gure by 0.74. In Figure 55, the combat fi gure was raised to the minimum of 4.1 and the noncombat categories were accordingly decreased by the same amount (see note 4).
The fact that the unadjusted combat proportion fi gure in the minimum combat sample (3.3) was below the minimum prescribed in Boots on the Ground (4.1) is interesting because the minimum combat sample represents the deployment in Iraq in January 2005. Accordingly, the number of combat troops in that operation was 0.74 less soldiers/police per thousand of population. This seemingly slight difference actually represents overall 5.5 percent of the suggested fi gure of 13.26 total troops per thousand of population. Pending the outcome of operations in Iraq, future planners need to look at and analyze the signifi cance of this minor variance in troop composition.
Summary This work examined the major US Army overseas deployments since
World War I and analyzed them in terms of the tooth-to-tail ratio—the pro-portion of combat troops to noncombat troops—at two levels: the opera-tional T3R (proportion of divisions and brigades in the whole Army) and at the tactical level, the functional T3R, which divided Army units into cat-egories by function and determined the proportions. Interestingly enough, the average historical proportion of combat forces for both the operation-al and functional T3Rs were the same: 32.5 percent of the total force.
With regard to the functional T3R, since the advent of motorization at the start of World War II, the T3R has only varied 14 percent in terms of proportional change between combat and noncombat elements. However, in this 14 percent, trends show a steady general decline in combat forces of about 2 percent per operation during the period studied. While the 1974 Nunn Amendment temporarily prescribed a minimum proportional combat level of 29 percent, recent trends in combat size have been as low as 25 per-cent. While headquarters elements expanded throughout the period, they showed a variance of only 2 percent between the minimum and maximum historical examples, showing, perhaps, a trend of leveling off in this area.
Applying T3R proportions to troop density proportional size calcula-tions presented in Boots on the Ground reveal that combat element levels in Iraq in 2005 may have been slightly (5 percent) below the recommend-ed level if troops in the Kuwait base and civilian contractors are included in the overall fi gure.
86
As one would expect, the T3R combat proportion declined over time at a relatively steady rate. This trend measures roughly a 2.16 percent de-cline per each subsequent campaign. There are many possible reasons for this decline. Perhaps the nature of warfare and technology has changed to the extent that lesser combat troops are needed. The large-scale introduc-tion of civilian contractors into expeditionary warfare in the recent Iraq deployment is the most signifi cant of such changes. Increased technol-ogy, primarily in the form of digital communications, provides, possibly, higher levels of command and control and situational awareness, allowing for decreased combat forces. Perhaps different types of operations require lower levels of combat troops or more specialized forces. However, as the percentage of combat troops deployed declines, it raises the question of whether such a deployment is, in fact, a military deployment at all, or some other type of operation not requiring military forces, or at least not the general purpose forces traditionally used in most overseas deploy-ments.
Whatever the reason for the trend of declining combat elements, future force designers need to be aware that combat troops have formed a range between a quarter and slightly over a third of all general purpose forces deployed by the United States since World War II. They also need to be aware that, within this range, the historical trend is that the most recent deployments have had the smallest proportions of combat elements and the oldest deployments the highest levels. While the trend shows an overall decline in the combat portion, force planners need to realize that any force levels following the 2.16 percent trend of decline would also be producing an unprecedented low level of proportional combat elements. At some point, there will be a level of diminishing returns where general purpose forces deployed overseas will have too few combat troops to successfully complete military missions.
Perhaps the lowest threshold for combat force proportion has been reached or is close to being reached. With only a quarter of its force de-voted to combat activities, the deployment in Iraq has lasted over 5 years. And even this size estimate may be an overestimate. The employment of contractors and other elements less able to defend themselves tends to result in combat elements protecting these elements. For example, in Iraq in 2005, two combat brigades were devoted specifi cally to theater defense roles. These brigades primarily defended large logistics bases and pro-vided security for convoys between the large bases.
In 1974, Congress passed the Nunn Amendment, specifi cally prescrib-ing a tooth-to-tail ratio for US forces in Germany. The legislators felt that
87
combat levels of less than 29 percent provided too small a proportion of combat troops. While combat elements have decreased over time at a steady rate, the Nunn standard has only been violated in the Iraqi deployment (25 percent). The nature of warfare or the unique circumstances involving that particular deployment may call for a reduced employment of combat ele-ments. On the other hand, this line has only been crossed once, making the Iraq 2005 level a unique occurrence. Whether this is a true continuation of trends since 1945 or a special situation is a debatable point. A thorough study of the Iraq deployment is necessary to determine whether the com-bat troop level is adequate or a case of diminishing returns.
In almost every previous expeditionary operation, the United States has employed general purpose forces. These are forces designed to con-duct military operations across the spectrum of intensity and against vari-ous threats. Planners need to consider this in the development of the pro-portional level of combat elements in such a force. While the force may be tailored for nation building, peacekeeping and counterinsurgency, a gen-eral purpose force is still primarily a fi ghting element. Otherwise, soldiers would not be given this mission in the fi rst place.
This work provides a brief quantitative look at the tooth-to-tail ratio in US forces in major deployments and operations since 1917. As such, it illustrates trends, ranges and averages based on force levels of the past. While expeditionary warfare is often changing and situationally depen-dent, as force designers plan for the future, the past illustrates T3R rang-es and trends previously considered to be effective. Deviations from the historical record should only be made with caution based on compelling reasons.

88
Notes
1. For examples of these comments, see Vann, 2-3.2. While the AOE armored division contained 51 percent of noncombat
elements, the ratio Army-wide in 1991 was 70 percent. In Iraq in 2005, while the noncombat proportion was 75 percent, AOE divisions (51 percent) and Stryker Brigades (48 percent) were still considerably smaller proportionally.
3. This fi gure displays the average combat fi gure and the noncombat fi g-ures reduced by a factor of 0.9, adjusted to fi t a 32.3 combat percentage.
4. John J. McGrath, Boots on the Ground: Troop Density in Contingency Operations, Global War on Terrorism Occasional Paper 16 (Fort Leavenworth: US Army Combat Studies Institute, 2006), 109.
5. The minimum T3R fi gures on this chart require some explanation. The original proportion combat fi gure was 3.36 (25 percent of 13.26). However, in accordance with Boots on the Ground, a minimum of 4.1 troops out of the 13.26 need to be devoted to police/combat duties as a minimum (see McGrath, Boots on the Ground, 106).Therefore the 3.36 fi gure has been raised to 4.1, an increase of 0.74. Accordingly, the three noncombat categories have to be reduced by this 0.74 or 0.246 each. These adjustments are refl ected in the minimum pie chart. The table below shows these shifts:
Note: Fractions were rounded off. 6. McGrath, Boots on the Ground, 79,106. In the context of contingency
operations (peacekeeping, counterinsurgency, occupation duties), police-type du-ties are considered to be synonymous with combat functions. In fact, in this work, military police units operating in Iraq, in January 2005 were counted as combat elements.
1.53(b – c)
-0.251.7813.45Life Support
2.12(b – c)
-0.252.3717.89Headquarters
5.51(b – c)
-0.255.7543.34Logistical
4.10(b + c)
+0.743.3625.32Combat
d.Adjusted
Figure
c.Adjustment
Factor
b.Number
(13.26 x a/100)
a.PercentageCategory
1.53(b – c)
-0.251.7813.45Life Support
2.12(b – c)
-0.252.3717.89Headquarters
5.51(b – c)
-0.255.7543.34Logistical
4.10(b + c)
+0.743.3625.32Combat
d.Adjusted
Figure
c.Adjustment
Factor
b.Number
(13.26 x a/100)
a.PercentageCategory

89
Glossary
AAA antiaircraft artilleryAD Armored DivisionADA Air Defense ArtilleryAEF American Expeditionary ForceAGF Army Ground ForcesAOE Army of ExcellenceARVN Army of the Republic of VietnamBCT brigade combat teamBDE BrigadeBN BattalionBTB brigade troops battalionCA Combined ArmsCBT CombatCOMZ Communications ZoneCP command postCSB Corps Support BattalionCSG Corps Support GroupDFE Division Force EquivalentDISCOM Division Support CommandDIV DivisionEECP Early Entry Command PostETO European Theater of OperationsHHC Headquarters and Headquarters CompanyHQ headquartersID Infantry DivisionKTO Kuwaiti Theater of OperationsID Infantry DivisionKW Korean WarMCG Mobile Command GroupMECH mechanizedMI Military IntelligenceMLRS Multiple Rocket Launcher SystemMP Military PoliceMWR Morale, Welfare and RecreationNATO North Atlantic Treaty OrganizationNBC Nuclear, Biological, ChemicalROAD Reorganization Objective Army DivisionRSTA Reconnaissance, Surveillance, and Target AcquisitionSHAEF Supreme Command Allied Expeditionary ForceSOF Special Operations ForcesSWA Southwestern AsiaT3R Tooth-to-Tail RatioTAC Tactical Command Post

90
TC Transportation CorpsTD Tank DestroyerTOE Table of Organization and EquipmentTRADOC Training and Doctrine CommandUS United StatesXO executive officer
91
Bibliography
4th Infantry Division (Mechanized) Engineer Offi ce, “1ID Intro-Typical FOB in Iraq, PowerPoint briefi ng, 2004.
Abrams, Major Creighton A., Jr. “The Sixteen Division Force: Anatomy of a Decision.” MMAS thesis, US Army Command and General Staff College, 1975.
Anaconda Times. Weekly newspaper published at LSA Anaconda by the 13th Sustainment Command (Expeditionary).
Anderson, Charles R. The Grunts. San Rafael: Presidio, 1976.Anderson, Charles R. “Survival in the Rear.” Vietnam (August 1989), 18-25.Andidora, Ronald. “The Autumn of 1944: Boldness is Not Enough.” Parameters
(December 1987), 71-80.Appy, Christian G. Working-Class War: American Combat Soldiers and Vietnam.
Chapel Hill, NC: UNC, 1993.Balkind, Jonathan J. “Morale Deterioration in the United States Military during
the Vietnam Period.” PhD diss., UCLA, 1978.Beaumont, Roger A. “Beyond Teeth and Tail: The Need for New Logistical
Analogies.” Military Review, March 1985, 2-11.Burlas, Joe. “Force Stabilization Increases Readiness, Predictability.” Army News
Service, 9 February 2004 [article on-line] available at http://www4.army.mil/ocpa/read.php?story_id_key=5653; Internet; accessed on 10 April 2007.
Cardwell, Thomas A., III. Command Structure for Theater Warfare: The Quest for Unity of Command. Maxwell AFB, AL: Air University, 1984.
Carson, Julia M.H. Home Away From Home: The Story of the USO. NY: Harper, 1946.
Cha, Arians Eunjung. “Baghdad’s US Zone a Stand-In for Home,” Washington Post, 6 December 2005, A1.
Coakley, Robert W. and Richard M. Leighton. Global Logistics and Strategy 1943-1945. The War Department. The US Army in World War II. Washington, DC: Offi ce of the Chief of Military History, 1968.
Crowell, Benedict & Robert Wilson. The Road to France. 2 vols. New Haven: Yale University Press, 1921.
Dinackus, Thomas D. Order of Battle: Allied Ground Forces of Operation Desert Storm. Central Point, OR: Hellgate Press, 2000.
Dunn, LTG Carroll. Base Development in South Vietnam, 1965-1970. Vietnam Studies. Washington, DC: Department of the Army, 1972.
Dupuy, T.N. “Logistics Support and Combat Effectiveness: Historical Perspective.” History, Numbers & War (Fall 1978), 110-17.
Durham, Weldon B. “‘Big Brother’ and the ‘Seven Sisters’: Camp Life Reforms in World War I.” Military Affairs, April 1978, 57-60.
Ebert, James R. A Life in a Year: The American Infantryman in Vietnam, 1965-72. Novato, CA: Presidio, 1993.
Epley, William W. “Civilian Support of Field Armies.” Army Logistician (November/December 1990), 30-35.

92
Epstein, Robert M. “The Creation and Evolution of the Army Corps in the American Civil War,” The Journal of Military History 55 (January 1999) : 34.
Fontaine, BG Yves J. and MAJ Donald K. Wols. “Sustaining the Momentum: The 1st Corps Support Command in Iraq,” Army Logistician 38 (March-April 2006), 3-8
Fosdick, Raymond B. Report to the Secretary of War on the Activities of Welfare Organizations Serving with the AEF. Washington, DC: War Department, 1919.
Giebel, Doug. “Permanent Bases: Leave Iraq? Hell No, We Won’t Go!” Counterpunch, 6 January 2004.
Great Britain. Army of the Rhine. The Supply System of the German Army, 1939-45. No 4: The Organization and Functioning of WIFO (Wirtschaftliche Forschungsgesellschft m.b.H.). Report, 22 November 1945.
Greenfi eld, Kent R, Robert Palmer, and Bell I. Wiley. The Organization of Ground Combat Troops. United States Army in World War II: The Army Ground Forces. Washington, DC: Department of the Army, 1947.
Gropman, Alan, ed. The Big ‘L’: American Logistics in World War II. Washington, DC: NDU, 1997.
Hackworth, David. “Needed: More Warriors, not Military Toys,” Defending America, 26 July 1994 [article on-line] available at http://www.hackworth.com/26jul94.html; Internet; accessed on 20 March 2007.
Hagood, Johnson. The Services of Supply. Boston: Houghton Miffl in, 1927. D570.75H253.
Halladay, Laurel. “‘It Made Them Forget About the War for a Minute’: Canadian Army, Navy and Air Force Entertainment Units During the Second World War.” Canadian Military History (Autumn 2002), 20-35.
Hankee, William B. “Implications of the Peacetime Combat-to-Support Ratio on the U.S. War-Fighting Capability.” Military Review (June 1979), 60-70.
Harbord, James G. The Services of Supply from July 1918 to May 1919. Washington, DC: GPO, 1930.
Heberling, Lynn O. “Soldiers in Greasepaint: USO-Camp Shows, Inc., during WWII.” PhD diss., Kent State, 1989.
Henry, Frank S. “British and U.S. Staffs--A Comparison.” Military Review (April 1944), 34-37.
Herbert, Anthony B. and James T. Wooten, Soldier. New York: Holt, Rinehart & Winston, 1973.
Herbert, Major Paul. Deciding What Has to Be Done: General William E. DePuy and the 1976 Edition of FM 100-5, Operations, Leavenworth Paper Number 16. Fort Leavenworth: Combat Studies Institute, 1988.
Hogan, David W., Jr. “A Command Post at War: First Army Headquarters in Europe, 1943-1945.” Washington, DC: US Army Center of Military History, 2000.
“How DoD is Improving the Combat Proportions of U.S. Forces in Europe,” Commander’s Digest 18 (20 November 1975), 2-5.
93
Huston, James A. “Army Logistics: Lessons of Experience.” Military Review (September 1989), 76-88.
Huston, James A. Guns and Butter, Powder and Rice: U.S. Army Logistics in the Korean War. Selinsgrove, PA: Susquehanna University, 1989.
Huston, James A. The Sinews of War: Army Logistics, 1775-1953. Washington, DC: OCMH, 1966.
Hutchinson, Percy A. “At Home and Overseas-What the ‘Y’ Did.” Army Navy Register (8 Feb 1919) : 161-64.
Jones, Lee M. “Operation Market-Garden and Signifi cant Logistical Defi ciencies Contributing to Its Partial Failure.” Military History Anthology. Fort Leavenworth: Combat Studies Institute, CGSC, 1984, 139-56.
Jones, Norman H., Jr. “Support Capabilities for Limited War in Iran.” Study, RAND, Santa Monica, CA: December 1963.
Jore, Jeff. “Pershing’s Mission in Mexico: Logistics and Preparation for the War in Europe.” Military Affairs (July 1988), 117-21.
King, Benjamin, et. al. Spearhead of Logistics: A Historical of the U.S. Army Transportation Corps. Fort Eustis, VA: US Army Transportation Center, 1994.
Kral, Anthony H. “Sustaining Patton’s Pursuit.” Army Logistician (July/August 1992), 26-30.
Kreidberg, Marvin A. and Merton G. Henry. Historical of Military Mobilization in the United States Army, 1775-1945. Department of Army Pamphlet 20-212, 1955.
Leaver, Erik. “Building Permanent US Bases in Iraq Sends Wrong Signal.” Seattle Post-Intelligencer, 15 May 2005.
Leighton, Richard M. and Robert W. Coakley. The War Department: Global Logistics and Strategy. 2 vols. In USAWWII series. Washington, DC: OCMH, 1955-58.
Lierman, CPT Christopher. “Restructuring the Division Support Command.” Army Logistician (May-June 2003).
Logistics in World War II: Final Report of the Army Service Forces. Washington, DC: US Army Center of Military History, 1993.
Lyke, James P. “The Administrative Support Command.” Military Review (December 1960), 37-49.
Matloff, Maurice. “The 90-Division Gamble.” Command Decisions. Kent R. Greenfi eld, ed. ,Washington, DC: Offi ce of the Chief of Military History, US Army, 1960, 365-381.
Maxfi eld, Betty. “Army Profi le FY 05,” Washington, DC: Department of the Army, Army G1, 2005.
McGrath, John J. The Brigade: A History. Fort Leavenworth: Combat Studies Institute Press, 2004.
McGrath, John J. Boots on the Ground: Troop Density in Contingency Operations. Global War on Terrorism Occasional Paper Number 16. Fort Leavenworth: US Army Combat Studies Institute, 2006.

94
McGrath, John J. Crossing the Line of Departure: Battle Command on the Move: A Historical Perspective. Fort Leavenworth: Combat Studies Institute Press, 2006.
McGrath, John J. Theater Logistics and the Gulf War. Army Materiel Command, 1994.
Meese, Michael J. “Defense Decision Making under Budget Stringency: Explaining Downsizing in the United States Army.” PhD diss., Princeton University, 2000.
“Modular Division 87000G900: Modularity Note 36A, 16 March 2005.” Version Div 7.3.2 as of 10 March 2006. PowerPoint briefi ng, Task Force Modularity, US Army Training and Doctrine Command.
Nelms, Norman S. “Replacement System in Vietnam from Build-Up to Mid-1969.” Army War College Student Paper, 1970.
Ney, Virgil. “Evolution of a Theater of Operations Headquarters, 1941-1967.” Study for U.S. Army Combat Developments Command, CORG Memorandum 318, Fort Belvoir, VA: December 1967.
Ney, Virgil. “Evolution of the U.S. Army Division, 1939-1968.” Fort Belvoir, VA: U.S. Army Combat Developments Command, 1969.
Page, Harry R. and Lawrence J. Fuller. “Use of ‘Operational Slice’ Factors.” Military Review (January 1949), 40-44.
Palmer, Dave R. “Teeth and Tail in the British Army: Churchill and Wavell.” Army (April 1974), 38-44.
Palmer, Robert R. “Ground Forces in the War Army: A Statistical Table.” Army Ground Forces Study Number 3. Washington, DC: Army Ground Forces,1945.
Palmer, Robert R. “The Mobilization of the Ground Army.” Army Ground Forces Study Number 4. Washington, DC: Army Ground Forces, 1946.
Plank, George. “A Survey of the U.S. Army Entertainment Program in Europe during the Early 1980’s with a Study of Its Origins in American History.” MA Thesis, UCLA, 1988.
Privratsky, Kenneth L. “Mobility versus Sustainability.” Military Review (January 1987), 48-55.
Reinhardt, Hellmuth. Size and Composition of Divisional and Higher Staffs in the German Army. Foreign Military Studies Number P-139. Karlsruhe, GE: Historical Division, US Army Europe, 1954.
Revised United States Army Regulations of 1861 (Washington, DC: Government Printing Offi ce, 1863), 506, 539.
Rigg, Robert B. “The Combat Slice.” Army (June 1971), 20-27.Romjue, John. The Army of Excellence: The Development of the 1980s Army.
TRADOC Historical Monograph Series. Fort Monroe, VA: Offi ce of the Command Historian, US Army Training and Doctrine Command, 2004.
________. “A History of Army 86, Volume I Division 86: The Development of the Heavy Division September 1978-October 1979.” Fort Monroe, VA: Historical Offi ce, US Army Training and Doctrine Command, 1980.
________. “A History of Army 86, Volume II The Development of the Light
95
Division, the Corps, and Echelons Above Corps November 1979-December 1980.” Fort Monroe, VA: Historical Offi ce, US Army Training and Doctrine Command, 1982.
Ruppenthal, Roland G. The European Theater of Operations: Logistical Support of the Armies. 2 vols. In USAWWII series. Washington, DC: OCMH, 1959.
________. Logistical Support of the Armies, The United States Army in World War II: European Theater of Operations. Volume II. Washington, DC: Offi ce of the Chief of Military History, 1959.
Sawicki, James. Infantry Regiments of the US Army. Dumfries, VA: Wyvern Publications, 1981.
Schmidt, Carl T. “The Operational Slice in Two World Wars.” Military Review (October 1951), 51-62.
Shrader, Charles R. US Military Logistics, 1607-1991: A Research Guide. New York: Greenwood, 1992.
________. United States Army Logistics, 1775-1992 An Anthology. Volume 3. Washington, DC: US Army Center of Military History, 1997.
Stanton, Shelby. “Korean War Order of Battle.” Manuscript in the archives of the US Army Center of Military history.
________. Order of Battle, US Army, World War II. Novato, CA: Presidio, 1984.________. Vietnam Order of Battle. Washington, DC : U.S. News Books, 1981.“Statistical Data on Strength and Casualties for Korean War and Vietnam,”
Historical Manuscripts Collection (HMC) fi le 2-3.7 AD.M, US Army Center of Military History.
Sykes, H.F. “Logistics and World War II: Army Strategy.” Military Review (February 1956), 47-54.
Taft, William Howard. Service with Fighting Men: An Account of the Work of the American Young Men’s Christian Associations in the World War. 2 vols. New York: Association Press, 1922.
Thompson, Julian. The Lifeblood of War: Logistics in Armed Confl ict. New York: Brassey’s, 1991.
US Army Chief of Staff Memo 74-5-70 for Heads of Army Staff Agencies, Subject: Increased Combat Capability in Europe, 2 August 1974, Brigade 75 fi le, Force Structure and Unit History Branch, US Army Center of Military History.
US Army. European Theater of Operations. ComZ. Communications-Zone Activities in Support of the European Campaign, 30 July 1943-25 February 1945. Paris, 1945.
US Army. Forces in the European Theater. General Board Reports, Bad Nauheim, Germany: 1945-46.
No 2—Organization of the European Theater of Operations. No 101—The Employment of Ordnance Staff Sections, Ordnance Combat
Service. Units and Ordnance Service Units in the European Campaign. No 126—Table of Organization and Equipment for a Base Section. No 127—Organization and Functions of the Communications Zone. No 130—Supply and Maintenance on the European Continent.
96
US Army Forces, Far East, & Eighth Army (Rear). HQ. Logistics in the Korean Operations. Vols. I, III & IV. Camp Zama, Japan, December 1955.
US Army Service Forces. Logistical Planning and Reference Data. Handbook, July 1943.
US Army. Order of Battle of the United States Land Forces in the World War (1917-19). 4 vols. Washington, DC: GPO, 1931-49.
US Army Service Forces. Logistics in World War II: Final Report of the Army Service Forces. Washington, DC, 1 July 1947.
US Army Service Forces. Personnel Requirements for Service, Supply, and Procurement Division. Washington, DC: 30 July 1946.
US Army Training and Doctrine Command, “Army Comprehensive Guide to Modularity.” Version 1.0. Fort Monroe, VA: US Army Training and Doctrine Command, 8 October 2004.
US Army Training and Doctrine Command (TRADOC) Pamphlet 525-3-90, O & O, The United States Army Objective Force Operational and Organizational Plan for Maneuver Unit of Action. Fort Monroe, VA: TRADOC, 2005.
US Department of the Army. “Department of the Army Force Accounting System, Active Army Troop List,” 31 March 1974. Copy available at US Army Center of Military History.
US Department of the Army. FM 3-20.96 Cavalry Squadron (RSTA). Washington DC: Department of the Army, 2002.
US Department of the Army. FM 3-21.11 The SBCT Rifl e Company. Washington DC: Department of the Army, 2003.
US Department of the Army. FM 3-21.21 The Stryker Brigade Combat Team Infantry Battalion. Washington DC: Department of the Army, 2003.
US Department of the Army. FM 3-21.31 The Stryker Brigade Combat Team. Washington DC: Department of the Army, 2003.
US Department of the Army. FM 54-30 Corps Support Groups. Washington DC: Department of the Army, 1993.
US Department of the Army. FMI 4-90.1 Heavy Brigade Combat Team Logistics Support Groups. Washington DC: Department of the Army, 2005.
US Department of the Army, Force Development Division, “Modular Division 87000G900 Modularity Note 36A,” 8 March 2006, PowerPoint Briefi ng, copy in author’s fi les.
US Department of the Army. Historical Division. The United States Army in the World War, 1917-1918: Organization of the American Expeditionary Forces. Washington, DC: GPO, 1948.
US Department of the Army. Staff Offi cers’ Field Manual: Organization, Technical, and Logistical Data. FM 101-10-1, January 1966.
US Department of the Army. Staff Offi cers’ Field Manual: Organization, Technical, and Logistical Data, Part I-Unclassifi ed Data. Field Manual 101-10 (Part I), October 1961.
US European Command. Historical Division. Morale and Discipline in the European Command, 1945-1949. Karlsruhe, Germany: 1951.
US European Command. Historical Division. Recreation and Welfare. In Occupation Forces in Europe Series, 1945-46. Frankfurt, Germany: 1947.

97
US Forces, European Theater. Historical Division. “The Administration and Logistical History of the European Theater of Operations.” 1946.
US War Department Commission on Training Camp Activities. The War Department Commission on Training Camp Activities. Washington, DC, 1917.
US War Department. General Staff. “The German General Staff Corps: A Study of the Organization of the German General Staff.” GMDS, April 1946.
US War Department. War Plans Division, Historical Branch. Organization of the Services of Supply. American Expeditionary Forces. Washington, DC: Government Printing Offi ce, 1921.
US War Department. Military Responsibility for Equipping the Armed Forces. Washington, DC, 1943.
US War Department. Order of Battle of the United States Land Forces in the World War, American Expeditionary Forces: General Headquarters, Armies, Army Corps, Services of Supply, Separate Forces. Washington, DC: US Army Center of Military History, 1988.
US War Department. Order of Battle of the United States Land Forces in the World War, American Expeditionary Forces: Divisions. Washington, DC: US Army Center of Military History, 1988.
US War Department. Staff Offi cers’ Field Manual, Organization, Technical and Logistical Data. Field Manual 101-10, December 1944.
US War Department. The US Army in the World War, 1917-1919, Volume 1, “The Organization of the American Expeditionary Forces” (Washington, DC: US Army Center of Military History, 1988), 144-5.
Vann, LTC John. “The Forgotten Forces.” Military Review (August 1987), 2-17.Waddell, Steve R. “The Communications Zone (COMZ): American Logistics in
France, 1944.” PhD diss., Texas A&M, 1992.Waddell, Steve R. United States Army Logistics: The Normandy Campaign, 1944.
Westport: Greenwood, 1994.Westover, John. Combat Support in Korea. US Army in Action Series. Washington,
DC: US Army Center of Military History, 1987. Whipple, William. “Logistical Bottleneck.” Infantry Journal (March 1948) : 6-
14. Wilson, George C. “Joint Chiefs of Staff Break with Carter on Budget Planning,”
Washington Post, 30 May 1980, A1.Wilson, John B. “Mobility Versus Firepower: The Post-World War I Infantry
Division.” Parameters (September 1983), 47-52.Wilson, John B. Maneuver and Firepower: The Evolution of Divisions and
Separate Brigades. Army Lineage Series. Washington, DC: US Army Center of Military History, 1998.
Wong, Leonard and Stehen Cerras. “CU @ the FOB: How the Forward Operating Base is Changing the Lives of Combat Soldiers.” Strategic Studies Institute, March 2006.
Wright, Robert. The Continental Army. (Washington, DC: US Army Center of Military History,) 1983.

98
Young, Victoria A. “Force Type-Active Army.” In Evolution of U.S. Army Force Structure, Final Report, 89-1495. McLean, VA: Science Applications International Corporation, 28 July 1989.
Zelnick, Bob. “Soldier Gore: The Story of the Veep and Vietnam,” National Review (22 November 1999) [article on-line], available at http://www.fi ndarticles.com/p/articles/mi_m1282/is_22_51/ai_57436684; Internet; accessed on 20 March 2007.

99
Appendix AT3R Categories
Tabl
e A
-1. C
ateg
orie
s of
the
Toot
h an
d th
e Ta
il
Com
bat
Com
bat
Life
Supp
ort
Logi
stic
alH
eadq
uart
ers
&A
dmin
istr
ativ
eLi
feSu
ppor
tLo
gist
ical
Hea
dqua
rter
s&
Adm
inis
trat
ive
•Ba
sesu
ppor
tuni
ts.
•Si
gnal
infra
stru
ctur
eun
its.
•C
onst
ruct
ion
and
infra
-st
ruct
ure
engi
neer
units
.•
Milit
ary
polic
eun
itsru
nnin
gpr
ison
sfo
rfrie
ndly
forc
es,
etc.
•La
rger
finan
ceun
its.
•JA
Gof
fices
.•
Labo
rser
vice
supp
ortu
nits
.•
Hea
dqua
rters
units
foru
nits
cond
uctin
glif
esu
ppor
tfu
nctio
ns.
•Ba
sepu
blic
info
rmat
ion
(adj
utan
tgen
eral
)uni
ts.
•C
ontra
ctin
gun
its.
•M
edic
alun
itsas
sign
eddi
rect
lyto
base
sor
cam
ps.
•M
ostc
omba
tser
vice
supp
ort
units
(qua
rterm
aste
r,su
pply
,se
rvic
e,m
aint
enan
ce,
ordn
ance
,adj
utan
tgen
eral
,tra
nspo
rtatio
n,m
edic
al,s
mal
lfin
ance
).•
Inte
rnal
logi
stic
alel
emen
tsin
com
batb
atta
lions
.•
Inte
rnal
logi
stic
alel
emen
tsin
logi
stic
alun
its.
•C
omba
tser
vice
supp
ort
avia
tion
units
(air
ambu
lanc
e,he
avy
lift,
etc.
).•
Mili
tary
polic
eun
itsru
nnin
gPO
Wca
mps
,etc
.•
Civ
ilaf
fairs
units
.
•H
eadq
uarte
rsba
ttalio
ns/
com
pani
es/tr
oops
/bat
terie
s/de
tach
men
tsof
allt
ypes
ofco
mm
and
from
batta
lion
toth
eate
rhea
dqua
rters
(incl
udin
glo
gist
ical
units
).•
Mos
tsig
nalu
nits
.•
Mos
tmilit
ary
inte
lligen
ceun
its.
•C
omm
and
and
cont
rol
avia
tion
units
.•
Mili
tary
polic
eun
itsta
sked
with
com
man
dan
dco
ntro
lfu
nctio
ns(tr
affic
cont
rol),
head
quar
ters
guar
d.•
Com
man
dpu
blic
info
rmat
ion
units
.
•C
ompa
ny/tr
oop/
batte
ry/
deta
chm
ents
ofin
fant
ry,
arm
or,c
aval
ry,f
ield
artil
lery
,ai
rdef
ense
artil
lery
,com
bat
engi
neer
s.•
Spec
ialo
pera
tions
forc
esun
itsof
alls
izes
.•
Advi
sors
and
othe
rele
men
tsdi
rect
lysu
ppor
ting
the
com
batf
orce
sof
fore
ign
arm
ies.
•At
tack
and
assa
ulta
viat
ion
units
ofco
mpa
nyor
smal
ler
size
.•
Milit
ary
polic
eun
itspr
ovid
ing
conv
oypr
otec
tion.
Type
sO
fUni
ts
Con
duct
infra
stru
ctur
esu
ppor
t.C
ondu
ctse
rvic
esu
ppor
top
erat
ions
(CSS
),in
clud
ing
inte
rnal
com
bats
ervi
cesu
ppor
top
erat
ions
inC
SSun
its.
Uni
tsor
elem
ents
ofun
itsw
hich
prov
ide
com
man
dan
dco
ntro
lfo
rcom
bat,
com
bats
uppo
rtan
dco
mba
tser
vice
supp
ortu
nits
;un
itsw
hich
prov
ide
supp
ortt
ohe
adqu
arte
rsun
its.
Uni
tsw
hose
prim
ary
mis
sion
isth
eco
nduc
tofc
omba
tand
com
bats
uppo
rtop
erat
ions
.
Mis
sion
•Ba
sesu
ppor
tuni
ts.
•Si
gnal
infra
stru
ctur
eun
its.
•C
onst
ruct
ion
and
infra
-st
ruct
ure
engi
neer
units
.•
Milit
ary
polic
eun
itsru
nnin
gpr
ison
sfo
rfrie
ndly
forc
es,
etc.
•La
rger
finan
ceun
its.
•JA
Gof
fices
.•
Labo
rser
vice
supp
ortu
nits
.•
Hea
dqua
rters
units
foru
nits
cond
uctin
glif
esu
ppor
tfu
nctio
ns.
•Ba
sepu
blic
info
rmat
ion
(adj
utan
tgen
eral
)uni
ts.
•C
ontra
ctin
gun
its.
•M
edic
alun
itsas
sign
eddi
rect
lyto
base
sor
cam
ps.
•M
ostc
omba
tser
vice
supp
ort
units
(qua
rterm
aste
r,su
pply
,se
rvic
e,m
aint
enan
ce,
ordn
ance
,adj
utan
tgen
eral
,tra
nspo
rtatio
n,m
edic
al,s
mal
lfin
ance
).•
Inte
rnal
logi
stic
alel
emen
tsin
com
batb
atta
lions
.•
Inte
rnal
logi
stic
alel
emen
tsin
logi
stic
alun
its.
•C
omba
tser
vice
supp
ort
avia
tion
units
(air
ambu
lanc
e,he
avy
lift,
etc.
).•
Mili
tary
polic
eun
itsru
nnin
gPO
Wca
mps
,etc
.•
Civ
ilaf
fairs
units
.
•H
eadq
uarte
rsba
ttalio
ns/
com
pani
es/tr
oops
/bat
terie
s/de
tach
men
tsof
allt
ypes
ofco
mm
and
from
batta
lion
toth
eate
rhea
dqua
rters
(incl
udin
glo
gist
ical
units
).•
Mos
tsig
nalu
nits
.•
Mos
tmilit
ary
inte
lligen
ceun
its.
•C
omm
and
and
cont
rol
avia
tion
units
.•
Mili
tary
polic
eun
itsta
sked
with
com
man
dan
dco
ntro
lfu
nctio
ns(tr
affic
cont
rol),
head
quar
ters
guar
d.•
Com
man
dpu
blic
info
rmat
ion
units
.
•C
ompa
ny/tr
oop/
batte
ry/
deta
chm
ents
ofin
fant
ry,
arm
or,c
aval
ry,f
ield
artil
lery
,ai
rdef
ense
artil
lery
,com
bat
engi
neer
s.•
Spec
ialo
pera
tions
forc
esun
itsof
alls
izes
.•
Advi
sors
and
othe
rele
men
tsdi
rect
lysu
ppor
ting
the
com
batf
orce
sof
fore
ign
arm
ies.
•At
tack
and
assa
ulta
viat
ion
units
ofco
mpa
nyor
smal
ler
size
.•
Milit
ary
polic
eun
itspr
ovid
ing
conv
oypr
otec
tion.
Type
sO
fUni
ts
Con
duct
infra
stru
ctur
esu
ppor
t.C
ondu
ctse
rvic
esu
ppor
top
erat
ions
(CSS
),in
clud
ing
inte
rnal
com
bats
ervi
cesu
ppor
top
erat
ions
inC
SSun
its.
Uni
tsor
elem
ents
ofun
itsw
hich
prov
ide
com
man
dan
dco
ntro
lfo
rcom
bat,
com
bats
uppo
rtan
dco
mba
tser
vice
supp
ortu
nits
;un
itsw
hich
prov
ide
supp
ortt
ohe
adqu
arte
rsun
its.
Uni
tsw
hose
prim
ary
mis
sion
isth
eco
nduc
tofc
omba
tand
com
bats
uppo
rtop
erat
ions
.
Mis
sion
Non
com
bat
Non
com
bat


101
Appendix B
Comparative Data Tables
Table B-1. Operational Unit (Division/Brigade) Composition Comparisons*
Table B-2. Theater Comparisons by Category*
Table B-3. Operational Slice Comparisons*
Table B-4. Overall Combat Forces Proportion*
Table B-5. Historical Data
*The data in these tables were produced through an analysis of various order of battle and troop list documents found in offi cial histories and stationing lists. To determine categories for units above company level, tables of organization for the specifi c units were examined.

102
Tabl
e B
-1. O
pera
tiona
l Uni
t (D
ivis
ion/
Brig
ade)
Com
posi
tion
Com
paris
ons
1. T
he st
reng
ths i
n th
ese
colu
mns
are
stre
ngth
s in
the
fi eld
. Aut
horiz
ed st
reng
ths,
whi
ch a
re u
sed
for t
he o
pera
tiona
l slic
e fi g
ures
, whe
re d
iffer
ent,
are:
18
,804
for t
he K
orea
n W
ar 1
953
infa
ntry
div
isio
n; a
nd 1
6,47
5 fo
r the
RO
AD
infa
ntry
and
arm
ored
div
isio
ns.
Div
isio
n/B
rigad
eSi
ze1
Div
isio
n/B
rigad
eSi
ze1
Non
com
bat
Non
com
bat
Com
bat
Com
bat
2489
533
1,22
243
21,6
183,
735
Mod
ular
Com
bine
dAr
ms
Brig
ade,
2004
327,
197
296,
394
398,
586
22,1
77N
otio
nalM
odul
arH
eavy
Div
isio
n,20
04
1884
030
1,44
352
2,51
54,
798
Stry
kerB
rigad
e,20
04
254,
300
264,
300
498,
403
17,0
03A
OE
Arm
ored
Div
isio
n,19
68
355,
279
203,
070
456,
710
15,0
59R
OAD
Infa
ntry
Div
isio
nG
erm
any,
1974
315,
201
111,
932
589,
769
16,0
92R
OAD
Infa
ntry
Div
isio
nV
ietn
am,1
968
204,
081
183,
610
6212
,345
20.0
36In
fant
ryD
ivis
ion
Kore
a,19
53
212,
265
212,
225
586,
180
10,6
70Ar
mor
edD
ivis
ion
ETO
,194
5
182,
572
141,
911
689,
544
14,0
37In
fant
ryD
ivis
ion
ETO
,194
5
72,
017
144,
048
7822
.040
28,1
05AE
FIn
fant
ryD
ivis
ion,
1918
Hea
dqua
rter
s&
Adm
inis
trat
ive
Logi
stic
alH
eadq
uart
ers
&A
dmin
istr
ativ
eLo
gist
ical
%N
umbe
r%
Num
ber
%N
umbe
r%
Num
ber
%N
umbe
r%
Num
ber
Uni
tTyp
eU
nitT
ype
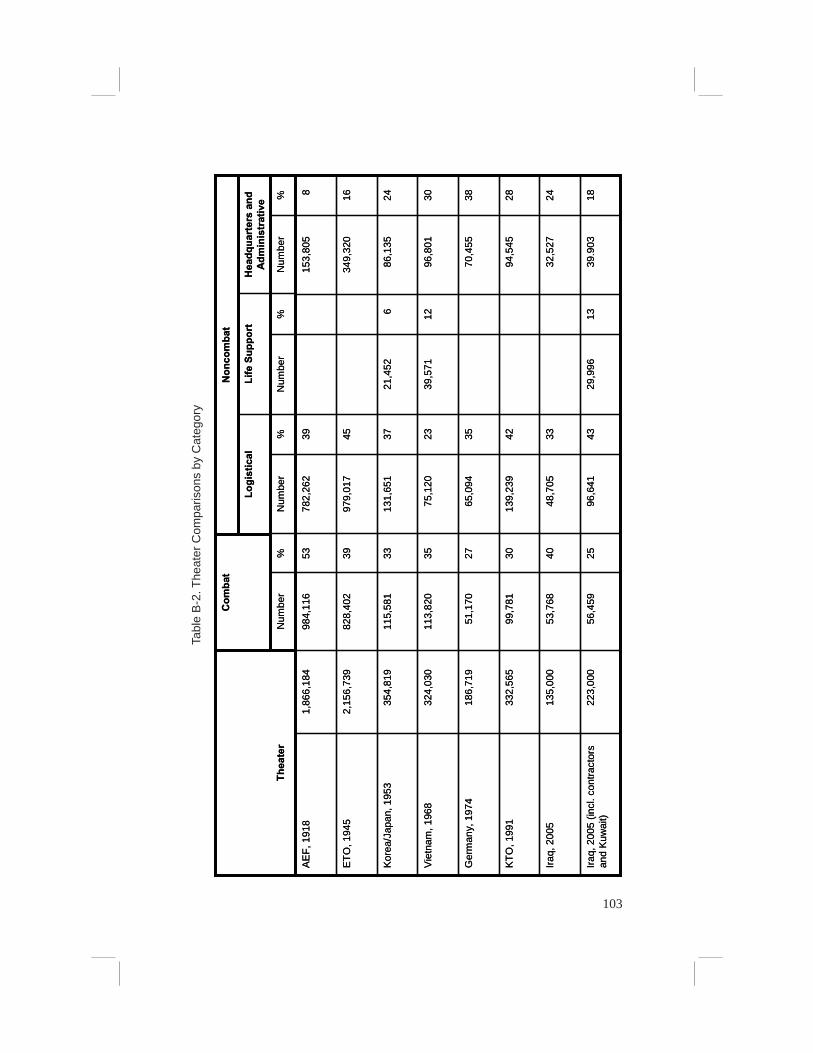
103
Tabl
e B
-2. T
heat
er C
ompa
rison
s by
Cat
egor
y
Thea
ter
Thea
ter
Non
com
bat
Non
com
bat
Com
bat
Com
bat
1839
.903
1329
,996
4396
,641
2556
,459
223,
000
Iraq,
2005
(incl
.con
tract
ors
and
Kuw
ait)
2432
,527
3348
,705
4053
,768
135,
000
Iraq,
2005
2894
,545
4213
9,23
930
99,7
8133
2,56
5KT
O,1
991
3870
,455
3565
,094
2751
,170
186,
719
Ger
man
y,19
74
3096
,801
1239
,571
2375
,120
3511
3,82
032
4,03
0Vi
etna
m,1
968
2486
,135
621
,452
3713
1,65
133
115,
581
354,
819
Kore
a/Ja
pan,
1953
1634
9,32
045
979,
017
3982
8,40
22,
156,
739
ETO
,194
5
815
3,80
539
782,
262
5398
4,11
61,
866,
184
AEF,
1918
%N
umbe
r%
Num
ber
%N
umbe
r%
Num
ber
%N
umbe
r%
Num
ber
%N
umbe
r%
Num
ber
Hea
dqua
rter
san
dA
dmin
istr
ativ
eLi
feSu
ppor
tLo
gist
ical
Hea
dqua
rter
san
dA
dmin
istr
ativ
eLi
feSu
ppor
tLo
gist
ical

104
Tabl
e B
-3. O
pera
tiona
l Slic
e C
ompa
rison
4916
,646
5133
,750
17,1
044
135,
000
Iraq,
2005
6531
,753
3548
,857
17,1
0410
468,
578
Arm
y,20
05
646,
682
3610
,477
3,73
548
500,
000
Mod
ular
Brig
ade,
2007
6430
,548
3647
,652
17,1
047
333,
565
Kuw
aiti
Thea
ter
ofO
pera
tions
,19
91
5621
,945
4439
,046
17,1
0414
.66
572,
423
Arm
y,19
91
6632
,239
3448
,714
16,4
7516
779,
417
Arm
y,19
76
7241
,549
2858
,204
16,4
7513
.578
3,33
0Ar
my,
1974
7858
,303
2274
,778
16,4
7521
1,57
0,34
3A
rmy
(Vie
tnam
War
)196
8
7557
,887
2576
,691
18,8
0420
1,53
3,81
5A
rmy
(Kor
ean
War
)195
3
8054
,100
2067
,900
13,8
0089
6,04
2,27
7Ar
my
(Wor
ldW
arII)
1945
5534
,100
4858
,318
28,1
0532
1,86
6,18
4AE
F,19
18
5027
,610
5055
,715
28,1
0543
2,39
5,74
2Ar
my,
1918
h.N
on-
Div
isio
nal
Perc
enta
geof
the
Arm
y(g
/e)
g.N
on-
Div
isio
nal/
Brig
ade
Slic
e(e
-d)
f.D
ivis
ion/
Brig
ade
Perc
enta
geof
the
Arm
y(d
/e)
e.To
tal
Ope
ratio
nal
Slic
e(b
/c)
d.St
anda
rdD
ivis
iona
l/B
rigad
eSi
ze
c.N
umbe
rof
Div
isio
ns/
Brig
ades
b.To
tal
Stre
ngth
a.A
rea
orEl
emen
t

105
Tabl
e B
-4. O
vera
ll C
omba
t For
ces
Pro
porti
on1
1. R
ober
t R. P
alm
er, “
The
Mob
iliza
tion
of th
e G
roun
d A
rmy,
” A
rmy
Gro
und
Forc
es S
tudy
Num
ber 4
(Was
hing
ton,
DC
: Arm
y G
roun
d Fo
rces
, 19
46).
2. T
his fi
gur
e re
pres
ents
72
perc
ent o
f the
Arm
y’s 1
945
stre
ngth
(the
pro
porti
on o
f the
Arm
y in
the
ETO
).
1117
6.5
7.2
7.5
1928
Per
cent
52,7
6899
,781
51,1
7011
3,82
011
5,58
182
8,40
298
4,11
6C
omba
t
468,
578
572,
423
783,
330
1,57
0,34
31,
533,
615
4,30
8,11
423,
514,
137
Tota
lArm
yS
treng
th
Iraq
2005
KTO
1991
Col
dW
ar19
74G
erm
any
Viet
nam
1968
Kor
ea19
53W
orld
War
II(E
TO)
Wor
ldW
arI
1918
1117
6.5
7.2
7.5
1928
Per
cent
52,7
6899
,781
51,1
7011
3,82
011
5,58
182
8,40
298
4,11
6C
omba
t
468,
578
572,
423
783,
330
1,57
0,34
31,
533,
615
4,30
8,11
423,
514,
137
Tota
lArm
yS
treng
th
Iraq
2005
KTO
1991
Col
dW
ar19
74G
erm
any
Viet
nam
1968
Kor
ea19
53W
orld
War
II(E
TO)
Wor
ldW
arI
1918

106
Tabl
e B
-5. H
isto
rical
Dat
a
*Inc
lude
d in
fi gu
re in
col
umn
e.
NA
840
111,
222
2,11
71,
618
3,73
5M
odul
arco
mbi
ned
Arm
sBr
igad
e20
07
NA
840
1,44
32,
283
2,51
54,
798
Stry
kerB
rigad
e,20
04
29,9
9639
,903
96,6
4116
6,54
056
,456
223,
000
Arm
yIra
q(in
clud
ing
Kuw
ait)
2005
*94
,545
139,
239
23,7
8499
,781
333,
565
Arm
y-D
ESER
TST
OR
M,1
991
NA
4,25
54,
446
8,70
18,
403
17,1
04Ar
mor
edD
ivis
ion,
1986
NA
70,4
5557
,626
135,
549
6,71
015
,059
Arm
ored
Div
isio
n,19
74
7,46
870
,455
57,6
2613
5,54
951
,170
186,
822
USA
EUR
Ger
man
y,19
74
NA
5,20
11,
932
7,13
39,
769
16,9
02Vi
etna
mIn
fant
ryD
ivis
ion,
1968
39,5
7192
,338
72,6
9420
4,60
310
0,55
330
5,15
6Ar
my
Vie
tnam
,196
8
NA
4,08
13,
610
7,69
112
,345
20,0
36K
orea
Infa
ntry
Div
isio
n,19
53
21,4
5286
,135
131,
654
239,
241
115,
419
354,
660
Arm
yKo
rea
(incl
udin
gJa
pan)
NA
2,26
52,
225
4,46
06,
180
10,6
70Ar
mor
edD
ivis
ion,
1945
NA
1,91
12,
572
4,48
39,
554
14,0
37In
fant
ryD
ivis
ion,
1945
*35
1,58
598
1,24
21,
332,
827
834,
582
2,16
7,40
9ET
O,1
945
NA
2,43
74,
048
6,48
521
,620
28,1
05AE
FD
ivis
ion,
1918
*15
3,80
612
8,26
228
2,06
898
4,11
61,
866,
184
AEF,
1918
g. Life
Supp
ort
Elem
ents
f.H
eadq
uart
ers
Elem
ents
e.Lo
gist
ical
Elem
ents
d.To
tal
Non
com
bat
Elem
ents
c.C
omba
tEl
emen
ts
b.To
tal
Stre
ngth
a.A
rea
orEl
emen
t
NA
840
111,
222
2,11
71,
618
3,73
5M
odul
arco
mbi
ned
Arm
sBr
igad
e20
07
NA
840
1,44
32,
283
2,51
54,
798
Stry
kerB
rigad
e,20
04
29,9
9639
,903
96,6
4116
6,54
056
,456
223,
000
Arm
yIra
q(in
clud
ing
Kuw
ait)
2005
*94
,545
139,
239
23,7
8499
,781
333,
565
Arm
y-D
ESER
TST
OR
M,1
991
NA
4,25
54,
446
8,70
18,
403
17,1
04Ar
mor
edD
ivis
ion,
1986
NA
70,4
5557
,626
135,
549
6,71
015
,059
Arm
ored
Div
isio
n,19
74
7,46
870
,455
57,6
2613
5,54
951
,170
186,
822
USA
EUR
Ger
man
y,19
74
NA
5,20
11,
932
7,13
39,
769
16,9
02Vi
etna
mIn
fant
ryD
ivis
ion,
1968
39,5
7192
,338
72,6
9420
4,60
310
0,55
330
5,15
6Ar
my
Vie
tnam
,196
8
NA
4,08
13,
610
7,69
112
,345
20,0
36K
orea
Infa
ntry
Div
isio
n,19
53
21,4
5286
,135
131,
654
239,
241
115,
419
354,
660
Arm
yKo
rea
(incl
udin
gJa
pan)
NA
2,26
52,
225
4,46
06,
180
10,6
70Ar
mor
edD
ivis
ion,
1945
NA
1,91
12,
572
4,48
39,
554
14,0
37In
fant
ryD
ivis
ion,
1945
*35
1,58
598
1,24
21,
332,
827
834,
582
2,16
7,40
9ET
O,1
945
NA
2,43
74,
048
6,48
521
,620
28,1
05AE
FD
ivis
ion,
1918
*15
3,80
612
8,26
228
2,06
898
4,11
61,
866,
184
AEF,
1918
g. Life
Supp
ort
Elem
ents
f.H
eadq
uart
ers
Elem
ents
e.Lo
gist
ical
Elem
ents
d.To
tal
Non
com
bat
Elem
ents
c.C
omba
tEl
emen
ts
b.To
tal
Stre
ngth
a.A
rea
orEl
emen
t

107
About the Author
Boston native John McGrath has worked for the United States Army in one capacity or another since 1978. A retired Army Reserve offi cer, Mr. McGrath served in infantry, fi eld artillery and logistics units, both on active duty and as a reservist. Before coming to work at the Combat Studies Institute, he worked for 4 years at the US Army Center of Military History in Washington, DC, as a historian and archivist. Prior to that, Mr. McGrath worked full time for the United States Army Reserve in Massachusetts for over 15 years, both as an active duty reservist and as a civilian military technician. He also served as a mobilized reservist in 1991 in Saudi Arabia with the 22d Support Command during Operation DESERT STORM as the command historian and in 1992 at the US Army Center of Military History as a researcher/writer. Mr. McGrath is a graduate of Boston College and holds an MA in history from the University of Massachusetts at Boston. He is the author of numerous articles and military history publications and the following books: Theater Logistics in the Gulf War, published by the Army Materiel Command in 1994; The Brigade: A History, published by the US Army Combat Studies Institute in 2005; Crossing the Line of Departure: Battle Command on the Move, and Boots on the Ground: Troop Density in Contingency Operations, both published by the US Army Combat Studies Institute in 2006. Mr. McGrath was also the general editor of the proceedings of the Combat Study Institute’s 2005 Military History Symposium, An Army at War: Change in the Midst of Confl ict and contributed to CSI’s anthology In Contact! Aside from a general interest in things military and historical, his areas of particular interest include modern military operations, the German Army in World War II, August 1914, and the Union Army in the Civil War. He also has a keen interest in ancient history, historical linguistics, the city of Boston, and baseball. McGrath is also a current PhD candidate at Kansas State University.
