the outlook for energy midwest brand meeting april 19, 2006 midwest brand meeting april 19, 2006 j....
TRANSCRIPT


The Outlook for EnergyThe Outlook for EnergyMidwest Brand MeetingApril 19, 2006Midwest Brand MeetingApril 19, 2006
J. Patrick McGinnManager, Midwest Public Affairs
J. Patrick McGinnManager, Midwest Public Affairs
A 2030 ViewA 2030 View
This presentation includes forward-looking statements. Actual future conditions (including economic conditions, energy demand, and energy supply) could differmaterially due to changes in technology, the development of new supply sources, political events, demographic changes, and other factors discussed herein
(and in Item 1 of ExxonMobil’s latest report on Form 10-K. This material is not to be reproduced without the permission of Exxon Mobil Corporation.

World GDP Grows by 2.8% AnnuallyWorld GDP Grows by 2.8% Annually
2003 World GDP$36.3 Trillion
2003 World GDP$36.3 Trillion
2003$ GDP Level2003$ GDP Level
North AmericaNorth America
Latin America
Latin America
Russia/CaspianRussia/Caspian
AfricaAfrica
Middle EastMiddle East
IndiaIndia Other APOther AP
ChinaChinaJapanJapan
EuropeEurope$11.9 T$11.9 T
$1.8T$1.8T$0.7T$0.7T
$0.6T$0.6T $2.5T$2.5T
$1.4T$1.4T$4.3T$4.3T
$12.2T$12.2T
$0.6T$0.6T
$0.7T$0.7T

World GDP Grows by 2.8% AnnuallyWorld GDP Grows by 2.8% Annually
$23.9 T$23.9 T
North AmericaNorth America
2.6%*2.6%*
Latin America
Latin America
3.2%3.2%
3.5%3.5%
Russia/CaspianRussia/Caspian
$1.6T$1.6T
3.3%3.3%
AfricaAfrica$1.6T$1.6T
2.8%2.8%
Middle EastMiddle East$1.5T$1.5T
5.1%5.1%
IndiaIndia
$2.2T$2.2T
3.6%3.6%
Other APOther AP
$6.4T$6.4T
2030 World GDP$76.5 Trillion
2030 World GDP$76.5 Trillion
2030 Increase in GDP2030 Increase in GDP
6.3%6.3%
ChinaChina
$7.4T$7.4T
1.1%1.1%
JapanJapan$5.8T$5.8T
* 2003-2030 Annual Growth Rate* 2003-2030 Annual Growth Rate
EuropeEurope
$20.6T$20.6T
2.0%2.0%
$4.3T$4.3T
2003$ GDP Level2003$ GDP Level

Population Grows 27% by 2030Population Grows 27% by 2030
Latin AmericaLatin America
321M321MNorth AmericaNorth America
539M539M
Russia/CaspianRussia/Caspian288M288M
AfricaAfrica848M848M
Middle EastMiddle East
IndiaIndia1,061M1,061M
Other APOther AP1,032M1,032M
JapanJapan
EuropeEurope579M579M
182M182M127M127M
2003 World Population6.3 Billion
2003 World Population6.3 Billion
ChinaChina1,292M1,292M
2003 Population Level2003 Population Level

Population Grows 27% by 2030Population Grows 27% by 2030
Latin AmericaLatin America
North AmericaNorth America
0.3%*0.3%*
1.1%1.1%723M723M
-0.1%-0.1%
Russia/CaspianRussia/Caspian
1.6%1.6%
AfricaAfrica
1,311M1,311M
1.7%1.7%
Middle EastMiddle East
288M288M
1.0%1.0%
IndiaIndia
1,393M1,393M 1.2%1.2%
Other APOther AP
1,414M1,414M
2030 World Population8.0 Billion
2030 World Population8.0 Billion
2003 Population Level2003 Population Level
2030 Increase in Population2030 Increase in Population
2030 Decrease in Population2030 Decrease in Population
0.5%0.5%
ChinaChina
0.0%0.0%
EuropeEurope -0.4%-0.4%
JapanJapan
* 2003-2030 Annual Growth Rate* 2003-2030 Annual Growth Rate
380M380M
279M279M
1,482M1,482M
586M586M
114M114M

GDP per Capita in Developing Areas Still SmallGDP per Capita in Developing Areas Still Small
North AmericaNorth America
AfricaAfrica$0.8K$0.8K
Middle EastMiddle East$4.0K$4.0K
IndiaIndia$0.5K$0.5K
Other APOther AP$2.4K$2.4K
2003$ GDP per capita Level2003$ GDP per capita Level
ChinaChina$1.1K$1.1K
EuropeEurope
JapanJapanLatin AmericaLatin America
$3.4K$3.4K
GDP per capita1980 2003 2030
Developed 19.7 30.2 49.9Developing 1.2 1.5 3.6
GDP per capita1980 2003 2030
Developed 19.7 30.2 49.9Developing 1.2 1.5 3.6
$36.9K$36.9K
$21.0K$21.0K
Russia/CaspianRussia/Caspian$2.1K$2.1K
$33.9K$33.9K

GDP per Capita in Developing Areas Still SmallGDP per Capita in Developing Areas Still Small
$62.8K$62.8K
North AmericaNorth America
2.0%*2.0%*
3.6%3.6%
Russia/CaspianRussia/Caspian$5.6K$5.6K
1.6%1.6%
AfricaAfrica$1.2K$1.2K
1.0%1.0%
Middle EastMiddle East$5.3K$5.3K
4.1%4.1%
IndiaIndia$1.6K$1.6K
2.4%2.4%
Other APOther AP$4.6K$4.6K
2003$ GDP per capita Level2003$ GDP per capita Level
2030 Increase in GDP per capita2030 Increase in GDP per capita
5.8%5.8%
ChinaChina$5.0K$5.0K
1.9%1.9%
EuropeEurope
$35.1K$35.1K
1.5%1.5%
JapanJapan
$51.0K$51.0K
* 2003-2030 Growth Rate* 2003-2030 Growth Rate
Latin AmericaLatin America
2.1%2.1%
$5.9K$5.9K
GDP per capita1980 2003 2030
Developed 19.7 30.2 49.9Developing 1.2 1.5 3.6
GDP per capita1980 2003 2030
Developed 19.7 30.2 49.9Developing 1.2 1.5 3.6

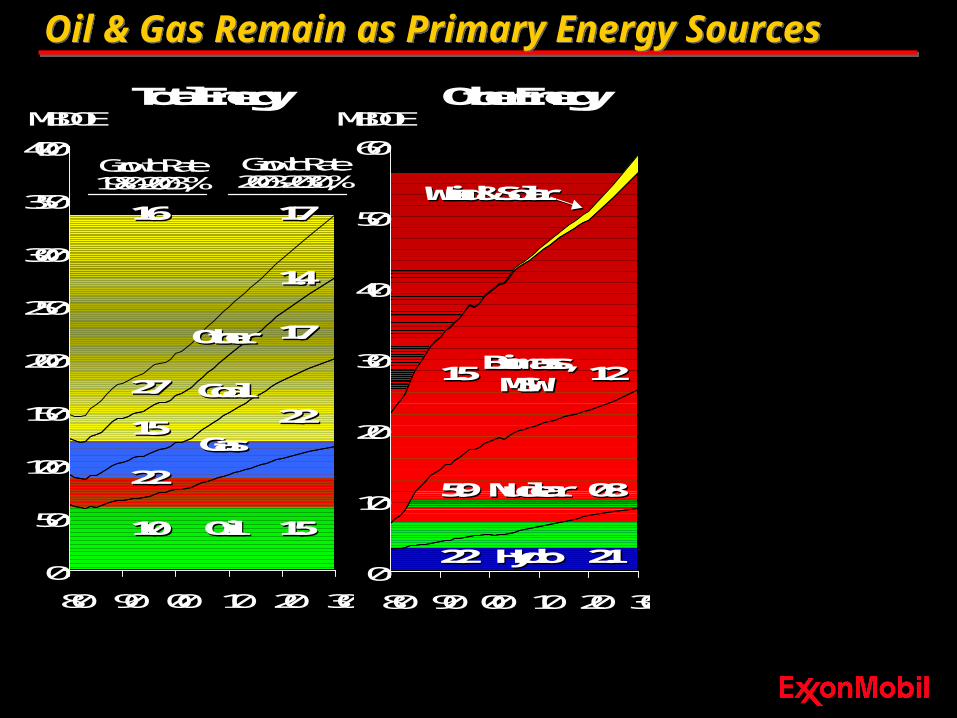
Oil & Gas Remain as Primary Energy SourcesOil & Gas Remain as Primary Energy Sources
0.0
0.5
1.0
1.5
2.0
2.5
3.0
80 90 00 10 20 30
0
10
20
30
40
50
60
80 90 00 10 20 30
0
50
100
150
200
250
300
350
400
80 90 00 10 20 30
1.71.7
1.41.4
2.22.2
1.51.5
1.21.2
0.80.8
2.12.1 9.59.5
1.51.5
2.72.7
2.22.2
1.01.0
1.51.5
5.95.9
2.22.2
Total Energy Other Energy Wind & Solar
HydroHydro
NuclearNuclear
Biomass,MSW
Biomass,MSW
Wind & SolarWind & Solar
OilOil
GasGas
CoalCoal
OtherOther
Growth Rate2003-2030, %Growth Rate2003-2030, %
SolarSolar
WindWind
MBDOE MBDOE MBDOE
Growth Rate1980-2003, %Growth Rate1980-2003, %
1.61.6 1.71.7
11.111.1

Carbon Growth led by Developing Asia PowerCarbon Growth led by Developing Asia Power
0
2
4
6
8
10
12
1970198019902000201020202030
Mid East/Africa
Latin America
Developing Asia
Asia OECD
Europe/Russia/Caspian
North America
Carbon EmissionsBillion Tons/Yr
Carbon Emissions Growth2001 to 2030Billion Tons/Yr
0
1
2
3
4
5
Total Power
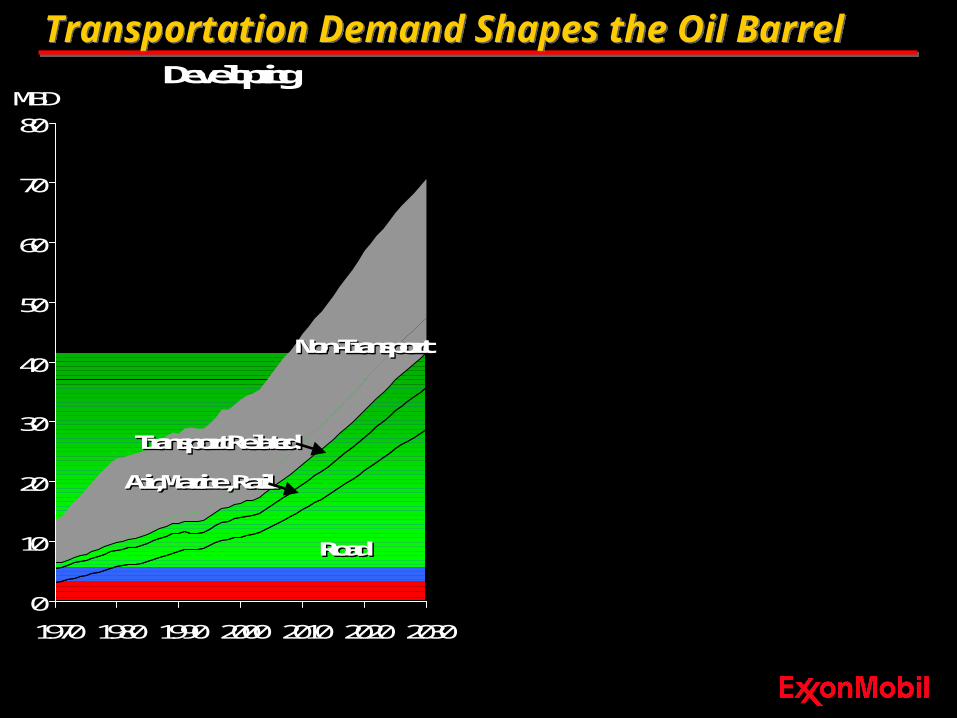
Transportation Demand Shapes the Oil BarrelTransportation Demand Shapes the Oil Barrel
0
10
20
30
40
50
60
70
80
1970 1980 1990 2000 2010 2020 2030
0
10
20
30
40
50
60
70
80
90
0
10
20
30
40
50
60
70
80
1970 1980 1990 2000 2010 2020 2030
0
10
20
30
40
50
60
70
80
90
DevelopingMBD
DevelopedMBD
RoadRoad
Air, Marine, RailAir, Marine, Rail
Non-TransportNon-Transport
Transport RelatedTransport Related

Efficiency Gains ReturnEfficiency Gains Return
0
10
20
30
40
50
19751980 198519901995 20002005 201020152020 20252030
U.S. Light Duty Vehicle TrendsMPG
New VehicleEfficiency
~2.2% per year 80% Mix
Diesel/Hyb
rid
Tec
hnology
Advan
ce

Road Fuels - Trucks Drive DieselRoad Fuels - Trucks Drive Diesel
Asia PacificNorth America Europe
Diesel
Mogas
Diesel Share (%) of New Car Sales
MBD
0
2
4
6
8
10
12
14
16
18
2000 2010 2020 2030
0
2
4
6
8
10
12
14
16
18
2000 2010 2020 2030
0
2
4
6
8
10
12
14
16
18
2000 2010 2020 2030
2010 2012 2015 2 2 2
2010 2012 2015 9 9 10
2010 2012 2015 37 43 43
96%*
71% 83%
* % Diesel for Commercial Use

Road Fuels - Trucks Drive Diesel Road Fuels - Trucks Drive Diesel
0
2
4
6
8
10
12
14
16
18
2000 2010 2020 2030
0
2
4
6
8
10
12
14
16
18
2000 2010 2020 2030
0
2
4
6
8
10
12
14
16
18
2000 2010 2020 2030
Asia PacificNorth America Europe
Sensitivity
Diesel
Mogas
2010 2012 2015 2 2 2 2 20 50
2010 2012 2015 9 9 10 8 20 50
Diesel Share (%) of New Car Sales
MBD2010 2012 2015 37 43 43

Hybrid Vehicles Have Highest PotentialHybrid Vehicles Have Highest Potential
0
100
200
300
400
500
600
0 2 4 6 8
Wel
l-to-
Whe
el g
CO
2/m
ileW
ell-t
o-W
heel
g C
O2/
mile
Fuel Cost (cents/mile, ex. tax)Fuel Cost (cents/mile, ex. tax)
Sources: Argonne National Lab, Toyota, NRC, IEA, EM analysisSources: Argonne National Lab, Toyota, NRC, IEA, EM analysis
United States - Mid-Size CarsUnited States - Mid-Size Cars
CamryCamry
Ultimate VehicleUltimate Vehicle
European DieselEuropean Diesel
Prius IIPrius II

Hybrid Vehicles Have Highest PotentialHybrid Vehicles Have Highest Potential
0
100
200
300
400
500
600
0 2 4 6 8
Wel
l-to-
Whe
el g
CO
2/m
ileW
ell-t
o-W
heel
g C
O2/
mile
United States - Mid-Size CarsUnited States - Mid-Size Cars
Prius IIPrius II H2 FCV (Current)H2 FCV (Current)
CamryCamry
H2 FCV (Future)H2 FCV (Future)
European DieselEuropean Diesel
Fuel Cost (cents/mile, ex. tax)Fuel Cost (cents/mile, ex. tax)
Sources: Argonne National Lab, Toyota, NRC, IEA, EM analysisSources: Argonne National Lab, Toyota, NRC, IEA, EM analysis
Ultimate VehicleUltimate Vehicle

Efficiency More than Offsets NA DemandEfficiency More than Offsets NA Demand
2003 2030 2003 2030 2003 2030
Number Vehicles (Million) 235 325 230 270 55 420
Efficiency (MPG)Fleet 20.5 29.0 31.5 39.0 19.0 25.0New Sales 21.0 38.0 35.0 43.0 20.0 29.0
Advanced ICE/Diesel % Sales 1% 42% 39% 57% 13% 22%
Light Duty Fuels (MBD) 9.5 8.8 3.7 3.6 1.8 7.9
Carbon Emissions (G Tonnes/Yr) 0.35 0.33 0.14 0.14 0.07 0.30
North America Europe Emerging AP
Cars/1000 730 855 395 460 15 100

Efficiency More than Offsets NA & EU DemandEfficiency More than Offsets NA & EU Demand
2003 2030 2003 2030 2003 2030
Number Vehicles (Million) 235 325 230 270 55 420
Efficiency (MPG)Fleet 20.5 29.0 31.5 39.0 19.0 25.0New Sales 21.0 38.0 35.0 43.0 20.0 29.0
Advanced ICE/Diesel % Sales 1% 42% 39% 57% 13% 22%
Light Duty Fuels (MBD) 9.5 8.8 3.7 3.6 1.8 7.9
Carbon Emissions (G Tonnes/Yr) 0.35 0.33 0.14 0.14 0.07 0.30
North America Europe Emerging AP
Cars/1000 730 855 395 460 15 100
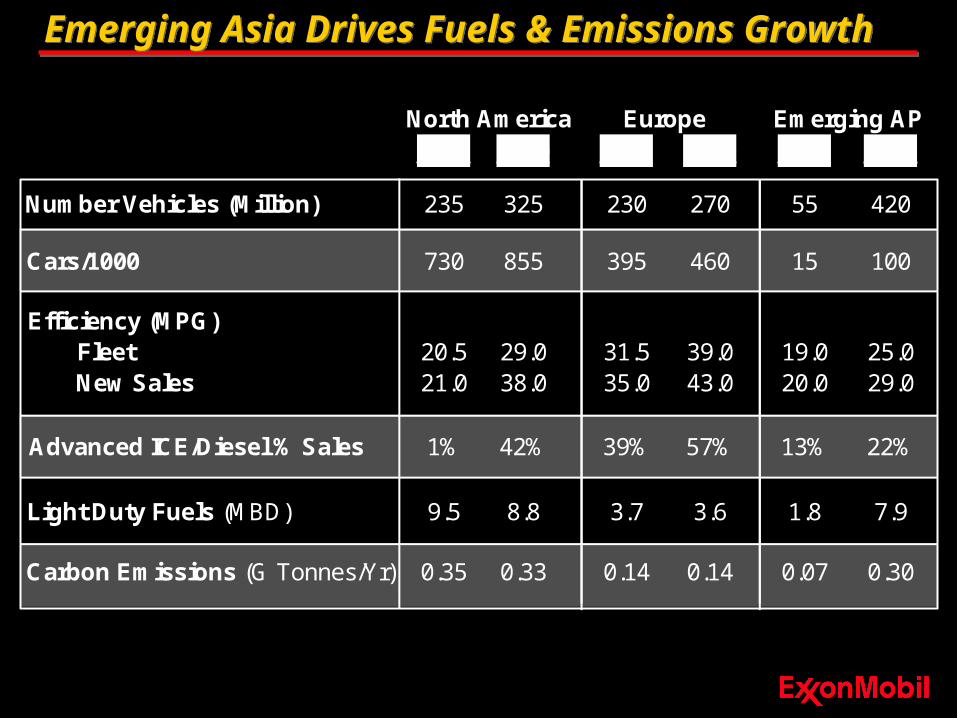
Emerging Asia Drives Fuels & Emissions GrowthEmerging Asia Drives Fuels & Emissions Growth
2003 2030 2003 2030 2003 2030
Number Vehicles (Million) 235 325 230 270 55 420
Efficiency (MPG)Fleet 20.5 29.0 31.5 39.0 19.0 25.0New Sales 21.0 38.0 35.0 43.0 20.0 29.0
Advanced ICE/Diesel % Sales 1% 42% 39% 57% 13% 22%
Light Duty Fuels (MBD) 9.5 8.8 3.7 3.6 1.8 7.9
Carbon Emissions (G Tonnes/Yr) 0.35 0.33 0.14 0.14 0.07 0.30
North America Europe Emerging AP
Cars/1000 730 855 395 460 15 100

Large Oil Resources ExistLarge Oil Resources Exist
Locations of Major DepositsTrillions ofBarrels
Oil in Place
0
2
4
6
8
ConventionalOil
EHO/OilSands
Oil Shale
Produced

World Liquids Production OutlookWorld Liquids Production Outlook
0
20
40
60
80
100
120
140
1980 1990 2000 2010 2020 2030
NonOPEC Crude + Condensate
NGL’s, OPEC Condensate, Other
MBDMBD
Canadian Oil Sands

World Liquids Production OutlookWorld Liquids Production Outlook
0
20
40
60
80
100
120
140
1980 1990 2000 2010 2020 2030
NonOPEC Crude + Condensate
NGL’s, OPEC Condensate, Other
MBDMBD
Canadian Oil Sands
Liquids Demand OPEC
2823
~30~41
~50
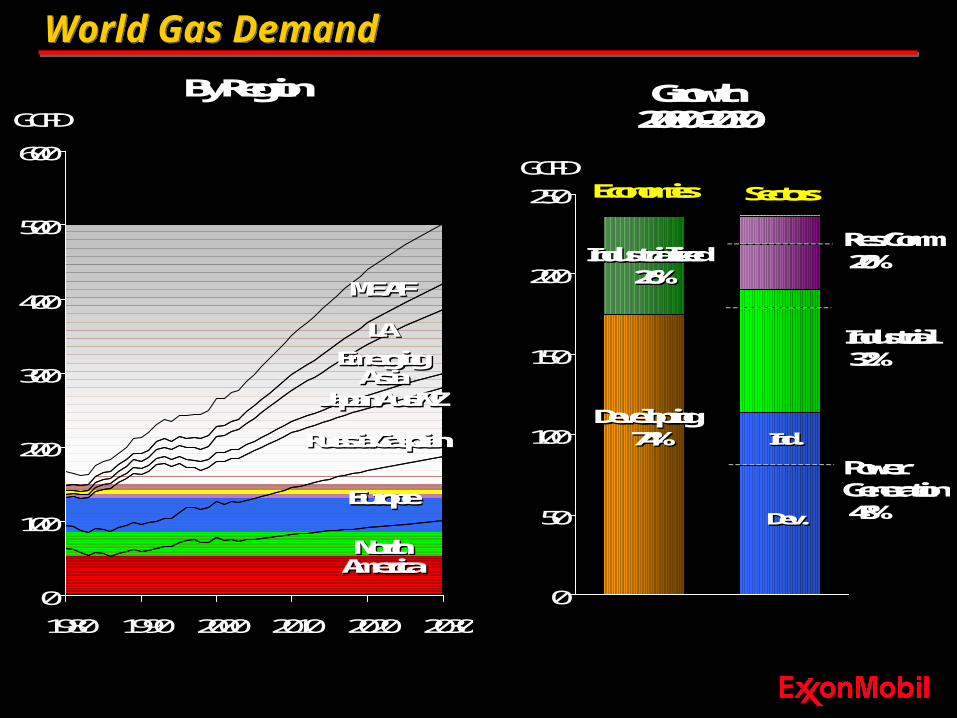
World Gas DemandWorld Gas Demand
0
100
200
300
400
500
600
1980 1990 2000 2010 2020 2030
EmergingAsia
EmergingAsia
By RegionGCFD
NorthAmericaNorth
America
EuropeEurope
Japan/Aus/NZJapan/Aus/NZ
LALA
ME/AFME/AF
Russia/CaspianRussia/Caspian
0
50
100
150
200
250GCFD
Growth2000-2030
Economies Sectors
Developing 74%
Developing 74%
Industrialized 26%
Industrialized 26%
Power Generation 48%
Res/Comm 20%
Industrial 32%
Ind.Ind.
Dev.Dev.

Gas Trade Grows Increasingly SignificantGas Trade Grows Increasingly Significant
Total Regional TradeNet Exports, GCFDNet Imports, GCFD & % Regional Demand
Total Regional TradeNet Exports, GCFDNet Imports, GCFD & % Regional Demand
2010 2020 20302010 2020 2030
North AmericaNorth America
Total EuropeTotal Europe
Russia/CaspianRussia/Caspian
Asia PacificAsia Pacific
Latin AmericaLatin America
AfricaAfricaMiddle EastMiddle East
53% 65% 70% 53% 65% 70%
48 85 11048 85 110
5 15 22 5 15 22
4 7 9 4 7 9
34 52 62 34 52 62 9 18 26 9 18 26
16 21 2516 21 2510 21 3110 21 31
18 36 45 18 36 45
9% 18% 21% 9% 18% 21%
10% 18% 24% 10% 18% 24%

Technology Critical to Extend ResourcesTechnology Critical to Extend Resources
• Exploration– 3-D seismic– Advanced interpretation
• Drilling– Extended horizontal reach– Complex well profiles
• Offshore– Deepwater drilling– Floating production units
• Reservoir Management– Digital reservoir simulation– Optimized drilling
• Field Development– Offshore arctic– Remote offtake
Sakhalin-1 Chayvo Field Development

Groundbreaking Research UnderwayGroundbreaking Research Underway
“The problems we faceare extraordinarily
complex in scope andscale. No one
university, no singlecompany, not even a
single country can solvethem all. That’s why this
project is important.”
John Hennessy,Stanford University
President
• $225 million over 10 years from:– ExxonMobil– General Electric– Schlumberger– Toyota
GCEP: Researching commercially viableenergy technologies that can substantially
reduce greenhouse gas emissions

Summary ConclusionsSummary Conclusions Economic growth generates increased demand for energy
Rising personal incomes and living standards in developing Asia Worldwide consumption grows to 335 MBDOE in 2030
Supporting demand growth requires accelerated efficiency gains Portfolio of consumer acceptable options must be progressed Efficiency gains aid compliance with environmental standards
Providing timely & adequate supplies is large scale, long term challenge Continued investment in new technology to provide economic supplies Uncertain access and pace for OPEC and Russia projects
Application of new technology best way to meet challenges Growing and developing the resource base Improving efficiency and reducing emissions
Diversity of energy mix increasing longer term Increasing opportunity for new coal, nuclear and bio-fuels
Economic growth compromised if supply or demand challenges not met


Supplemental/AlternateCharts

World Energy Demand Grows 1.7% Per YearWorld Energy Demand Grows 1.7% Per Year
0
50
100
150
200
250
300
350
1980 1990 2000 2010 2020 2030
EmergingAsia
EmergingAsia
By RegionMBDOE
NorthAmerica
NorthAmerica
EuropeEurope
Japan/Aus/NZJapan/Aus/NZ
LALA
ME/AFME/AF
Russia/CaspianRussia/Caspian

World Energy Demand Grows 1.7% Per YearWorld Energy Demand Grows 1.7% Per Year
0
50
100
150
200
250
300
350
1980 1990 2000 2010 2020 2030
EmergingAsia
EmergingAsia
By RegionMBDOE
NorthAmericaNorth
America
EuropeEurope
Japan/Aus/NZJapan/Aus/NZ
LALA
ME/AFME/AF
0
50
100
150
200
250
300
350
1980 1990 2000 2010 2020 2030
By FuelMBDOE
OilOil
GasGas
CoalCoal
NuclearNuclear
HydroHydro
Bio/MSWBio/MSW
Solar/WindSolar/Wind
Russia/CaspianRussia/Caspian

Transportation Demand Shapes the Oil BarrelTransportation Demand Shapes the Oil Barrel
1970 2000 2030
Transport RelatedTransport Related
58.5%58.5%
62.9%62.9%
Non-TransportNon-Transport46.946.9
76.576.5
116.7116.7
World Oil Demand Use (MBD)
45.5%45.5%

Transportation Demand Shapes the Oil BarrelTransportation Demand Shapes the Oil Barrel
1970 2000 2030
Trans RelatedTrans Related
45.5 58.5 62.9
Air, Rail, WaterAir, Rail, Water
RoadRoad
Non-TransportNon-Transport
World Oil Demand Use (MBD)
46.946.9
76.576.5
116.7116.7
Transport Share %

Carbon EmissionsCarbon Emissions
0
2
4
6
8
10
12
14
19902000201020202030
Developed
Developing
Bn TonnesCarbon
0
2
4
6
8
10
12
14
19902000201020202030
PowerIndustrialTransportRes/Comm
0
2
4
6
8
10
12
14
19902000201020202030
Gas
Oil
Coal
Bn TonnesCarbon
Bn TonnesCarbon

The Move to Deeper WaterThe Move to Deeper Water
Hoover/Diana-GOM4800 ft, 2000
Hondo-CA850 ft, 1976Hondo-CA850 ft, 1976
Harmony-CA1200 ft, 1989
Lena-GOM1000 ft, 1983
Zinc-GOM1480 ft, 1993
West Delta-GOM168 ft, 1962
West Delta-GOM168 ft, 1962
Mica-GOM4350 ft, 2001
Grand Isle-GOM50 ft, 1947
Kizomba A-Angola4000 ft, 2004

Key Technology Advancements in Mature FieldsKey Technology Advancements in Mature Fields
Key technology advancements
3D-Seismic
Greater Ability to image hydrocarbonsbelow the surface
Reservoir Modeling
Optimizing well locations
Directional Capability
Reaching out further with greateraccuracy
Background Production began in 1976 Number of slots 40 Number of wells drilled 80 Original EUR 600 MOEB Current produced OEB 1,150 MOEB Current forecast EUR 1,360 MOEB
Beryl Alpha Platform
Supplemental TransportDiscussion
Replace "Efficiency Gains Returns" chart with this block

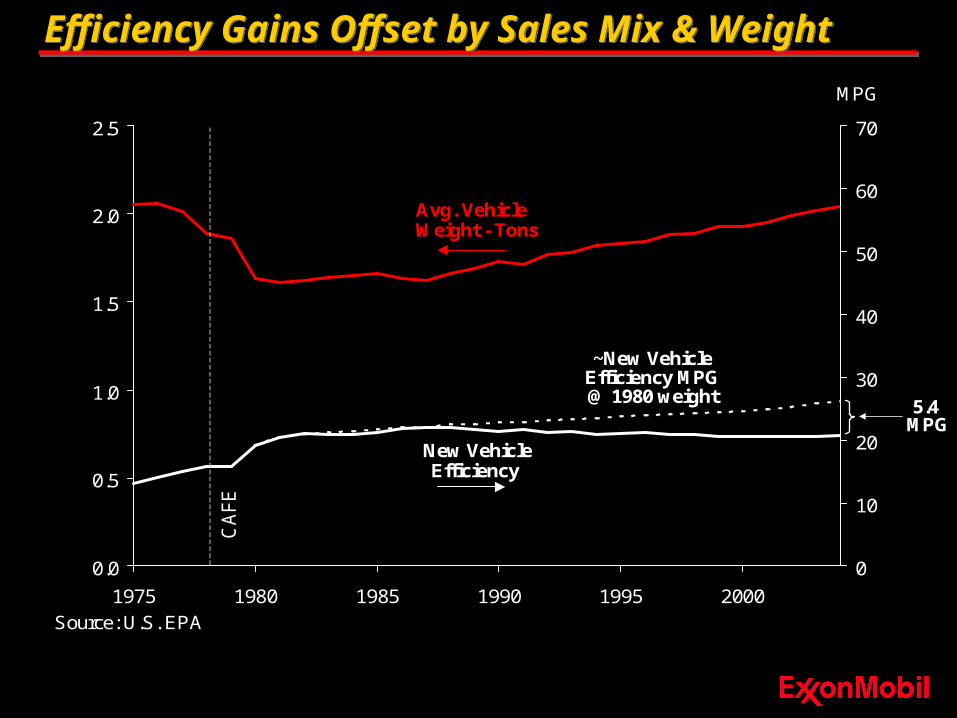
Efficiency Gains Offset by Sales Mix & WeightEfficiency Gains Offset by Sales Mix & Weight
MPG
0.0
0.5
1.0
1.5
2.0
2.5
1975 1980 1985 1990 1995 2000
0
10
20
30
40
50
60
70
CA
FE
Pickup/SUVSales Share
New VehicleEfficiency
Avg. Vehicle Weight - Tons
Source: U.S. EPA
Efficiency Gains Offset by Sales Mix & WeightEfficiency Gains Offset by Sales Mix & Weight
0.0
0.5
1.0
1.5
2.0
2.5
1975 1980 1985 1990 1995 2000
0
10
20
30
40
50
60
70
MPG
CA
FE
~New VehicleEfficiency MPG@ 1980 weight
Avg. Vehicle Weight - Tons
5.4 MPG
New VehicleEfficiency
Source: U.S. EPA

Efficiency Gains Offset by Sales Mix & WeightEfficiency Gains Offset by Sales Mix & Weight
0.0
0.5
1.0
1.5
2.0
2.5
1975 1980 1985 1990 1995 2000
0
10
20
30
40
50
60
70
MPG
CA
FE
New VehicleEfficiency
Avg. Vehicle Weight - Tons
Brent Crude Price2004 $
Source: U.S. EPA
Jul '04YTDAvg.