the outlook for forest products markets in europe and ... outlook for forest products markets in...
TRANSCRIPT

The outlook for forest products markets in Europe and implications for the profitability of plantation forestry in the United Kingdom1
Adrian Whiteman2
Food and Agriculture Organization of the United Nations, Vialle delle Terme di Caracalla,
00100 Rome, ITALY. E-mail: [email protected]. Website: www.fao.org.
SUMMARY This paper presents an overview of recent trends in forest products markets in Europe and describes how forest products markets may evolve over the next decade or so. It then discusses how these changes might affect the economics of forest plantation management and suggests how the forest sector might adapt to these developments. Forest products markets constantly adapt to changes in economic conditions, technology and government policies. In recent decades, changes in technology have had a profound impact on markets all over the World. These have led to changes in the availability of raw materials, most notably the increased supply of plantation grown wood. On the demand side, they have led to changes in the way that roundwood is processed to meet users demands, such as an increase in the use of reconstituted panels. In Europe, changes in government policies have also had a major impact on markets, particularly with the transition to market-based economies in Eastern Europe and, to a lesser extent, with the introduction of environmental policies and laws. The main challenge when trying to assess the impact of these changes is to determine how much of the impact is a short-term shock to the market and how much represents a long-term structural change. It seems likely that the currently depressed market conditions in Europe are largely a short-term phenomenon, although they may persist for several years. In the long-term, the increased use of technology to turn low quality wood into high value-added products will present a number of challenges and opportunities for the forest sector in the United Kingdom. The profitability of wood production in the United Kingdom is closely linked to the vitality of the domestic forest processing industry. The shift towards the greater importance of technology and skills in the industry should make the industry more competitive, but in the plantation sector it may result in an emphasis on quantity of production over quality. In broader terms, in a small, wealthy and densely populated island such as the United Kingdom, it is questionable whether growing trees for wood production is the most economic use of the resource at all. More effective commercialisation of forest services, in particular forest recreation, may provide a greater and more sustainable source of revenue for forest owners in the future. Keywords: supply and demand forecasts, forest plantations, forest economics
1 Paper presented to: “An industry reborn: the UK’s new forests”, UK Institute of Chartered Foresters
National Conference, 3-4 April 2003, Heriot Watt University, Edinburgh, Scotland. 2 The views expressed here are those of the author and do not imply the expression of any opinion
whatsoever on the part of the Food and Agriculture Organization of the United Nations concerning the legal status of any country, territory, city or area or of its authorities, or concerning the delimitation of its frontiers or boundaries.


1
INTRODUCTION Forecasts of the future supply and demand for wood and wood products are an important aid to planning and decision making in the forestry sector. Consequently, the Food and Agriculture Organization of the United Nations (FAO) carries-out periodic reviews of forest product markets in order to produce supply and demand forecasts. The forecasts presented here come from the latest of FAO's regional forestry sector outlook studies - the European Forest Sector Outlook Study or EFSOS. This study has been produced in collaboration with the United Nations Economic Commission for Europe (UNECE) and a number of experts from the UNECE region. The study is not quite completed yet and it will have to be reviewed by countries and other technical experts. However, it is sufficiently complete to give a broad indication of some of the most important trends that will affect the forestry sector in Europe in the near future. In addition to the presentation of the outlook, this paper presents an in-depth review of some of the recent trends that have affected forest products markets in the United Kingdom and Europe. This focuses mainly on the markets for solid wood products, in particular coniferous sawnwood, as this is the sector that is of most importance to forest plantation owners and managers in the United Kingdom. The paper also discusses a number of implications of this analysis for future developments in the market and forestry policy and management in the United Kingdom. The rest of this paper is in three main sections. The first section describes recent trends in forest products markets in the United Kingdom and Europe and highlights some of the main features of these trends. The second section presents the draft projections from EFSOS. The third section presents a more qualitative analysis of the trends and projections and discusses their implications for the future of the forestry sector in the United Kingdom.

2
RECENT TRENDS IN FOREST PRODUCTS MARKETS IN THE UNITED KINGDOM AND EUROPE Recent trends in industrial roundwood production in the United Kingdom A brief summary of the current status of industrial roundwood production in the United Kingdom is given in Table 1.3 As the table shows, coniferous roundwood accounts for the vast majority of domestic industrial roundwood production, with a share of about 94 percent of total production. In terms of product assortment, sawlogs account for more than half of total production (58 percent), with pulpwood (including roundwood used in the reconstituted wood products industry) accounting for 37 percent of total production. Other industrial roundwood (used for fencing, utility poles and round mining timber) currently accounts for about five percent of production.
Table 1 Composition of industrial roundwood production in the United Kingdom in 2001 by species group and product assortment
Product assortment Species group Sawlogs and veneer logs
Pulpwood Other industrial roundwood
Total
Coniferous 4.11 2.48 0.35 6.94 Non-coniferous 0.17 0.21 0.05 0.43 Total 4.28 2.70 0.40 7.38
Note: all of these figures are in million cubic metres underbark. Source: FAO (2003a).
Commercial forest plantations account for the majority of wood production in the United Kingdom. Therefore, the above table shows that the development of the market for coniferous roundwood and, in particular, the market for coniferous sawlogs is of major importance for the commercial viability of these investments. Furthermore, future trends in the management and utilisation of this resource is of interest to the domestic forest industry that has developed to process this wood. Recent trends in industrial roundwood production in the United Kingdom are shown below in Figure 1. This figure shows that total industrial roundwood production has increased from just over 5 million cubic metres underbark in 1986 to just over 7 million cubic metres underbark in 2001. However, behind this broad trend there have also been some changes in the composition of production. On average, the production of coniferous pulpwood and other industrial roundwood has increased by 3.6 percent per annum since 1986 and coniferous sawlog production has increased by 3.7 percent per annum. In contrast, the production of non-coniferous pulpwood and other industrial roundwood has grown by only 2.2 percent per annum over the period and the production of non-coniferous sawlogs has decreased by 4.9 percent per annum. The net effect of these changes has been that the proportion of non-coniferous production in total
3 For purposes of comparability between countries, FAO statistics are based on internationally agreed
terms, definitions and measurement conventions and these are used throughout this paper. Therefore, some of the statistics presented here may differ from sources such as Forestry Commission (2002a). For further details see FAO (2003b).

3
production has declined dramatically in recent years, but the overall product assortment has remained relatively unchanged. The figure also shows that production can deviate quite substantially from the underlying trend from year to year. An example of this is the short-term increase in production over the period 1988 to 1991 in response to the storm in Southern England in 1987. In particular, the effect of the storm is shown by the increased production of non-coniferous industrial roundwood during this period. Short-terms shocks to the market (such as this) have to be distinguished from structural changes in the market that may have a longer-term impact on the outlook for the sector. Figure 1 Recent trends in industrial roundwood production in the United Kingdom
0
1
2
3
4
5
6
7
8
1986 1987 1988 1989 1990 1991 1992 1993 1994 1995 1996 1997 1998 1999 2000 2001
Year
Prod
uctio
n (in
mill
ion
cubi
c m
etre
s und
erba
rk)
Non-coniferouspulpwood and otherindustrial roundwood
Non-coniferoussawlogs
Coniferous pulpwoodand other industrialroundwood
Coniferous sawlogs
Source: FAO (2003a). Industrial roundwood produced in the United Kingdom is used in three broad sectors of the forest industry. Sawlog production (58 percent of the total) is used to manufacture sawnwood, while pulpwood production is used to manufacture reconstituted wood products (particleboard and fibreboard) and wood pulp. With respect to the latter, about 24 percent of total industrial roundwood production (or 65 percent of pulpwood production) is used to make reconstituted wood panels and 13 percent of total industrial roundwood production is used for pulp production. There is also significant use of wood residues from the sawmilling industry and wood recovered from other sources in both of these sectors, which extends the use of the resource and increases the share of domestic production in total domestic consumption. As these figures show, industrial roundwood used in the solid wood products sector (sawnwood and wood based panels) is the most important component of the domestic market (accounting for 83 percent of total production) and this sector is the major driving force that underlies roundwood production from forest plantations.

4
Recent trends in the consumption of solid wood products in the United Kingdom Recent trends in the consumption of solid wood products in the United Kingdom are shown in Figure 2 below. This figure shows that total consumption has increased from about 14 million cubic metres (product volume) in 1996 to 16 million cubic metres in 2001. Figure 2 Recent trends in the consumption of solid wood products in the United
Kingdom and the domestic production of coniferous sawnwood
0
2
4
6
8
10
12
14
16
18
1986 1987 1988 1989 1990 1991 1992 1993 1994 1995 1996 1997 1998 1999 2000 2001
Year
Con
sum
ptio
n (in
mill
ion
cubi
c m
etre
s)
Fibreboard
Particleboard
Plywood andveneer sheets
Non-coniferoussawnwood
Coniferoussawnwood (imports)
Coniferoussawnwood (netUK production)
Source: FAO (2003a). This figure also shows a number of other interesting market developments in the recent past. Firstly, consumption of coniferous sawnwood has remained roughly constant at about 9.1 million cubic metres per annum. Secondly, the share of this consumption met by net domestic production (i.e. production minus exports) is also shown in this figure and has increased from 1.4 million cubic metres (16 percent of total sawnwood consumption) in 1996 to 2.2 million cubic metres (24 percent of consumption) in 2001. The third notable trend is the increased consumption of reconstituted wood products that has occurred since 1986, both in absolute and relative terms. Consumption of particleboard and fibreboard has increased from 2.8 million cubic metres in 1996 to 4.8 million cubic metres in 2001 and the increase in consumption of these products accounts for all of the growth in consumption in the solid wood products sector over the period. Thus, in relative terms, the share of reconstituted wood products in total consumption of solid wood products has increased from 20 percent to just under 30 percent over this period (see Figure 3). Given that the types of wood used to make sawnwood and reconstituted wood products are so different, these trends have interesting implications for the future consumption of industrial roundwood from forest plantations and the management of the resource.

5
Figure 3 The trend in consumption of reconstituted wood products as a proportion of total solid wood product consumption in the United Kingdom
0%
5%
10%
15%
20%
25%
30%
1986 1987 1988 1989 1990 1991 1992 1993 1994 1995 1996 1997 1998 1999 2000 2001
Year
Shar
e of
tota
l sol
id w
ood
cons
umpt
ion
Source: FAO (2003a). Recent trends in the consumption of paper and paperboard in the United Kingdom The pulp and paper sector is currently not a major driving force for the development of forest plantations in the United Kingdom, so recent trends in this sector will be only briefly reviewed here. Figure 4 shows recent trends in the total consumption of paper and paperboard in the United Kingdom. Total consumption has increased from 8 million metric tonnes in 1986 to just under 12 million metric tonnes in 2001, although growth seems to have paused over the last five years. The figure does not show the relative shares of the three main paper products in total consumption, because these have changed only slightly since 1986 and they are unlikely to have had a major impact on the use of industrial roundwood. Currently, newsprint consumption accounts for about 20 percent of total consumption, printing and writing paper accounts for about 40 percent of consumption and other paper and paperboard accounts for the remaining 40 percent of consumption. Since 1986, the proportion of printing and writing paper in total consumption has increased by ten percentage points at the expense of other paper and paperboard. This is the fastest growing sector of the market and probably accounts for much of the growth in total paper and paperboard consumption shown in this figure.

6
Figure 4 Recent trends in the consumption of paper and paperboard in the United Kingdom and the contribution of domestic production to consumption
0
1
2
3
4
5
6
7
8
9
10
11
12
1986 1987 1988 1989 1990 1991 1992 1993 1994 1995 1996 1997 1998 1999 2000 2001
Year
Con
sum
ptio
n (in
mill
ion
met
ric
tonn
es)
Imports
Produced fromimported fibrefurnish
Produced fromUK recoveredpaper
Produced fromUK pulpwood andresidues
Source: FAO (2003a). What the figure does show, however, is the proportion of total paper and paperboard consumption met by net domestic production and the contribution of domestic industrial roundwood production to this sector. Since 1986, the contribution of net domestic production (i.e. production minus exports) to total consumption has remained constant at about 40 percent and the use of recovered paper in the fibre input mix is the most notable feature of this trend. The contribution of recovered paper as an input to paper and paperboard production has increased from 32 percent of all inputs in 1986 to 52 percent in 2001. By simply using these proportions as an indication of the contribution of recovered paper to net domestic paper and paperboard production, the amount of paper and paperboard produced from recovered paper has increased from 1.1 million metric tonnes to 2.5 million metric tonnes over the period.4 In contrast, the use of imported fibre furnish and the domestic wood resource has remained relatively static, with each of these components accounting for just over 1 million metric tonnes per year of paper and paperboard production over the period. Considering that the consumption of wood to make pulp and paper includes the use of wood residues (which has increased in the past), this confirms the statement made above that this sector is not particularly important for forest plantation sector as a whole in the United Kingdom.
4 In reality, the amount of paper produced in the United Kingdom containing at least some recovered paper
in the input mix is probably much higher, because some production will contain less than 100 percent recycled fibre content. This simple assumption has been made to show the contribution of the different fibre sources to total paper and paperboard production.
7
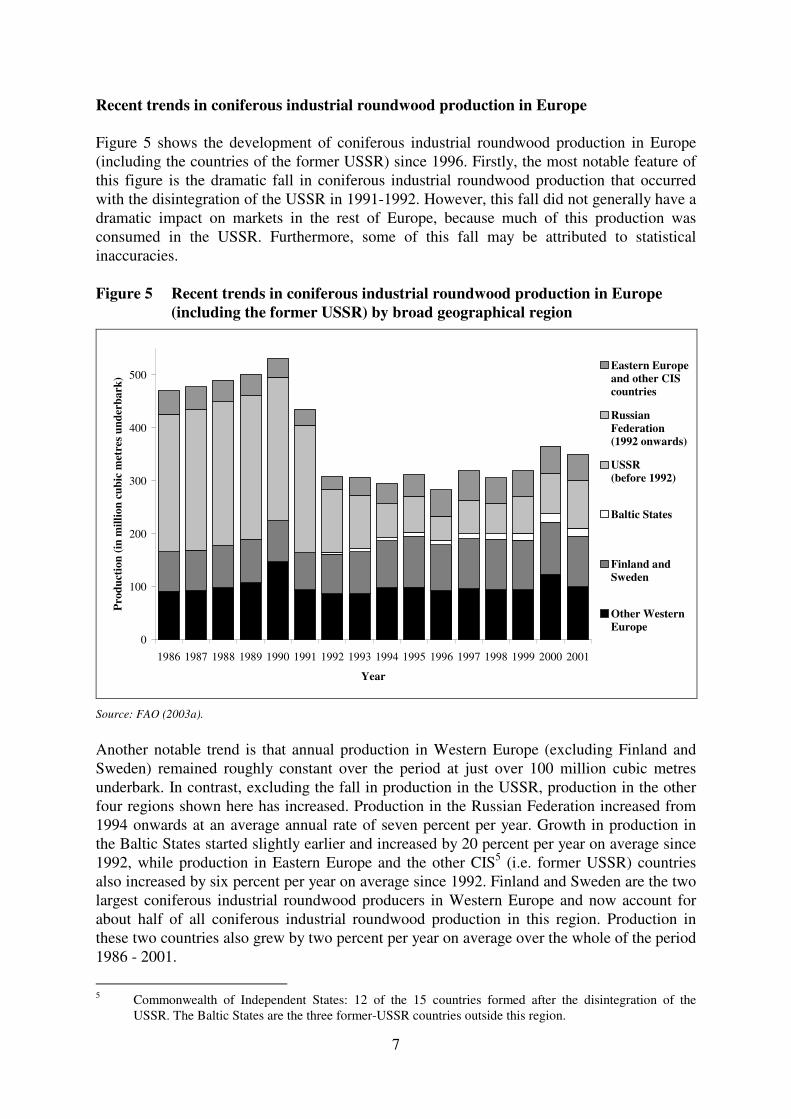
Recent trends in coniferous industrial roundwood production in Europe Figure 5 shows the development of coniferous industrial roundwood production in Europe (including the countries of the former USSR) since 1996. Firstly, the most notable feature of this figure is the dramatic fall in coniferous industrial roundwood production that occurred with the disintegration of the USSR in 1991-1992. However, this fall did not generally have a dramatic impact on markets in the rest of Europe, because much of this production was consumed in the USSR. Furthermore, some of this fall may be attributed to statistical inaccuracies. Figure 5 Recent trends in coniferous industrial roundwood production in Europe
(including the former USSR) by broad geographical region
0
100
200
300
400
500
1986 1987 1988 1989 1990 1991 1992 1993 1994 1995 1996 1997 1998 1999 2000 2001
Year
Prod
uctio
n (in
mill
ion
cubi
c m
etre
s und
erba
rk)
Eastern Europeand other CIScountries
RussianFederation(1992 onwards)
USSR (before 1992)
Baltic States
Finland andSweden
Other WesternEurope
Source: FAO (2003a). Another notable trend is that annual production in Western Europe (excluding Finland and Sweden) remained roughly constant over the period at just over 100 million cubic metres underbark. In contrast, excluding the fall in production in the USSR, production in the other four regions shown here has increased. Production in the Russian Federation increased from 1994 onwards at an average annual rate of seven percent per year. Growth in production in the Baltic States started slightly earlier and increased by 20 percent per year on average since 1992, while production in Eastern Europe and the other CIS5 (i.e. former USSR) countries also increased by six percent per year on average since 1992. Finland and Sweden are the two largest coniferous industrial roundwood producers in Western Europe and now account for about half of all coniferous industrial roundwood production in this region. Production in these two countries also grew by two percent per year on average over the whole of the period 1986 - 2001.
5 Commonwealth of Independent States: 12 of the 15 countries formed after the disintegration of the
USSR. The Baltic States are the three former-USSR countries outside this region.

8
Recent trends in coniferous sawnwood production and consumption in Europe Recent trends in coniferous sawnwood production in Europe are shown in Figure 6. Production of coniferous sawnwood in Finland and Sweden has increased by three percent per year on average over the whole period and production in the rest of Western Europe has increased by two percent per year on average. Production in the Baltic States has increased by 25 percent per year on average since 1992. The Russian Federation is the only region to show a sustained fall in production, with an average decrease in coniferous sawnwood production of four percent per year on average since 1994. Production in Eastern Europe and the other CIS countries has also not grown, but remained roughly constant since 1986. Figure 6 Recent trends in coniferous sawnwood production in Europe (including the
former USSR) by broad geographical region
0
20
40
60
80
100
120
140
160
180
1986 1987 1988 1989 1990 1991 1992 1993 1994 1995 1996 1997 1998 1999 2000 2001
Year
Prod
uctio
n (in
mill
ion
cubi
c m
etre
s pr
oduc
t vol
ume)
Eastern Europeand other CIScountries
RussianFederation(1992 onwards)
USSR (before 1992)
Baltic States
Finland andSweden
Other WesternEurope
Source: FAO (2003a). Comparing these trends with the trends in total coniferous industrial roundwood production, these figures suggest that the relative share of sawlogs in total coniferous industrial roundwood production has increased over the period. This could be due to several reasons. On the supply side, the restitution of large areas of mature forests in Eastern Europe and the Baltic States has undoubtedly increased the availability of sawlogs in these countries. In Western Europe, short-term effects such as storms may have increased the availability of sawlogs or it may be possible that a number of countries have experienced an increase in the availability of mature plantation-grown roundwood similar to the United Kingdom. In addition, some West European countries may be processing coniferous sawlogs imported from the East. Another possibility is that changes in the structure of industrial roundwood demand have led to these changes in coniferous sawnwood production. Many countries in Western Europe have introduced legislation and other measures to encourage the use of recovered paper and it

9
is possible that the increased use of recovered paper in paper and paperboard production has pushed some small-sized roundwood into sawnwood production that might have otherwise been used for pulp production. As the United Kingdom is a major importer of coniferous sawnwood, net trade in Europe is important because of the effect that this has on the availability of imports and price formation in the United Kingdom market. Figure 7 shows the recent trends in net trade in coniferous sawnwood by region and for the whole of Europe and the CIS countries. As this figure shows, production and consumption in the region was roughly in balance up until 1991, after which the region became a major net exporter of coniferous sawnwood to the rest of the World. Figure 7 Recent trends in net trade in coniferous sawnwood in Europe (including the
former USSR) by broad geographical region
-25
-20
-15
-10
-5
0
5
10
15
20
1986 1987 1988 1989 1990 1991 1992 1993 1994 1995 1996 1997 1998 1999 2000 2001
Year
Net
trad
e (in
mill
ion
cubi
c m
etre
s pro
duct
vol
ume)
Finland andSweden
All of Europeand CIScountriesRussianFederation(1992 onwards)USSR (before 1992)
Baltic States
Eastern Europeand other CIScountriesOther WesternEurope
Source: FAO (2003a). This change may be explained by a number of factors. Firstly, consumption of coniferous sawnwood in Western Europe (excluding Finland and Sweden) has grown, but by only slightly more than production in the region, so net imports to this region have not increased by very much. All of the other regions are net exporters of coniferous sawnwood and export mostly to Western Europe. Net exports from the Russian Federation, Eastern Europe and the other CIS countries have increased only slightly and mostly from a few East European countries closest to Western Europe. The two regions where net exports have increased substantially are Finland and Sweden and the Baltic States. Net exports of coniferous sawnwood from Finland and Sweden have increased by about 8 million cubic metres since 1990, while net exports from the Baltic States have increased by just over 3 million cubic metres. These two regions together would seem to account for most of the growth in net exports from the whole of Europe and the CIS countries, with Finland and Sweden in particular leading this change.

10
Recent trends in wood based panel production and consumption in Europe Figure 8 shows the recent trends in wood based panel production and consumption in Europe (including the former USSR) since 1986. With the exception of the decline in production and consumption during the disintegration of the USSR, the regional pattern of production and consumption has not changed by very much over the period. However, the structure of the market (in terms of product type) has changed and this is shown in the figure. Figure 8 Recent trends in wood based panel production and consumption in Europe
(including the former USSR) by product type
0
5
10
15
20
25
30
35
40
45
1986 1987 1988 1989 1990 1991 1992 1993 1994 1995 1996 1997 1998 1999 2000 2001
Year
Am
ount
(in
mill
ion
cubi
c m
etre
s pr
oduc
t vol
ume)
Particleboardproduction
Particleboardconsumption
Fibreboardproduction
Fibreboardconsumption
Plywoood andveneer sheetsproduction
Plywoood andveneer sheetsconsumption
Source: FAO (2003a). Overall, the whole of Europe and the CIS countries has changed from being a small net importer of wood based panels (2.6 million cubic metres in 1986) to a small net exporter (0.6 million cubic metres in 2001). By product type, the region is a net importer of plywood and veneer sheets and a small exporter of fibreboard. The region became a net exporter of particleboard in 1991 and net exports of particleboard now amount to 1.6 million cubic metres per year. Most of the change from net importer to net exporter can be attributed to the significant growth in production and exports of particleboard and, to a lesser extent, fibreboard. Overall production of wood based panels in the region has increased by an average of about two percent per year, from 47 million cubic metres in 1986 to 60 million cubic metres in 2001. However, as in the United Kingdom, this growth in production and consumption has varied by product type. Fibreboard production in the region has increased by five million cubic metres over the period and particleboard production has increased by eight million cubic metres. Together, these two products account for all of the growth in wood based panels production. The United Kingdom has contributed significantly to this growth in production in

11
the region, accounting for a 15 percent share of the growth in fibreboard production and a 20 percent share of the growth in particleboard production. Furthermore, as in the United Kingdom, the growth in consumption of these products has been far higher than the growth in consumption of coniferous sawnwood in the region, so reconstituted panels now account for a much larger share of the total solid wood products market in Europe than they did in 1986. Recent trends in the pulp and paper sector in Europe Recent trends in the pulp and paper sector in Europe (including the former USSR) are shown in Figure 9. The solid line in this figure shows the trend in consumption of paper and paperboard and the height of each bar shows the trend in total production. The segments of each bar show the contribution of the three main fibre sources to production. Figure 9 Recent trends in the production and consumption of paper and paperboard
in Europe (including the former USSR) and the contribution of different fibre sources to production
0
10
20
30
40
50
60
70
80
90
100
1986 1987 1988 1989 1990 1991 1992 1993 1994 1995 1996 1997 1998 1999 2000 2001
Year
Am
ount
(in
mill
ion
met
ric
tonn
es)
Production fromEuropeanrecovered paper
Production fromnet importedfibre furnish
Production fromEuropeanpulpwood andresidues
Consumption
Source: FAO (2003a). This figure shows that the region is a net exporter of paper and paperboard and that net exports have increased quite a lot, from 3 million metric tonnes in 1986 to 8 million metric tonnes in 2001. Consumption of paper and paperboard in the region has increased by an average of about two percent per year, from 65 million metric tonnes in 1986 to 88 million metric tonnes in 2001. Production has increased by slightly more than this, from 68 million metric tonnes in 1986 to 97 million metric tonnes in 2001. The composition of the three main fibre sources used to make paper and paperboard in the region show remarkably similar trends to those in the United Kingdom (shown in Figure 4) A

12
small amount of paper and paperboard is manufactured from pulp imported from outside the region and the amount of this has increased only very slightly, by about 1 million metric tonnes per annum. Pulp manufactured from pulpwood and wood residues in the region accounted for 42 million metric tonnes of paper and paperboard production in 1996 and this has increased slightly, to account for 48 million metric tonnes of paper and paperboard production in 1996. The highest growth in this sector has been in the manufacture of paper and paperboard from recovered paper. In 1986, approximately 22 million metric tonnes of paper and paperboard was manufactured from recovered paper (33 percent of total production). By 2001, this production had increased to 45 million metric tonnes or 46 percent of total production. Recent trends in trade and price formation in the United Kingdom This last part of this section examines recent trends in international trade with the United Kingdom and price formation. For most types of forest product, imports still account for a significant share of consumption in the United Kingdom. Therefore, the import prices of forest products have a significant impact on price formation in the domestic market and, consequently, the domestic selling price of roundwood. Figure 10 Recent trends in the share of coniferous sawnwood imports to the United
Kingdom by country
0%
5%
10%
15%
20%
25%
30%
35%
40%
45%
50%
55%
1986 1987 1988 1989 1990 1991 1992 1993 1994 1995 1996 1997 1998 1999 2000 2001
Year
Shar
e of
UK
impo
rts
Sweden
Latvia
Finland
USSR (RussianFederation from1992)
Estonia
Canada
Source: FAO (2003a). Imports of coniferous sawnwood account for the largest share of total forest products imports in the United Kingdom and Figure 10 shows trends in the share of this market held by the main countries exporting coniferous sawnwood to the United Kingdom. The most notable feature of these trends is that the supply of coniferous sawnwood imports has become more

13
concentrated amongst the top few suppliers and that, in general, the countries exporting to the United Kingdom are now geographically closer than they have been in the past. In 1986, four countries (Canada, the USSR, Sweden and Finland) accounted for about 70 percent of coniferous sawnwood imports into the United Kingdom. By 2001, two of these countries (Sweden and Finland) increased their market share in the United Kingdom. In the case of Sweden, this has been a dramatic increase with Swedish imports accounting for at least one-third of the imports to the United Kingdom for much of the 1990s. Currently, Latvia has joined these two countries as a major exporter of coniferous sawnwood to the United Kingdom and now these three countries together account for about 70 percent of the import market. In contrast, Canada and the Russian Federation have declined from being the two largest exporters of coniferous sawnwood to the United Kingdom to currently hold a share of only 10 percent of total imports between them. With respect to other forest products, the main exporters to the United Kingdom have not been concentrated amongst so few countries. Imports of wood based panels, paper and paperboard come from a variety of countries (mostly from Western Europe and North America) and the shares of total imports held by individual countries has not changed by very much. Figure 11 Recent trends in the contribution of domestic production to consumption in
the solid wood products markets in the United Kingdom
0%
10%
20%
30%
40%
50%
60%
70%
80%
90%
100%
1986 1987 1988 1989 1990 1991 1992 1993 1994 1995 1996 1997 1998 1999 2000 2001
Year
Shar
e of
tota
l con
sum
ptio
n
Coniferousindustrialroundwood
Non-coniferousindustrialroundwood
Particleboard
Fibreboard
Coniferoussawnwood
Non-coniferoussawnwood
Source: FAO (2003a). Another point worth noting is that, in the case of most forest products, the share of imports in the domestic market has declined over the period. As Figure 11 shows, domestic production of particleboard and fibreboard over the period 1986 - 2001 has increased substantially so that the United Kingdom now produces enough of these products to satisfy over half of domestic consumption. In addition, as already noted, coniferous sawnwood production now accounts

14
for about 25 percent of consumption. Thus, the United Kingdom is gradually becoming less dependent on imports to meet the demand for many types of forest product. Only in the case of non-coniferous sawnwood is domestic production falling by so much that imports are taking a larger share of this (declining) market. Figure 12 shows recent trends in real prices for a number of forest products in the United Kingdom. The grey lines show trends in international trade prices (measured on the left-hand vertical axis). These have been calculated by adding together the total value of United Kingdom imports and exports of each of these forest products in each year and dividing by the total volume of imports and exports for the same years. The black line shows the trend in coniferous standing sales prices in Great Britain as reported by the Forestry Commission (2002b). (These are measured on the right-hand vertical axis). All of the figures have been adjusted for inflation (i.e. converted to 2001 price levels). Figure 12 Recent trends in forest product prices in the United Kingdom
0
100
200
300
400
500
600
700
800
900
1986 1987 1988 1989 1990 1991 1992 1993 1994 1995 1996 1997 1998 1999 2000 2001
Year
Tra
de p
rice
(in
GB
P pe
r m
3 at 2
001
pric
es)
0
10
20
30
Stan
ding
pri
ce (i
n G
BP
per
m3 a
t 200
1 pr
ices
)
Non-coniferoussawnwood
Plywood
Fibreboard
Particleboard
Coniferoussawnwood
GB coniferstanding sales
Source: FAO (2003a) and Forestry Commission (2002b). The above figure shows that the international trade prices of all solid wood products have declined over the period in real terms. Non-coniferous sawnwood and plywood are generally the two most valuable solid wood products in the United Kingdom and are currently sold for just over GBP 300 per cubic metre. However, their prices have declined in real terms by one-third and one-quarter respectively since 1986. Fibreboard, particleboard and coniferous sawnwood prices have declined by similar amounts over the period. Fibreboard prices have declined by over one-third in real terms from just over GBP 300 per cubic metre in 1986 to just under GBP 200 per cubic metre in 2001. Particleboard prices have declined by about one-third over the period from GBP 210 to GBP 140 per cubic metre and sawnwood prices have also fallen by one-third from GBP 180 to GBP 120 per cubic metre.

15
The link between solid wood product prices and domestic roundwood prices is also shown very clearly in this figure. For example, the decline in coniferous sawnwood prices and particleboard prices between 1989 and 1991 would seem to explain the fall in standing sales prices over the same period. In addition, the peak in fibreboard and coniferous sawnwood prices in 1995 is matched by a peak in standing sales prices in the same year. Overall, standing sales prices in Great Britain have fallen by about two-thirds from an average of around GBP 22 per cubic metre in 1986 (at 2001 prices) to GBP 8 per cubic metre in 2001. Given that solid wood product prices have only fallen by about one-third over the same period, this would seem to suggest that changes in standing sales prices from year to year are roughly twice the corresponding changes in solid wood product prices. One final point worth noting is that the international trade price for coniferous sawnwood in the United Kingdom is now roughly equal to the average world trade price (see Figure 13). Historically, the price paid for coniferous sawnwood imported into the United Kingdom was higher than the average world trade price for coniferous sawnwood (about 20 percent higher over the period 1986 - 1998). In the last three years, however, this differential has disappeared. This could be due to a number of factors, including changes in the types of coniferous sawnwood imported into the United Kingdom, changes in the main trading partners with the United Kingdom and the increased domestic production of coniferous sawnwood. Given the current market conditions in the United Kingdom and Europe, it seems unlikely that this differential will reappear in the near future. Figure 13 Comparison of the international trade price for coniferous sawnwood in the
United Kingdom and the whole World
0
20
40
60
80
100
120
140
160
180
200
1986 1987 1988 1989 1990 1991 1992 1993 1994 1995 1996 1997 1998 1999 2000 2001
Year
Tra
de p
rice
(in
GB
P pe
r m
3 at
200
1 pr
ices
)
UK trade price
World trade price
Source: FAO (2003a).
16
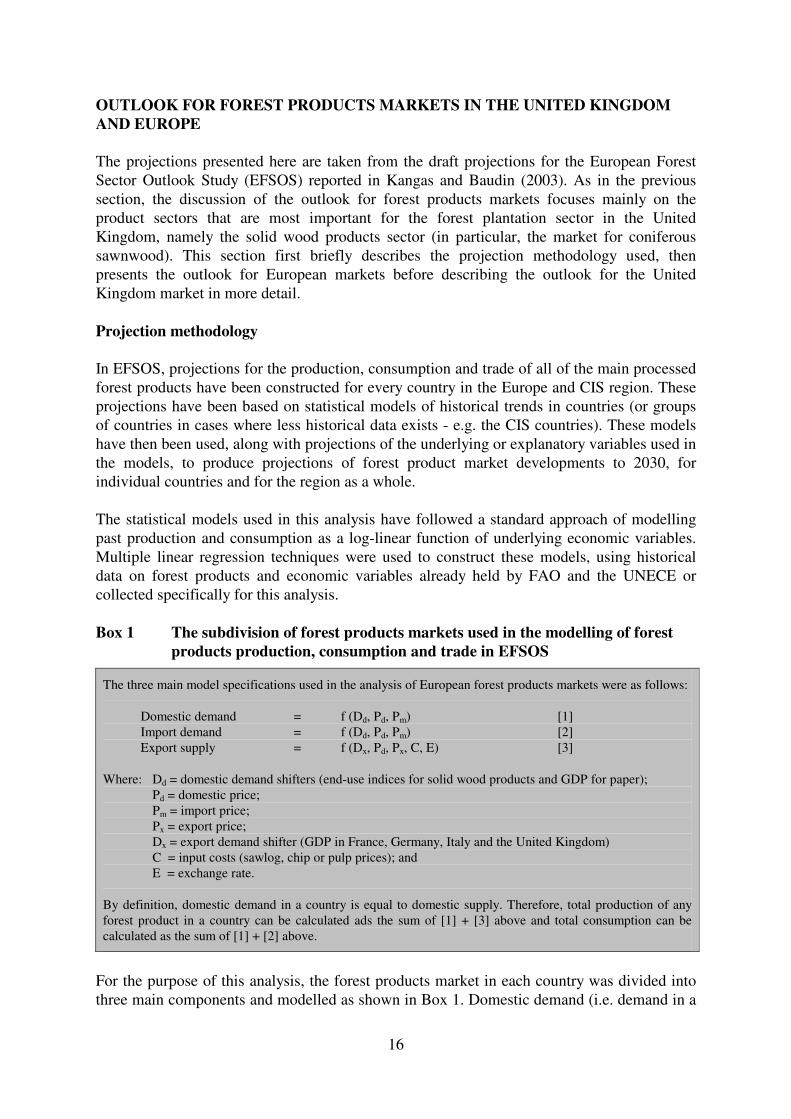
OUTLOOK FOR FOREST PRODUCTS MARKETS IN THE UNITED KINGDOM AND EUROPE The projections presented here are taken from the draft projections for the European Forest Sector Outlook Study (EFSOS) reported in Kangas and Baudin (2003). As in the previous section, the discussion of the outlook for forest products markets focuses mainly on the product sectors that are most important for the forest plantation sector in the United Kingdom, namely the solid wood products sector (in particular, the market for coniferous sawnwood). This section first briefly describes the projection methodology used, then presents the outlook for European markets before describing the outlook for the United Kingdom market in more detail. Projection methodology In EFSOS, projections for the production, consumption and trade of all of the main processed forest products have been constructed for every country in the Europe and CIS region. These projections have been based on statistical models of historical trends in countries (or groups of countries in cases where less historical data exists - e.g. the CIS countries). These models have then been used, along with projections of the underlying or explanatory variables used in the models, to produce projections of forest product market developments to 2030, for individual countries and for the region as a whole. The statistical models used in this analysis have followed a standard approach of modelling past production and consumption as a log-linear function of underlying economic variables. Multiple linear regression techniques were used to construct these models, using historical data on forest products and economic variables already held by FAO and the UNECE or collected specifically for this analysis. Box 1 The subdivision of forest products markets used in the modelling of forest
products production, consumption and trade in EFSOS
The three main model specifications used in the analysis of European forest products markets were as follows:
Domestic demand = f (Dd, Pd, Pm) [1] Import demand = f (Dd, Pd, Pm) [2] Export supply = f (Dx, Pd, Px, C, E) [3]
Where: Dd = domestic demand shifters (end-use indices for solid wood products and GDP for paper); Pd = domestic price; Pm = import price; Px = export price; Dx = export demand shifter (GDP in France, Germany, Italy and the United Kingdom) C = input costs (sawlog, chip or pulp prices); and E = exchange rate.
By definition, domestic demand in a country is equal to domestic supply. Therefore, total production of any forest product in a country can be calculated ads the sum of [1] + [3] above and total consumption can be calculated as the sum of [1] + [2] above.
For the purpose of this analysis, the forest products market in each country was divided into three main components and modelled as shown in Box 1. Domestic demand (i.e. demand in a

17
country for a product that has been produced in that country) was modelled as a function of prices (domestic and import prices) and a demand shifter (i.e. a variable that increases or decreases demand or shifts the demand curve, irrespectively of any price movements). For solid wood products, end-use indices were used as the demand shifter.6 For paper and paperboard products, GDP was used as the demand shifter. The demand for imports was modelled using the same model specification. The supply of exports was modelled using domestic and export prices and an export demand shifter (i.e. a variable that shifts demand in other countries for exports from a country). The combined GDPs of the four largest economies in Europe (France, Germany, Italy and the United Kingdom) were used for this purpose. The costs of raw material inputs were also used in this model (i.e. the prices of sawlogs, chips and pulp for the sawnwood and plywood, reconstituted panels and paper sectors respectively) along with exchange rates. Total consumption and production in a country can be calculated from the results of these models as the sum of domestic demand plus import demand and the sum domestic demand plus export supply respectively. These models were only used to produce projections for the consumption, production and trade (imports and exports) of processed products, namely: coniferous and non-coniferous sawnwood; plywood; fibreboard; particleboard; newsprint; printing and writing paper; and other paper and paperboard. Production and consumption of intermediate products (such as pulp) and raw materials (such as sawlogs, pulpwood, recovered paper and particles) must be derived from these projections using technical conversion factors. An interesting feature of this approach is that only economic variables are used to make projections of the production of processed forest products. This is in contrast to models such as FAO’s Global Forest Products Model, which uses potential raw material (i.e. industrial roundwood) supply as a supply shifter, which is then transformed into a supply curve for the production of processed products using a series of conversion factors and estimates of manufacturing costs (Tomberlin et al, 1999). It is also more sophisticated than previous models of the forest products market in the United Kingdom (for example, Whiteman, 1991 and 1996), where estimates of processed forest product demand were simply converted into wood raw material equivalents for comparison with roundwood production forecasts. However, this approach is not without problems. The greatest problem is that, by excluding the availability of raw material supplies from the analysis and by relying solely on economic variables to project production, it is possible that the resulting projections will be implausible when compared with the availability of raw material supplies. This may be less of a problem for the countries in Europe with abundant forest resources (e.g. Sweden, Finland and the Russian Federation), which have lots of flexibility in supply and are less constrained by the availability of resources. But, for countries that are already producing roundwood at levels close to the sustainable level of supply (e.g. some of the Baltic States), the model may overestimate future production. Furthermore, for countries with a maturing forest plantation resource (e.g. the United Kingdom and Ireland), the model may fail to account for the possible supply-push that will come in the future as these resources mature.
6 End-use indices were calculated as weighted indices of output for the major users of each solid wood
product (e.g. the construction and furniture industries).

18
Outlook for coniferous sawnwood production and consumption in Europe The outlook for coniferous sawnwood production and consumption in Europe (including the former USSR) is shown in Figure 14. The solid line in this figure shows the outlook for consumption and the height of each bar shows the outlook for total production. The segments of each bar show the outlook for production by broad geographical region. Figure 14 Outlook for coniferous sawnwood production and consumption in Europe
(including the former USSR) by broad geographical region
0
20
40
60
80
100
120
140
160
180
1986 1991 1996 2001 2006 2011 2016 2021
Year
Prod
uctio
n (in
mill
ion
cubi
c m
etre
s pr
oduc
t vol
ume)
Eastern Europe
and other CIScountries
RussianFederation(1992 onwards)
USSR (before 1992)
Baltic States
Finland andSweden
Other WesternEurope
Consumption
Source: historical data: FAO (2003a); projections: Kangas and Baudin (2003). As the figure shows, the region is expected to remain a net exporter of coniferous sawnwood over the next 20 years, with net exports increasing from the current level of 10 million cubic metres (product volume) per annum to just over 30 million cubic metres per annum in 2021. Growth in coniferous sawnwood production is expected to be highest in Eastern Europe and the CIS countries, while much lower growth in production is expected in Western Europe. Over the period 2001 - 2021, growth in coniferous sawnwood production in Finland and Sweden and the rest of Western Europe is expected to amount to only one percent per annum on average. Growth in production in the Baltic States and the rest of Eastern Europe and CIS countries is expected to amount to 2.6 percent and 2.3 percent per annum respectively. The highest rate of growth in coniferous sawnwood production is expected in the Russian Federation, where production is projected to increase by 5.5 percent per annum over the period. However, this figure must be treated with some caution, considering the trend of declining production reported over the last decade and the uncertainty about the outlook for the Russian economy. The increase in net exports from the region can be explained by the combination of these high rates of growth in production and much lower rates of growth in consumption (on average,

19
consumption is expected to grow at only 2.3 percent per annum for the region as a whole over the period). The projections of production and consumption by region also suggest that Western Europe will remain a large net importer of coniferous sawnwood over the period and that net exports from the Russian Federation, Baltic States and the rest of Eastern Europe and CIS countries will increase over the period. Outlook for wood based panel production and consumption in Europe The outlook for wood based panel production and consumption in Europe (including the former USSR) is shown in Figure 15. Figure 15 Outlook for wood based panel production and consumption in Europe
(including the former USSR) by product type
0
10
20
30
40
50
60
70
1986 1991 1996 2001 2006 2011 2016 2021
Year
Am
ount
(in
mill
ion
cubi
c m
etre
s pro
duct
vol
ume)
Particleboardproduction
Particleboardconsumption
Fibreboardproduction
Fibreboardconsumption
Plywood andveneer sheetsproduction
Plywood andveneer sheetsconsumption
Source: historical data: FAO (2003a); projections: Kangas and Baudin (2003). The most striking feature of these projections is the expected increase in production and consumption of both particleboard and fibreboard over the period 2001 - 2021. Growth in the use of these two products is expected to be far higher than for any of the other types of solid wood product, with average annual growth rates in production and consumption of 2.5 percent per annum for both types of product. With these high growth rates, these two reconstituted panels are expected to take a 35 percent share of the total solid wood products market by 2021. The overall balance between production and consumption of wood based panels in the region is expected to remain relatively unchanged, with a small amount of net imports of plywood into the region and relatively small amounts of net exports of particleboard and fibreboard. Overall, net exports of wood based panels from the region are expected to increase slightly to 5 million cubic metres per annum in 2021. However, in contrast to the outlook for coniferous sawnwood, the regional balance of production and consumption is not expected to change by

20
very much over the period. Production will expand faster than consumption in all major regions, such that net exports from Eastern Europe and the CIS countries will increase over the period while net imports to Western Europe will decline. Outlook for paper and paperboard production and consumption in Europe The outlook for paper and paperboard production and consumption in Europe is shown in Figure 16. Total consumption is expected to increase by 2.7 percent per annum over the period or from 88 million metric tonnes in 2001 to 155 million metric tonnes in 2021. Production is expected to increase by the same amount, such that net exports from the region remain relatively unchanged at about 8 million metric tonnes per annum. Figure 16 Outlook for paper and paperboard consumption and production in Europe
(including the former USSR)
0
20
40
60
80
100
120
140
160
180
1986 1991 1996 2001 2006 2011 2016 2021
Year
Am
ount
(in
mill
ion
met
ric
tonn
es)
Production
Consumption
Source: historical data: FAO (2003a); projections: Kangas and Baudin (2003). By product type, growth in production and consumption of printing and writing paper is expected to account for the majority of growth in the paper and paperboard sector, with relatively low rates of growth for newsprint and other paper and paperboard. In terms of the regional distribution of production and consumption, the outlook suggests that some significant shifts will occur in the balance of production and consumption in the different regions of Europe and the CIS countries. Consumption will increase faster than production in Western and Eastern Europe such that net exports from Western Europe will decline over the period and net imports into Eastern Europe will increase. In the CIS countries the opposite will occur as production will grow faster than consumption and net exports from this region will increase to offset the decline in net trade in the other two regions.

21
Outlook for production and consumption of solid wood products in the United Kingdom The outlook for the production and consumption of solid wood products in the United Kingdom is shown in Table 2 below. Table 2 Outlook for the production and consumption of solid wood products in the
United Kingdom by type of product Projections (5-year average) Product Actual
2001 2002 - 2006 2007 - 2011 2012 - 2016 2017 - 2021 Production Coniferous sawnwood 2.4 2.5 2.6 2.7 2.8 Non-coniferous sawnwood 0.1 0.1 0.1 0.1 0.1 Plywood and veneer sheets 0.0 0.0 0.0 0.0 0.0 Particleboard 2.5 2.6 2.9 3.1 3.3 Fibreboard 0.8 0.7 0.8 0.9 1.0 Consumption Coniferous sawnwood 9.4 9.8 10.1 10.4 10.8 Non-coniferous sawnwood 0.8 0.7 0.8 0.8 0.9 Plywood and veneer sheets 1.5 1.0 1.1 1.1 1.1 Particleboard 3.5 3.6 3.8 4.1 4.3 Fibreboard 1.3 1.5 1.7 1.8 2.0
Note: all of these figures are in million cubic metres product volume. Source: historical data: FAO (2003a); projections: Kangas and Baudin (2003). In terms of consumption, the most important features of the outlook are as follows:
� Annual consumption of coniferous sawnwood is expected to increase over the next 20 years by 1.4 million cubic metres (product volume) or about 0.6 percent per annum. This would represent a return to growth in this sector compared with the trend of zero growth in the recent past.
� Consumption of non-coniferous sawnwood is expected to increase very slightly in
the future, although this may be considered uncertain in light of the downward trend in consumption in the past.
� Consumption of reconstituted panels is expected to continue growing strongly,
with average annual growth rates of 1.3 percent and 1.7 percent for particleboard and fibreboard respectively. By 2021, consumption of particleboard and fibreboard are expected to increase to 4.3 million cubic metres and 2.0 million cubic metres respectively and account for 35 percent of the total market for solid wood products in the United Kingdom (see also Figure 17).
In terms of the production of processed forest products, the most notable features of the outlook are the following:
� Annual production of coniferous sawnwood is expected to increase only slightly over the next 20 years, by about 0.4 million cubic metres (product volume) per annum. Thus, the United Kingdom is expected to remain a major net importer of coniferous sawnwood.

22
� Annual production of non-coniferous sawnwood is expected to remain constant at about 0.1 million cubic metres per annum and net imports are expected to increase slightly due to the small amount of growth in consumption projected for this sector in the future.
� Production of particleboard is expected to increase by 1.5 percent per annum to
3.8 million cubic metres by 2021. This rate of growth is higher than the expected rate of growth in consumption, so the level of net imports of particleboard into the United Kingdom is expected to continue to decline.
� Production of fibreboard is expected to increase by 2.6 percent per annum to
1.3 million cubic metres by 2021. This rate of growth is also higher than the expected rate of growth in consumption, such that the trend in net imports of fibreboard will continue to decline. Fibreboard production in the United Kingdom currently accounts for more than 50 percent of consumption, but this level is above the long-term historical trend. The projection for fibreboard production starts from a lower level of production, but confirms that domestic industry will probably meet around 50 percent of the country’s needs for fibreboard (and possibly more) in the foreseeable future (see Figure 18).
Outlook for the paper and paperboard sector in the United Kingdom Table 3 shows the outlook for the production and consumption of paper and paperboard in the United Kingdom to 2021. This shows that both production and consumption are expected to grow significantly over the next 20 years, by 1.9 percent per annum and 2.2 percent per annum respectively. However, the overall contribution of net domestic production to consumption is expected to remain the same as in the past, at around 40 percent. Projections for the use of raw materials have not been produced as part of EFSOS yet, but it can be expected that recovered paper will continue to be the main source of fibre furnish used in the paper and paperboard industry in the United Kingdom and may even increase in the future relative to other fibre sources. Table 3 Outlook for the production and consumption of paper and paperboard in
the United Kingdom by market segment Projections (5-year average) Market segment Actual 2001
2002 - 2006 2007 - 2011 2012 - 2016 2017 - 2021 Net domestic production 4.7 5.1 5.7 6.2 6.9 Exports 1.8 1.9 2.1 2.3 2.6 Total domestic production 6.5 7.1 7.8 8.6 9.4 Consumption 11.9 12.5 14.0 15.7 17.5 Net domestic production as a proportion of consumption 40% 41% 40% 40% 39%

23
Figure 17 Outlook for the consumption of solid wood products in the United Kingdom and the domestic production of coniferous sawnwood
0
2
4
6
8
10
12
14
16
18
20
1986 1991 1996 2001 2006 2011 2016 2021
Year
Con
sum
ptio
n (in
mill
ion
cubi
c m
etre
s)
Fibreboard
Particleboard
Plywood andveneer sheets
Non-coniferoussawnwood
Coniferoussawnwood (imports)
Coniferoussawnwood (netUK production)
Source: historical data: FAO (2003a); projections: Kangas and Baudin (2003). Figure 18 Trends and projections for the contribution of domestic production to
consumption in the solid wood products markets in the United Kingdom
0%
10%
20%
30%
40%
50%
60%
70%
80%
1986 1991 1996 2001 2006 2011 2016 2021
Year
Shar
e of
tota
l con
sum
ptio
n
Particleboard
Fibreboard
Coniferoussawnwood
Non-coniferoussawnwood
Source: historical data: FAO (2003a); projections: Kangas and Baudin (2003).

24
Outlook for industrial roundwood production and consumption in the United Kingdom Although the draft projections for EFSOS do not include projections for the production and consumption of industrial roundwood, an attempt has been made here to convert the projections of the production of processed products into projections of demand for standing roundwood. With respect to this, the following assumptions have been made:
� Technical conversion factors for the amount of industrial roundwood required to make one unit of each of the forest products have been calculated from the historical figures on industrial roundwood consumption and processed product production from 1986 to 2001. The average of the historical conversion factors over this period has been used for the projections and it has been assumed that they will not change in the future.
� The calculation of demand for pulpwood assumes that 100 percent of the residues
from the sawmilling industry will be used in other parts of the forest processing sector. It assumes that the production (and use) of recovered paper will be equal to a fixed proportion of paper and paperboard consumption, which has been calculated as the average of this proportion over the period 1986 to 2001. It also assumes that a small amount of pulp imports will persist in the future at a level equal to the historical average.
� Because all FAO statistics are recorded in terms of the production of industrial
roundwood in cubic metres underbark, the estimated demand for industrial roundwood has been converted into an equivalent volume of standing roundwood removals, to make these figures comparable with Forestry Commission production forecasts. This has been done by comparing FAO and Forestry Commission statistics over the period 1996 to 2000. On average, the historical difference between these two sources is about 30 percent, which can be accounted for by harvesting losses, the difference between underbark and overbark measures, the small amount of fuelwood produced in the United Kingdom and the fact that FAO statistics are for the United Kingdom while the Forestry Commission production forecast is for Great Britain only.
The latest Forestry Commission forecast for softwood (i.e. coniferous roundwood) availability is published in Forestry Commission (2002a). This is presented in Figure 19,7 along with the projections of demand for coniferous sawlogs and pulpwood derived from the EFSOS projections for processed product production (as explained above). These projections show that the forecast for softwood availability and projections of derived demand for coniferous industrial roundwood follow quite different paths in the future. By 2021, the forecast for softwood availability increases to 15.9 million cubic metres overbark, while the projection for derived demand only increases to 11.5 million cubic metres overbark.
7 The Forestry Commission presents the forecast for softwood availability as average figures for five-year
periods. For the purpose of comparison, these have been converted to annual figures by using these figures for the mid-points of each of the five year periods and smoothing the intervening years by linear extrapolation.

25
This difference of 4.4 million cubic metres overbark is equal to a surplus of available industrial roundwood amounting to about 40 percent more roundwood than will be required. Figure 19 Outlook for coniferous industrial roundwood availability and demand in the
United Kingdom
0
2
4
6
8
10
12
14
16
1996 2001 2006 2011 2016 2021
Year
Am
ount
(in
mill
ion
cubi
c m
etre
s ove
rbar
k)
Pulpwood demand
Sawlog demand
Forecast availability
Source: forecast removals: Forestry Commission (2002a); demand projections: author’s own estimates derived from Kangas and Baudin (2003).

26
INTERPRETATION OF THE MARKET TRENDS AND OUTLOOK AND IMPLICATIONS FOR THE FORESTRY SECTOR IN THE UNITED KINGDOM Changes in production and consumption - short-terms shocks or structural shifts? A major challenge when trying to analyse trends in forest products markets is to differentiate between short-term shocks to the market and longer-term structural shifts in the market. The former can distort production, consumption, trade and prices for a short period, but should not be used as a basis for long-term decision-making. The latter, however, can have a much more profound impact on markets and should be taken into account when planning future forest management regimes and forestry policies. Figure 20 Comparison of historical forecasts and actual consumption of solid wood
products in the United Kingdom
0
2
4
6
8
10
12
14
16
18
1986 1987 1988 1989 1990 1991 1992 1993 1994 1995 1996 1997 1998 1999 2000 2001
Year
Con
sum
ptio
n (in
mill
ion
cubi
c m
etre
s)
All solid woodproducts
Sawnwoodand plywood
Reconstitutedwood products
Source: historical data: FAO (2003a); forecasts: Whiteman (1996). One way to look for structural shifts in markets is to compare previous forecasts for production and consumption with what actually happened in markets in the past. Such a comparison is made in Figure 20, which compares forecasts for solid wood product consumption in the United Kingdom made in the early-1990s (Whiteman, 1996) with historical data over the time period 1986 - 2001. As the figure shows, total consumption of solid wood products has been roughly within the range of the forecast given in 1996, with six points falling within the high and low range of the forecast, four points falling above it and six points falling below it. Generally, the trend in actual consumption has been within the range of the forecast, but probably closer to the lower boundary of the forecast than the higher boundary. Thus, total solid wood product consumption has increased roughly in line with the forecast made in 1996 on the basis of the projections of the underlying economic variables.

27
However, the two sets of lines below this in the figure tell a very different story. Actual consumption of sawnwood and plywood has been below the range of the forecast made in 1996 for the majority of years during this period. Furthermore, the trend in consumption is flat or even decreasing compared with the forecast of rising consumption. Conversely, actual consumption of reconstituted panels has been consistently above the forecast made in 1996. These differences are a clear indication that there has been a structural change in the solid wood products market, which has caused a change in the pattern of consumption that can not be explained by changes in the underlying economic variables used in these models. The most obvious explanation behind this structural shift is technological change, which has enabled reconstituted panels to be produced more easily and meet a broader range of end-uses. There are two other structural shifts that have occurred in forest products markets over the last decade or so. The first is the increased consumption of printing and writing paper, which has been far higher than most forecasters have predicted in the past. This has probably also arisen as a result of technological change, in this case due to the greater use of microcomputers in homes and offices in the United Kingdom over the last decade. Far from replacing printed media, the increased use of computers has created a level of demand for computer printer paper that was far higher than expected. The second structural shift has been the greater use of recovered paper as an input to paper and paperboard manufacturing. To a large extent this has been driven by recycling policy and legislation in many European countries, which has dramatically increased the availability of recovered paper. As noted above, this change may also have had an impact on sawnwood markets as increasingly smaller dimensions of roundwood may have been used for sawnwood production rather than pulp production in some European countries. Because most of these changes have occurred over the last ten years and are now well established, it is likely that the models constructed for EFSOS will have captured the impact of these shifts. Therefore, the projections in EFSOS should reflect the new technologies currently being used in the European forest sector. The one area where current circumstances may be only a temporary shock to the market is the apparent abundance of sawlogs in some of the Baltic States and the currently very high levels of sawnwood production there. Table 4 shows the current level of coniferous industrial roundwood production in the largest producer countries in Europe and compares this to the forest resource statistics recently collected in the Global Forest Resource Assessment (UN, 2000). This table shows that Latvia and Estonia both have a high proportion of mature forest areas within their total forest estate and that they are currently harvesting coniferous industrial roundwood at a rate that is higher than the net annual increment (NAI) of their forest available for wood supply. Based on these figures, it would seem likely that current levels of production in these two countries may be difficult to sustain in the future. Looking at this table more broadly, these statistics also suggest that it may be difficult for Sweden and Finland to increase production significantly in the future. It should be noted that the production statistics reported here are in cubic metres underbark (UB) while the NAI is

28
measured in terms of standing roundwood volume overbark (OB). Considering the differences between these two measures due to the UB-OB conversion, harvesting losses and the production of fuelwood, it may be difficult to increase the former to more than 75 percent of the latter. On the other hand, this table also shows the huge potential for increased production in the Russian Federation. Table 4 Comparison between current coniferous industrial roundwood production
and the status of the forest resource in major European producer countries Country Coniferous industrial
roundwood production in 2001
(in million m3 UB)
NAI of coniferous forest available for
wood supply (in million m3 OB)
Production as a proportion
of NAI
Proportion of coniferous forest available for wood supply over 40 years old
Russian Federation 89.9 464.0 19% 82% Sweden 53.6 71.5 75% 48% Finland 41.7 56.6 74% 65% Germany 27.1 63.5 43% n.a. France 23.6 39.5 60% 43% Poland 17.4 33.1 53% 55% Czech Republic 12.0 17.1 70% 64% Austria 9.7 21.9 44% 55% Spain 8.3 16.7 50% n.a. Latvia 7.7 6.4 120% 64% Norway 7.6 17.5 44% 60% United Kingdom 6.9 12.7 55% 19% Estonia 5.7 4.1 140% 66% Portugal 5.0 7.9 63% 93%
Source: production data: FAO (2003a); forest resource data: UN (2000). Currently low prices for forest products - will they last for ever? Another concern of forest managers is the currently low prices for roundwood. The United Kingdom is not alone in this respect, as all over Europe countries are facing the same depressed levels of prices in forest product and roundwood markets. In the United Kingdom, this can probably be explained by a number of factors, including:
� depressed forest product prices throughout the rest of Europe; � flat demand for sawnwood in the United Kingdom, in the face of competition
from other products; � changes in foreign suppliers from high-cost to low-cost producers; and � supply push - the increased availability of domestic roundwood supplies as forest
plantations mature. The answer to the question of whether prices will remain depressed will depend upon how the forest sector responds to these changes. On the supply side, as already noted, some European production can be attributed to the restitution of forest areas to private individuals. In many cases, these individuals are thinning over-mature crops to earn windfall profits. Already it

29
seems that this can not be sustained for much longer in some countries. Furthermore, FAO have carried-out some investment appraisals in a number of East European countries which have shown that, at current prices, the returns from clear felling and replanting are not economically viable. Thus, it would seem likely that prices will recover at some time in the future as the opportunities for windfall gains decline and forest managers have to start to take more account of forest management costs. However, it may take several years for these events to occur. Sensitivity analysis of the EFSOS projections The projections presented earlier are the baseline projections that have been produced as part of EFSOS. In addition to these, EFSOS also includes two alternative scenarios representing faster economic integration in Europe in the future and greater emphasis on forest conservation in the future. As these titles suggest, the main differences between these two alternative scenarios and the baseline scenario are generally higher projections of production and consumption in the integration scenario and lower projections in the conservation scenario. In addition to these alternatives, it is also possible to make some more speculative remarks about what might happen in European forest products markets in the future. There are many possible changes that might occur and have an effect on forest products markets in the future. Of these, the following might be given the most consideration:
� Policy changes - renewable energy policy in the European Union: the impact on the forest sector of future renewable energy policy in the European Union has already been raised in a number of international forestry meetings and discussions. In particular, there seems to be some concern in the pulp and paper sector about policy changes that might encourage the use of wood as a source of fuel. If such changes occur, this would be likely to drive up the price of pulpwood and reduce the competitiveness of European pulp producers against their main international competitors. This may be good for the forest plantation sector, but detrimental to the pulp and paper industry.
� Policy changes - US-Canada softwood lumber dispute: the US are in the
process of reintroducing high levels of tariffs on coniferous sawnwood imported from Canada, in response to claims that the Canadians are unfairly subsidising their forest products industry. Considering that the US is by far the largest importer of coniferous sawnwood from Canada, this could result in a renewed drive to export coniferous sawnwood from Canada to Europe. Given that the United Kingdom has historically been the largest importer of Canadian coniferous sawnwood in Europe, this could have a dramatic effect on the already depressed prices for coniferous sawnwood in the United Kingdom.
� Technical change - newsprint consumption: a number of analysts have
commented on the fact that the demand for newsprint seems to have fallen in some countries in the last few years. This was first noticed in North America, but it has also been reported in parts of Europe over the last couple of years. Although it is probably still too early to tell whether this is just a shock to the market or a

30
structural shift, there is some concern that the use of electronic media is finally having an impact on newsprint consumption.
� Technical change - engineered wood products: the next technological change
that will probably sweep across Europe is the increased use of engineered wood products for a variety of applications. Just as medium-density fibreboard and particleboard have captured a greater share of the sawnwood market for a number of end-uses, the next generation of engineered wood products have already increased market share in North America and may do so in Europe in the near future. These new products include: glulam; parallam; oriented strand lumber; laminated veneer lumber (LVL); and I-joists. These products can be used for a number of applications that would traditionally use coniferous sawnwood. With the exception of glulam, the use of most of these products is still quite rare in Europe and the impact that they might have on future markets is not included in the EFSOS forecasts.
Implications of the outlook for the United Kingdom solid wood forest products sector The trends and projections presented above show that the markets for solid wood products in the United Kingdom and the rest of Europe continue to grow, but that they will be increasingly satisfied by reconstituted wood panels (and possibly engineered wood products in the future) rather than traditional solid wood products such as sawnwood and plywood. Furthermore, they suggest that the United Kingdom is a competitive producer of these products, as is shown by the expected decline in net imports in the United Kingdom in the future. These changes suggest that the importance of the various factors of production in the manufacturing of solid wood products is changing. Broadly speaking, in order to meet the demands of end-users, the importance of having roundwood with good structural properties is gradually declining. In the future, the strength of the forest processing industry will depend more on having the technology and skills to turn low quality wood into high value products. Since the United Kingdom has never had much of a natural advantage in terms of wood quality but possesses a high level of skills and technology, this suggests that these developments will be generally good for the future of the solid wood processing industry as a whole in the United Kingdom. In the sawmilling sector, there remains the problem that the demand for domestic sawnwood production remains low, particularly in comparison to the size of the market as a whole. In this sector, the structural properties and appearance of industrial roundwood remain important, but the quality of domestically produced roundwood does not compare favourably with what can be produced in other countries. The challenge for the sawmilling industry in the United Kingdom will be to adjust to changing market conditions and to turn these to their advantage. As in the reconstituted panels sector, the most promising way to do this is likely to be to use skills and technology to offset the disadvantage in the quality of the raw material supply. One development that presents an opportunity for the industry is the ageing workforce in the United Kingdom. In a number of other countries, the ageing workforce has already resulted in increased labour costs in construction and manufacturing and a number of sawnwood

31
suppliers have taken advantage of this to produce tailor-made sawnwood products for their end-users. Closeness to market and technological and marketing skills are the main factors that have enabled them to do this, so this is worth examining further in the United Kingdom. Environmental policies and legislation present another opportunity for the industry. Again, the production of sawnwood products that meet end-users needs more closely is likely to reduce waste in end-use industries and stimulate demand for the domestically produced product. In broader terms, there may also be more general opportunities to increase the size of the solid wood products market. Per-capita consumption of solid wood products in the United Kingdom remains persistently low across all sectors compared with many other developed countries. In the past this may have been due to the high level of import dependence in the United Kingdom. However, with the substitution of technology and skills for raw material supplies and the generally increased environmental awareness in the United Kingdom, there may be scope to actively promote the use of wood as an environmentally friendly product. Implications of the outlook for the forest plantation sector in the United Kingdom The greater use of technology in the processing industry means that the need for large sized roundwood to meet end-users requirements will decline. This implies that the nature of industrial roundwood demand in the future will shift away from an emphasis on quality of supply to more of an emphasis on quantity of supply. Compared with the forecast availability of coniferous industrial roundwood, this suggests that there may be an excess supply of sawlogs in the future. Conversely, on the other hand, it seems likely that the forest processing industry will be able to use as much pulpwood as they can get hold of. In the context of these changes, the challenge for forest owners and managers will be to adjust their operations to make the most of these changing market conditions. One of the likely impacts of this change in demand will be a sustained flattening of the price-size relationship for standing roundwood. Figure 21 shows the historical trend in the difference between standing sales prices paid for large and small sized conifers. For the purpose of this analysis, a mean tree size of 0.275 cubic metres standing volume (overbark) has been used as the cut-off point between “large” and “small” sized trees. Average prices paid for total Forestry Commission production in each of these size categories has been calculated for the period 1965 - 1992 and for 2001 - 2002. The figure shows the additional price paid for large sized trees as a proportion of the average price paid for the small sized trees.

32
Figure 21 Historical trend in the difference in standing sales prices paid for large and small sized coniferous industrial roundwood in the United Kingdom
+0%
+20%
+40%
+60%
+80%
+100%
+120%
+140%
+160%
+180%
+200%
1965 1970 1975 1980 1985 1990 1995 2000
Year
Pric
e di
ffer
ence
for
larg
e si
zed
roun
dwoo
d
Source: UN (1994) and Forestry Commission (2002b). What this figure shows is that, for much of the period from 1970 to 1990, the premium paid for large sized coniferous industrial roundwood was at least 60 percent to 80 percent and, in many years, much higher than this. The figures for the latest years suggest that not only have standing sales prices fallen, but the premium for large sized roundwood has been dramatically reduced. The EFSOS projections show a large increase in domestic reconstituted panel production in the future combined with a much more modest projected increase in domestic sawnwood production. This suggests that prices for small roundwood may increase by more than prices for sawlogs in the future and that this flattening of the price-size relationship may be a permanent feature of the market in the future. With a flatter price-size relationship and greater demand for quantity rather than quality, this suggests that economically optimal rotation ages will become shorter and investments in silviculture will become increasingly unattractive. Therefore, for commercial wood production, forest plantation management in the future should focus on low cost and low input management regimes and rely on processing technology to cope with the poor quality of wood that will result. Other countries with significant forest plantation resources (e.g. New Zealand) are already starting down this course and it might be expected that others will follow suit. However, the above characterisation of the future for forest plantations presents only part of the picture. Forest plantations in the United Kingdom are increasingly valued for the services that they provide (recreation, amenity and conservation, etc.). This is one area where the value of large sized trees remains solid and is unlikely to be eroded by technological change.

33
Furthermore, the production of these services reflects the competitive advantage of forest plantations in the United Kingdom. In the same way that value-added in the processing industry is being increasingly driven by the application of technology and skills, the value of forest services is likely to increase as forest owners find new and innovative ways to market these outputs and, most importantly, commercialise their production. Commercial recreation services provided by the Forestry Commission are already one of the most profitable components of forest management and the demand for these sorts of services is likely to continue to increase in the future. Wood quality is not an issue in the production of these services and neither is foreign competition. With the gradually increasing proportion of mature forest plantations in the forest estate, it seems likely that the most profitable thing to do with these large trees will be to use them for the development of commercial recreation ventures where this is economically feasible. Furthermore, by not harvesting some of these trees, this may also help to revive domestic industrial roundwood prices. Given the very different nature and geographical location of the forest resource in the United Kingdom, it might be expected that different locations will specialise in the production of roundwood or forest services. In most of England, it seems likely that the commercialisation of forest services may offer the best opportunity for profitability in the future while forests in the rest of Great Britain may remain more focused on wood production. This is probably already happening on the ground, but it may increase in the future due to socio-economic trends. Certainly, it seems likely that the demands placed on forests in the future will change very dramatically from what has happened in the past.

34
REFERENCES FAO, 2003a, FAOSTAT - the FAO’s on-line statistical database for agriculture, fisheries and
forestry, available at: http://apps.fao.org/page/collections?subset=forestry. FAO, 2003b, Yearbook of forest products statistics, Food and Agriculture Organization of the
United Nations, Rome. FORESTRY COMMISSION, 2002a, British timber statistics 2001, Economics and Statistics
Unit, Forestry Commission, Edinburgh. Also available at: www.forestry.gov.uk/statistics. FORESTRY COMMISSION, 2002b, Coniferous standing sales price index: data for the year
to September 2002, Economics and Statistics Unit, Forestry Commission, Edinburgh. Also available at: www.forestry.gov.uk/statistics.
KANGAS, K, and BAUDIN, A, 2003, Outlook on forest products markets in Europe: a study
prepared for the European Forest Sector Outlook Study (EFSOS), draft Geneva Timber and Forest Discussion Paper, Joint Office of the United Nations Economic Commission for Europe and Food and Agriculture Organization of the United Nations, Geneva. Also available at: http://www.unece.org/trade/timber/efsos/supl/Item6.doc
Tomberlin, D, Zhu, S, and Buongiorno, J, 1999, The global forest products model (GFPM):
users manual and guide to installation, Global Forest Products Outlook Study Working Paper No GFPOS/WP/02, Food and Agriculture Organization of the United Nations, Rome, Italy, also available at: http://www.fao.org/forestry/gfpos.
UN, 1994, Roundwood price statistics and specifications, Timber Bulletin, Vol. LXV, No. 7,
Joint Office of the United Nations Economic Commission for Europe and Food and Agriculture Organization of the United Nations, Geneva.
UN, 2000, Forest resources of Europe, CIS, North America, Australia, Japan and New
Zealand, Joint Office of the United Nations Economic Commission for Europe and Food and Agriculture Organization of the United Nations, Geneva.
WHITEMAN, A, 1991, The supply and demand for wood in the United Kingdom, Forestry
Commission Occasional Paper 29, Forestry Commission, Edinburgh. WHITEMAN, A, 1996, Revised forecasts of the supply and demand for wood in the United
Kingdom, Forestry Commission Technical Paper 19, Forestry Commission, Edinburgh.