the pacific alliance - wilson center · the pacific alliance countries have, across the board,...
TRANSCRIPT
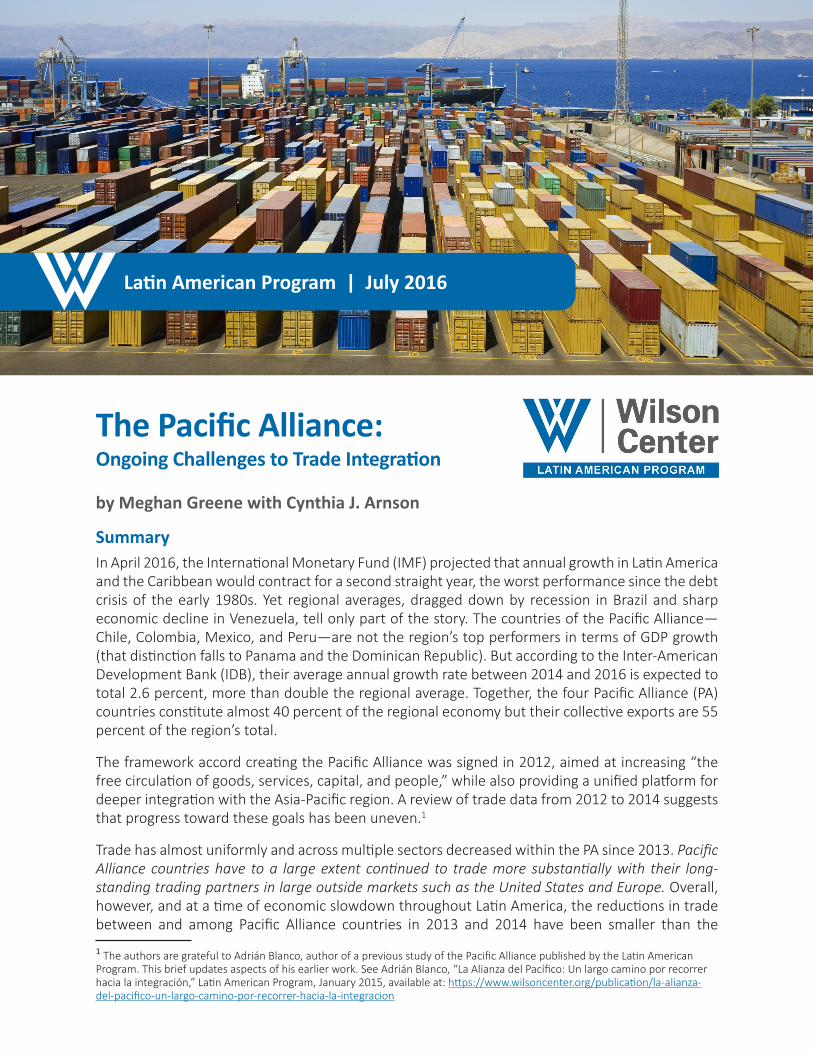
Latin American Program | July 2016
SummaryIn April 2016, the International Monetary Fund (IMF) projected that annual growth in Latin America and the Caribbean would contract for a second straight year, the worst performance since the debt crisis of the early 1980s. Yet regional averages, dragged down by recession in Brazil and sharp economic decline in Venezuela, tell only part of the story. The countries of the Pacific Alliance—Chile, Colombia, Mexico, and Peru—are not the region’s top performers in terms of GDP growth (that distinction falls to Panama and the Dominican Republic). But according to the Inter-American Development Bank (IDB), their average annual growth rate between 2014 and 2016 is expected to total 2.6 percent, more than double the regional average. Together, the four Pacific Alliance (PA) countries constitute almost 40 percent of the regional economy but their collective exports are 55 percent of the region’s total.
The framework accord creating the Pacific Alliance was signed in 2012, aimed at increasing “the free circulation of goods, services, capital, and people,” while also providing a unified platform for deeper integration with the Asia-Pacific region. A review of trade data from 2012 to 2014 suggests that progress toward these goals has been uneven.1
Trade has almost uniformly and across multiple sectors decreased within the PA since 2013. Pacific Alliance countries have to a large extent continued to trade more substantially with their long-standing trading partners in large outside markets such as the United States and Europe. Overall, however, and at a time of economic slowdown throughout Latin America, the reductions in trade between and among Pacific Alliance countries in 2013 and 2014 have been smaller than the
1 The authors are grateful to Adrián Blanco, author of a previous study of the Pacific Alliance published by the Latin American Program. This brief updates aspects of his earlier work. See Adrián Blanco, “La Alianza del Pacífico: Un largo camino por recorrer hacia la integración,” Latin American Program, January 2015, available at: https://www.wilsoncenter.org/publication/la-alianza-del-pacifico-un-largo-camino-por-recorrer-hacia-la-integracion
The Pacific Alliance:Ongoing Challenges to Trade Integration
by Meghan Greene with Cynthia J. Arnson

THE PACIFIC ALLIANCE:ONGOING CHALLENGES TO TRADE INTEGRATION
2
reductions in each country’s bilateral trade with Argentina and Brazil, South America’s two largest markets. This points to the greater stability of trade within the Pacific Alliance.
A closer look at the data indicates that some countries have performed better that the aggregate PA figures would suggest. Particularly noteworthy is the case of Colombia, which between 2013 and 2014 was the only country to increase its percentage of exports to and imports from Asia’s three largest markets: China, Japan, and South Korea. Some of the increase in bilateral trade as a percentage of total trade is due to the fact that Colombia is rather new to Asian markets.2
Nevertheless, the increase is nothing short of impressive.
While the aggregate picture of the PA shows little across-the-board success in improving intra-industry trade (the kind that creates value chains), Peru is performing relatively well in comparison to the other Pacific Alliance countries in terms of increasing exports to other Alliance members and achieving major improvements in the level of intra-industry trade, especially in the food products sector.
Exports from Brazil and Argentina—South America’s two largest economies—to China, Japan, and South Korea decreased across the board from 2013 to 2014, while some Pacific Alliance members were able to increase exports to the three largest Asian markets. Thus, in relative terms, members of the Pacific Alliance exhibited stronger export performance vis-à-vis Asian markets than did the two largest South American economies.
All in all, the relatively stronger performance of Pacific Alliance members vis-à-vis several Asian countries during a period of recessionary shocks indicates that Alliance members are—despite obstacles—making headway in bolstering trade relations with Asian partners, a key goal of Pacific Alliance integration.
Data over a longer period of time are needed to shed light on the future potential of the agreement as Latin America and the global economy continue to navigate a complex and challenging environment.
Change in Total Exports and Total Imports between 2013 and 2014Imports:
The Pacific Alliance countries have, across the board, increased their share of imports coming from the United States, whereas imports coming from other large economies (China and the European Union) show great variability. Mexico has increased its imports from the United States more substantially than any other Pacific Alliance country; this is not surprising in light of the deep U.S.-Mexico trade relationship that exists in the context of the North American Free Trade Agreement (NAFTA). The only other finding that is consistent across all Pacific Alliance countries is that they have reduced their share of total imports coming from within the Pacific Alliance, with smaller reductions for Mexico and Peru. This suggests that between 2013 and 2014, despite the contractionary pressures that followed the global financial crisis and the end of the commodities super-cycle, PA members’ imports from other Pacific Alliance countries have declined, but not necessarily the imports of PA countries from other sources.
2 Colombia has been playing a game of ‘catch-up’ vis-à-vis Asia given the low starting point as compared to other Pacific Alliance countries. See Mauricio Reina and Sandra Oviedo, “Colombia and Asia: Trying to Make Up for Lost Time,” in Cynthia J. Arnson and Jorge Heine, eds., Reaching Across the Pacific: Latin America and Asia in the New Century (Washington, D.C.: Woodrow Wilson International Center for Scholars, 2014), 253-81.

THE PACIFIC ALLIANCE:ONGOING CHALLENGES TO TRADE INTEGRATION
3
ExportsExports to the United States between 2013 and 2014 declined for all Pacific Alliance countries except Mexico (for the reason noted above). Interestingly, those countries that saw a contraction in imports from China also experienced a reduction in exports to China, whereas the two countries—Peru and Colombia—that increased imports from China also increased their exports to China. This is particularly noteworthy in light of the slowdown of the Chinese economy. Mexico and Colombia reduced the share of exports going to other PA countries, whereas Peru (to a significant extent) and Chile (to a smaller degree) increased their share of exports to other Alliance members. With the exception of Peru, changes in exports from one Pacific Alliance country to another were not as dramatic as the changes (both increases and decreases) in exports to outside markets such as the United States, China, and European Union. Peru’s exports to other PA members increased more than other PA members’ exports to any other economy (PA, US, EU, or China) in the sample.
-6%
-5%
-4%
-3%
-2%
-1%
0
1%
2%
United States
European Union
China
PA
Mexico Colombia Chile Peru
Destination of PA Exports by Major Trading Partner(Di�erence 2013 to 2014)
Source: Compiled by author based on IDB INTrade
United States
European Union
China
PA
Mexico Colombia Chile Peru
Source of Paci�c Alliance Imports by Major Trading Partner(Di�erence 2013 to 2014)
-8%-6%-4%-2%
02%4%6%8%
10%12%
Source: Compiled by author based on IDB INTrade

THE PACIFIC ALLIANCE:ONGOING CHALLENGES TO TRADE INTEGRATION
4
-0.20
-0.16
-0.12
-0.08
-0.04
-0.00
0.04
0.08
Mexico: Di�erence (2013-2014) of Percent of Total Exports to Economies Listed
Source: Compiled by author based on UN Comtrade
Colombia PAChile Peru
-0.20%
-0.16%
-0.12%
-0.08%
-0.04%
-0.00
0.04%
0.08%
-1.0
-0.6
-0.2
0.2
0.6
1.0
1.4
1.8
-1.0
-0.6
-0.2
0.2%
0.6%
1.0%
1.4%
1.8%
Chile: Di�erence (2013-2014) of Percent of Total Exports to Economies Listed
Peru: Di�erence (2013-2014) of Percent of Total Exports to Economies Listed
Colombia: Di�erence (2013-2014) of Percent of Total Exports to Economies Listed
Colombia PAMexicoPeru
Chile PAPeru Mexico
Chile PAColombia Mexico
Geographic Breakdown of Change in Total Exports and ImportsAs noted above, the following graphs illustrate that Peru has achieved the most remarkable consistency in increasing exports to other PA members (although Peru’s exports to Chile remained constant between 2013 and 2014). For each of the other Pacific Alliance countries, exports have increased to some countries while decreasing to others. The graphs are scaled in a way that serves to further highlight the fluctuations in the exports of PA countries to other members of the Alliance. It is worth highlighting that the aggregate growth in Peru’s exports to Pacific Alliance countries is much more substantial than the decreases in other PA members’ exports to other Alliance members.
Exports:
Imports:Mexico: Di�erence (2013-2014) of
Percent of Total Imports from Economies Listed
Source: Compiled by author based on UN Comtrade
Colombia PA
-0.6
-0.4
-0.2
-0.0
0.2
0.4
Chile Peru
-0.6
-0.4
-0.2
-0.0
0.2
0.4
-0.6
-0.4
-0.2
-0.0
0.2
0.4
-0.6
-0.4
-0.2
-0.0
0.2
0.4
Colombia: Di�erence (2013-2014) of Percent of Total Imports from Economies Listed
Peru: Di�erence (2013-2014) of Percent of Total Imports from Economies Listed
Chile: Di�erence (2013-2014) of Percent of Total Imports from Economies Listed
Colombia PAMexicoPeru
Chile PAPeru Mexico
Chile PAColombia Mexico

THE PACIFIC ALLIANCE:ONGOING CHALLENGES TO TRADE INTEGRATION
5
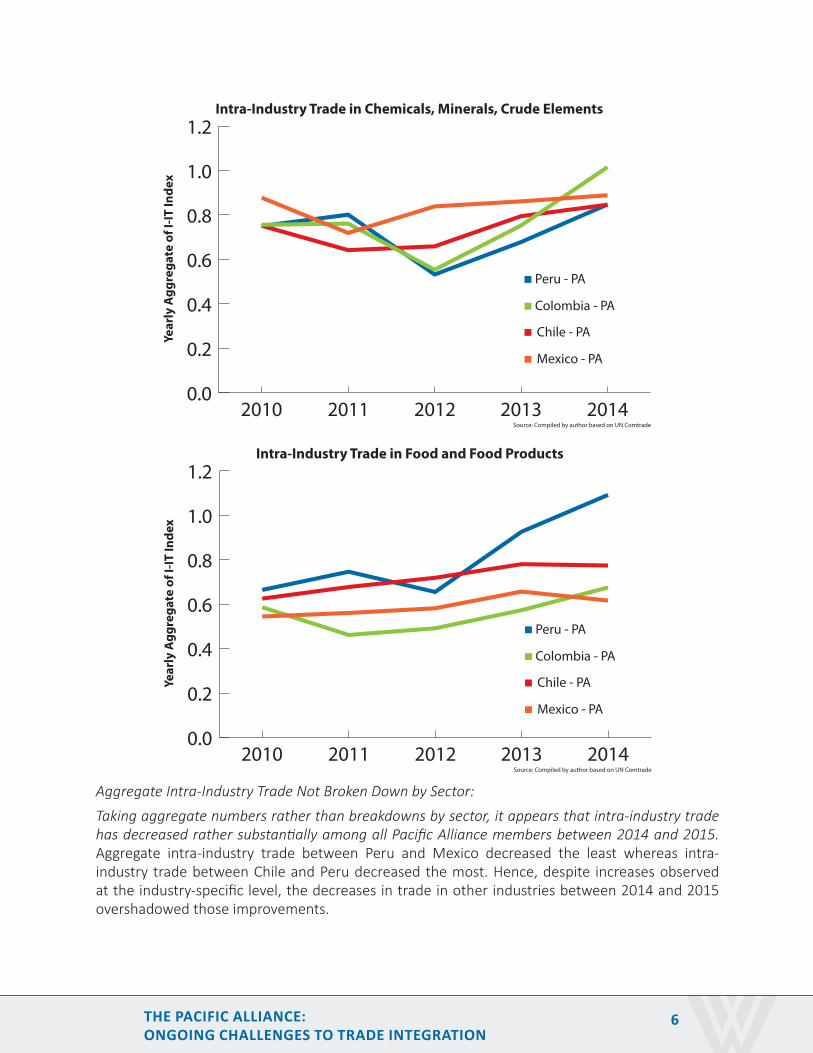
Intra-Industry Trade3
Intra-Industry Trade Broken Down by Sector:
The three charts below suggest that Peru once again is perhaps most active in pursuing the Pacific Alliance countries as viable trading partners, with the exception of manufacturing, which seems to have barely increased since 2010 and in fact has decreased since 2012. Overall, the changes in each country’s intra-industry trade with other PA members since 2009 are rather flat or only slightly upward trending. This suggests that intra-industry trade has not substantially increased despite several years of integration efforts; moreover, to some extent, deviations from the constant (or slightly upward) trend are potentially cyclical rather than structural in nature. Colombia seems to be taking most advantage of the new trading regime to expand intra-industry trade in the chemicals, minerals, and crude elements4
sectors, whereas Peru shows to be taking advantage of trade liberalization in the area of food and food products, both of which have increased over 2012 levels. Mexico appears to be relatively absent from participation in these intra-industry trade linkages and its level of participation in intra-industry PA trade in 2014 shows negligible—if any—improvement from the 2012 levels.
3 Calculations of the Intra-Industry Trade Index are based on an adaptation of the Blanco study of the Pacific Alliance cited above, which is derived from the methodology suggested by Grubel & Lloyd (1975). 4 Crude elements are defined by UN Comtrade as “crude materials, inedible, except fuels,” including such articles as hides, skins and furs; oil-seeds and oleaginous fruits; crude rubber; cork and wood; pulp and paper waste; textile fibers; crude fertilizers; met-alliferous ores and metal scraps; crude animal and vegetable materials.
Peru - PA
Colombia - PA
Chile - PA
Mexico - PA
Intra-Industry Trade in Manufacturing/Machinery
Source: Compiled by author based on UN Comtrade
0.0
0.2
0.4
0.6
0.8
1.0
1.2
1.4
1.6
2010 2011 2012 2013 2014
Year
ly A
ggre
gate
of I
-IT In
dex
THE PACIFIC ALLIANCE:ONGOING CHALLENGES TO TRADE INTEGRATION
6
Aggregate Intra-Industry Trade Not Broken Down by Sector:
Taking aggregate numbers rather than breakdowns by sector, it appears that intra-industry trade has decreased rather substantially among all Pacific Alliance members between 2014 and 2015. Aggregate intra-industry trade between Peru and Mexico decreased the least whereas intra-industry trade between Chile and Peru decreased the most. Hence, despite increases observed at the industry-specific level, the decreases in trade in other industries between 2014 and 2015 overshadowed those improvements.
Peru - PA
Colombia - PA
Chile - PA
Mexico - PA
Intra-Industry Trade in Chemicals, Minerals, Crude Elements
Source: Compiled by author based on UN Comtrade
0.0
0.2
0.4
0.6
0.8
1.0
1.2
2010 2011 2012 2013 2014
Year
ly A
ggre
gate
of I
-IT In
dex
Peru - PA
Colombia - PA
Chile - PA
Mexico - PA
Intra-Industry Trade in Food and Food Products
Source: Compiled by author based on UN Comtrade
0.0
0.2
0.4
0.6
0.8
1.0
1.2
2010 2011 2012 2013 2014
Year
ly A
ggre
gate
of I
-IT In
dex

THE PACIFIC ALLIANCE:ONGOING CHALLENGES TO TRADE INTEGRATION
7
Intra-Industry Trade between Pacific Alliance Countries (2014) Mexico Colombia Chile Peru
Mexico 0.24 0.26 0.14
Colombia 0.24 0.49 0.41
Chile 0.26 0.49 0.41
Peru 0.14 0.41 0.41
Intra-Industry Trade between Pacific Alliance Countries (2015) Mexico Colombia Chile Peru
Mexico 0.09 0.11 0.05
Colombia 0.09 0.26 NA
Chile 0.11 0.26 0.17
Peru 0.05 NA 0.17
Difference Across Years 2014 and 2015 Mexico Colombia Chile Peru
Mexico -0.15 -0.15 -0.09
Colombia -0.15 -0.23 NA
Chile -0.15 -0.23 -0.24
Peru -0.09 NA -0.24 Source: UN Comtrade
Pacific Alliance Trade with Argentina and BrazilSince 2012, the Pacific Alliance countries have had distinct trading patterns with Brazil and Argentina, the largest economies in South America and, for several countries, immediate neighbors. The changes in Mexico’s trade relationships with Brazil and Argentina were relatively minor compared with the more volatile experiences of other Pacific Alliance members. As Brazil went into deep recession and the Argentine economy also stagnated, it stands to reason that trade would have declined between PA countries and major regional partners outside the Alliance.
However, as the charts below illustrate, between 2014 and 2015 several PA countries managed to increase bilateral trade with Argentina and Brazil, as a percentage of the total trade of PA members. Mexico increased its trade with Argentina in 2014-2015, although the increase did not make up for the decrease between 2013 and 2014. Peru and Colombia managed to increase bilateral trade with Brazil, although the increases were quite small, and in Peru’s case, barely equaled the contraction in 2012-2013.5 In general, the changes in total trade bilaterally between each Pacific Alliance member-country and Argentina and Brazil, respectively, were more volatile than the changes in export and import shares between and within the Pacific Alliance across the same time frame.
5 UN Comtrade data for Colombia in 2015 are not available.
Data source: UN Comtrade

THE PACIFIC ALLIANCE:ONGOING CHALLENGES TO TRADE INTEGRATION
8
-2.5
-1.5
-0.5
0.5
1.5
2.5
Chile % Total Trade, Di�erence Between Listed Years with Argentina and Brazil
Source: Compiled by author based on UN Comtrade
2012-2013
-2.5
-1.5
-0.5
0.5
1.5
2.5
-2.5
-1.5
-0.5
0.5
1.5
2.5
-2.5
-1.5
-0.5
0.5
1.5
2.5
Colombia % Total Trade, Di�erence Between Listed Years with Argentina and Brazil
Peru % Total Trade, Di�erence Between Listed Years with Argentina and Brazil
Mexico % Total Trade, Di�erence Between Listed Years with Argentina and Brazil
2013-2014 2014-2015
2012-2013 2013-2014 2014-2015
2012-2013 2013-2014
2012-2013 2013-2014 2014-2015
ArgentinaBrazil
ArgentinaBrazil
ArgentinaBrazil
ArgentinaBrazil
Trade Between Latin America and AsiaThe following tables depict changes in exports and imports to key Asian countries as a percentage of total trade for the Pacific Alliance countries. Similar figures for Argentina and Brazil are provided as a basis of comparison. Despite the well-documented slowdown in the Chinese economy and the fall in commodity prices, all Pacific Alliance countries with the exception of Mexico managed to increase exports to China as a percentage of total exports between 2012 and 2014. Export percentages for 2012-2013 were far stronger than in the subsequent year, when Chile’s exports to China experienced a decline. This pattern is also reflected in Argentina’s and Brazil’s exports to China, which shrunk in 2013-2014 after showing modest growth in 2012-2013.
PA imports from China as a percentage of total imports of Pacific Alliance countries decreased between 2012 and 2014, with the exception of Peru.6 The decline in Mexican imports of Chinese goods was larger than any of the other changes in trade between Asian countries (China, Japan, and South Korea) and Pacific Alliance members, Argentina, or Brazil.
From 2013 to 2014, while exports from Argentina and Brazil to the three principal Asian markets decreased across the board, some Pacific Alliance members were able to increase exports to China, Japan, and South Korea. Thus, in relative terms, members of the Pacific Alliance exhibited stronger export performance vis-à-vis Asian markets than did the two largest South American economies.
Particularly noteworthy is the case of Colombia, which between 2013 and 2014 was the only country to increase its percentage of exports to and imports from all three of the Asian markets included in this study. With respect to China alone, Colombia increased its percent of exports as a percent of total trade to China by 1.58 and its imports by 1.26, comparatively large changes. These constitute some of the largest increases experienced by any Pacific Alliance country and occurred in spite of the widely noted slow-down of the Chinese economy. As noted above, Colombia’s stronger performance with respect to Asian markets could be attributed in part to its lower starting point regarding commercial relations with Asia relative to other PA countries.
6 Peru was the only country to register an increase in imports from China between 2012-2013 and 2013-2014.
Source: IDB INTrade BID

THE PACIFIC ALLIANCE:ONGOING CHALLENGES TO TRADE INTEGRATION
9
All in all, the relatively stronger performance of Pacific Alliance members vis-à-vis several Asian countries during a period of recessionary shocks indicates that Alliance members are—despite obstacles—making headway in bolstering trade relations with Asian partners, a key goal of Pacific Alliance integration.
Exports:
Changes in Export Percent of Total ExportsYears China Japan Korea2012-2013 Argentina 0.43% 0.20% -0.49%2013-2014 -0.57% -0.67% -0.56%2012-2013 Brazil 2.02% 0.43% 0.20%2013-2014 -0.49% -0.57% -0.67%
Changes in Export Percent of Total ExportsYears China Japan Korea2012-2013 Chile 2.07% -0.98% -0.36%2013-2014 -0.90% 0.38% 0.43%2012-2013 Colombia 3.11% 0.06% -0.17%2013-2014 1.58% 0.11% 0.56%2012-2013 Mexico 0.16% -0.12% -0.06%2013-2014 -0.20% 0.07% 0.11%2012-2013 Peru 0.90% -0.20% 0.45%
Source: IDB INTrade BID
2013-2014 0.40% -1.22% -0.60%Imports:
Changes in Import Percent of Total ImportsYears China Japan Korea2012-2013 Argentina 0.18% -0.15% 0.00%2013-2014 1.34% 0.07% -0.28%2012-2013 Brazil 0.22% -0.51% -0.12%2013-2014 0.74% -0.38% -0.24%
Changes in Import Percent of Total ImportsYears China Japan Korea2012-2013 Chile 1.72% -0.33% 0.11%
2013-2014 -1.89% 0.17% 0.09%
2012-2013 Colombia -4.51% -0.68% 0.05%
2013-2014 1.26% 0.13% 0.11%
2012-2013 Mexico 0.73% -0.28% -0.06%
2013-2014 -6.46% -1.16% -0.95%2012-2013 Peru 0.94% -0.23% -0.24%2013-2014 1.72% -0.70% -0.40%
Source: IDB INTrade BID
Source: Compiled by author based on IDB INTrade

THE PACIFIC ALLIANCE:ONGOING CHALLENGES TO TRADE INTEGRATION
10
Appendix I
Destination of Paci�c Alliance Exports by Major Trading Partner(% of total trade in 2014)
Source: Compiled by author based on IDB INTrade0
10%
20%
30%
40%
50%
60%
70%
80%United StatesEuropean UnionChinaPA
Mexico Colombia Chile Peru
Source of Paci�c Alliance Imports by Major Trading Partner(% of total trade in 2014)
Source: Compiled by author based on IDB INTrade0
10%
20%
30%
40%
50%
60%United StatesEuropean UnionChinaPA
Mexico Colombia Chile Peru
THE PACIFIC ALLIANCE:ONGOING CHALLENGES TO TRADE INTEGRATION
11
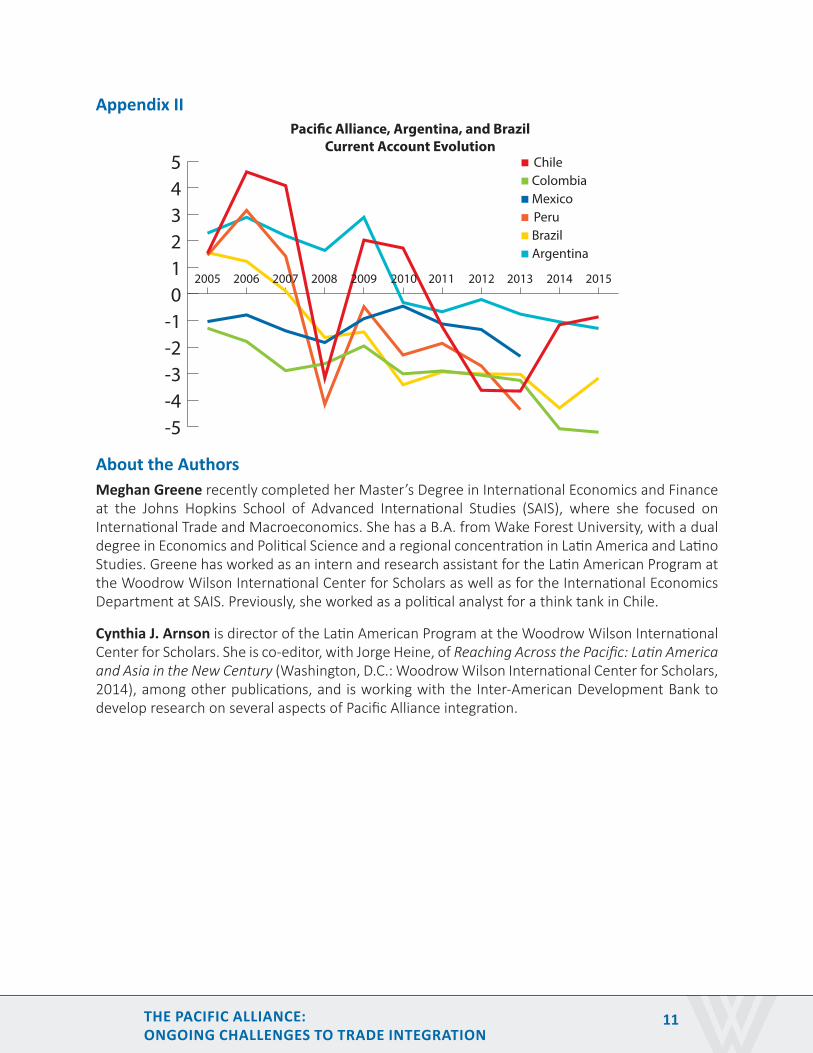
Appendix II
About the AuthorsMeghan Greene recently completed her Master’s Degree in International Economics and Finance at the Johns Hopkins School of Advanced International Studies (SAIS), where she focused on International Trade and Macroeconomics. She has a B.A. from Wake Forest University, with a dual degree in Economics and Political Science and a regional concentration in Latin America and Latino Studies. Greene has worked as an intern and research assistant for the Latin American Program at the Woodrow Wilson International Center for Scholars as well as for the International Economics Department at SAIS. Previously, she worked as a political analyst for a think tank in Chile.
Cynthia J. Arnson is director of the Latin American Program at the Woodrow Wilson International Center for Scholars. She is co-editor, with Jorge Heine, of Reaching Across the Pacific: Latin America and Asia in the New Century (Washington, D.C.: Woodrow Wilson International Center for Scholars, 2014), among other publications, and is working with the Inter-American Development Bank to develop research on several aspects of Pacific Alliance integration.
MexicoColombiaChile
Peru
Paci�c Alliance, Argentina, and Brazil Current Account Evolution
Source: Compiled by author based on IMF, World Economic Outlook
-5-4-3-2-1012345
BrazilArgentina
2005 2006 2007 2008 2009 2010 2011 2012 2013 2014 2015

ONE WOODROW WILSON PLAZA, 1300 PENNSYLVANIA AVENUE, NW, WASHINGTON, DC 20004-3027
WOODROW WILSON INTERNATIONAL CENTER FOR SCHOLARSJane Harman, President, Director, and CEO
Presorted First Class MailPostage and Fees Paid
Smithsonian Institution
G-94SMITHSONIAN INSTITUTION
OFFICIAL BUSINESS
300$ ,PENALT Y FOR PRIVATE USE
BOARD OF TRUSTEESThomas R. Nides, Chairman
Public Members: William Adams, Chairman, National Endowment for the Humanities; Sylvia Mathews Burwell, Secretary, U.S. Department of Health and Human Services; Arne Duncan, Secretary, U.S. Department of Education; David Ferriero, Archivist of the United States; John F. Kerry, Secretary, U.S. Department of State; David Mao, Acting Librarian of Congress; David Skorton, Secretary, Smithsonian Institution
Designated Appointee of the President from within the Federal Government:Fred P. Hochberg, Chairman and President, Export-Import Bank
Private Citizen Members: Peter Beshar, John T. Casteen III, Thelma Duggin, Lt. Gen. Susan Helms, USAF (Ret.), Barry S. Jackson, Nathalie Rayes, Earl W. Stafford, Jane Watson Stetson
Wilson National Cabinet: Ambassador Joseph B. Gildenhorn & Alma Gildenhorn, Co-Chairs
Eddie & Sylvia Brown, Dr. Armeane Choksi & Mary Choksi, Ambassadors Sue & Chuck Cobb, Lester Crown, Thelma Duggin, Judi Flom, Sander R. Gerber, Harman Family Foundation, Frank F. Islam, Willem Kooyker, Raymond Learsy, Frederic & Marlene Malek, Linda B. & Tobia G. Mercuro, Thomas R. Nides, Nathalie Rayes, Wayne Rogers, B. Francis Saul II, Diana Davis Spencer, Jane Watson Stetson, Leo Zickler
THE WOODROW WILSON INTERNATIONAL CENTER FOR SCHOLARS, established by Congress in 1968 and headquartered in Washington, D.C., is a living national memorial to President Wilson. The Center’s mission is to commemorate the ideals and concerns of Woodrow Wilson by providing a link between the worlds of ideas and policy, while fostering research, study, discussion, and collaboration among a broad spectrum of individuals concerned with policy and scholarship in national and international affairs. Supported by public and private funds, the Center is a nonpartisan institution engaged in the study of national and world affairs. It establishes and maintains a neutral forum for free, open, and informed dialogue. Conclusions or opinions expressed in Center publications and programs are those of the authors and speakers and do not necessarily reflect the views of the Center staff, fellows, trustees, advisory groups, or any individuals or organizations that provide financial support to the Center.