the pacific salmon wars: what science brings … · sible answers in a way that clearly...
TRANSCRIPT
12 Oct 2002 10:9 AR AR173-ES33-23.tex AR173-ES33-23.sgm LaTeX2e(2002/01/18)P1: IBC10.1146/annurev.ecolsys.33.010802.150504
Annu. Rev. Ecol. Syst. 2002. 33:665–706doi: 10.1146/annurev.ecolsys.33.010802.150504
Copyright c© 2002 by Annual Reviews. All rights reservedFirst published online as a Review in Advance on August 14, 2002
THE PACIFIC SALMON WARS: What ScienceBrings to the Challenge of Recovering Species
Mary H. Ruckelshaus1, Phil Levin1, Jerald B. Johnson1, andPeter M. Kareiva21NMFS Northwest Fisheries Science Center, 2725 Montlake Blvd. E., Seattle,Washington 98112; email: [email protected], [email protected],[email protected] Nature Conservancy of Washington, 217 Pine Street, Ste. 1100, Seattle,Washington 98101; email: [email protected]
Key Words recovery planning, scenarios, conservation units, Endangered SpeciesAct, science/policy interface
■ Abstract Politicians, scientists, government agencies, and the public are all en-gaged in recovery planning for Pacific salmon. In order for science to fulfill its potentialin the arena of salmon recovery planning, several shortcomings of the science and itsapplication to decision-making must be rectified. The definition of conservation unitsusing genetic and phylogenetic inference needs to be sharpened. Ecological analy-ses must get beyond casting blame for past declines in salmon numbers and examinemixed strategies of management that consider interactions between hatcheries, harvest,hydropower, and habitat factors as well as background natural stresses and invasivespecies. Glib acceptance of expert opinion and extrapolated or inferred data should betempered. To deal with uncertainty, recovery teams should engage in scenario analysesin which a wide variety of assumptions are played out. Finally, there is a pressing needfor analyses aimed at determining what circumstances and communication strategiesgive science an effective voice in decision-making.
INTRODUCTION
As increasing numbers of species become threatened with extinction, ecologistsand evolutionary biologists continue to devise strategies to rebuild depleted pop-ulations. Although scientists sometimes forget this point, it is not their job torecommend a recovery strategy to policy-makers. Rather, the job of science is tomake clear the biological targets that constitute recovery and the biological conse-quences of different suites of actions (or inaction) aimed at recovering threatenedand endangered species. The actual recovery policy adopted by public agencies willinevitably balance biological consequences with social, political, and economicvalues. Biological science cannot and should not have any special place in deter-mining how biological value is traded off against an economic or social concern.
0066-4162/02/1215-0665$14.00 665
Ann
u. R
ev. E
col.
Syst
. 200
2.33
:665
-706
. Dow
nloa
ded
from
arj
ourn
als.
annu
alre
view
s.or
gby
ST
EPH
EN
T. T
HR
EL
KE
LD
on
02/1
4/06
. For
per
sona
l use
onl
y.
12 Oct 2002 10:9 AR AR173-ES33-23.tex AR173-ES33-23.sgm LaTeX2e(2002/01/18)P1: IBC
666 RUCKELSHAUS ET AL.
However, science can and should be the preeminent voice in describing targets andanticipating the likely ecological consequences of alternative management actions.In other words, science cannot make policy, but it can illuminate the consequencesof policy for threatened and endangered species. Unfortunately, science often failsto play this idealized role of making clear the consequences of alternatives. In turn,the failure of many high-profile conservation-planning decisions to adequately in-corporate ecology and evolutionary biology is partly due to the inadequate lightshed by science on the consequences of decisions. In this paper, we offer an illus-tration of how science—the collection of biological information and translation ofthat information into useful forms—can be used fruitfully to inform conservationplanning for Pacific salmon. Our experience with salmon illustrates both the im-pediments to and opportunities for incorporating biological criteria into recoverydecisions.
First, it is important to emphasize that Pacific salmon are of enormous economic,cultural, and social value, and the extinction of any Pacific salmon species would beviewed as a tragedy by the public (Smith 1979, Beckham 1977, Brown 1983, Cone1995, Lichatowich 1999, Connelly 2001, Frank 2002). Part of the fascination withsalmon can be traced to their remarkable anadromous life history. The spectacularjourneys of spring-run chinook and sockeye in the Snake River Basin—travelingthousands of kilometers to the ocean and back to small headwater streams and lakesin Idaho—have captured the imagination of Native Americans for centuries. Morerecently, local disappearances and declines in salmon populations have becomefodder for the campaign speeches of politicians, who promise that these specieswill not vanish on their watch. Fortunately, compared to the state of other highlyvisible species in decline, most species of Pacific salmon are at a relatively low riskof immediate extinction. Because Pacific salmon are still abundant in places, andare unlikely to be rapidly extirpated, we have a unique opportunity to use sciencethoughtfully to design recovery strategies that include multiple options instead oflast ditch efforts that often typify endangered species management (Gore 1992,NRC 1995, Doremus 2000).
There have been many reviews of salmon ecology, evolutionary biology, andeven salmon management (e.g., Cone & Ridlington 1996, NRC 1996, Lichatowich1999, ISG 1999). Here we adopt a different tack. We examine the role science playsin shaping recovery planning and highlight where science can be useful, and whereit has not been as effective. By focusing on the role of science in salmon recovery,we hope to provide warnings and lessons that may help in future attempts to recoverspecies using the best available science.
Conservation planning for salmon in the western United States is especiallyhigh-profile because nearly everything people do in the Pacific Northwest affectssalmon in some way. Consequently, the potential remedies for the salmon problemhave huge implications for the ways people extract water, develop industrial, com-mercial and private properties, generate electricity, transport goods, harvest fish,and conduct their daily lives. A benefit of the high stakes of salmon recovery isthat scientists have a willing audience: politicians and decision-makers are eager
Ann
u. R
ev. E
col.
Syst
. 200
2.33
:665
-706
. Dow
nloa
ded
from
arj
ourn
als.
annu
alre
view
s.or
gby
ST
EPH
EN
T. T
HR
EL
KE
LD
on
02/1
4/06
. For
per
sona
l use
onl
y.

12 Oct 2002 10:9 AR AR173-ES33-23.tex AR173-ES33-23.sgm LaTeX2e(2002/01/18)P1: IBC
SALMON RECOVERY SCIENCE 667
for biological advice about how best to proceed in recovering salmon populations.Our charge as scientists is to respond to the intense pressure for biologically defen-sible answers in a way that clearly distinguishes scientific conclusions from policychoices. Recent crises in the public’s confidence in biologists to contribute to pol-icy decisions affecting high-profile species such as Canada lynx and grizzly bear(Mapes 2001, Boyle 2002, Dalton 2002, Mills 2002,Seattle Times2002, Stokstad2002, Strassel 2002, Weber 2002) illustrate the importance of our charge. Indeed,a recent controversial decision to cut off irrigation water to farmers in the KlamathRiver Basin to save listed coho salmon in Oregon and California prompted U. S.Secretary of Interior Gale Norton to request a National Academy of Sciencespanel to review the scientific basis for the decision (Milstein 2002, NRC 2002).The heated policy debates surrounding the salmon recovery problem create anintensely challenging and exciting arena in which science is actively competingfor influence.
Overview of Biological Declines and Legal Status
Seven species of anadromous Pacific salmonids in the genusOncorhynchusoc-cur in North America (O. gorbuscha—pink salmon,O. keta—chum salmon,O. tshawytscha—chinook salmon,O. kisutch—coho salmon,O. nerka—sockeyesalmon,O. mykiss—steelhead, andO. clarki clarki—coastal cutthroat trout), withgeographic ranges occurring throughout the north Pacific from Japan across to thewest coast of the United States and Canada, from Alaska to southern California.Pacific salmonids generally follow a basic anadromous life history: they are born infreshwater streams, including such diverse locations as coastal lowlands and head-waters thousands of kilometers from the ocean. Juveniles grow in fresh water fromseveral weeks up to two years, then migrate downstream to estuaries and oceansfor one to six years before returning as adults to spawn in natal streams (Table 1,Groot & Margolis 1991). Five species of salmonids are obligately semelparous,and steelhead and coastal cutthroat trout can be iteroparous, making the fresh-to-saltwater migration two to three times before dying (Groot & Margolis 1991).
The myriad freshwater and saltwater habitats Pacific salmonids must traversethroughout their life cycle exposes them to a number of threats. Salmon declineshave been blamed on many factors, including hydropower projects, harvest, reduc-tions in freshwater habitat quantity and quality, predation by other fishes, birds andmarine mammals, competition for rearing and spawning habitats, ocean conditions,and negative interactions between wild and hatchery-origin salmon. Combinationsof such impacts have led to serious reductions in abundance, spatial distribution,and diversity of a number of Pacific salmon populations.
The National Marine Fisheries Service (NMFS) defines reproductively isolatedgroups of salmon with unique evolutionary legacies as Evolutionarily SignificantUnits (ESUs) under the Endangered Species Act (ESA) (NMFS 1991; Waples1991, 1995). The NMFS has identified 51 ESUs within the 6 species of Pacificsalmonids under its jurisdiction, and 26 of these currently are listed under the ESA
Ann
u. R
ev. E
col.
Syst
. 200
2.33
:665
-706
. Dow
nloa
ded
from
arj
ourn
als.
annu
alre
view
s.or
gby
ST
EPH
EN
T. T
HR
EL
KE
LD
on
02/1
4/06
. For
per
sona
l use
onl
y.

12 Oct 2002 10:9 AR AR173-ES33-23.tex AR173-ES33-23.sgm LaTeX2e(2002/01/18)P1: IBC
668 RUCKELSHAUS ET AL.
TAB
LE1
Life
hist
ory
char
acte
ristic
sof
Pac
ific
salm
on(m
odifi
edfr
omP
earc
y19
92,B
usby
etal
.199
6)
Siz
eat
ocea
nF
resh
wat
erS
peci
esC
ollo
quia
lnam
esO
cean
entr
yen
try
(mm
)re
side
nce
Mar
ine
resi
denc
eA
geat
mat
urity
Chi
nook
salm
onK
ing
salm
on;
May
–Oct
40–1
100.
5–2
+ye
ars
0.5–
6ye
ars
3–6
year
s(O
.tsh
aw
ytsc
ha)
Tyee
;Bla
ckm
outh
;sp
ring,
sum
mer
,or
fall
chin
ook
Coh
osa
lmon
Silv
ersa
lmon
May
–Jun
e60
–120
1ye
ar0.
5–1.
5ye
ars
2–4
year
s;(O
.kis
utc
h)us
ually
3ye
ars
Soc
keye
salm
onR
edsa
lmon
;M
ay–J
une
60–1
101–
2ye
ars
1–5
year
s3–
7ye
ars;
(O.n
erk
a)B
lueb
ack
usua
lly3–
4ye
ars
Chu
msa
lmon
Dog
salm
onM
arch
–Jun
e30
–40
1–3
mon
ths
2–4
year
s2–
7ye
ars;
(O.k
eta)
usua
lly3–
4ye
ars
Pin
ksa
lmon
Hum
pbac
ksa
lmon
May
–Jun
e30
–40
1–3
wee
ks1.
6ye
ars
2ye
ars
(O.g
orb
usc
ha)
Ste
elhe
adR
ainb
owtr
out;
May
–Apr
ilN
A2–
7ye
ars
0–4
year
s2–
7ye
ars
(O.m
ykis
s)re
dban
dtr
out;
win
ter
orsu
mm
erst
eelh
ead
Ann
u. R
ev. E
col.
Syst
. 200
2.33
:665
-706
. Dow
nloa
ded
from
arj
ourn
als.
annu
alre
view
s.or
gby
ST
EPH
EN
T. T
HR
EL
KE
LD
on
02/1
4/06
. For
per
sona
l use
onl
y.

12 Oct 2002 10:9 AR AR173-ES33-23.tex AR173-ES33-23.sgm LaTeX2e(2002/01/18)P1: IBC
SALMON RECOVERY SCIENCE 669
TABLE 2 Conservation status of listed Evolutionarily Significant Units (ESUs) ofPacific salmonids∗
Species ESU Listing status
Chinook salmon Sacramento River winter-run EndangeredUpper Columbia River spring-run EndangeredSnake River fall-run ThreatenedSnake River spring/summer-run ThreatenedPuget Sound ThreatenedLower Columbia River ThreatenedUpper Willamette River ThreatenedCentral Valley spring-run ThreatenedCalifornia coastal Threatened
Coho salmon Central California ThreatenedSouthern Oregon/northern California coasts ThreatenedOregon coast Threatened
Chum salmon Hood Canal summer-run ThreatenedColumbia River Threatened
Sockeye salmon Snake River EndangeredOzette Lake Threatened
Steelhead Southern California EndangeredUpper Columbia River EndangeredSouth-central California coast ThreatenedCentral California coast ThreatenedSnake River Basin ThreatenedLower Columbia River ThreatenedCalifornia Central Valley ThreatenedUpper Willamette ThreatenedMiddle Columbia River Threatened
∗The listing status of each ESU under the Endangered Species Act is specified—ESUs are listed separatelyas “species” under the Act as distinct population segments
(Table 2). The listed ESUs are considered to be distinct population segments underthe ESA, and for legal purposes they are treated as separate species that must berecovered.
Once an ESU is listed under the ESA, actions that might directly or indirectlynegatively affect the species become restricted (Rohlf 1989). These so-called“take” prohibitions are designed to limit the deleterious effects of harvest, hy-dropower, and hatchery management practices, and of changes to habitat quantityand quality, on salmon populations. Recovery planning is complicated because, inaddition to the ESA, the NMFS must also serve two other major legal mandateswhen making decisions about salmon. First, NMFS is charged with administeringthe Magnuson-Stevens Fishery Conservation and Management Act, as amendedby the Sustainable Fisheries Act of 1996. This Act sets biological standards that
Ann
u. R
ev. E
col.
Syst
. 200
2.33
:665
-706
. Dow
nloa
ded
from
arj
ourn
als.
annu
alre
view
s.or
gby
ST
EPH
EN
T. T
HR
EL
KE
LD
on
02/1
4/06
. For
per
sona
l use
onl
y.

12 Oct 2002 10:9 AR AR173-ES33-23.tex AR173-ES33-23.sgm LaTeX2e(2002/01/18)P1: IBC
670 RUCKELSHAUS ET AL.
must be met in salmon populations subjected to commercial and tribal harvest anddescribes methods by which harvest levels should be allocated (Magnuson-StevensAct 16 U.S.C.§ 1801 et seq.). In addition, the U.S. government is a trustee for thesalmon resource for a number of Native American tribes in the Pacific Northwest.This relationship was originally established through historical treaties signed inthe mid-1850s and was reaffirmed in 1974 in theUnited States v. Washingtoncase(the Boldt decision) and in 1983 in theUnited States v. Oregoncase between thetribes and United States government. Consequently, the NMFS works closely withstate and tribal comanagers to review harvest and hatchery management plans toensure compliance with statutory requirements in the ESA, the Magnuson-StevensAct, and tribal treaty rights. For thriving populations of salmon, tensions amongthese three primary legal standards are minimal. However, for threatened and en-dangered populations, where the pie to be divided is smaller, the debate becomesmore heated (e.g.,Alsea Valley Alliance v. Evans2001, Federal Register 2002,Verhovek 2002,Washington Trout v. Lohn et al. 2001).
NMFS’s Design of Recovery Planning for Pacific Salmonids
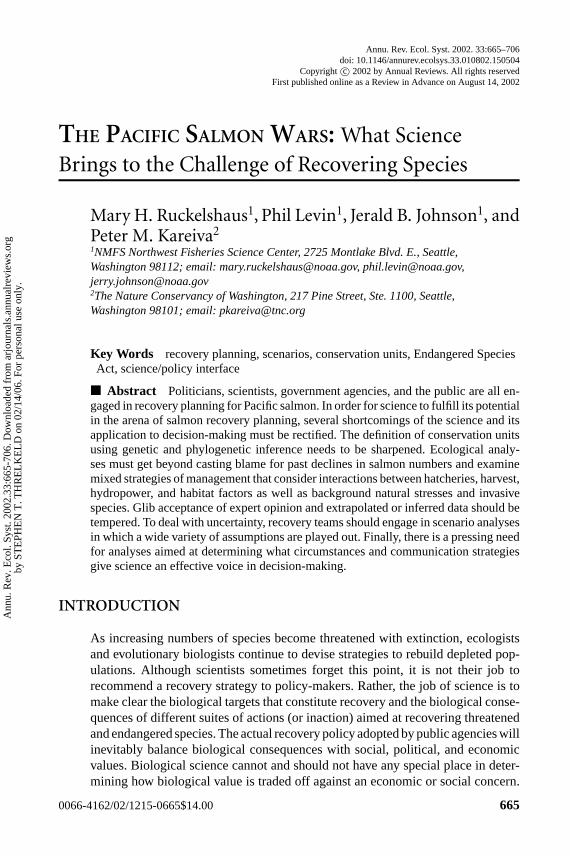
The NMFS has implemented a geographically based approach to developing re-covery plans for the 26 listed ESUs under its jurisdiction. Eight recovery-planningdomains have been identified, each encompassing 3–6 salmon ESUs that are listedas threatened or endangered under the ESA (Figure 1). For each geographic region,a Technical Recovery Team has been (or will be) established; the team’s chargeis to develop biologically based delisting criteria and provide technical guidancein determining which actions are necessary for recovery of all ESUs within thedomain (NMFS 2000a).
Recovery teams face three major scientific challenges: identifying the unitsof conservation, establishing recovery goals, and recommending management ac-tions that will abate existing threats and ultimately meet those recovery goals.Approaches to establishing recovery goals fall largely under the umbrella of“population viability analysis,” which recently has been thoroughly reviewed(Lande 1993, Morris et al. 1999, Brook et al. 2000, Holmes 2001, Beissinger &McCullough 2002, Holmes & Fagan 2002), including a detailed synthesis of ideasregarding what represents viability for salmonids (McElhany et al. 2000). In con-trast, the scientific challenges of defining appropriate conservation units and thencompleting a threats analysis on those units have not been reviewed elsewhere.By focusing on these scientific issues, we illustrate how guidance from basic sci-ence and clear communication from conservation practitioners can help advanceconservation planning for species such as salmon.
IDENTIFYING UNITS FOR CONSERVATION
Salmon species are composed of multiple lineages marked by varying levelsof evolutionary divergence. This variation can be seen in neutral genetic mark-ers (e.g., Utter et al. 1989, Wood et al. 1994, Nielsen et al. 1997, Ford 1998,
Ann
u. R
ev. E
col.
Syst
. 200
2.33
:665
-706
. Dow
nloa
ded
from
arj
ourn
als.
annu
alre
view
s.or
gby
ST
EPH
EN
T. T
HR
EL
KE
LD
on
02/1
4/06
. For
per
sona
l use
onl
y.
12 Oct 2002 10:9 AR AR173-ES33-23.tex AR173-ES33-23.sgm LaTeX2e(2002/01/18)P1: IBC
SALMON RECOVERY SCIENCE 671
Figure 1 Map showing the geographic distribution of listed ESUs ofPacific salmonids.
McCusker et al. 2000, Smith et al. 2001), and also in the wide range of life historystrategies employed within each species (Table 1; Groot & Margolis 1991, Taylor1991, Waples et al. 2001). A demographically based viability analysis that sim-ply counts fish—without regard to genetic or life history variants—could resultin missed opportunities for future evolvability of a population. Yet, the reality isthat not every salmon lineage can be saved; thus one of the first critical questionsconservation planners must address is: What are the biologically significant unitsfor conservation of the species?
There is a rich history to the question of how to identify and prioritize con-servation units, and ongoing debates surrounding this issue for imperiled species
Ann
u. R
ev. E
col.
Syst
. 200
2.33
:665
-706
. Dow
nloa
ded
from
arj
ourn
als.
annu
alre
view
s.or
gby
ST
EPH
EN
T. T
HR
EL
KE
LD
on
02/1
4/06
. For
per
sona
l use
onl
y.

12 Oct 2002 10:9 AR AR173-ES33-23.tex AR173-ES33-23.sgm LaTeX2e(2002/01/18)P1: IBC
672 RUCKELSHAUS ET AL.
continue in the biological literature (see discussion below). Advances in moleculargenetic and statistical tools have led to impressive algorithms for discriminatingamong groups within species—in some cases, to the level of distinguishing be-tween individuals. Nevertheless, resolution of distinct genetic lineages within aspecies of conservation concern does not help to identify which hierarchical levelof organization is the appropriate one to save (Waples 1995). In this section, weoffer a brief history of the debate about appropriate means for identifying con-servation units and how they have been delineated for Pacific salmon under legalconstraints of the ESA. We then highlight important omissions in formulating def-initions of conservation units and how those definitions are applied in practice. Weargue that incorporating a phylogenetic perspective into identification of conserva-tion units will greatly improve assessment of their relevance for the conservationof imperiled species.
The Conservation Unit Debate: What is the Best Wayto Identify Relevant Clusters of Diversity?
Delineating conservation unit boundaries and major evolutionary lineages withinspecies has been the focus of considerable research over the past 15 years. Ryder(1986) introduced the concept of Evolutionarily Significant Units to categorizeevolutionary diversity within rare mammal species. Waples (1991, 1995) lateradopted the ESU concept as a way to identify stocks of Pacific salmon that couldreceive formal protection as “distinct population segments” under the ESA. Giventheir propensity to home to natal streams, salmon are naturally subdivided into ahierarchy of genetically distinct groups that tend to show local adaptation to vary-ing selective environments (reviewed in Taylor 1991). Therefore, the biologicalframework used by NMFS to define an ESU includes: (a) substantial reproductiveisolation and (b) assurance that the designated population or group of populationscontains an important component of the evolutionary legacy of the species, whichin application means that salmon ESUs show major divergence from one another(Waples 1991).
Although the ESU criteria for salmon are clear, approaches underlying ESU des-ignations are not universally agreed upon in the broader conservation community(reviewed in Fraser & Bernatchez 2001). Recent controversy stems from disagree-ment about the relative importance of using neutral molecular data as opposed toecological adaptations to delineate groups (Crandall et al. 2000). Moritz (1994)argued that ESUs should be distinct phylogenetic lineages and that the criterion todelineate such lineages should be reciprocal monophyly based on DNA sequencedata. Strict reliance on neutral marker data to the exclusion of local adaptations canbe troublesome (Barlow 1995, Crandall et al. 2000). Yet, the value of determiningphylogenetic relationships among evolutionary lineages and integrating this infor-mation with knowledge of local adaptations remains underappreciated (Mayden& Wood 1995).
Recovering species must have continued opportunities to evolve. Waples (1995)envisioned this need by describing the evolutionary legacy of Pacific salmon as “a
Ann
u. R
ev. E
col.
Syst
. 200
2.33
:665
-706
. Dow
nloa
ded
from
arj
ourn
als.
annu
alre
view
s.or
gby
ST
EPH
EN
T. T
HR
EL
KE
LD
on
02/1
4/06
. For
per
sona
l use
onl
y.

12 Oct 2002 10:9 AR AR173-ES33-23.tex AR173-ES33-23.sgm LaTeX2e(2002/01/18)P1: IBC
SALMON RECOVERY SCIENCE 673
reservoir of genetic variability upon which future evolutionary potential depends.”Yet most ESU designations, including those in Pacific salmon, are based largelyon static views of evolution divergence. We seldom have a clear understandingof the multiple mechanisms by which patterns of evolutionary divergence (orconvergence) could have occurred. In order to evaluate the significance of divergentlineages to species persistence, and when necessary to establish priorities amongESUs, the potential processes that gave rise to patterns of divergence must beunderstood. There are at least two problems with viewing reproductive isolationand evolutionary divergence as two independent criteria that offer unambiguousindications of conservation unit boundaries.
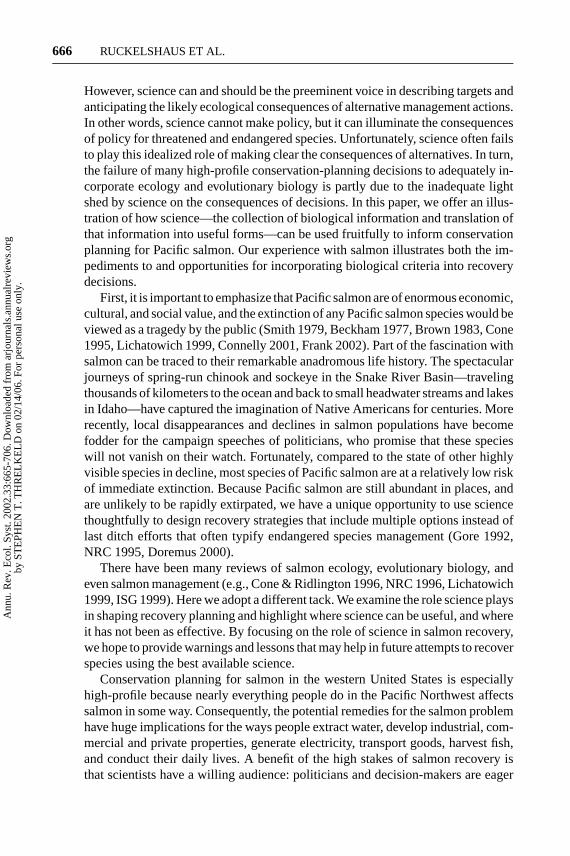
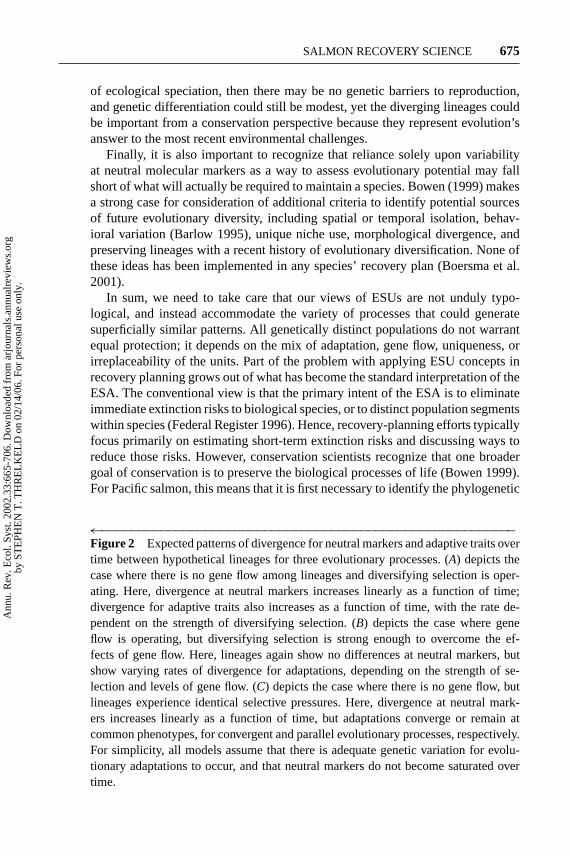
First, different evolutionary processes produce different rates of divergencebetween lineages for neutral markers (used to measure reproductive isolation)and adaptations. Applications of ESU concepts ignore these different processes,instead focusing on the degree of divergence at a single time. For example, rapidevolutionary shifts caused by selection can outpace neutral marker divergenceand lineage sorting by orders of magnitude (Figure 2A). In some cases, evolutionis so swift that distinct populations can be almost genetically indistinguishableat neutral alleles while showing significant adaptive divergence (Pascual et al.2001). Salmon introduced to novel environments offer striking evidence for thisphenomenon. Evolutionary radiations of chinook salmon in New Zealand (Quinnet al. 2001, Kinnison et al. 2002) and steelhead introduced to Argentina (Pascualet al. 2001) both show rapid life history divergence but very little neutral markerdivergence. More troubling are cases where gene flow is high (Waples 1998), butselection is strong enough for populations to evolve local adaptations (Figure 2B;e.g., Tallman & Healy 1991, 1994). Such populations, although not reproductivelyisolated, constitute important evolutionary components of the biological species,but probably warrant no unique protection. Finally, populations can show highlevels of reproductive isolation (measured by neutral markers) but show very littleor no phenotypic divergence. Stabilizing selection or convergent evolution betweengeographically isolated populations could both lead to this pattern (Figure 2C; e.g.,Teel et al. 2000, Craig & Foote 2001). Clearly, different evolutionary processes canlead to very different relationships between neutral markers and adaptive traits. Inshort, degree of divergence in traits per se is not a simple indicator of evolutionarilysignificant diversity that should be protected in a conservation plan.
Second, reproductive isolation and evolutionary divergence are not always in-dependent events, and isolation does not always precede adaptive differentiation.In fact, in many cases natural selection itself causes reproductive isolation. Thisoccurs when natural selection operates on traits that limit opportunities for groupsof individuals to mate, or limits reproductive success of hybrids. This process,dubbed ecological speciation (Schluter 1998, Johannesson 2001), could be quitecommon in Pacific salmon, where selection on traits such as run timing or homingability can result in spatial or temporal isolation among breeding groups. Recentevidence in sockeye salmon suggests that even subtle differences such as local mor-phological adaptation to spawning habitats can lead to early stages of reproductiveisolation (Hendry 2000). If we are viewing life history lineages in the early stages
Ann
u. R
ev. E
col.
Syst
. 200
2.33
:665
-706
. Dow
nloa
ded
from
arj
ourn
als.
annu
alre
view
s.or
gby
ST
EPH
EN
T. T
HR
EL
KE
LD
on
02/1
4/06
. For
per
sona
l use
onl
y.

12 Oct 2002 10:9 AR AR173-ES33-23.tex AR173-ES33-23.sgm LaTeX2e(2002/01/18)P1: IBC
674 RUCKELSHAUS ET AL.
Ann
u. R
ev. E
col.
Syst
. 200
2.33
:665
-706
. Dow
nloa
ded
from
arj
ourn
als.
annu
alre
view
s.or
gby
ST
EPH
EN
T. T
HR
EL
KE
LD
on
02/1
4/06
. For
per
sona
l use
onl
y.
12 Oct 2002 10:9 AR AR173-ES33-23.tex AR173-ES33-23.sgm LaTeX2e(2002/01/18)P1: IBC
SALMON RECOVERY SCIENCE 675
of ecological speciation, then there may be no genetic barriers to reproduction,and genetic differentiation could still be modest, yet the diverging lineages couldbe important from a conservation perspective because they represent evolution’sanswer to the most recent environmental challenges.
Finally, it is also important to recognize that reliance solely upon variabilityat neutral molecular markers as a way to assess evolutionary potential may fallshort of what will actually be required to maintain a species. Bowen (1999) makesa strong case for consideration of additional criteria to identify potential sourcesof future evolutionary diversity, including spatial or temporal isolation, behav-ioral variation (Barlow 1995), unique niche use, morphological divergence, andpreserving lineages with a recent history of evolutionary diversification. None ofthese ideas has been implemented in any species’ recovery plan (Boersma et al.2001).
In sum, we need to take care that our views of ESUs are not unduly typo-logical, and instead accommodate the variety of processes that could generatesuperficially similar patterns. All genetically distinct populations do not warrantequal protection; it depends on the mix of adaptation, gene flow, uniqueness, orirreplaceability of the units. Part of the problem with applying ESU concepts inrecovery planning grows out of what has become the standard interpretation of theESA. The conventional view is that the primary intent of the ESA is to eliminateimmediate extinction risks to biological species, or to distinct population segmentswithin species (Federal Register 1996). Hence, recovery-planning efforts typicallyfocus primarily on estimating short-term extinction risks and discussing ways toreduce those risks. However, conservation scientists recognize that one broadergoal of conservation is to preserve the biological processes of life (Bowen 1999).For Pacific salmon, this means that it is first necessary to identify the phylogenetic
←−−−−−−−−−−−−−−−−−−−−−−−−−−−−−−−−−−−−−−−−−−−−−−−−−−−−−−−−Figure 2 Expected patterns of divergence for neutral markers and adaptive traits overtime between hypothetical lineages for three evolutionary processes. (A) depicts thecase where there is no gene flow among lineages and diversifying selection is oper-ating. Here, divergence at neutral markers increases linearly as a function of time;divergence for adaptive traits also increases as a function of time, with the rate de-pendent on the strength of diversifying selection. (B) depicts the case where geneflow is operating, but diversifying selection is strong enough to overcome the ef-fects of gene flow. Here, lineages again show no differences at neutral markers, butshow varying rates of divergence for adaptations, depending on the strength of se-lection and levels of gene flow. (C) depicts the case where there is no gene flow, butlineages experience identical selective pressures. Here, divergence at neutral mark-ers increases linearly as a function of time, but adaptations converge or remain atcommon phenotypes, for convergent and parallel evolutionary processes, respectively.For simplicity, all models assume that there is adequate genetic variation for evolu-tionary adaptations to occur, and that neutral markers do not become saturated overtime.
Ann
u. R
ev. E
col.
Syst
. 200
2.33
:665
-706
. Dow
nloa
ded
from
arj
ourn
als.
annu
alre
view
s.or
gby
ST
EPH
EN
T. T
HR
EL
KE
LD
on
02/1
4/06
. For
per
sona
l use
onl
y.

12 Oct 2002 10:9 AR AR173-ES33-23.tex AR173-ES33-23.sgm LaTeX2e(2002/01/18)P1: IBC
676 RUCKELSHAUS ET AL.
history and current evolutionary trajectories of salmon lineages in order to definethe biological heritage we are charged to protect.
Identifying Conservation Units That areCommensurate with Conservation Goals
The ultimate goal of recovery planning is to foster natural persistence of im-periled species or conservation units. The difficulty in identifying relevant unitsarises from the fact that species continue to evolve, so it is not obvious whetherit is better to conserve existing diversity or save units with maximum potentialto adapt to changing environments. For example, if our underlying conservationgoal is to preserve historical diversity, then a recently evolved lineage with closelyrelated sister groups may have lower priority for protection than more distant evo-lutionarily distinct groups. Alternatively, if the goal is to foster future evolutionaryradiation, then it may make more sense to protect rapidly diversifying lineages(despite their recent common ancestry) as opposed to lineages that are older butmore evolutionarily inert.
Typically, data are not available to establish quantitative links between historicaldiversity or evolutionary potential and species viability. Instead, assertions aboutthe importance of conserving a representative sample of historical diversity ora species’ evolutionary potential are bolstered mainly by theoretical arguments(Lynch & Lande 1993, Lande & Shannon 1996, Storfer 1996). In practice, Pacificsalmon ESUs have been defined by reproductive isolation based on allozymefrequency data or morphological, life history, or habitat characteristics (Myerset al. 1998; Busby et al. 1994, 1996; Weitkamp et al. 1995; Hard et al. 1996;Gustafson et al. 1997). As mentioned above, listed ESUs all are protected underthe ESA, so recovery efforts must be made to ensure the persistence of any Pacificsalmon ESU threatened with extinction, irrespective of its contribution to the long-term persistence of the species.
The difficult choices about which units of Pacific salmon to conserve thereforeoccur within ESUs, at the level of populations. For salmon ESUs, populations aredefined based on their degree of relative demographic independence so that via-bility can be evaluated using single-population viability analysis (McElhany et al.2000). The conservation goal underlying identification of independent populationsis to determine how many and which viable populations are necessary for persis-tence of the ESU (Ruckelshaus et al. 2002). Work conducted to date suggests thatthe number of demographically independent populations per ESU ranges from 3 to30, and life history and genetic diversity vary greatly among populations within anESU (Ford et al. 2001, PS TRT 2001, Myers et al. 2002). Determining which popu-lations must be saved for ESU persistence involves identifying critical componentsof ESU diversity that must be protected. We believe that estimating the popula-tion diversity necessary for ESU persistence will benefit from a phylogenetic per-spective on the significance of the diversity we observe within salmon ESUs—atopic we address in the next section.
Ann
u. R
ev. E
col.
Syst
. 200
2.33
:665
-706
. Dow
nloa
ded
from
arj
ourn
als.
annu
alre
view
s.or
gby
ST
EPH
EN
T. T
HR
EL
KE
LD
on
02/1
4/06
. For
per
sona
l use
onl
y.
12 Oct 2002 10:9 AR AR173-ES33-23.tex AR173-ES33-23.sgm LaTeX2e(2002/01/18)P1: IBC
SALMON RECOVERY SCIENCE 677
Incorporating Evolutionary Pattern and Process intoIdentifying Relevant Units for Conservation
Given political, economic, and even biological constraints, conservation plannersare often forced to establish conservation priorities among evolutionary lineages.This necessity translates into difficult decisions about which traits should have pri-macy in establishing conservation priorities, or in extreme cases, deciding whichgroups are expendable. Conservation units—like most taxonomic designations—are best viewed as convenient ways of identifying and organizing phenotypic orgenetic differences among diverging lineages. Advances in intraspecific phylo-geography provide a historical framework to examine current patterns of evo-lutionary divergence in rare species and ESUs within species (Templeton 1998,Edwards & Beerli 2000, Avise 2001). Yet, in salmon recovery planning, very littleattention has been paid to phylogeographic patterns and the underlying processesthat give rise to distinct evolutionary lineages (see Bowen 1998, 1999; Moritz2002).
A phylogenetic perspective could be used to assess the relative importanceof salmon adaptations by revealing the order in which characters have evolvedthrough time (Avise 1989). For example, Quinn et al. (2000) argue that timing ofmigration is a key life history trait in salmon because it provides a means by whichpopulations become temporally isolated, thereby facilitating further divergencein secondary adaptations. Similar arguments could be made regarding the effectsof natal homing on spatial isolation among breeding groups. By mapping theevolution of migratory timing to a phylogeny, we can formally test whether theseadaptive traits consistently precede the evolution of secondary adaptations. Suchinformation would help clarify the relative importance of conserving particulartraits or populations containing such traits.
Phylogenies can also be used to identify the rarity of adaptations. For example,a recent reconstruction of relationships among rainbow trout populations in BritishColumbia showed a repeated evolutionary shift from anadromy to a freshwater lifecycle and repeated evolutionary divergence in adult migration timing (McCuskeret al. 2000). This pattern of independent evolution across multiple lineages suggeststhat on an evolutionary timescale, variation for both of these traits appears to bequite easy to recover. By comparison, sockeye salmon also show repeated evolutionfrom anadromy to freshwater life cycles, but adult migration timing appears to becanalized on a very local scale (Wood 1995). Hence, in sockeye salmon, careshould be taken to preserve populations containing adaptations associated withrun timing because these traits may be difficult or impossible to recover once lost.
In practice, conducting analyses to illuminate the history of evolutionary pro-cesses occurring within salmon ESUs (i.e., processes generating diversity amongpopulations) is difficult because of the ubiquitous presence of hatchery fish inmost ESUs. Transfers of hatchery fish between streams within ESUs, and evenfrom streams outside the geographic boundaries of an ESU, have been common-place since the early to mid 1900s (e.g., Myers et al. 1998). Hatchery fish usually
Ann
u. R
ev. E
col.
Syst
. 200
2.33
:665
-706
. Dow
nloa
ded
from
arj
ourn
als.
annu
alre
view
s.or
gby
ST
EPH
EN
T. T
HR
EL
KE
LD
on
02/1
4/06
. For
per
sona
l use
onl
y.

12 Oct 2002 10:9 AR AR173-ES33-23.tex AR173-ES33-23.sgm LaTeX2e(2002/01/18)P1: IBC
678 RUCKELSHAUS ET AL.
constitute an unknown fraction of the parents of any generation, so ascribingevolutionary mechanisms to observed genetic relationships or potential adaptivedifferences among stocks is very difficult.
Despite the difficulty in reconstructing patterns of and processes generatinghistorical diversity among populations, recovery teams recognize the importanceof describing major diversity groups within ESUs so that a representation of histor-ical diversity can be included among those populations given highest priority forconservation efforts. In areas where patterns of extant diversity are not seriouslytainted by the presence of hatchery fish, the approaches outlined in the previoussection are a promising means of more clearly identifying those populations har-boring significant sources of historical diversity or future evolutionary potential.Unfortunately, in order to characterize historical patterns of diversity among popu-lations, recovery teams in most cases will be forced to use proxy information, suchas historical diversity of habitat types or life history information from historicalfisheries. Decisions about which populations should have highest priority for pro-tection of diversity can then be based on what fraction of historical diversity acrossthe ESU is deemed necessary for recovery. To the extent such characterizationsof diversity can include a closer look at its likely evolutionary sources, we willimprove our choices about which groups of salmon to protect.
THE ORTHODOX EXPLANATION FOR SALMONDECLINES: HARVEST, HABITAT, HATCHERIES,AND HYDROPOWER
Pacific salmon have been extirpated from nearly 40% of their historical habitatin the Pacific Northwest, and of the remaining salmon populations, almost onehalf are thought to be at risk of extinction (Nehlsen et al. 1991, Levin & Schiewe2001). Recent quantitative estimates of extinction risk for 87 populations of 13listed ESUs of chinook, chum, and steelhead suggest that 84% of the populationscurrently are not viable (as judged by persistence over 100 years or high risk ofdecline) (McClure et al. 2002; NMFS’s recovery teams, unpublished data). How-ever, contrary to the dismal views conjured up by these risk calculations, salmonare capable of generating remarkable rates of population growth and have success-fully invaded many non-native ecosystems (Pascual et al. 2001, Quinn et al. 2001).Consequently, only modest changes in mortality may reverse salmon declines.
The key question for recovery then is, “What actions should we take to reversepopulation declines?” Unfortunately this question has too often been replaced bythe question, “What caused the historic decline of salmon?” These two questionsmight seem similar, but they actually set up the scientific problem in very dif-ferent ways. For example, it is clear that excessive harvest drove some salmonpopulations to low levels in the mid-twentieth century (NRC 1996). In response tothese declines, harvest was reduced to low levels in several ESUs; some ESUs re-sponded positively to harvest reductions—others did not (PSC 2001a,b). Therefore,
Ann
u. R
ev. E
col.
Syst
. 200
2.33
:665
-706
. Dow
nloa
ded
from
arj
ourn
als.
annu
alre
view
s.or
gby
ST
EPH
EN
T. T
HR
EL
KE
LD
on
02/1
4/06
. For
per
sona
l use
onl
y.
12 Oct 2002 10:9 AR AR173-ES33-23.tex AR173-ES33-23.sgm LaTeX2e(2002/01/18)P1: IBC
SALMON RECOVERY SCIENCE 679
further reductions in harvest are not likely to lead to recovery in all cases. In short,a factor could have caused a decline historically, but not be an effective place tolook for recovery now.
This is a case of scientists posing a question (what historic factors caused thedecline of salmon?) that does not shed as much direct light as one would hopeon the consequences of decisions regarding alternative management actions thatmight be taken now to reverse salmon declines. History is important, but even moreimportant is understanding the likely consequences of today’s alternative actions.Hence, as we examine the risk factors in the next few pages, we focus on whatmight be done today to reduce these risks, as opposed to focusing on the historyof ecological degradation and resource mismanagement that has gotten us to thecurrent situation.
A Historical Depiction of the Salmon Crisis:The Single-Factor Approach
Salmon biologists have long held that four major human-induced factors have beenresponsible for salmon declines: (a) habitat degradation; (b) hydroelectric damsand other impoundments; (c) harvest practices; and (d) the proliferation of fishhatcheries. These factors (colloquially called the four H’s) have been the primaryfocus of salmon recovery research and there is, indeed, considerable evidence thateach can have direct negative impacts on salmon population status—sometimesdramatically so.
Habitat Degradation and Loss
With exponential human population growth, increases in timber harvest, intensivegrazing, and urban development, habitat degradation is obviously a major factorunderlying salmon declines (NRC 1996). Documentation of the threats posed byhabitat loss and degradation generally has come in two forms: Large-scale, multi-factor correlative studies and smaller-scale explorations of the effects of a fewhabitat features on particular life stages of salmon. Results from broad-scale cor-relative studies suggest that human-influenced landscape features affecting salmonvary geographically. Human-induced characteristics such as percent of urbanizedor agricultural lands, poor water quality, and road density are associated withreductions in population productivity, adult densities, and early life-stage produc-tion for chinook and coho salmon over large geographic areas (Bradford & Irvine2000, Paulsen & Fisher 2001, Pess et al. 2002, Regetz 2002, Feist et al. 2002). Atthe other end of the geographic spectrum, there is a plethora of local-scale stud-ies demonstrating the effects of stream habitat characteristics on salmon densityand life history characteristics. Effects of such features as large woody debris instreams, water temperature and water flow, stream channel morphology, propor-tions of pools, riffles, and glides within streams, and nutrient budgets all can affectearly life stages of salmon and their total population productivity (reviewed byBeechie et al. 2002).
Ann
u. R
ev. E
col.
Syst
. 200
2.33
:665
-706
. Dow
nloa
ded
from
arj
ourn
als.
annu
alre
view
s.or
gby
ST
EPH
EN
T. T
HR
EL
KE
LD
on
02/1
4/06
. For
per
sona
l use
onl
y.

12 Oct 2002 10:9 AR AR173-ES33-23.tex AR173-ES33-23.sgm LaTeX2e(2002/01/18)P1: IBC
680 RUCKELSHAUS ET AL.
Results from neither the large- nor small-scale studies alone are adequate toguide recovery planning in freshwater habitats. The large-scale crude classes ofhabitat variables give little guidance regarding what specific actions might be takento rectify problems, and results from small-scale studies typically are not framedwithin the whole life cycle of salmon populations. Because of these realities, ithas proven very difficult to identify robust relationships between habitat variablesthat can be managed or restored and salmon population dynamics (Collings et al.1972, Regetz 2002). No one questions the importance of habitat to salmon; but noone has unequivocal recipes for how to alter habitat in a way that encourages therecovery of depleted salmon populations.
Management of habitat for salmon recovery reflects the difficulty articulatedabove—it largely has proceeded along two philosophically divergent tacks: (a) fixin-stream habitat characteristics so that they resemble those required by salmon, or(b) fix the landscape processes within watersheds so that in-stream habitat functionsnaturally, thus supporting all species in the ecosystem. The first approach has beencriticized because of its focus on the symptoms, rather than the causes of habitatdysfunction (Frissell & Nawa 1992, Beechie et al. 1996, Beechie & Bolton 1999).A favorite example is in cases where thousands of dollars are spent in dumpinghigh quality spawning gravels into a stream, only to have them be washed outof the system within a matter of months because the processes governing gravelrecruitment have not been adequately repaired. Furthermore, rarely have eitherof the approaches to habitat management attempted to quantify fish populationresponses—the general assumption of habitat management is, “if you build it, theywill come.” A few good studies have shown how impossibly long lists of projectsdesigned to fix processes or habitat features in a watershed can be prioritized withexplicit comparison of the effects of alternative projects on fish population vitalrates (e.g., Reeves et al. 1989, 1991; Beechie et al. 1994).
Hydroelectric Dams and Impoundments
Dams clearly harm anadromous salmon through their effects on the amount, timing,and characteristics of water flows and by blocking access to previously availablehabitat (Raymond 1988, Williams & Tuttle 1992, Bednarek 2001). The effectsof hydropower development on salmon are vividly illustrated in the ColumbiaRiver Basin in the Pacific Northwest. For example, the construction of the Hell’sCanyon dam resulted in the loss of 90% of the historic spawning habitat of fall-runchinook in the Snake River Basin (a major tributary of the Columbia River) inIdaho, landing this ESU squarely on the Endangered Species list (McClure et al.2001). Even passable dams can be devastating to salmon—they convert rivers intoreservoirs, change aquatic communities (Bednarek 2001), and also present passagechallenges to down- and upstream migrants. For example, survival of juvenile chi-nook in the Columbia River during their seaward migration dramatically declinedas hydropower projects were constructed along their migration corridor through
Ann
u. R
ev. E
col.
Syst
. 200
2.33
:665
-706
. Dow
nloa
ded
from
arj
ourn
als.
annu
alre
view
s.or
gby
ST
EPH
EN
T. T
HR
EL
KE
LD
on
02/1
4/06
. For
per
sona
l use
onl
y.
12 Oct 2002 10:9 AR AR173-ES33-23.tex AR173-ES33-23.sgm LaTeX2e(2002/01/18)P1: IBC
SALMON RECOVERY SCIENCE 681
the 1960s–1970s (Williams et al. 2001). This reduction in survival was associatedwith subsequent declines in adults returning to spawn (Schaller et al. 1999, Levin& Tolimieri 2001).
Much has been done to reduce the impacts of dams that completely block ac-cess to historical habitats. Logistically and financially demanding interventionssuch as truck and haul projects and creation of artificial spawning habitats haverecreated whole salmon runs in areas completely isolated from the sea (WDFW &WWTIT 1993, Gustafson et al. 1997). Without constant human assistance, thesepopulations would perish. The success of engineering solutions is even more strik-ing in situations where hydropower projects provide for fish passage and upriverhabitats are plentiful. Most noteworthy are the mitigation measures designed toreduce passage mortality in the Columbia Basin hydropower system after 1975—including fish-passage facilities, predator control, barging fish around dams, andflow augmentation. Taken together, these expensive efforts (costing billions ofdollars) have increased the survival of spring/summer chinook salmon migrants tolevels similar to those experienced before the hydropower construction boom ofthe 1960s–1970s (NRC 1996, Williams et al. 2001). Nevertheless, there are otherecological consequences of hydropower operations that are not captured by sim-ply measuring the survival of chinook salmon while migrating through the riversystem (ISG 1996).
Harvest Practices
Commercial and recreational harvests have had clear negative impacts on Pacificsalmon (NRC 1996). In addition to direct mortality caused by fishing, indirectmortality owing to hooking fish that are not ultimately landed or catch and re-lease programs have been documented—the Pacific Salmon Commission uses anaverage hook and release mortality of 30% (PSC 1997). Furthermore, effects offishing on life history traits—most notably, size-selectivity on adults and resultantreductions in fecundity (Healey 1986; Ricker 1995; Weitkamp et al. 1995; Ratner& Lande 2001; Hard 2002a,b)—can significantly impair population dynamics inways that are difficult to quantify.
Often, one of the earliest steps taken to redress declines is to reduce harvest.In some cases, reduction in fishing pressure has coincided with a dramatic re-versal of salmon declines. Such appears to have been the case for summer chumsalmon returning to streams in Hood Canal, Washington (Figure 3). Although therecent rebound in numbers of summer chum salmon escaping to spawn might beattributed to harvest reductions, recent improvements in ocean survival probablyalso contribute to their increasing numbers. In contrast to the apparent success ofharvest management in addressing declines in Hood Canal summer chum popula-tions, reductions in harvest levels have not improved population status of chinookpopulations a few kilometers across Puget Sound (PSC 2001b). Clearly, otherthreats to the chinook salmon in northern Puget Sound must be addressed.
Ann
u. R
ev. E
col.
Syst
. 200
2.33
:665
-706
. Dow
nloa
ded
from
arj
ourn
als.
annu
alre
view
s.or
gby
ST
EPH
EN
T. T
HR
EL
KE
LD
on
02/1
4/06
. For
per
sona
l use
onl
y.

12 Oct 2002 10:9 AR AR173-ES33-23.tex AR173-ES33-23.sgm LaTeX2e(2002/01/18)P1: IBC
682 RUCKELSHAUS ET AL.
Figure 3 Total exploitation rates (the fraction of total number of summer chumreturning to Hood Canal killed owing to direct and incidental harvest in Washingtonand Canadian waters) and numbers of summer chum salmon escaping to spawn instreams in Hood Canal, WA from 1974–2001 (data from WDFW & PNPTT 2000;T. Johnson, WDFW, personal communication).
Hatchery Propagation of Salmon
A common solution to the ills of salmon populations is to release sometimes enor-mous numbers of hatchery-reared fish (Lichatowich 1999). Each year hatcheriesalong the west coast of the United States release nearly 1.2 billion juvenile salmon(Mahnken et al. 1998), with 200 million salmon released annually into the ColumbiaRiver alone. There is extensive disagreement over the degree to which hatcheryprograms contribute to or detract from the viability of wild salmon populations.There are well-documented differences between hatchery and wild Pacific salmonin their survival, reproductive, foraging, and social behaviors, habitat preferences,response to predators, morphology, and physiology (reviewed by Flagg et al. 2000).These differences potentially can affect ecological and genetic interactions be-tween wild and hatchery salmon, and it is clear that negative impacts of hatcheryfish do occur in some cases. Misuse of hatcheries has the potential to reduce the
Ann
u. R
ev. E
col.
Syst
. 200
2.33
:665
-706
. Dow
nloa
ded
from
arj
ourn
als.
annu
alre
view
s.or
gby
ST
EPH
EN
T. T
HR
EL
KE
LD
on
02/1
4/06
. For
per
sona
l use
onl
y.

12 Oct 2002 10:9 AR AR173-ES33-23.tex AR173-ES33-23.sgm LaTeX2e(2002/01/18)P1: IBC
SALMON RECOVERY SCIENCE 683
viability of natural salmon populations through effects on vital rates or life historytraits such as run timing (Nicholas & Hankin 1988; Fleming & Gross 1993; Hilborn1992, 1999; Meffe 1992; NRC 1996; Reisenbichler & Rubin 1999; Waples 1999).Translocations of salmon through hatchery programs and subsequent introgres-sion of non-native hatchery-origin genes into wild populations can reduce fitnessof wild salmon (e.g., Zinn et al. 1977, Reisenbichler & Rubin 1999). Moreover, re-duced smolt-to-adult returns in wild populations of chinook salmon are associatedwith exceptionally large releases of hatchery fish (Levin et al. 2001).
A risk/benefit analysis of hatchery fish must consider the goals of the hatcheryprogram; generally, hatchery management is designed either to supplement declin-ing wild populations (supplementation programs) or to provide extra salmon forharvest (production programs). Supplementation programs are designed to end—the goal is to produce a naturally self-sustaining population of salmon. Ideally,these programs maximize recovery of wild stocks while minimizing negative ge-netic or ecological impacts of the hatchery fish. In a recent review, Flagg et al.(2000) identified only three successful supplementation programs (i.e., a self-sustaining population of salmon existed after artificial propagation ended) amongscores of candidates (see also Waples et al. 2002). In contrast to supplementationprograms, production programs often are designed to exist in perpetuity so thatfishers can be assured of catching salmon. Through the late 1980s, in spite ofincreased hatchery production of coho salmon along the Oregon coast and chi-nook salmon in Puget Sound, adult returns did not increase as hoped (Stouderet al. 1996; PSC 2001a,b). Risk evaluations on such hatcheries must evaluate thenegative ecological and genetic interactions that can occur during juvenile rear-ing and outmigration stages, threats to adults in mixed hatchery-wild fisheries,competition for spawning sites, and interbreeding between wild and hatchery fish.These potential risks are not trivial—for example, in chinook populations wherehatchery fish are marked, escaped hatchery salmon can constitute up to 60% of thespawning population in areas without planned supplementation programs (NMFS,unpublished data).
All Risk Factors Do Not Conveniently Fitinto the 4-H Framework
Although scientists and federal agencies tend to emphasize the four H’s as keysto salmon recovery (NRC 1996, NMFS 2000b), there are many other sources ofsalmon population declines. For example, the productivity of the Pacific Oceanvaries in decadal oscillations, with sometimes tenfold changes in smolt-to-adultsurvival (Mantua et al. 1997, Hare et al. 1999, Hollowed et al. 2001). In addition,shorter-term events such as El Ni˜no (occurring every two to seven years) arenegatively related to sockeye population sizes in Alaska and British Columbia(Mysack 1986). During prolonged periods of bad ocean conditions, salmon maydo so poorly that their populations plummet without any help from human factors(Beamish et al. 1999, McFarlane et al. 2000, Welch et al. 2000).
Ann
u. R
ev. E
col.
Syst
. 200
2.33
:665
-706
. Dow
nloa
ded
from
arj
ourn
als.
annu
alre
view
s.or
gby
ST
EPH
EN
T. T
HR
EL
KE
LD
on
02/1
4/06
. For
per
sona
l use
onl
y.

12 Oct 2002 10:9 AR AR173-ES33-23.tex AR173-ES33-23.sgm LaTeX2e(2002/01/18)P1: IBC
684 RUCKELSHAUS ET AL.
In addition to the stresses of bad ocean years, salmon face many other naturalrisks that threaten their persistence. Papers quantifying the effects of either pre-dation or competition on Pacific salmon populations are plentiful (e.g., Reimers1973, Glova 1984, Ruggerone 1986, Wood 1987, Gearin et al. 1989, Healey 1991,NOAA 1997, Collis et al. 2001). Notably high-profile stories include reports ofCaspian terns eating an estimated 7% to 15% of the 100 million salmonid juvenilesmigrating downstream in the Columbia River (NMFS 1995, Collis et al. 2001) andsea lions eating up to 65% of steelhead adults returning to Lake Washington inPuget Sound, Washington (Gearin et al. 1988, 1989).
Finally, salmon are exposed to another form of environmental degradation thathas recently come into the limelight as a global factor: the invasion of ecosys-tems by exotic species. In the western United States, exotic species now makeup to 59% of the fish fauna (Moyle et al. 1986) and are common even in areasthat are otherwise pristine (see, e.g., Achord et al. 1997), leading ecologists tosuggest that nonindigenous species may rank highest among threats to imper-iled species (Vitousek 1994, Simberloff 2000). Levin and colleagues (Levin et al.2002) showed that survival of juvenile chinook in streams without exotic brooktrout was nearly double that in streams with brook trout, even after differences inhabitat were taken into account. The difference in juvenile chinook survival be-tween sites with and without brook trout would increase population growth rate (λ)by about 2.5%—an increase sufficient to reverse the negative population growthobserved in many chinook populations of the Snake River Basin (McClure et al.2002).
Furthermore, the effects of nonindigenous species can be much less direct thanthat of brook trout. For example, one of the most important native predators ofjuvenile salmon in mainstem rivers and reservoirs as they make their seawardmigration is the pike minnowPtychocheilus oregonensis(Rieman et al. 1991).NMFS estimates that each year pike minnow consume 16.4 million salmonidsin the Columbia River Basin alone (NMFS 2000c). It is interesting to note thatthe prominence of the pike minnow as a predator may result from interactionswith exotic fishes (Poe et al. 1994). In the absence of nonindigenous fishes, suchas small-mouth bass, walleye, or channel catfish, salmonids constituted only 2%of the diet of pike minnow (Buchanan et al. 1981). Instead, crayfish, insects,and sculpins dominated the diet. Poe and colleagues (1994) concluded that ashift in the pike minnow diet to salmon results from competition with exoticpredators for sculpins and crayfish. Thus, in the absence of exotic piscivorousfishes, the impact of even native predators such as pike minnow may be re-duced.
Management attention to the effects of ecological interactions and ocean con-ditions on salmon populations has been inconsistent at best. The lack of a system-atic consideration of ecological and natural environmental conditions in salmonmanagement plans can be attributed in part to lack of scientific information.For example, in the few cases where ecological impacts of predators on sal-mon were well documented (e.g., Caspian terns, sea lions, and pike minnow),
Ann
u. R
ev. E
col.
Syst
. 200
2.33
:665
-706
. Dow
nloa
ded
from
arj
ourn
als.
annu
alre
view
s.or
gby
ST
EPH
EN
T. T
HR
EL
KE
LD
on
02/1
4/06
. For
per
sona
l use
onl
y.

12 Oct 2002 10:9 AR AR173-ES33-23.tex AR173-ES33-23.sgm LaTeX2e(2002/01/18)P1: IBC
SALMON RECOVERY SCIENCE 685
management plans included—sometimes even featured—actions designed to re-duce predation on salmon (Gearin et al. 1988, Beamesdurfer et al. 1996, Friesenet al. 1999, NWPPC 2001). The contents of salmon management plans thus appearto be guided by serendipitous treatment of these effects by scientists, rather thana more holistic biological vision of threats analysis.
RECOVERY REQUIRES ATTENTION TO INTERACTIONSAMONG RISK FACTORS AND A MIX OF OPTIONSFOR IMPROVEMENT
Although examples exist in which single factors appear to be primarily responsiblefor the decline of salmon populations, the demise of salmon nearly always resultsfrom a constellation of factors throughout their life history (Lawson 1993, NRC1996, Brodeur et al. 2000, Finney et al. 2000, Levin & Schiewe 2001). The tidycompartmentalization of risks is convenient and analytically tractable, yet it ne-glects cumulative or interactive effects of risk factors. The alternative—comparingthe relative value of a fix to one H to improvements accomplished by instead fixingmore than one H (Kareiva et al. 2000)—has never been incorporated into a man-agement plan to our knowledge. Because of the uncertainties inherent in predictingthe effects of improvements in the H’s on salmon populations, distributing effortsamong several known threats increases the chances that hoped-for biological re-sponses will occur. Thus, even if removing all hydropower projects or removingall hatcheries might recover salmon, the more scientifically prudent approach is toconsider simultaneous alterations in many of the H’s.
For some salmon ESUs, we actually have enough demographic detail in termsof stage-specific mortality rates that one can even use matrix models to examinethe impacts of mixed-management activities. For example, Kareiva et al. (2000)found that a mix of modest reductions in juvenile mortality and estuarine mortalitytogether could reverse the declining trends in Snake River spring-summer chinooksalmon.
Ecologists are comfortable testing for significant effects. In salmon, all H’s exerta significant effect, and the more pertinent question concerns relative importance,which is much harder to estimate. As a first approximation to this issue, currentlywe are gathering data for a large-scale comparative study designed to explorethe combined effects of the threats to population status for salmon in California,Oregon, Idaho, and Washington. We have formulated an a priori set of candidatemodels that reflect a competing suite of biological hypotheses to explain salmonabundance and trends (Figure 4). Justification for these hypotheses is based onwhat we know about potential interactions among risk factors as illustrated by theexamples below. A strength of this approach is that information theory can be usedto select a best approximating model (or set of models) that can then be used toinfer the relative importance of those factors thought to impact salmon populationtrends directly or indirectly (e.g., Hilborn & Mangel 1996, Burnham & Anderson
Ann
u. R
ev. E
col.
Syst
. 200
2.33
:665
-706
. Dow
nloa
ded
from
arj
ourn
als.
annu
alre
view
s.or
gby
ST
EPH
EN
T. T
HR
EL
KE
LD
on
02/1
4/06
. For
per
sona
l use
onl
y.

12 Oct 2002 10:9 AR AR173-ES33-23.tex AR173-ES33-23.sgm LaTeX2e(2002/01/18)P1: IBC
686 RUCKELSHAUS ET AL.
Figure 4 One of several possible model path diagrams depicting the direct and in-direct effects of five putative causes of salmon declines (H’s—see text) on salmonpopulation status. The four H’s (gray shaded circles) are modeled here as latent vari-ables that can be estimated by factor analysis from a set of measured environmentalparameters thought to collectively describe the factor of interest. A fifth factor (lightgray shaded circle), defined here as natural ecological conditions (e.g., ocean condi-tions, interactions with nonindigenous species), could also shape salmon populationdynamics, and although not modeled explicitly, could also interact with any of the fourH’s. The dependent variable, population status, is modeled as a latent variable (black-ened circle) to be estimated from trend (i.e.,λ) and change in abundance of salmonfrom historical levels. Residual variation (not explained by the combination of predic-tor variables) is depicted as an unmeasured factor (open circle). Arrows indicate theregressions of the H’s on population status (direct effects) and on each other (indirecteffects). Using model selection criteria, each candidate model (i.e., each combinationof paths) represents a biological hypothesis that can be evaluated for fit to collecteddata to determine the most likely correlative causes of salmon decline.
1998, Anderson et al. 2000). Neither of the holistic analyses we are conductinginforms us about how to improve population status, but they do reinforce thevalue of pursuing improvements simultaneously in multiple life stages and acrossthreats—something that is often overlooked when assigning blame to each of thefour H’s.
Ann
u. R
ev. E
col.
Syst
. 200
2.33
:665
-706
. Dow
nloa
ded
from
arj
ourn
als.
annu
alre
view
s.or
gby
ST
EPH
EN
T. T
HR
EL
KE
LD
on
02/1
4/06
. For
per
sona
l use
onl
y.

12 Oct 2002 10:9 AR AR173-ES33-23.tex AR173-ES33-23.sgm LaTeX2e(2002/01/18)P1: IBC
SALMON RECOVERY SCIENCE 687
Hatchery and Harvest Interactions
Recent harvest rates on federally listed Pacific salmon populations range fromnear 0 to 60% (PSC 2001b). As mentioned earlier, in many areas, a major reasonfisheries persist is because of hatchery programs that provide fish to be caught.Depending on the extent of ecological and genetic interactions between hatcheryand wild fish throughout their life cycle and the degree to which hatchery fishbuffer wild fish from threats such as harvest, the net effect of hatchery programson wild populations could be negative or positive (see “Hatchery Propagation ofSalmon,” above).
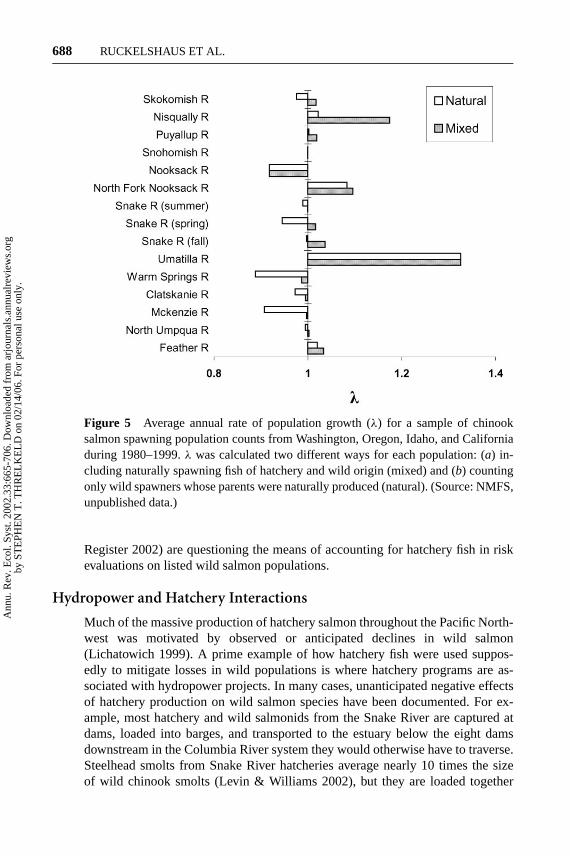
Aside from the potential direct and indirect negative effects of hatchery salmonon wild salmon, hatchery fish can mask the true status of wild fish in a population.In the Pacific Northwest, hatchery fish currently contribute 70% to 80% of the totalsalmon catch in coastal fisheries (Flagg et al. 2000). Some argue that the prevalenceof hatchery fish in the catch should alleviate concerns about high harvest rates onlisted salmon populations. The real test of whether harvest rates are significantlynegatively affecting wild salmon populations is to estimate the status of the popu-lations with and without harvest. This seemingly straightforward task is made verydifficult because of the often unknown fraction of hatchery fish that are includedin estimates of total potential returns to freshwater (recruits), catch, and spawningadults. For most populations of salmon, the proportion of hatchery fish mixed inwith a count of total fish is not known—in some cases, estimates are available fora few years, and in very rare cases (e.g., where tagged fish can be automaticallycounted at dams), time series of hatchery fish in a run are available. In other words,in many cases, it is not possible to estimate the true status of wild salmon popula-tions because of the presence of an unknown fraction of hatchery fish. In popula-tions for which we have time series of estimates of total abundance and hatcherycounts, the estimates ofλ will always be lower when the presence of hatchery fishis factored out of the calculations in attempts to estimate the status of wild fish.Figure 5 illustrates variation in the effect hatchery fish have on estimates ofλ for 15populations of chinook salmon from Washington, Oregon, Idaho, and California.
Pacific salmon harvest managers must make annual decisions about levels offishing mortality that do not constitute jeopardy to listed stocks under the ESA,defined as the case where an action does not “reduce appreciably the likelihood ofboth the survival and recovery of a listed species in the wild” (50 CFR S402.02).All the populations represented in Figure 5 are still harvested at rates greater than30%—for example, the Nooksack chinook population in northern Puget Sound,Washington (in a listed ESU) had a mean harvest rate of over 52% in the yearsspanning 1989–1999 (PSC 2001b), and the population growth rate of wild chinookover that same time period was less than one. For populations with unknown frac-tions of hatchery fish included in total population counts, estimates of appreciablerisk from harvest are fraught with uncertainty. This issue is especially pressing inthe present political climate, where legal rulings such as the Hogan decision (e.g.,Alsea Valley Alliance v. Evans2001) and ongoing petitions to NMFS (Federal
Ann
u. R
ev. E
col.
Syst
. 200
2.33
:665
-706
. Dow
nloa
ded
from
arj
ourn
als.
annu
alre
view
s.or
gby
ST
EPH
EN
T. T
HR
EL
KE
LD
on
02/1
4/06
. For
per
sona
l use
onl
y.
12 Oct 2002 10:9 AR AR173-ES33-23.tex AR173-ES33-23.sgm LaTeX2e(2002/01/18)P1: IBC
688 RUCKELSHAUS ET AL.
Figure 5 Average annual rate of population growth (λ) for a sample of chinooksalmon spawning population counts from Washington, Oregon, Idaho, and Californiaduring 1980–1999.λ was calculated two different ways for each population: (a) in-cluding naturally spawning fish of hatchery and wild origin (mixed) and (b) countingonly wild spawners whose parents were naturally produced (natural). (Source: NMFS,unpublished data.)
Register 2002) are questioning the means of accounting for hatchery fish in riskevaluations on listed wild salmon populations.
Hydropower and Hatchery Interactions
Much of the massive production of hatchery salmon throughout the Pacific North-west was motivated by observed or anticipated declines in wild salmon(Lichatowich 1999). A prime example of how hatchery fish were used suppos-edly to mitigate losses in wild populations is where hatchery programs are as-sociated with hydropower projects. In many cases, unanticipated negative effectsof hatchery production on wild salmon species have been documented. For ex-ample, most hatchery and wild salmonids from the Snake River are captured atdams, loaded into barges, and transported to the estuary below the eight damsdownstream in the Columbia River system they would otherwise have to traverse.Steelhead smolts from Snake River hatcheries average nearly 10 times the sizeof wild chinook smolts (Levin & Williams 2002), but they are loaded together
Ann
u. R
ev. E
col.
Syst
. 200
2.33
:665
-706
. Dow
nloa
ded
from
arj
ourn
als.
annu
alre
view
s.or
gby
ST
EPH
EN
T. T
HR
EL
KE
LD
on
02/1
4/06
. For
per
sona
l use
onl
y.
12 Oct 2002 10:9 AR AR173-ES33-23.tex AR173-ES33-23.sgm LaTeX2e(2002/01/18)P1: IBC
SALMON RECOVERY SCIENCE 689
into the same barges at densities up to 60 g/L. The result of the shared ride ap-pears to be substantially reduced survival of the wild chinook (Levin & Williams2002).
Another unintended consequence of hatchery practices is to concentratesalmonid juveniles after their release into freshwater, which can lead to highersusceptibility to predators who cue off of prey densities (reviewed by Flagg et al.2000, Collis et al. 2001). Because of blockages such as dams and locks, increasedpredation rates on adult salmon also have been observed (Gearin et al. 1988, 1989;Nash et al. 2000).
Interactions Between Natural Processes andHuman Activities
Not only can the effects of the four H’s interact with each other, but they alsointeract with the environment. For example, human activities may interact withthe environment by altering the strength of competitive interactions in the sea.Levin et al. (2001) showed that when releases from hatcheries are high andocean productivity is low, the survival of chinook salmon in the marine phasedeclines. Similarly, Cooney & Brodeur (1998) found that hatchery effects onwild salmon depend on freshwater habitat capacity and ocean conditions expe-rienced by the wild and hatchery fish. Recent improvements in rearing practiceshave resulted in hatchery-reared salmon that are now larger than their wild coun-terparts and exhibit greater marine survival than wild fish (Zabel & Williams2002).
Another example of interactions between human threats and environmentalsources of variability is found in the complicated effects of dams on salmon. Thetendency to focus solely on direct mortality of salmon through dams ignores thepossibility that factors affecting the fish before or after they pass through hy-dropower projects act synergistically with dams to reduce survival (Budy et al.2002). For instance, recent work has highlighted the ecosystem importance ofreturning salmon that can have positive direct and indirect feedbacks on salmonpopulation dynamics. Nutrients derived from decomposing salmon carcasses arenow recognized to play an important role in the ecology of Pacific Northwest ripar-ian habitats (Gresh et al. 2000). For one, the delivery of marine-derived nutrientsby salmon returning from the sea appears to be crucial to the growth of juvenilesalmon (Bilby et al. 1996, 1998; Larkin & Slaney 1997; Wipfli et al. 1999). Thus,the extreme reduction in salmon abundance caused by dams ostensibly has resultedin a nutrient deficit that could have contributed to reduced size of outmigratingjuveniles (compare Bilby et al. 1998). Furthermore, hydropower projects slow themigration of salmon by several weeks, and this delay in migration appears to ex-acerbate size-selective marine mortality (Zabel & Williams 2002). Together, theseindependent results suggest that it is possible that the effects of nutrient deficien-cies in the freshwater habitat are amplified by dams, resulting in increased marinemortality of juvenile salmon.
Ann
u. R
ev. E
col.
Syst
. 200
2.33
:665
-706
. Dow
nloa
ded
from
arj
ourn
als.
annu
alre
view
s.or
gby
ST
EPH
EN
T. T
HR
EL
KE
LD
on
02/1
4/06
. For
per
sona
l use
onl
y.
12 Oct 2002 10:9 AR AR173-ES33-23.tex AR173-ES33-23.sgm LaTeX2e(2002/01/18)P1: IBC
690 RUCKELSHAUS ET AL.
An Integrated Threats Analysis for Salmon Recovery
Scientists and managers engaged in salmon recovery increasingly are realizingthe importance of whole-life-cycle, whole-ecosystem approaches to identifyingsignificant threats to salmon populations. For example, a recent NRC panel leveledcriticism against current practices of stock assessment and management for failingto account adequately for environmental fluctuations in their harvest decisions(NRC 1998), and a group of lead scientists from agencies involved in salmonmanagement trumpeted the need for integrated research on classically isolatedproblems facing salmon (ISAB 2001a, ISST 2001).
Conducting more relevant research and using better models in making man-agement decisions are relatively obvious things to change about the way risks tosalmon populations are managed. Clearly, a widely agreed upon and supportedstrategic research plan is needed to organize guidance for salmon recovery ef-forts. More politically and logistically difficult to implement are manipulative,large-scale management experiments followed by thorough monitoring. Impres-sive experiments such as shutting down harvest or hatcheries or removing damshave been heralded as excellent ways to learn how salmon really would respondto improvements in their complex ecosystems (RSRP 2001). We agree with thosepleas for experimentation—but we have not seen any undertaken yet. In the meantime, admitting sources of uncertainty, planning for alternative future states (e.g.,Groves 2000), and generating technical analyses that offer a comparison of mul-tiple options for recovering salmon will increase the chances that scientific inputinforms final recovery decisions designed to abate threats facing the fish.
GETTING REAL—SALMON RECOVERYPLANNING IN PRACTICE
The Art of Recovery Planning for Threatened andEndangered Salmonids: Creating Options
Two technical recovery teams established by the NMFS have been underway forabout two years (Puget Sound and Willamette–Lower Columbia River domains),and three others were convened in the fall of 2001 (Interior Columbia Basin, south-ern Oregon–northern California, and California coastal domains; Figure 1). Oneof us (MR) is the chair of the Puget Sound recovery team. The technical chal-lenges are a small part of the overall task of developing a recovery plan for listedchinook, chum, and sockeye ESUs within our geographic domain. The recoveryteams are multi-stakeholder groups whose members are diverse, but all have thenecessary technical backgrounds to satisfy recovery team selection criteria. On thePuget Sound team, we have representatives from federal, state, tribal, and localentities, each of whom views the problem from a distinct perspective. The perspec-tives of team members come from their experiences in biology spanning harvestmanagement, local government, and basic science backgrounds. In addition, the
Ann
u. R
ev. E
col.
Syst
. 200
2.33
:665
-706
. Dow
nloa
ded
from
arj
ourn
als.
annu
alre
view
s.or
gby
ST
EPH
EN
T. T
HR
EL
KE
LD
on
02/1
4/06
. For
per
sona
l use
onl
y.

12 Oct 2002 10:9 AR AR173-ES33-23.tex AR173-ES33-23.sgm LaTeX2e(2002/01/18)P1: IBC
SALMON RECOVERY SCIENCE 691
member agencies represented on the team have been embroiled in salmon wars fordecades—the recent listing under the ESA has merely brought their disputes intosharper focus. Nevertheless, having a diverse set of technical perspectives is thepoint of setting up multi-stakeholder recovery teams—the hope is that alternativeviews can be hashed out through the team dynamics, thus producing a relativelyharmonized recovery plan that will be easier to communicate to parties on thepolicy end.
Nonscientists often are unaware of how contentious biological tasks such asthose facing the recovery teams can be—truisms such as “numbers don’t lie”lead to expectations that scientific disagreements are relatively easy to resolve. Infact, major technical disagreements stemming from philosophical differences thatseem to run as deep as religious beliefs are commonplace in such technical teams.For example, one of our early jobs as a recovery team was to agree on viabilitycriteria for the 21 demographically independent populations of chinook we haveidentified in Puget Sound (PSTRT 2001). Because of the previous thought and workthat had gone into justifying the importance of four key population parameters—abundance, productivity or growth rate, spatial structure, and diversity (McElhanyet al. 2000)—there was virtually no debate among team members on what thebiological indicators of viability should be.
In contrast, the debate among recovery team members was heated on howbest to model viability quantitatively. In particular, strong differences emergedfor preferable model structure and complexity, the importance of incorporatingdensity-dependence into population dynamic models, and whether representinguncertainty around model results was important. After a long period of debatingthe relative merits of alternative approaches, the team agreed to explore a number ofdifferent models aimed at addressing the same basic question: How many salmonare needed for a population to have a negligible risk of extinction over 100 years?Preliminary results from two of several planned alternative modeling approachesproduced ranges of viable population size that are large and overlapping. Just thesimple exercise of displaying these ranges to policy-makers has led to a betterunderstanding of why different scientists produce results that do not agree. Thetechnical team is working with the policy group organizing recovery planning inPuget Sound to decide how best to summarize and communicate these disparatetechnical results. This seems like such a simple solution to a seemingly unresolv-able debate—but it is surprising how rarely a multi-model approach is used in con-servation and management applications (Kareiva et al. 1998, Boersma et al. 2001).
Pacific salmon recovery teams are exploring another novel approach—scenariosanalysis—to increase the chances that biological results will influence recovery-planning decisions. The idea behind scenario analysis is simple: When uncertaintyis enormous, bundle it together in a small number of scenarios (usually three to five)that can then be more easily examined than a complicated model with hundreds oreven thousands of unknown parameters. Each scenario should capture a coherentset of assumptions that is embraced by an important stakeholder group or scientificgroup. An example in the salmon world might be the notion that the major source
Ann
u. R
ev. E
col.
Syst
. 200
2.33
:665
-706
. Dow
nloa
ded
from
arj
ourn
als.
annu
alre
view
s.or
gby
ST
EPH
EN
T. T
HR
EL
KE
LD
on
02/1
4/06
. For
per
sona
l use
onl
y.

12 Oct 2002 10:9 AR AR173-ES33-23.tex AR173-ES33-23.sgm LaTeX2e(2002/01/18)P1: IBC
692 RUCKELSHAUS ET AL.
of current salmon risk is ocean conditions, and that other risk factors such ashydropower, hatcheries, and habitat explain much less about the recent declines.Given a limited number of scenarios, scientists can then present the data that supportor contradict each scenario, and policy-makers can examine the consequences ofalternative management actions assuming different scenarios are apt reflections ofreality.
Such an approach has been used in a few conservation applications—high-profile examples include the IPCC for global climate change actions and the Mil-lenium Assessment project evaluating the value of global biodiversity under alter-native future states—and its popularity is increasing (Reid 2000; Sala et al. 2000;Clark et al. 2001; MA 2001; G. Peterson et al., unpublished data).
Pacific salmon recovery teams are using scenarios to address two main ques-tions: (a) How many and which populations within an ESU must be naturallyself-sustaining for the ESU to be considered recovered (i.e., what does recoverylook like)? and (b) What actions are necessary to recover populations and ESUs(i.e., how do we get there)? The first question is one that is likely to have multipleanswers because most ESUs are comprised of many populations—for example, thePuget Sound chinook ESU has at least 21 demographically independent popula-tions (PSTRT 2001), and it is plausible that not all will need to be viable for the ESUto have a negligible risk of extinction. The Puget Sound technical recovery teamis looking at multiple ways of combining population characteristics to describea recovered ESU. The key to generating multiple solutions is first to set desiredESU-wide targets for abundance, productivity/growth rate, spatial structure, anddiversity. Tools such as siting algorithms used in reserve design can help producebiologically equivalent solutions to ESU-level recovery targets (Ruckelshaus et al.2002). Which ESU viability scenario(s) will be chosen to satisfy regional recoverygoals will be decided by a multi-stakeholder policy group in Puget Sound called theShared Strategy Development Committee (http://www.sharedsalmonstrategy.org).
The second type of scenario analysis used in salmon recovery planning isproposing alternative sets of actions whose combined effects will suffice to re-cover the listed ESUs. Making predictions about the effects of a given action(e.g., reduction in harvest, change in hatchery management practices, protectionor restoration of habitat, predator control) on the fate of salmon populations de-pends on assumptions about future environmental conditions. Previously, detailedsimulation models typically have been used to explore different assumptions aboutthe environment and its influence on salmon (ISAB 2001b). Scenario analyseshave similar goals as such simulation models, but by collecting assumptions intoonly a handful of alternatives, they are easier for decision-makers to work with.If one were to consider only three scenarios for salmon recovery, they might be(a) oceanic conditions outside of human control are the dominant factor affectingsalmon survival, thus only modest improvements in human-caused risk factors areneeded; (b) risks due to human effects are severe, but technical solutions such ashatcheries, better-engineered dams, restored streams, and selective harvest are suf-ficient to achieve the required survival benefits; and last, (c) the degradation of the
Ann
u. R
ev. E
col.
Syst
. 200
2.33
:665
-706
. Dow
nloa
ded
from
arj
ourn
als.
annu
alre
view
s.or
gby
ST
EPH
EN
T. T
HR
EL
KE
LD
on
02/1
4/06
. For
per
sona
l use
onl
y.
12 Oct 2002 10:9 AR AR173-ES33-23.tex AR173-ES33-23.sgm LaTeX2e(2002/01/18)P1: IBC
SALMON RECOVERY SCIENCE 693
environment is so severe that only massive changes in environmental conditionsthrough restoration of landscape-forming processes and revolutionary changes inharvest and hatchery management will recover salmon. Under each of these sce-narios, alternative management actions will have different effects on salmon. Theobjective for science is to assess the data that support or refute each scenario, toevaluate the internal consistency of each scenario, and to provide an analyticalframework that can use new data to resolve critical uncertainties. The ultimatedecision about what to do will still come down to trade-offs between economicsand ecology or social values and biology, but if scenario analysis is done artfully,those trade-offs will be clear.
It is impossible to predict fish population dynamics precisely and accuratelytwenty or even five years into the future, with or without management intervention.Uncertainty, lack of basic ecological understanding, and tremendous environmen-tal variability make such an endeavor fruitless. But we can identify managementactions that are likely to yield marked improvements in population status under awide variety of scenarios. Based on what we have learned from recovery planningfor Pacific salmonids, we offer the elements in Table 3 as a brief primer on how toincorporate science into a recovery plan effectively (see also Wondolleck & Yaffee2000, Brick et al. 2001).
Nature and Limitations of Data UnderlyingRecovery Analyses
Compared to most other imperiled species, there is a plethora of informationabout salmon—they are counted on fishing boats, at weirs, in snorkel surveys, andat dams. In spite of notebooks and computers full of salmon counts, accessible andwell-managed databases for salmon are lacking (Botkin et al. 2000, ISAB 2001a).Science advisory panels note that many questions about salmon recovery could beanswered by contrasting populations that experience different risk factors, if onlysuch broad geographic data were available (see, e.g., RSRP 2001). Inadequate mon-itoring and poor data accessibility are common deficiencies afflicting endangeredspecies management (Kareiva et al. 1998; Campbell, unpublished data). In salmonmanagement, however, there is a more insidious problem—the acceptance of codedexpert opinion as a substitute for data. Using expert opinion as a basis for manage-ment decisions in the absence of data is a practical necessity—the problem ariseswhen calls for empirical information are forgotten once a decision has been made.
Two expert opinion approaches have come to be widely embraced as scien-tific support tools for salmon management. The first, Ecosystem Diagnosis andTreatment (EDT), is used to evaluate habitat capacity for salmon. EDT uses 45habitat descriptors to predict the capacity of different streams and watersheds tosupport salmon. The 45 habitat variables represent scores on a scale of zero to fourthat are typically filled in by experts or derived from written reports but almostnever entail a scientist actually going to the sites to take repeatable, standardizedmeasurements. The method thus involves making guesses about habitat attributes
Ann
u. R
ev. E
col.
Syst
. 200
2.33
:665
-706
. Dow
nloa
ded
from
arj
ourn
als.
annu
alre
view
s.or
gby
ST
EPH
EN
T. T
HR
EL
KE
LD
on
02/1
4/06
. For
per
sona
l use
onl
y.

12 Oct 2002 10:9 AR AR173-ES33-23.tex AR173-ES33-23.sgm LaTeX2e(2002/01/18)P1: IBC
694 RUCKELSHAUS ET AL.
TABLE 3 Elements of successful participation in a recovery planning exercise. We define“success” as creating a situation where biological information influences ultimate decisionsmade in designing a recovery plan for imperiled species
1. Work hard in advance to clearly write down the first principles of population andconservation biology that will guide your technical approaches to recovery planning.Codified conceptual guidance and the next step—well-documented, tested and transparenttechnical approaches to addressing key questions—go a long way toward settling disputesthat inevitably arise in technical teams.
2. Be choosy about the level of technical detail you delve into in addressing questionsposed to your group. Each of the questions posed to salmon recovery teams could involveseveral lifetimes of research and analyses to answer. Use guidance from policy staff involvedin recovery planning to help you decide which questions are key to the decisions they willmake. In the end, deadlines will be the ultimate check in deciding which analysesyou undertake and how to balance a mix of quantitative assessments, proxy information, andbiological intuition to justify your conclusions.
3. Plan to present technical results as scenarios rather than “the answer” to a particular question.There can be many potential solutions to questions such as “Which populations must beviable for an ESU to be recovered?” and “Which actions are necessary for ESU recovery?”,and expecting a technical team to present a single answer is unwise for at least two reasons.First, presenting a single result makes it very difficult to see how sensitive results are topolicy assumptions (e.g., probability of persistence, time frame used in viability models;degree of certainty in the effects of actions on population status). Second, single answersfrom a technical team box decision-makers into a corner, reducing the chances that biologicalinput will influence ultimate decisions that must also consider political, social, and logisticalfactors.
4. Resist the temptation to walk away from the group when it gets frustrating. Abandoning shipis an option open to most academics—when one scientist disagrees with another on atechnical matter, it is relatively easy to write the offender off as na¨ıve, off-base, or justplain stupid. Attempting to provide useful scientific guidance for real conservationapplications requires that you stay at the table to ensure that your opinions on analyticalapproaches and interpretation of results are included in the final analysis.
5. Invest the time to work with policy- or decision-makers who will influence how scientificresults are used in the design of the final recovery plan. Interacting with policy-makers whotypically lack a scientific background can appear to slow your progress, will almost surelyreorder your priorities for technical analyses, and will generally try your patience. The realityis that political, social, and logistical constraints on recovery solutions are powerful driverswhen a recovery plan is being designed—in the end, policy staff are your best hope forincorporating hard-won points of scientific agreement into recovery solutions.
and then running those “data” through a model that predicts population perfor-mance. The EDT model includes so many unknown parameters that it is prone tolarge error propagation (Burnham & Anderson 1998), and it is extremely difficultto validate. Although this approach has been criticized by a “blue ribbon” panelof ecologists (RSRP 2000), it remains popular as a management tool.
Ann
u. R
ev. E
col.
Syst
. 200
2.33
:665
-706
. Dow
nloa
ded
from
arj
ourn
als.
annu
alre
view
s.or
gby
ST
EPH
EN
T. T
HR
EL
KE
LD
on
02/1
4/06
. For
per
sona
l use
onl
y.

12 Oct 2002 10:9 AR AR173-ES33-23.tex AR173-ES33-23.sgm LaTeX2e(2002/01/18)P1: IBC
SALMON RECOVERY SCIENCE 695
A similar expert opinion scientific tool is the “matrix of pathways and in-dicators” that the NMFS developed for conducting consultations under the ESA(NMFS 1996). The matrix consists of 18 habitat attributes such as sediment, chemi-cal contaminations and nutrients, pool frequency, width/depth ratio, and floodplainconnectivity, each of which is scored as properly functioning, at risk, or not prop-erly functioning. Although these attributes could be directly measured, the moretypical pattern is that a consultant or agency biologist visits the site and fills inthe matrix using his or her professional judgement. It may be possible to fill ina matrix without even visiting the watershed (simply by looking at previous re-ports and maps). It is not surprising then that attempts to see how well the matrixscores relate to measures of salmon abundance or productivity have detected norelationships (T. Good et al., unpublished data). Both EDT and the NMFS habitatmatrix are honest efforts to inform decisions pertaining to salmon habitat actionsin the absence of data. The problem is that the public, and even some scientists,have ended up being too satisfied with an absence of data, and have been will-ing to accept the expert opinion systems as a permanent substitute for empiricalinformation.
In fact, the largest and best-funded ecological database for the Columbia Basin,the Interior Columbia Basin Ecosystem Management Plan (ICBEMP) database,is replete with “data layers” that are only thinly related to anything that might bemeasured (Quigley & Arbelbide 1997, http://www.icbemp.gov). For example, oneof the variables in the databases, “riparian integrity index,” is derived using modelsof models, and cannot be interpreted as anything that could be directly measured.Even a variable like “road” in the ICBEMP data, which could conceivably bedirectly measured, is a categorical variable that results from two conditional in-equalities (see metadata regarding field∗ROAD in ICBEMP). ICBEMP also usedBayesian belief networks to summarize the quality of habitats in the Columbiabasin for salmonids, and in turn the opportunities for aiding fish recovery viahabitat restoration or protection (ISAB 2001b). Analyses of measured data werelacking from this exercise. Again, the derived nature of the data and the degree towhich data are expert opinion or empirical are difficult to discern—these importantdetails are often forgotten by those using the database for management.
Finally, even in those cases where measured data exist, they can be fraught withproblems. For example, the most fundamental of all data for salmon are populationcounts, which are key to determining the status and risk of different ESUs. In mostmanagement models, these counts are befuddled by two major sources of error thatare rarely given the attention they deserve. First, counts are usually made of redds,carcasses, or live fish in small index streams that may be chosen simply because theyare easily accessed. These index counts are then used to estimate total populationsize along two to three dimensions of extrapolation: multiplying index streamlength by a factor to get total anadromous stream miles, expanding the number ofredds or carcasses into a number of live fish, and somehow translating counts madeover a limited period to a number representing the entire returning population (byarea-under-the-curve methods, or making assumptions about the longevity of a
Ann
u. R
ev. E
col.
Syst
. 200
2.33
:665
-706
. Dow
nloa
ded
from
arj
ourn
als.
annu
alre
view
s.or
gby
ST
EPH
EN
T. T
HR
EL
KE
LD
on
02/1
4/06
. For
per
sona
l use
onl
y.
12 Oct 2002 10:9 AR AR173-ES33-23.tex AR173-ES33-23.sgm LaTeX2e(2002/01/18)P1: IBC
696 RUCKELSHAUS ET AL.
redd) (e.g., Smith & Castle 1994). All of these extrapolations are prone to hugeerrors. For example, total anadromous stream miles can err by 30% to 75% (Bahls &Ereth 1994) and even the simplest redd counts have sampling errors on the orderof 25% to 75% (Holmes 2001). If these sampling errors are not accounted for,estimates of population risk could be greatly inflated (because variability owing tosampling error often gets translated as environmental variability and hence elevatedextinction risk).
Data can be divided into four categories: measured data, extrapolated or inferreddata, modeled data, and expert opinion. Salmon management relies primarily onexpert opinion and extrapolated or inferred data. As a temporary solution thisapproach is sensible; yet excessive reliance on expert opinion relaxes the pressureto collect data.
CONCLUSIONS
The elegant experiment, clear hypothesis, and simple model are icons of good sci-ence. But when science enters the arena of endangered species recovery, the scienceis rarely elegant, clear, or simple. Although engaging in political and economicdiscussions can be frustrating to biologists, the much-maligned role of science inendangered species management has as much to do with the shortcomings of sci-ence as it does with the perils of politics. We have uncovered many shortcomings inthe science underlying salmon recovery. Even the most basic question of identify-ing relevant units for conservation at the population level warrants more thoughtfulconsideration. For example, when populations are targeted for priority protection,multiple biological criteria need to be involved when defining those units, in concertwith a compelling vision of exactly what one is attempting to preserve (e.g., futureevolutionary potential or medium-range ecological persistence). Once conserva-tion units have been delineated, tools for estimating their viability are relativelywell developed and understood. What we lack are tools for translating differentmanagement scenarios into likely changes in viability. The difficulty in assessingthe merits of different management scenarios emerges from salmon facing mul-tiple sources of risk simultaneously; risks that interact with one another and witha backdrop of natural hazards and fluctuating environmental conditions. Finally,our data management simply is not sufficiently developed to support the numericalanalyses we wish we could do. Salmon, especially Pacific salmon, are the subjectof thousands of papers in scientific journals over the past decade. Nonetheless,the most fundamental data regarding abundance and distribution are not readilyaccessible. And for subtler data—such as habitat quality—managers rely all toooften upon expert opinion and obscure extrapolations. Expediency dictates thatmanagement decisions are made based on insufficient data, nevertheless, calls forempirical data to redress the gaps in our understanding cannot be too insistent.
We are experimenting with approaches, such as scenario planning and multi-stakeholder technical recovery teams, for delivering scientific guidance in the faceof data shortcomings and great uncertainty. There is a dire need for research aimed
Ann
u. R
ev. E
col.
Syst
. 200
2.33
:665
-706
. Dow
nloa
ded
from
arj
ourn
als.
annu
alre
view
s.or
gby
ST
EPH
EN
T. T
HR
EL
KE
LD
on
02/1
4/06
. For
per
sona
l use
onl
y.

12 Oct 2002 10:9 AR AR173-ES33-23.tex AR173-ES33-23.sgm LaTeX2e(2002/01/18)P1: IBC
SALMON RECOVERY SCIENCE 697
at determining what makes the infusion of science into decision-making sometimeswork and sometimes fail miserably (Kinzig et al. 2000). One place to begin wouldbe a systematic review of the effectiveness of science at influencing policy.
Finally, for salmon recovery, the most crucial questions are not purely scien-tific. Our experience has taught us that participants bring such different values tothe table, that even when given exactly the same data and information, they comeup with dramatically different solutions. The need for collaboration, consensus,compromises, and an accounting for values make the science/policy interface anuncomfortable environment for most scientists. Yet it is primarily in this environ-ment that science can make the biggest difference—by making clear the likelybiological consequences of actions, and stopping short of saying anything aboutwhat “should” be done.
ACKNOWLEDGMENTS
We would like to thank Tammy Harms and Juliet Fabbri for help with figures, datacompiling, and endless logistics. Our thinking about salmon conservation problemshas benefited greatly from discussions with Tim Beechie, Ted Case, Mike Ford,Fran James, Russ Lande, Simon Levin, Michelle McClure, Paul McElhany, BillMurdoch, Bob Paine, Walt Reid, Bill Ruckelshaus, Mike Schiewe, Robin Waples,John Williams, Rich Zabel, and members of the Puget Sound Technical RecoveryTeam. Dan Simberloff provided insightful comments on an earlier version of thismanuscript. The views expressed in this paper are those of the authors.
The Annual Review of Ecology and Systematicsis online athttp://ecolsys.annualreviews.org
LITERATURE CITED
Achord S, Eppard MB, Hockersmith EE, Stand-ford BP, Matthews GM. 1997.Monitor-ing the migrations of wild Snake Riverspring/summer chinook salmon smolts 1996.Bonneville Power Admin. Rep. Proj. 91–028,Portland, OR
Anderson DR, Burnham KP, Thompson WL.2000. Null hypothesis testing: problems,prevalence, and an alternative.J. Wildl.Manag.64:912–23
Avise JC. 1989. A role for molecular geneticsin the recognition and conservation of en-dangered species.Trends Ecol. Evol.4:29–281
Bahls P, Ereth M. 1994.Stream typing errorin Washington water type maps for water-sheds of Hood Canal and Southwest Olympic
Peninsula. Tech. Rep. 94–2.Point-No-PointTreaty Counc., Kingston, Wash.
Barlow GW. 1995. The relevance of behaviorand natural history to evolutionarily signifi-cant units. See Nielsen 1995, pp. 169–75
Beamesderfer RC, Ward DL, Nigro AA. 1996.Evaluation of the biological basis for a preda-tor control program on northern squawfish(Ptychocheilus oregonensis) in the Columbiaand Snake rivers.Can. J. Fish. Aquat. Sci.53:2898–908
Beamish RJ, Noakes DJ, McFarlane GA,Klyashtorin L, Ivanov VV, Kurashov V.1999. The regime concept and natural trendsin the production of Pacific salmon.Can. J.Fish. Aquat. Sci.56:516–26
Beckham SD. 1977.The Indians of Western
Ann
u. R
ev. E
col.
Syst
. 200
2.33
:665
-706
. Dow
nloa
ded
from
arj
ourn
als.
annu
alre
view
s.or
gby
ST
EPH
EN
T. T
HR
EL
KE
LD
on
02/1
4/06
. For
per
sona
l use
onl
y.

12 Oct 2002 10:9 AR AR173-ES33-23.tex AR173-ES33-23.sgm LaTeX2e(2002/01/18)P1: IBC
698 RUCKELSHAUS ET AL.
Oregon: This Land was Theirs. Coos Bay,OR: Arago Books
Bednarek AT. 2001. Undamming rivers: a re-view of the ecological impacts of dam re-moval.Environ. Manag.27:803–14
Beechie TJ, Beamer E, Collins B, Benda L.1996. Restoration of habitat-forming pro-cesses in Pacific Northwest watersheds: Alocally adaptable approach to salmonid habi-tat restoration. InThe Role of Restorationin Ecosystem Management, ed. DL Peterson,CV Klimas, pp. 48–67. Madison, WI: Soc.Ecol. Restor.
Beechie TJ, Beamer E, Wasserman L. 1994.Estimating coho salmon rearing habitat andsmolt production losses in a large river basin,and implications for restoration.N. Am. J.Fish. Manag.14:797–811
Beechie TJ, Bolton S. 1999. An approachto restoring salmonid habitat-forming pro-cesses in Pacific Northwest watersheds.Fish-eries24:6–15
Beechie TJ, Roni R, Steel EA. 2002.Ecosys-tem recovery planning for listed salmon: anintegrated assessment approach for salmonhabitat. NOAA Tech. Memo. NMFS-NWFSC,Northwest Fish. Sci. Cent., Seattle, WA. Inpress
Beissinger SR, McCullough DR, eds. 2002.Population Viability Analysis. Chicago, IL:Univ. Chicago Press
Bilby RE, Fransen BR, Bisson PA. 1996. Incor-poration of nitrogen and carbon from spawn-ing coho salmon into the trophic system ofsmall streams: evidence from stable isotopes.Can. J. Fish. Aquat. Sci.53(1):164–73
Bilby RE, Fransen BR, Bisson PA, Walter JK.1998. Response of juvenile coho salmon(Oncorhynchus kisutch) and steelhead (On-corhynchus mykiss) to the addition of salmoncarcasses to two streams in southwesternWashington, U.S.A.Can. J. Fish. Aquat. Sci.55:1090–118
Boersma PD, Kareiva PM, Fagan WF, ClarkJA, Hoekstra JM. 2001. How good are en-dangered species recovery plans?BioScience51:643–49
Botkin D, Peterson D, Calhoun J. 2000.The
scientific basis for validation monitoringof salmon for conservation and restorationplans. Olympic Nat. Resource Cent. Tech.Rep., Forks, WA
Bowen BW. 1998. What is wrong with ESUs?The gap between evolutionary theory andconservation principles. J. Shellfish Res.17:1355–58
Bowen BW. 1999. Preserving genes, species,or ecosystems? Healing the fractured foun-dations of conservation policy.Mol. Ecol.8:S5–10
Boyle B. 2002. Restoring credibility to govern-ment science.Seattle Times, Feb. 27
Bradford MJ, Irvine JR. 2000. Land use, fishing,climate change, and the decline of ThompsonRiver, British Columbia, coho salmon.Can.J. Fish. Aquat. Sci.57:13–16
Brick P, Snow D, Van De Wetering S. 2001.Across the Great Divide. Explorations in Col-laborative Conservation and the AmericanWest. Washington, DC: Island
Brodeur RD, Boehlert GW, Casillas E, EldridgeMB, Helle JH, et al. 2000. A coordinated re-search plan for estuarine and ocean researchon Pacific Salmon.Fisheries25(6):7–16
Brook BW, O’Grady J, Chapman A, BurgmanM, Akcakaya HR, Frankham R. 2000.Predictive accuracy of population viabil-ity analysis in conservation biology.Nature404:385–86
Brown B. 1983.Mountain in the Clouds: ASearch for the Wild Salmon. Seattle: Univ.Wash. Press. 249 pp.
Buchanan DV, Hooton RM, Moring JR. 1981.Northern squawfish (Ptychocheilus orego-nensis) predation on juvenile salmonids insections of the Willamette River Basin, Ore-gon.Can. J. Fish. Aquat. Sci.38:360–64
Budy P, Thiede GP, Bouwes N, Petrosky CE,Schaller H. 2002. Evidence linking delayedmortality of Snake River salmon to their ear-lier hydrosystem experience.N. Am. J. Fish.Manag.22:35–51
Burnham KP, Anderson DR. 1998.Model Se-lection and Inference: A Practical Informa-tion-Theoretic Approach. New York: Sprin-ger-Verlag
Ann
u. R
ev. E
col.
Syst
. 200
2.33
:665
-706
. Dow
nloa
ded
from
arj
ourn
als.
annu
alre
view
s.or
gby
ST
EPH
EN
T. T
HR
EL
KE
LD
on
02/1
4/06
. For
per
sona
l use
onl
y.
12 Oct 2002 10:9 AR AR173-ES33-23.tex AR173-ES33-23.sgm LaTeX2e(2002/01/18)P1: IBC
SALMON RECOVERY SCIENCE 699
Busby PJ, Wainwright TC, Bryant GJ, Lier-heimer LJ, Waples RS, et al. 1996.Statusreview of west coast steelhead from Washing-ton, Idaho, Oregon, and California. NOAATech. Memo. NMFS-NWFSC-27.NorthwestFish. Sci. Cent., Seattle, WA
Busby PJ, Wainwright TC, Waples RS.1994. Status review for Klamath Moun-tains Province steelhead.NOAA Tech. Memo.NMFS-NWFSC-19.Northwest Fish. Sci.Cent., Seattle, WA
Clark JS, Carpenter SR, Barber M, Collins S,Dobson A, et al. 2001. Ecological forecasts:An emerging imperative.Science293:657–60
Collings MR, Smith RW, Higgins GT. 1972.Hydrology of four streams in western Wash-ington as related to several Pacific salmonspecies: Humptulips, Elochoman, Green andWynoochee rivers. U.S. Geol. Serv. open filerep., Tacoma, Wash.
Collis K, Roby DD, Craig D, Ryan BA,Ledgerwood RD. 2001. Colonial water-bird predation on juvenile salmonids taggedwith passive integrated transponders in theColumbia River estuary: vulnerability of dif-ferent salmonid species, stocks, and rearingtypes.Trans. Am. Fish. Soc.130:385–96
Cone J. 1995.A Common Fate: EndangeredSalmon and the People of the Pacific North-west. Corvallis: Oregon State Univ. Press
Cone J, Ridlington S, eds. 1996.The NorthwestSalmon Crisis: A Documented History. Cor-vallis: Oregon State Univ. Press
Connelly M. 2001. Home is where they’ll layme down.Orion (Summer):17–25
Cooney RT, Brodeur RD. 1998. Carrying ca-pacity and North Pacific salmon production:stock enhancement implications.Bull. Mar.Sci.62:443–64
Craig JK, Foote CJ. 2001. Countergradient vari-ation and secondary sexual color: phenotypicconvergence promotes genetic divergence incarotenoid use between sympatric anadro-mous and nonanadromous morphs of sock-eye salmon (Oncorhynchus nerka). Evolu-tion 55:380–91
Crandall KA, Bininda-Emonds ORP, Mace
GM, Wayne RK. 2000. Considering evolu-tionary processes in conservation biology.Trends Ecol. Evol.15:290–95
Dalton R. 2002. Fur flies over lynx survey’ssuspect samples.Nature415:107
Doremus H. 2000. Delisting endangeredspecies: An aspirational goal, not a realistcexpectation.Environ. Law Rep.30:10434
Fed. Regist. 1996. Policy regarding the recog-nition of distinct vertebrate population seg-ments under the Endangered Species Act.Fed. Regist.61:4721–25
Fed. Regist.2002. Endangered and threatenedspecies: Findings on petitions to delist PacificSalmonid ESUs.CFR Fed. Regist.50:223–26. 67(28)
Feist BE, Steel EA, Pess GR, Bilby RE. 2002.What is the correct scale for habitat analysesaimed at prioritizing restoration efforts forsalmon?Anim. Conserv.In review
Finney BP, Eaves G, Sweetman I, Douglas J,Smol MSV. 2000. Impacts of climatic changeand fishing on Pacific salmon abundanceover the past 300 years.Science290:795–99
Flagg TA, Berejikian BA, Colt JE, DickhoffWW, Harrell LW, et al., eds. 2000.Eco-logical and behavioral impacts of artificialproduction strategies on the abundance ofwild salmon populations—a review of prac-tices in the Pacific Northwest.NOAA Tech.Memo. NMFS-NWFSC-4, Northwest Fish.Sci. Cent., Seattle, WA
Fleming IA, Gross MR. 1993. Breeding suc-cess of hatchery and wild coho salmon (On-corhynchus kisutch) in competition. Ecol.Appl.3:230–45
Ford MJ. 1998. Testing models of migrationand isolation among populations of Chinooksalmon (Oncorhynchus tschawytscha). Evo-lution 52:539–57
Ford MJ, Budy P, Busack C, Chapman D,Cooney T, et al. 2001.Upper Columbia Riversteelhead and spring chinook salmon popu-lation structure and biological requirements.http://www.nwfsc.noaa.gov/
Frank BJR. 2002. Salmon need better habitat.Seattle Post-Intelligencer, Jan. 11
Ann
u. R
ev. E
col.
Syst
. 200
2.33
:665
-706
. Dow
nloa
ded
from
arj
ourn
als.
annu
alre
view
s.or
gby
ST
EPH
EN
T. T
HR
EL
KE
LD
on
02/1
4/06
. For
per
sona
l use
onl
y.

12 Oct 2002 10:9 AR AR173-ES33-23.tex AR173-ES33-23.sgm LaTeX2e(2002/01/18)P1: IBC
700 RUCKELSHAUS ET AL.
Fraser DJ, Bernatchez L. 2001. Adaptive evolu-tionary conservation: towards a unified con-cept for defining conservation units.Mol.Ecol.10:2741–52
Friesen TA, Ward DL. 1999. Managementof northern pikeminnow and implicationsfor juvenile salmonid survival in the lowerColumbia and Snake rivers.N. Am. J. Fish.Manag.19:1008–19
Frissell CA, Nawa RK. 1992. Incidence andcauses of physical failure of artificial habitatstructures in streams of western Oregon andWashington.N. Am. J. Fish. Manag.12:182–97
Gearin P, Pfeifer R, Jeffries S, Delong R. 1989.California sea lion predation depletes a steel-head run in Washington State.Proc. Bien.Conf. Biol. Mar. Mammals, Dec. 7–11, Pa-cific Grove, CA (Abstr.)
Gearin P, Pfeifer R, Jeffries S, Delong R, John-son M. 1988.Results of the 1986–87 Califor-nia sea lion-steelhead trout predation controlprogram at the Hiram M. Chittenden Locks.Seattle, WA: NMFS Northwest Alaska Fish.Cent. Process. Rep. 88–30. 111 pp.
Glova GJ. 1984. Management implications ofthe distribution and diet of sympatric popu-lations of juvenile coho salmon and coastalcutthroat trout in small streams in BritishColumbia, Canada.Prog. Fish Cult.46:269–77
Gore AJR. 1992.Earth in the Balance. Ecologyand the Human Spirit.New York: Penguin
Gresh T, Lichatowich J, Schoonmaker P. 2000.An estimation of historic and current levelsof salmon production in the northeast Pacificecosystem.Fisheries25:15–21
Groot C, Margolis L. 1991.Pacific Salmon LifeHistories. Vancouver: Univ. Br. ColumbiaPress
Groves C. 2000.Designing a Geography ofHope: A Practitioner’s Handbook to Ecore-gional Conservation Planning. Washington,DC: The Nat. Conserv. Press
Gustafson RG, Wainwright TC, Winans GA,Waknitz FW, Parker LT, Waples RS. 1997.Status review of sockeye salmon from Wash-ington and Oregon. NOAA Tech. Memo.
NMFS-NWFSC-33.Northwest Fish. Sci.Cent., Seattle, WA
Hard JJ. 2002a. Case study of Pacific salmon.In Fisheries-Induced Adaptive Change, ed.U Dieckmann, OR Godø, M Heino, J Mork.Cambridge, UK. In press
Hard JJ. 2002b. Response of chinook salmonlife history to selection under harvest. InSalmonid Perspectives on Evolution, ed. AHendry, S Stearns. Oxford, UK: OxfordUniv. Press. In press
Hard JJ, Kope RG, Grant WS, Waknitz FS,Parker LT, Waples RS. 1996.Status reviewof Pink salmon from Washington, Oregon,and California. NOAA Tech. Memo. NMFS-NWFSC-25.Northwest Fish. Sci. Cent., Seat-tle, WA
Healey MC. 1986. Optimum size and age at ma-turity in Pacific salmon and effects of size-selective fisheries.Can. Spec. Publ. Fish.Aquat. Sci.89:39–52
Healey MC. 1991. Diets and feeding rates ofjuvenile pink, chum and sockeye salmon inHecate Strait, British Columbia.Trans. Am.Fish. Soc.120:303–18
Hendry AP. 2000. Rapid evolution of reproduc-tive isolation in the wild: evidence from in-troduced salmon.Science290:516–18
Hilborn R. 1992. Hatcheries and the future ofsalmon in the Northwest.Fisheries17:5–8
Hilborn R, Mangel M. 1997.The EcologicalDetective. Princeton, NJ: Princeton Univ.Press
Hollowed AB, Hare SR, Wooster WS. 2001.Pacific Basin climate variability and patternsof Northeast Pacific Marine fish production.Prog. Oceanogr.49:257–82
Holmes EE. 2001. Estimating risks in decliningpopulations with poor data.Proc. Natl. Acad.Sci. USA98:5072–77
Holmes EE, Fagan WF. 2002. Validating pop-ulation viability analyses for corrupted datasets.EcologyIn press
Independent Sci. Advis. Board (ISAB). 2001a.A Review of Salmon Recovery Strategies forthe Columbia River Basin, ISAB Rep. 2001–7. Northwest Power Plan. Counc., Portland,OR
Ann
u. R
ev. E
col.
Syst
. 200
2.33
:665
-706
. Dow
nloa
ded
from
arj
ourn
als.
annu
alre
view
s.or
gby
ST
EPH
EN
T. T
HR
EL
KE
LD
on
02/1
4/06
. For
per
sona
l use
onl
y.

12 Oct 2002 10:9 AR AR173-ES33-23.tex AR173-ES33-23.sgm LaTeX2e(2002/01/18)P1: IBC
SALMON RECOVERY SCIENCE 701
Independent Sci. Advis. Board (ISAB). 2001b.ISAB Model Synthesis Report. An Analysisof Decision Support Tools Used in ColumbiaRiver Basin Salmon Management. ISAB Rep.2001–1a.Northwest Power Plan. Counc.,Portland, OR
Independent Sci. Group (ISG). 1996.Return tothe river: restoration of salmonid fishes in theColumbia River ecosystem. Northwest PowerPlan. Counc., Portland, OR
Independent Sci. Group (ISG). 1999. Scientificissues in the restoration of salmonid fishes inthe Columbia River.Fisheries24:10–19
Interagency Sci. Salmon Team (ISST). 2001.Identified Research Needs for Salmon Recov-ery.15 pp.
Johannesson K. 2001. Parallel speciation: a keyto sympatric divergence.Trends Ecol. Evol.16:148–53
Kareiva PM, Andelman S, Doak D, Elderd B,Groom M, et al. 1998.Using science in habi-tat conservation plans.http://www.nceas.ucsb.edu/projects/hcp
Kareiva PM, Marvier M, McClure M. 2000.Recovery and management options forspring/summer chinook salmon in theColumbia River Basin.Science270:977–79
Kinnison MT, Bentzen P, Unwin MJ, QuinnTP. 2002. Reconstructing recent divergence:evaluating nonequilibrium population struc-ture in New Zealand Chinook salmon.Mol.Ecol.11:739–54
Kinzig AP, Carpenter S, Dove M, Heal G, LevinS, et al. 2000.Nature and Society: An Imper-ative for Integrated Environmental Research.http://lsweb.la.asu/akinzig/NSFReport.pdf
Lande R. 1993. Risks of population extinc-tion from demographic and environmentalstochasticity and random catastrophes.Am.Nat.142:911–27
Lande R, Shannon S. 1996. The role of geneticvariation in adaptation and population persis-tence in a changing environment.Evolution50:434–37
Larkin G, Slaney PA. 1997. Implications oftrends in marine-derived nutrient influx tosouth coastal British Columbia salmonid pro-duction.Fisheries22(11):16–24
Lawson PW. 1993. Cycles in ocean productiv-ity, trends in habitat quality, and the restora-tion of salmon runs in Oregon.Fisheries18:6–10
Levin PS, Achord S, Feist B, Zabel RW. 2002.Non-indigenous brook trout and the demiseof threatened Snake River salmon: a for-gotten threat?Proc. R. Soc. London Ser. B.269:1663–70
Levin PS, Schiewe MH. 2001. Preservingsalmon biodiversity.Am. Sci.89:220–27
Levin PS, Tolimieri N. 2001. Differences in theimpacts of dams on the dynamics of salmonpopulations.Anim. Conserv.4:291–99
Levin PS, Williams JG. 2002. Interspecific ef-fects of artifically propagated fish: an addi-tional conservation risk for salmon.Conserv.Biol. In press
Levin PS, Zabel RW, Williams JG. 2001. Theroad to extinction is paved with good inten-tions: negative associations of fish hatcherieswith threatened salmon.Proc. R. Soc. Lon-don Ser. B268:1–6
Lichatowich J. 1999.Salmon Without Rivers.Washington, DC: Island
Lynch M, Lande R. 1993. Evolution and extinc-tion in response to environmental change. InBiotic Interactions and Global Change, ed. PKareiva, JG Kingsolver, RB Huey, pp. 234–50. Sunderland, MA: Sinauer
Mahnken C, Ruggerone G, Waknitz W, FlaggT. 1998. A historical perspective on salmonidproduction from Pacific Rim hatcheries.North Pac. Anadromous Fish. Comm. Bull.1:38–53
Mantua NJ, Hare SR, Zhang Y, Wallace JM,Francis RC. 1997. A Pacific interdecadal cli-mate oscillation with impacts on salmon pro-duction.Am. Meteor. Soc. Bull.78:1069–79
Mapes LV. 2001. Lynx-fur furor focuses on sci-ence role.Seattle Times, Dec. 30
Mayden RL, Wood RM. 1995. Systematics,species concepts, and the evolutionarily sig-nificant unit in biodiversity and conservationbiology. See Nielsen 1995, pp. 58–113
McClure MM, Cooney T, Marvier M. 2001. As-sessing the role of dams in salmon recovery.Hydro Rev.20:36–45
Ann
u. R
ev. E
col.
Syst
. 200
2.33
:665
-706
. Dow
nloa
ded
from
arj
ourn
als.
annu
alre
view
s.or
gby
ST
EPH
EN
T. T
HR
EL
KE
LD
on
02/1
4/06
. For
per
sona
l use
onl
y.

12 Oct 2002 10:9 AR AR173-ES33-23.tex AR173-ES33-23.sgm LaTeX2e(2002/01/18)P1: IBC
702 RUCKELSHAUS ET AL.
McClure MM, Holmes EE, Sanderson BL, Jor-dan CE. 2002. A large-scale, multi-speciesassessment: Anadromous salmonids in theColumbia River Basin.Ecol. Appl.In press
McCusker MR, Parkinson E, Taylor EB. 2000.Mitochondrial DNA variation in rainbowtrout (Oncorhynchus mykiss) across its na-tive range: testing biogeographical hypothe-ses and their relevance to conservation.Mol.Ecol.9:2089–108
McElhany P, Ruckelshaus MH, Ford MJ,Wainwright T, Bjorkstedt E. 2000.Viablesalmonid populations and the recovery ofevolutionarily significant units. NOAA Tech.Memo. NMFS-NWFSC-42.Washington, DC:US Dep. Comm. 156 pp.
McFarlane GA, King JR, Beamish RJ. 2000.Have there been recent changes in cli-mate? Ask the fish.Prog. Oceanogr.47:147–69
Meffe GK. 1992. Techno-arrogance and half-way technologies: salmon hatcheries on thePacific coast of North America.Conserv.Biol. 6:350–54
Millenium Ecosyst. Assess. (MA). 2001.Ob-jectives, audience, process and conceptualframework.Presented at MA Tech. DesignWorkshop, Bilthoven, The Netherlands
Mills LS. 2002. False samples are not the sameas blind controls.Nature415:471
Milstein M. 2002. Fish, lynx flubs hit agencies’credibility. The Oregonian, Feb. 5
Moritz C. 1994. Defining “evolutionarily sig-nificant units” for conservation.Trends Ecol.Evol.9:373–75
Moritz C. 2002. Strategies to protect biodiver-sity and the evolutionary processes that sus-tain it. Syst. Biol.51:238–54
Morris W, Doak D, Groom M, Kareiva PM,Fieberg J, et al. 1999.A Practical Handbookfor Population Viability Analysis. Washing-ton, DC: The Nat. Conserv.
Moyle PB, Li HW, Barton BA. 1986.TheFrankenstein Effect: Impact of IntroducedFishes on Native Fishes in North America,pp. 415–26. Bethesda, MD: Am. Fish. Soc.
Myers J, Busack C, Rawding D. 2002.Iden-tifying historical populations of chinook
and chum salmon and steelhead withthe Lower Columbia River and UpperWillamette River Evolutionarily SignificantUnits. Willamette/Lower Columbia RiverTech. Recovery Team. Tech. Rev. Draft
Myers JM, Kope RG, Bryant GJ, Teel D, Lier-heimer LJ, et al. 1998.Status review of Chi-nook salmon from Washington, Idaho, Ore-gon, and California. NOAA Tech. Memo.NMFS-NWFSC-35.Northwest Fish. Sci.Cent., Seattle, WA
Mysak LA. 1986. El Nino, interannual vari-ability and fisheries in the northeast Pacificocean.Can. J. Fish. Aquat. Sci.43:464–97
Nash CE, Iwamoto RN, Mahnken CVW. 2000.Aquaculture risk management and marinemammal interactions in the Pacific North-west.Aquaculture183:307–23
Natl. Mar. Fish. Serv. (NMFS). 1991. Notice ofpolicy: Policy on applying the definition ofspecies under the Endangered Species Act toPacific salmon.Fed. Regist.56:58612–16
Natl. Mar. Fish. Serv. (NMFS). 1995.Bio-logical opinion for reinitiation of consulta-tion on 1994–1998 operation of the FederalColumbia River Power System and juveniletransportation program in 1995 and futureyears.NMFS Northwest Reg., Portland, OR
Natl. Mar. Fish. Serv. (NMFS). 1996.MakingESA determinations of effect for individualor grouped actions at the watershed scale.Environ. Tech. Serv Div., Habitat Conserv.Branch, Portland, OR
Natl. Mar. Fish. Serv. (NMFS). 2000a.Re-covery planning guidance for Technical Re-covery Teams.http://www.nwfsc.noaa.gov/cbd/trt/about.htm
Natl. Mar. Fish. Serv. (NMFS). 2000b.Reinitia-tion of consultation on operation of the Fed-eral Columbia River power system, includ-ing the juvenile fish transportation program,and 19 Bureau of Reclamation projects in theColumbia Basin. Seattle, WA
Natl. Mar. Fish. Serv. (NMFS). 2000c.Pre-dation on salmonids relative to the FederalColumbia River Power System.NorthwestFish. Sci. Cent., Seattle, WA
Natl. Oceanic Atmospheric Administration
Ann
u. R
ev. E
col.
Syst
. 200
2.33
:665
-706
. Dow
nloa
ded
from
arj
ourn
als.
annu
alre
view
s.or
gby
ST
EPH
EN
T. T
HR
EL
KE
LD
on
02/1
4/06
. For
per
sona
l use
onl
y.

12 Oct 2002 10:9 AR AR173-ES33-23.tex AR173-ES33-23.sgm LaTeX2e(2002/01/18)P1: IBC
SALMON RECOVERY SCIENCE 703
(NOAA). 1997.Impacts of California sea li-ons and Pacific harbor seals on salmonidsand on the coastal ecosystems of Washing-ton, Oregon and California. NOAA Tech.Memo. NMFS-NWFSC-28.Northwest Fish.Sci. Cent., Seattle, WA
Natl. Res. Counc. (NRC), ed. 1995.Scienceand the Endangered Species Act. Washing-ton, DC: Natl. Acad. Press
Natl. Res. Counc. (NRC), ed. 1996.Upstream:Salmon and Society in the Pacific Northwest.Washington, DC: Natl. Acad. Press
Natl. Res. Counc. (NRC), ed. 1998.ImprovingFish Stock Assessments. Washington, DC:Natl. Acad. Press
Natl. Res. Counc. (NRC). 2002.Scientific Eval-uation of Biological Opinions on Endan-gered and Threatened Fishes in the KlamathRiver Basin: Interim Report.Washington,DC: Natl. Acad. Press
Nehlsen W, Williams JE, Lichatowich JA. 1991.Pacific salmon at the crossroads: stocks atrisk from California, Oregon, Idaho andWashington.Fisheries16(2):4–21
Nicholas JW, Hankin DG. 1988.Chinooksalmon populations in Oregon coastal riverbasins: Description of life histories and as-sessment of recent trends in run strengths,Fish. Div. Inf. Rep., No. 88–1.Portland, OR:Oreg. Dep. Fish Wildl. 359 pp.
Nielsen JL, ed. 1995. Evolution and the aquaticecosystem: defining unique units in popu-lation conservation.Proc. Am. Fish. Soc.Symp., 17th. Bethesda, MD: Am. Fish. Soc.
Nielsen JL, Fountain MC, Wright JM. 1997.Biogeographical analysis of Pacific trout(Oncorhynchus mykiss) in California andMexico based on mitochondrial DNA andnuclear microsatellites. InMolecular Sys-tematics of Fishes, ed. TD Kocher, CAStepien, pp. 53–69. New York: Academic
Northwest Power Plan. Counc. (NWPPC).2001.20th annual report of the Pacific North-west Electric Power and Conservation Plan-ning Council. Counc. Doc. 2001–3.North-west Power Plan. Counc., Portland, OR
Pac. Salmon Comm. (PSC). 1997.Incidentalfishing mortality of chinook salmon: mortal-
ity rates applicable to Pacific salmon com-mission fisheries.Rep. TCCHINOOK (97)-1. Vancouver, BC, Can.: Pac. Salmon Comm.
Pac. Salmon Comm. (PSC). 2001a.Catch andescapement of chinook salmon under Pa-cific Salmon Commission jurisdiction 1997–2000. Rep. TCCHINOOK (01)-1. Vancou-ver, BC, Can.: Pac. Salmon Comm.
Pac. Salmon Comm. (PSC). 2001b.Annual ex-ploitation rate analysis and model calibra-tion.Rep. TCCHINOOK (01)-2. Vancouver,BC, Can.: Pac. Salmon Comm.
Pascual M, Bentzen P, Rossi CR, Mackey G,Kinnison MT, Walker R. 2001. First docu-mented case of anadromy in a population ofintroduced rainbow trout in Patagonia, Ar-gentina.Trans. Am. Fish. Soc.130:53–67
Paulsen CM, Fisher TR. 2001. Statistical re-lationship between parr-to-smolt survival ofSnake River spring-summer chinook salmonand indices of land use.Trans. Am. Fish. Soc.130:347–58
Pearcy WG. 1992.Ocean Ecology of NorthPacific Salmonids.Seattle, WA: Wash. SeaGrant
Pess GR, Montgomery DR, Steel EA, BilbyRE, Feist BE, Greenberg HM. 2002. Land-scape characteristics, land use, and cohosalmon (Oncorhynchus kisutch) abundance,Snohomish River, Wash.Can. J. Fish. Aquat.Sci.59:613–23
Poe TP, Shively RS, Tabor RA. 1994. Eco-logical consequences of introduced piscivo-rous fishes in the lower Columbia and SnakeRivers. See Stouder et al. 1994, pp. 347–60
Puget Sound Tech. Recovery Team (PSTRT).2001. Independent populations of chi-nook salmon(Oncorhynchus tshawytscha)in Puget Sound. Public Rev. Draft NMFS,Seattle, WA. http://www.nwfsc.noaa.gov/cbd/trt/popid.pdf
Quigley TM, Arbelbide SJ, eds. 1997.An as-sessment of ecosystem components in the in-terior Columbia basin and portions of theKlamath and Great Basins. Gen. Tech. Rep.PNW-GTR-405.Pac. Northwest Res. Stn.,Portland, OR
Ann
u. R
ev. E
col.
Syst
. 200
2.33
:665
-706
. Dow
nloa
ded
from
arj
ourn
als.
annu
alre
view
s.or
gby
ST
EPH
EN
T. T
HR
EL
KE
LD
on
02/1
4/06
. For
per
sona
l use
onl
y.

12 Oct 2002 10:9 AR AR173-ES33-23.tex AR173-ES33-23.sgm LaTeX2e(2002/01/18)P1: IBC
704 RUCKELSHAUS ET AL.
Quinn TP, Kinnison MT, Unwin MJ. 2001. Evo-lution of Chinook salmon (Oncorhynchustshawytscha) populations in New Zealand:pattern, rate, and process.Genetica113:493–513
Quinn TP, Unwin MJ, Kinnison MT. 2000. Evo-lution of temporal isolation in the wild: ge-netic divergence in timing of migration andbreeding by introduced Chinook salmon pop-ulations.Evolution54:1372–85
Ratner S, Lande R. 2001. Demographic andevolutionary responses to selective harvest-ing in populations with discrete generations.Ecology82(11):3093–104
Raymond HL. 1988. Effects of hydroelectricdevelopment and fisheries enhancement onspring and summer chinook salmon andsteelhead in the Columbia River Basin.N.Am. J. Fish. Manag.8:1–24
Recovery Sci. Rev. Panel (RSRP). 2000.Re-port from the RSRP Meeting held Dec. 3–4.http://www.nwfsc.noaa.gov/cbd/trt/rsrpdoc2.pdf
Recovery Sci. Rev. Panel (RSRP). 2001.Re-port from the RSRP Meeting held March 13–14. http://www.nwfsc.noaa.gov/cbd/trt/rsrpmar01.pdf
Reeves GH, Everest FH, Nickelson TE. 1989.Identification of physical habitats limitingthe production of coho salmon in westernOregon and Washington. Gen. Tech. Rep.PNW-GTR-245, Pac. Northwest Res. Stn.,Portland, OR
Reeves GH, Hall JD, Roelofs TD, Hickman TL,Baker CO. 1991. Rehabilitating and modi-fying stream habitats. InInfluences of For-est and Rangeland Management on SalmonidFishes and Their Habitats, ed. WR Meehan,pp. 519–57. Bethesda, MD: Am. Fish. Soc.
Regetz J. 2002. Landscape-level constraintson recruitment of chinook salmon (On-corhynchus tshawytscha) in the ColumbiaRiver basin, USA.Aquat. Conserv.In press
Reid WV. 2000. Ecosystem data to guidehard choices.Issues Sci. Tech.http://www.nap.edu/issues/
Reimers PE. 1973.The length of residence ofjuvenile fall chinook salmon in Sixes River,
Oregon. Oregon Fish Comm. Res. Rep. 4(2).Portland: Oregon Dep. Fish Wildl. 43 pp.
Reisenbichler RR, Rubin SP. 1999. Geneticchanges from artificial propagation of Pacificsalmon affect the productivity and viabilityof supplemented populations.ICES J. Mar.Sci.56:459–66
Ricker WE. 1995. Trends in the average sizeof Pacific salmon in Canadian catches.Can.Spec. Publ. Fish. Aquat. Sci.121:593–602
Rieman BE, Beamesderfer RC, Vigg S, Poe TP.1991. Estimated loss of juvenile salmonids topredation by Northern Squawfish, Walleyes,and Smallmouth Bass in John Day Reser-voir, Columbia River.Trans. Am. Fish. Soc.120:448–58
Rohlf DJ. 1989.The Endangered Species Act: AGuide to Its Protections and Implementation.Stanford, CA: Stanford Environ. Law Soc.
Ruckelshaus MH, McElhany P, Ford MJ. 2002.Recovering species of conservation concern:Are populations expendable? InThe Impor-tance of Species: Setting Conservation Pri-orities, pp. 305–29, ed. PM Kareiva, S Levin.Princeton, NJ: Princeton Univ. Press. In press
Ruggerone GT. 1986. Consumption of migrat-ing juvenile salmonids by gulls foraging be-low a Columbia River dam.Trans. Am. Fish.Soc.115:736–42
Ryder OA. 1986. Species conservation and sys-tematics: the dilemma of subspecies.TrendsEcol. Evol.1:9–10
Sala OE, Chapin FS III, Armesto JJ, BerlowE, Bloomfield J, et al. 2000. Global biodi-versity scenarios for the year 2100.Science287:1770–74
Schaller HA, Petrosky CE, Langness OP. 1999.Contrasting patterns of productivity and sur-vival rates for stream-type chinook salmon(Oncorhynchus tshawytscha) populations ofthe Snake and Columbia Rivers.Can. J. Fish.Aquat. Sci.56:1031–45
Schluter D. 1998. Ecological causes of spe-ciation. In Endless Forms: Species andSpeciation, ed. DJ Howard, SH Berlocher,pp. 114–29. Oxford, UK: Oxford Univ.Press
Seattle Times.2002. Leery of grizzly tests,
Ann
u. R
ev. E
col.
Syst
. 200
2.33
:665
-706
. Dow
nloa
ded
from
arj
ourn
als.
annu
alre
view
s.or
gby
ST
EPH
EN
T. T
HR
EL
KE
LD
on
02/1
4/06
. For
per
sona
l use
onl
y.

12 Oct 2002 10:9 AR AR173-ES33-23.tex AR173-ES33-23.sgm LaTeX2e(2002/01/18)P1: IBC
SALMON RECOVERY SCIENCE 705
legislator demands review of all endangered-species studies.Seattle Times, Jan. 10
Simberloff DS. 2000. Nonindigenous species:a global threat to biodiversity and stability. InNature and Human Society: The Quest for aSustainable World, ed. P Raven, T Williams,pp. 325–34. Washington, DC: Natl. Acad.Press
Smith C. 1979.Salmon Fishers of the Colum-bia. Corvallis: Oregon State Univ. Press
Smith CJ, Castle P. 1994.Puget Sound chi-nook salmon(Oncorhynchus tshawytscha)escapement estimates and methods—1991.Washington Dep. Fish Wildl. Proj. Rep. Ser.No. 1.Wash. Dep. Fish. Wildl., Olympia, WA
Smith CT, Nelson RJ, Wood CC, Koop BF.2001. Glacial biogeography of North Amer-ican coho salmon (Oncorhynchus kisutch).Mol. Ecol.10:2775–85
Stokstad E. 2002. Fur flies over charges of mis-conduct.Science295:250–51
Storfer A. 1996. Quantitative genetics: apromising approach for the assessment of ge-netic variation in endangered species.TrendsEcol. Evol.11:343–48
Stouder DJ, Bisson PA, Naiman RJ, eds. 1996.Pacific Salmon and Their Ecosystems: Statusand Future Options. New York: Chapman &Hall
Stouder DJ, Fresh KL, Feller RJ, eds. 1994.Theory and Application in Fish FeedingEcology.Columbia: Univ. SC Press
Strassel KA. 2002. The missing lynx.The WallStreet J., Jan. 24
Tallman RF, Healey MC. 1991. Phenotypic dif-ferentiation in seasonal ecotypes of chumsalmon,Oncorhynchus keta. Can. J. Fish.Aquat. Sci.48:661–71
Tallman RF, Healey MC. 1994. Homing, stray-ing, and gene flow among seasonally sepa-rated populations of chum salmon.Can. J.Fish. Aquat. Sci.51:577–88
Taylor EB. 1991. A review of local adapta-tion in Salmonidae, with particular referenceto Atlantic and Pacific salmon.Aquaculture98:185–207
Tear TH, Scott JM, Hayward PH, Griffith B.1993. Status and prospects for success of the
Endangered Species Act: A look at recoveryplans.Science262:976–97
Tear TH, Scott JM, Hayward PH, Griffith B.1995. Recovery plans and the EndangeredSpecies Act: Are criticisms supported bydata?Conserv. Biol.9:182–95
Teel DJ, Milner GB, Winans GA, Grant WS.2000. Genetic population structure and ori-gin of life history types in Chinook salmon inBritish Columbia, Canada.Trans. Am. Fish.Soc.129:194–209
US v. Washington. The Boldt Decision. 384 F.Suppl. 312; 1974 U.S.Dist. LEXIS12291
Utter F, Milner G, Stahl G, Teel D. 1989.Genetic population structure of Chinooksalmon,Oncorhynchus tshawytscha, in thePacific Northwest.Fish. Bull.87:239–64
Verhovek SH. 2002. “Saving” wild salmon’sbucket-borncousins.New York Times,Feb.4
Vitousek PM. 1994. Beyond global warming:ecology and global change.Ecology 75:1861–76
Waples RS. 1991. Pacific salmon (Onco-rhynchusspp.) and the definition of “species”under the Endangered Species Act.Mar.Fish. Rev.53:11–22
Waples RS. 1995. Evolutionarily significantunits and the conservation of biological di-versity under the Endangered Species Act.See Nielsen 1995, pp. 8–27
Waples RS. 1998. Separating the wheat fromthe chaff: patterns of genetic differentiationin high gene flow species.J. Hered.89:438–50
Waples RS. 1999. Dispelling some myths abouthatcheries.Fisheries24:12–21
Waples RW, Ford MJ, Schmitt D. 2002. Em-pirical results of salmon supplementation: apreliminary assessment. InEcological andGenetic Implications of Aquaculture Activ-ities, ed. T Bert. The Netherlands: KluwerAcademic. In press
Waples RW, Gustafson RG, Weitkamp LA,Myers JM, Johnson OW, Busby PJ, et al.2001. Characterizing diversity in salmonfrom the Pacific Northwest.J. Fish Biol.59(Suppl.A):1–41
Wash. Dep. Fish Wildl. Point-No-Point Treaty
Ann
u. R
ev. E
col.
Syst
. 200
2.33
:665
-706
. Dow
nloa
ded
from
arj
ourn
als.
annu
alre
view
s.or
gby
ST
EPH
EN
T. T
HR
EL
KE
LD
on
02/1
4/06
. For
per
sona
l use
onl
y.

12 Oct 2002 10:9 AR AR173-ES33-23.tex AR173-ES33-23.sgm LaTeX2e(2002/01/18)P1: IBC
706 RUCKELSHAUS ET AL.
tribes (WDFW & PNPTT). 2000.Sum-mer Chum Salmon Conservation Initiative.An implementation plan to recover summerchum in the Hood Canal and Strait of Juande Fuca region.Olympia, WA: WDFW. 424pp.
Wash. Dep. Fish Wildl. West. Wash. TreatyIndian Tribes (WDFW & WWTIT). 1993.1992 Washington State Salmon and Steel-head Stock Inventory. West. Wash. Treaty In-dian Tribes. Olympia, WA: WDFW
Weber B. 2002. Wildlife society clarifies its rolein lynx studies.The Wall Street J., Feb. 12
Weitkamp LA, Wainwright TC, Bryant GJ, Mil-ner GB, Teel DJ, et al. 1995.Status Reviewof Coho salmon from Washington, Oregon,and California. NOAA Tech. Memo. NMFS-NWFSC-24.Northwest Fish. Sci. Cent., Seat-tle, WA
Welch DW, Ward BR, Smith BD, Eveson JP.2000. Temporal and spatial responses ofBritish Columbia steelhead (Oncorhynchusmykiss) populations to ocean climate shifts.Fish. Oceanogr.9:17–32
Williams JG, Smith SG, Muir WD. 2001. Sur-vival estimates for downstream migrant year-ling juvenile salmonids through the Snakeand Columbia River hydropower system1966–1980 and 1993–1999.N. Am. J. Fish.Manag.21:310–17
Williams JG, Tuttle ME. 1992. The ColumbiaRiver: fish habitat restoration following hy-droelectric dam construction. InRestoringthe Nation’s Marine Environment, ed. GWThayer, pp. 405–22. College Park: MarylandSea Grant
Willson MF, Gende SM, Marston BH. 1998.Fishes and the forest.BioScience48:455–62
Willson MF, Halupka KC. 1995. Anadromousfish as keystone species in vertebrate com-munities.Conserv. Biol.9:489–97
Wipfli MS, Hudson JP, Chaloner DT, Caou-ette JR. 1999. Influence of salmon spawnerdensities on stream productivity in southeastAlaska.Can. J. Fish. Aquat. Sci.56(9):1600–11
Wondolleck JM, Yaffee SL. 2000.Making Col-laboration Work. Lessons from Natural Re-source Management.Washington, DC: Is-land
Wood CC. 1987. Predation of juvenile Pacificsalmon by the common merganser (Mergusmerganser) on Eastern Vancouver Island. I:Predation during seaward migration.Can. J.Fish. Aquat. Sci.44:941–49
Wood CC. 1995. Life history variation andpopulation structure in sockeye salmon. SeeNielsen 1995, pp. 195–216
Wood CC, Riddell BE, Rutherford DT, With-ler RE. 1994. Biochemical genetic surveyof sockeye salmon (Oncorhynchus nerka) inCanada.Can J. Fish. Aquat. Sci.51:114–31
Zabel RW, Williams JG. 2002. Selective mor-tality in chinook salmon: what is the role ofhuman disturbance?Ecol. Appl.21(1):173–83
Zinn JL, Johnson KA, Sander JE, Fryer JL.1977. Susceptibility of salmonid species andhatchery stocks of chinook salmon (On-corhynchus tshawytscha) to infections byCeratomyxa shasta. J. Fish. Res. Board Can.34:933–36
Ann
u. R
ev. E
col.
Syst
. 200
2.33
:665
-706
. Dow
nloa
ded
from
arj
ourn
als.
annu
alre
view
s.or
gby
ST
EPH
EN
T. T
HR
EL
KE
LD
on
02/1
4/06
. For
per
sona
l use
onl
y.
P1: FDS
September 27, 2002 19:42 Annual Reviews AR173-FM
Annual Review of Ecology and SystematicsVolume 33, 2002
CONTENTS
SAPROXYLIC INSECT ECOLOGY AND THE SUSTAINABLEMANAGEMENT OF FORESTS, Simon J. Grove 1
CONUS VENOM PEPTIDES: REFLECTIONS FROM THE BIOLOGY OFCLADES AND SPECIES, Baldomero M. Olivera 25
TROUBLESHOOTING MOLECULAR PHYLOGENETIC ANALYSES,Michael J. Sanderson and H. Bradley Shaffer 49
THE EARLY RADIATIONS OF CETACEA (MAMMALIA): EVOLUTIONARYPATTERN AND DEVELOPMENTAL CORRELATIONS, J. G. M. Thewissenand E. M. Williams 73
THE MESOZOIC RADIATION OF BIRDS, Luis M. Chiappeand Gareth J. Dyke 91
PLANT ECOLOGICAL STRATEGIES: SOME LEADING DIMENSIONS OFVARIATION BETWEEN SPECIES, Mark Westoby, Daniel S. Falster,Angela T. Moles, Peter A. Vesk, and Ian J. Wright 125
REPRODUCTIVE PROTEIN EVOLUTION, Willie J. Swansonand Victor D. Vacquier 161
THE CAUSES AND CONSEQUENCES OF ANT INVASIONS,David A. Holway, Lori Lach, Andrew V. Suarez,Neil D. Tsutsui, and Ted J. Case 181
GULF OF MEXICO HYPOXIA, A.K.A. “THE DEAD ZONE”,Nancy N. Rabalais, R. Eugene Turner, and William J. Wiseman, Jr. 235
THE (SUPER)TREE OF LIFE: PROCEDURES, PROBLEMS, ANDPROSPECTS, Olaf R. P. Bininda-Emonds, John L. Gittleman,and Mike A. Steel 265
HOMOGENIZATION OF FRESHWATER FAUNAS, Frank J. Rahel 291
THE RENAISSANCE OF COMMUNITY-BASED MARINE RESOURCEMANAGEMENT IN OCEANIA, R. E. Johannes 317
NUTRIENT CYCLING BY ANIMALS IN FRESHWATER ECOSYSTEMS,Michael J. Vanni 341
EFFECTS OF UV-B RADIATION ON TERRESTRIAL AND AQUATICPRIMARY PRODUCERS, Thomas A. Day and Patrick J. Neale 371
v
Ann
u. R
ev. E
col.
Syst
. 200
2.33
:665
-706
. Dow
nloa
ded
from
arj
ourn
als.
annu
alre
view
s.or
gby
ST
EPH
EN
T. T
HR
EL
KE
LD
on
02/1
4/06
. For
per
sona
l use
onl
y.

P1: FDS
September 27, 2002 19:42 Annual Reviews AR173-FM
vi CONTENTS
THE EVOLUTION AND MAINTENANCE OF ANDRODIOECY,John R. Pannell 397
MAST SEEDING IN PERENNIAL PLANTS: WHY, HOW, WHERE?,Dave Kelly and Victoria L. Sork 427
DISTURBANCE TO MARINE BENTHIC HABITATS BY TRAWLINGAND DREDGING: IMPLICATIONS FOR MARINE BIODIVERSITY,Simon F. Thrush and Paul K. Dayton 449
PHYLOGENIES AND COMMUNITY ECOLOGY, Campbell O. Webb,David D. Ackerly, Mark A. McPeek, and Michael J. Donoghue 475
STABLE ISOTOPES IN PLANT ECOLOGY, Todd E. Dawson,Stefania Mambelli, Agneta H. Plamboeck, Pamela H. Templer,and Kevin P. Tu 507
THE QUALITY OF THE FOSSIL RECORD: IMPLICATIONS FOREVOLUTIONARY ANALYSES, Susan M. Kidwell and Steven M. Holland 561
NEOPOLYPLOIDY IN FLOWERING PLANTS, Justin Ramseyand Douglas W. Schemske 589
HERBIVORE OFFENSE, Richard Karban and Anurag A. Agrawal 641
THE PACIFIC SALMON WARS: WHAT SCIENCE BRINGS TO THECHALLENGE OF RECOVERING SPECIES, Mary H. Ruckelshaus,Phil Levin, Jerald B. Johnson, and Peter M. Kareiva 665
ESTIMATING DIVERGENCE TIMES FROM MOLECULAR DATA ONPHYLOGENETIC AND POPULATION GENETIC TIMESCALES,Brian S. Arbogast, Scott V. Edwards, John Wakeley, Peter Beerli,and Joseph B. Slowinski 707
THE FATE OF CLADES IN A WORLD OF RECURRENT CLIMATICCHANGE: MILANKOVITCH OSCILLATIONS AND EVOLUTION,Roland Jansson and Mats Dynesius 741
INDEXESSubject Index 779Cumulative Index of Contributing Authors, Volumes 29–33 817Cumulative Index of Chapter Titles, Volumes 29–33 820
ERRATAAn online log of corrections to Annual Review of Ecology and Systematicschapters may be found at http://ecolsys.annualreviews.org/errata.shtml
Ann
u. R
ev. E
col.
Syst
. 200
2.33
:665
-706
. Dow
nloa
ded
from
arj
ourn
als.
annu
alre
view
s.or
gby
ST
EPH
EN
T. T
HR
EL
KE
LD
on
02/1
4/06
. For
per
sona
l use
onl
y.