the pairs of clusters abell 222 / abell 223 and abell 1758 ... · and abell 1758 (bottom);...
TRANSCRIPT
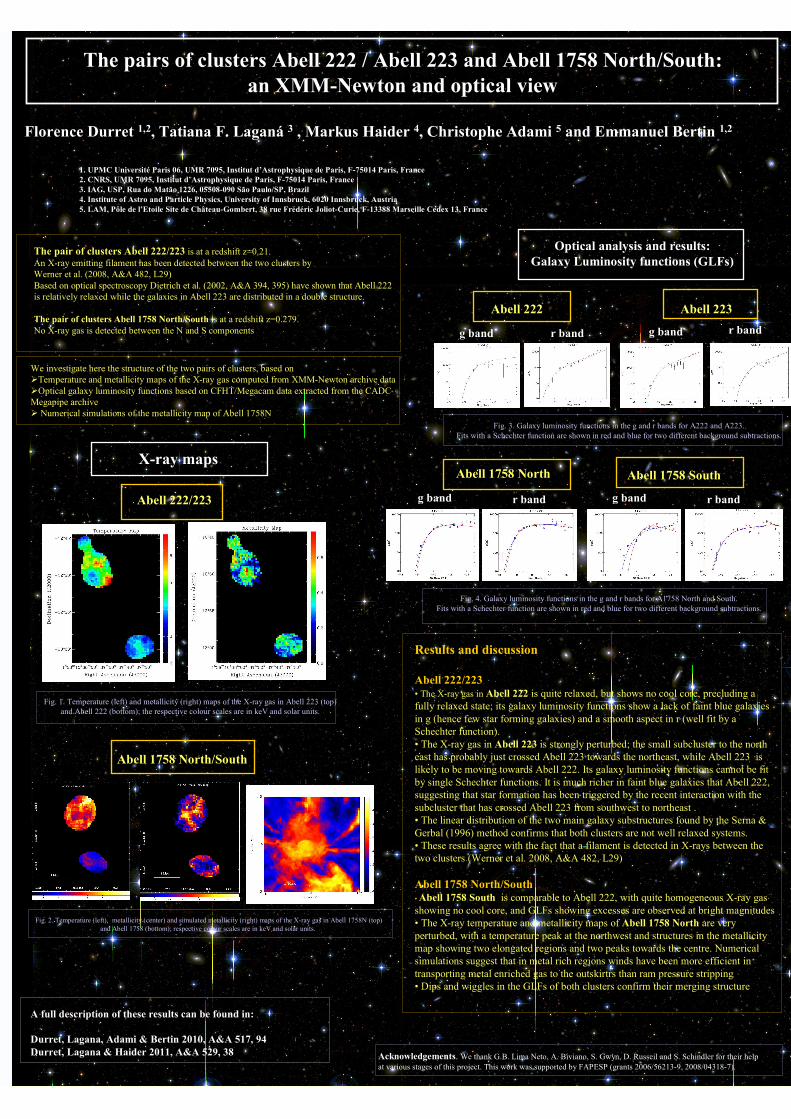
The pairs of clusters Abell 222 / Abell 223 and Abell 1758 North/South:
an XMM-Newton and optical view
Florence Durret 1,2, Tatiana F. Laganá 3 , Markus Haider 4, Christophe Adami 5 and Emmanuel Bertin 1,2
1. UPMC Université Paris 06, UMR 7095, Institut d’Astrophysique de Paris, F-75014 Paris, France
2. CNRS, UMR 7095, Institut d’Astrophysique de Paris, F-75014 Paris, France
3. IAG, USP, Rua do Matão 1226, 05508-090 São Paulo/SP, Brazil
4. Institute of Astro and Particle Physics, University of Innsbruck, 6020 Innsbruck, Austria
5. LAM, Pôle de l’Etoile Site de Château-Gombert, 38 rue Frédéric Joliot-Curie, F-13388 Marseille Cedex 13, France
Fig. 3. Galaxy luminosity functions in the g and r bands for A222 and A223.
Fits with a Schechter function are shown in red and blue for two different background subtractions.
Fig. 1. Temperature (left) and metallicity (right) maps of the X-ray gas in Abell 223 (top)
and Abell 222 (bottom); the respective colour scales are in keV and solar units.
A full description of these results can be found in:
Durret, Lagana, Adami & Bertin 2010, A&A 517, 94
Durret, Lagana & Haider 2011, A&A 529, 38
Results and discussion
Abell 222/223• The X-ray gas in Abell 222 is quite relaxed, but shows no cool core, precluding a
fully relaxed state; its galaxy luminosity functions show a lack of faint blue galaxies
in g (hence few star forming galaxies) and a smooth aspect in r (well fit by a
Schechter function).
• The X-ray gas in Abell 223 is strongly perturbed; the small subcluster to the north
east has probably just crossed Abell 223 towards the northeast, while Abell 223 is
likely to be moving towards Abell 222. Its galaxy luminosity functions cannot be fit
by single Schechter functions. It is much richer in faint blue galaxies that Abell 222,
suggesting that star formation has been triggered by the recent interaction with the
subcluster that has crossed Abell 223 from southwest to northeast .
• The linear distribution of the two main galaxy substructures found by the Serna &
Gerbal (1996) method confirms that both clusters are not well relaxed systems.
• These results agree with the fact that a filament is detected in X-rays between the
two clusters (Werner et al. 2008, A&A 482, L29)
Abell 1758 North/South•Abell 1758 South is comparable to Abell 222, with quite homogeneous X-ray gas
showing no cool core, and GLFs showing excesses are observed at bright magnitudes
• The X-ray temperature and metallicity maps of Abell 1758 North are very
perturbed, with a temperature peak at the northwest and structures in the metallicity
map showing two elongated regions and two peaks towards the centre. Numerical
simulations suggest that in metal rich regions winds have been more efficient in
transporting metal enriched gas to the outskirtrs than ram pressure stripping
• Dips and wiggles in the GLFs of both clusters confirm their merging structure
Acknowledgements. We thank G.B. Lima Neto, A. Biviano, S. Gwyn, D. Russeil and S. Schindler for their help
at various stages of this project. This work was supported by FAPESP (grants 2006/56213-9, 2008/04318-7).
The pair of clusters Abell 222/223 is at a redshift z=0.21.
An X-ray emitting filament has been detected between the two clusters by
Werner et al. (2008, A&A 482, L29)
Based on optical spectroscopy Dietrich et al. (2002, A&A 394, 395) have shown that Abell 222
is relatively relaxed while the galaxies in Abell 223 are distributed in a double structure.
The pair of clusters Abell 1758 North/South is at a redshift z=0.279.
No X-ray gas is detected between the N and S components
We investigate here the structure of the two pairs of clusters, based on
�Temperature and metallicity maps of the X-ray gas computed from XMM-Newton archive data
�Optical galaxy luminosity functions based on CFHT/Megacam data extracted from the CADC
Megapipe archive
� Numerical simulations of the metallicity map of Abell 1758N
X-ray maps
Optical analysis and results:
Galaxy Luminosity functions (GLFs)
A
Abell 1758 North/South
Abell 222/223
Fig. 2. Temperature (left), metallicity (center) and simulated metallicity (right) maps of the X-ray gas in Abell 1758N (top)
and Abell 1758 (bottom); respective colour scales are in keV and solar units.
Abell 223
Abell 1758 South
Abell 222
g band r bandr band g band
Abell 1758 North
Fig. 4. Galaxy luminosity functions in the g and r bands for A1758 North and South.
Fits with a Schechter function are shown in red and blue for two different background subtractions.
r bandg bandr bandg band
g band