the parkfield earthquake experiment john langbein usgs; menlo park, ca
TRANSCRIPT

The Parkfield Earthquake Experiment
John Langbein
USGS; Menlo Park, CA

Acknowledgements, etc
• USGS
• State of California, both CGS and OES
• UCBerkeley/LBL
• CSIRO/University of Queensland
• UCRiverside

Outline
• Plate tectonics and Parkfield• Why Parkfield• Goals of the experiment• Instrumentation• Results from 20 years of monitoring• Results from the 2004 Earthquake; The surprises• Spin-offs from Parkfield• Strain accumulation and its release (Creep vs
Earthquakes)

Overview of Plate Tectonics and its relation to Central and Southern Calif.

"Parkfield remains the best identified locale to trap an earthquake." – Hager Committee Report (1994) to the National Earthquake Prediction Evaluation Council

"Parkfield remains the best identified locale to trap an earthquake." – Hager Committee Report (1994) to the National Earthquake Prediction Evaluation Council
2004
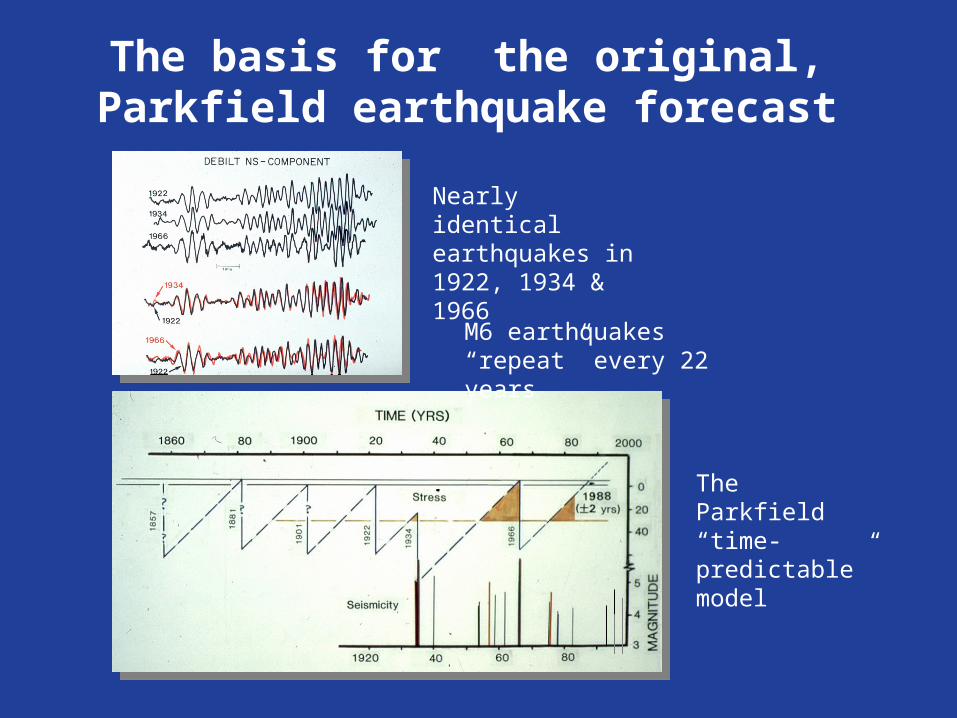
Nearly identical earthquakes in 1922, 1934 & 1966
The Parkfield “time-predictable” model
M6 earthquakes “repeat” every 22 years
The basis for the original, Parkfield earthquake forecast

Evidence that Parkfield earthquakes might be “predictable”
• M5 foreshocks 17 minutes before 1934 and 1966 mainshocks
• Possible, rapid slip on San Andreas fault preceding 1966 mainshocko Ground cracking observed on fault 10 days prior to 1966
mainshock - could be desiccation of the soil
o Break in irrigation pipe that crosses fault 9 hours before 1966 mainshock

Should we expect accelerating deformation prior to earthquakes?
Accelerating creep prior to failure
Summary of experimental dataFrom Cottrell, Dislocations and plastic flow in crystals, 1953
From numerical simulationsFrom Rice and Rudnicki, 1979

Surface Monitoring Instrumentation
Observe the build-up and release of stresses on the San Andreas Fault through multiple earthquake cycles.
Test the feasibility of short-term earthquake prediction.
Measure near-fault shaking during earthquake rupture, and learn how to predict the amplification of shaking caused by different soil types for improving building codes and designs.
Goals: Parkfield Experiment

Parkfield Monitoring Sites

Parkfield Earthquake Experiment: Highlights to Date
Creation of the most complete active fault observatory in the world.
Continuous operation of real-time warning system for over 15 years, and expansion of its rapid earthquake reporting capability to cover the entire state of California.
Open and unrestricted access to monitoring data through the Internet to permit the entire scientific community to build and test models of the earthquake cycle.
Direct measurement of stress build-up on the San Andreas Fault, and recognition that stress build-up is not uniform with time.
Discovery that many small-magnitude earthquakes at Parkfield are virtually identical and repeatedly rupture the same area on the fault.
Successful measurements prior, during, and after the 2004 Earthquake
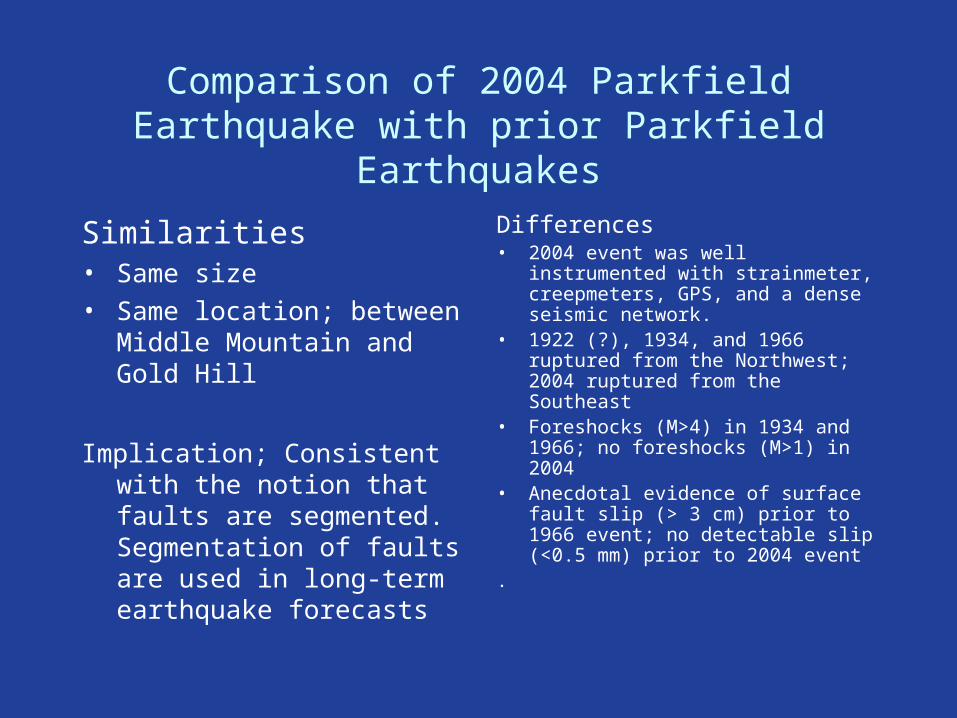
Comparison of 2004 Parkfield Earthquake with prior Parkfield Earthquakes
Similarities• Same size
• Same location; between Middle Mountain and Gold Hill
Implication; Consistent with the notion that faults are segmented. Segmentation of faults are used in long-term earthquake forecasts
Differences• 2004 event was well instrumented with
strainmeter, creepmeters, GPS, and a dense seismic network.
• 1922 (?), 1934, and 1966 ruptured from the Northwest; 2004 ruptured from the Southeast
• Foreshocks (M>4) in 1934 and 1966; no foreshocks (M>1) in 2004
• Anecdotal evidence of surface fault slip (> 3 cm) prior to 1966 event; no detectable slip (<0.5 mm) prior to 2004 event
.

Absence of clear premonitory deformation on strainmeters
No foreshocks
No accelerating deformation to failure
Weakest hint of deformation during the day before the earthquake – very uncertain at this time

Difference in total magnetic field betweeninstruments varies by less than 1 nT
No Precursors Seen on Creepmeters and Magnetometers
No creep prior to quake
Rapid afterslip following the earthquake
No change in telluric currents

Comparing the 1966 and 2004 Aftershocks
Both Earthquakes Ruptured the Same Segment

But with Some Important Differences

Most Extensively Observed Earthquake to Date in the Near-Field Region
Note that some sites
had > 1g acceleration

Potential Contributing Factors to the Observed Ground Motion
•Site conditions
•Rupture propagation
•Stopping phases
•Prestress (“Asperities”)
•Fault geometry

Spin-offs from the Parkfield Experiment
• Plate Boundary Observatory (PBO) www.earthscope.org/pbo
• San Andreas Observatory at Depth (SAFOD) www.earthscope.org/safod

San Andreas Fault Observatory at Depth:Project Overview and Science Goals
Test fundamental theories of earthquake mechanics:
Determine structure and composition of the fault zone.
Measure stress, permeability and pore pressure conditions in situ.
Determine frictional behaviour, physical properties and chemical processes controlling faulting through laboratory analyses of fault rocks and fluids.
Establish a long-term observatory in the fault zone:
Characterize 3-D volume of crust containing the fault.
Monitor strain, pore pressure and temperature during the cycle of repeating microearthquakes.
Observe earthquake nucleation and rupture processes in the near field.
Determine the nature and strength of the asperities that generate repeating microearthquakes.
San
An
dre
as F
ault
Zon
eS
an A
nd
reas
Fau
lt Z
one

PBO -- measure the deformation of plate boundaries in the Western US
o Install 800 continuously operating GPS
o Install 200 strainmeters•What are the forces that drive plate-boundary deformation?•What determines the spatial
distribution of plate-boundary
deformation? •How has plate-boundary
deformation evolved? •What controls the space-time
pattern of earthquake occurrence?
•How do earthquakes nucleate? •What are the dynamics of magma rise, intrusion, and eruption?
•How can we reduce the hazards
of earthquakes and volcanic
eruptions?

Using surveying to measure faulting

Geodetic networks at Parkfield

Geodetic networks at Parkfield
Long term history

Shade
Mine Mt
Slip rate = 27 mm/yr
Yields length change of
23 mm/yr

Shade
Mine Mt
Slip rate = 27 mm/yr
Yields length change of
23 mm/yr
1966
2005
Residuals after removing 23 mm/yr
Extension rate matches
slip rate

Geodetic networks at Parkfield
Long term history

Contraction rate is less than long term slip rate
Kenger
Bench
Slip rate = 27 mm/yr
Yields length change of
19 mm/yr

Using surveying to measure faulting
d=Gm; d is observed displacement;
GPS, trilateration, triangulation
m is the slip distribution on
small partitions
<m>=G-1
d; Least squares solution is
non-unique
Regularize with Laplacian smoothing:
m=0

2005 coseismic slip

Slip from1966+
to 2005

Slip and slip deficit at Parkfield; 1934 to 2005
Cumulative slip

Large, post-seismic deformation
following the Parkfield Earthquake
Power law creep is consistent with the GPS data
= t-p

Evolution of slip using GPS data
• Distribution of postseismic slip
complements that of coseismic slip
• Size of postseismic slip exceeds
that of coseismic slip (size=slip x
area)
• Anticipate that postseismic slip
will continue for about 5 years

Parkfield Earthquake Experiment: Highlights to Date
Creation of the most complete active fault observatory in the world.
Continuous operation of real-time warning system for over 15 years, and expansion of its rapid earthquake reporting capability to cover the entire state of California.
Open and unrestricted access to monitoring data through the Internet to permit the entire scientific community to build and test models of the earthquake cycle.
Direct measurement of stress build-up on the San Andreas Fault, and recognition that stress build-up is not uniform with time.
Discovery that many small-magnitude earthquakes at Parkfield are virtually identical and repeatedly rupture the same area on the fault.
Successful measurements prior, during, and after the 2004 Earthquake
Creep is dominant mechanism of strain release at the north end of the Parkfield segment
Significant deficit in slip at the south end of the Parkfield segment