the past, present and future of statistical weights in
TRANSCRIPT

The past, present and future of statistical weights in cross-national Surveys:
Implications for survey data harmonization
Marcin W. ZielińskiInstitute of Philosophy and Sociology, Polish Academy of Sciences
The Robert B. Zajonc Institute for Social Studies, University of Warsaw
Przemek PowalkoInstitute of Philosophy and Sociology, Polish Academy of Sciences
July 27, 2016, Chicago

The data
22 international projects130 countriesyears: 1966-20131721 studies

Availability of weights over time (60.2% studies)
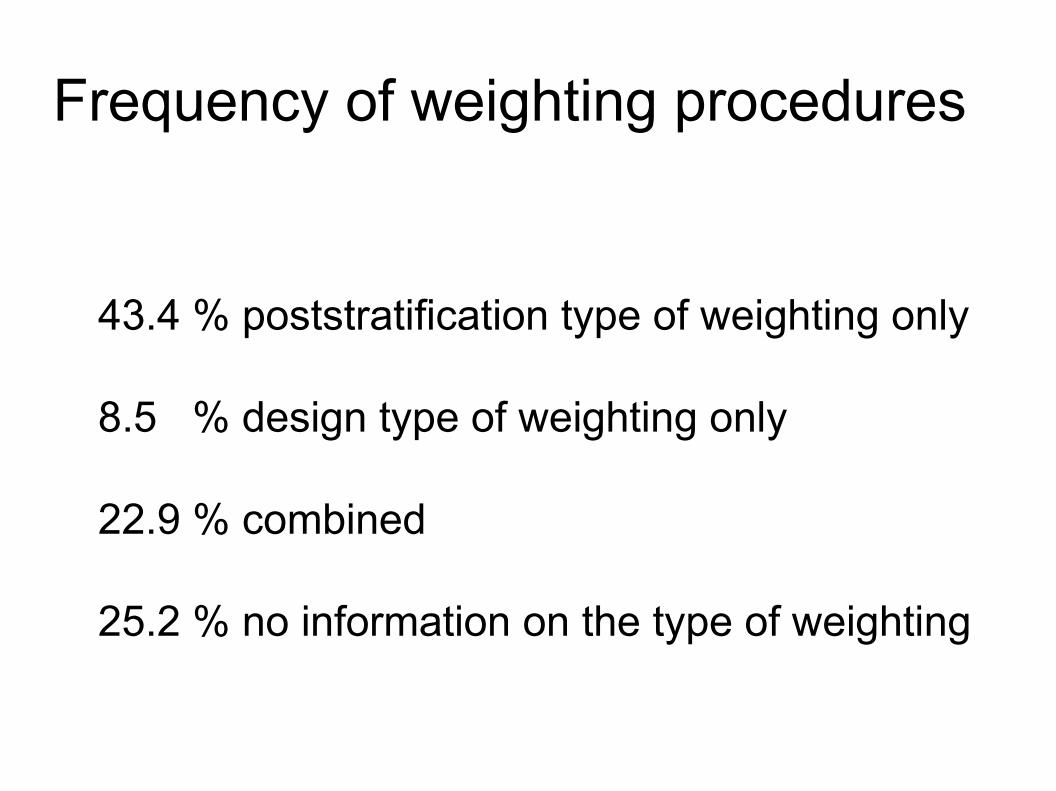
Frequency of weighting procedures
43.4 % poststratification type of weighting only
8.5 % design type of weighting only
22.9 % combined
25.2 % no information on the type of weighting

design vs postrstr. (tendency)

Components of wght. factors
Gender (62.4 %)Age (61.5)Region (39.3)Urbanity level (24.8)Education (18.7)Economical factors (1.4) Corrections for HH samples (13.8)Corrections due to the stratified sampling (21.8)

Quality of weights
mean(wght)
sd(wght)
MIN and MAX (wght)

Quality of weights
Technically “good weight”
mean(wght) = 1
sd(wght) as small as possible
MIN(wght) > 0 and MIN(wght) < 1
MAX(wght) > 1 but small

Consequencies
mean(wght) <> 1 : inflation or deflation of the net sample size (stnd errors, potential bias)
high sd(wght) : high variance introduced into the data
[MIN(wght) > 1] = [mean(wght) > 1]
[MAX(wght) < 1] = [mean(wght) < 1]
MIN(wght) = 0 : excluding cases
high MAX(wght) : possible bias

mean(weight)
70 % mean(wght) != 1
Less strict: 0.999=< weight <= 1.00112.7 % bad
e.g.:Philippines (ASB 2010) = 0.83Philippines (ISSP 1996) = 3.29

mean(weight)
0 100

sd(weight)

MIN&MAX(weight)
Ranges of MIN(wght):exactely=0 in 42 surveys!1.91 Philippines (ISSP 1991) Ranges of MAX(wght):0.92 Lithuania (NBB 2001)90.32 New Zealand (ISSP 2007)

Cross-project perspective
No evident errors: Americas Barometer (AMB)Comparative National Elections Project (CNEP)European Quality of Life (EQLS)European Social Survey (ESS)World Values Survey (WVS)

The issue of comparability
Weights differ in terms of quality and composition and thus their effect on the data
Quality (errors): e.g. rescaling (if mean(wght) != 1)
1. Comparability of weighting factors 2. Comparability of data after weighting
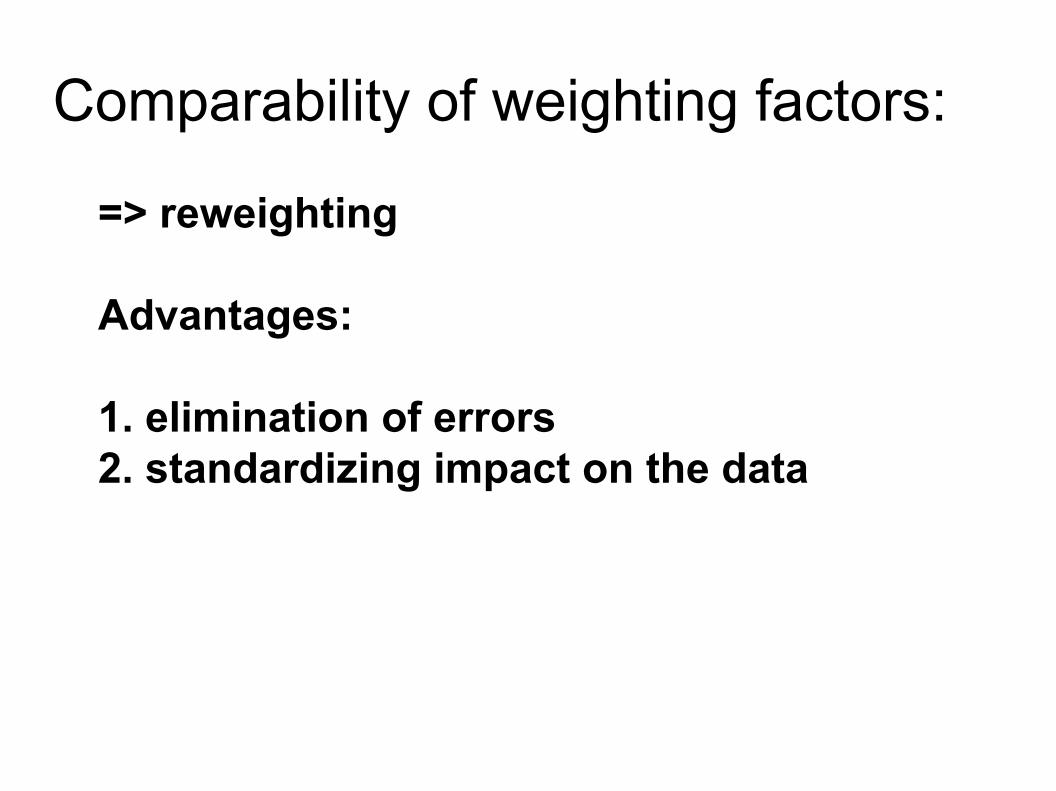
Comparability of weighting factors:
=> reweighting
Advantages:
1. elimination of errors2. standardizing impact on the data

Comparability of weighted data:
=> Leave as they are but eliminate errors that can be eliminated
Advantages:
1. preserving local context2. keeping design component

The decision is yours!