the performance evaluation of recon gurable random ... · pdf file1, 2 and 4with ns = 10 and...
TRANSCRIPT

Abstract—In this work, we aim to obtain our designed
system performance in order to transmit MPEG-4 medical images over indoor wireless channels. These kinds of images look similar regardless of their subject. Thus, the source transition probability matrix (STPM) used in a MAP decoding process can be computed and configured at the Viterbi receiver in advance. Moreover, to overcome the burst noise transmission problem, we employ a ring convolutional encoder with reconfigurable random inter-leavers. The system performances are summarized, based on the transmission over a Nakagami-m channel with block-fading parameter Ns. Thus, the modulating signals are not only corrupted by additive white Gaussian noise but also distorted by the multiplicative and correlative fading variables. The STPM and residual redundancy of both “Ultrasound” and “CTAnkle” images are described and computed. The simulation results of both “Ultra-sound” and “CTAnkle” images are summarized for m= 1, 2 and 4with Ns = 10 and 20.
Index Terms—MPEG-4 images, MAP decoder, Markovmodel, reconfigurable random interleaver, Ring convolutional codes, nakagami-m block-fading channels.
I. INTRODUCTION AND SYSTEM OVERVIEW Recently, the demand for multimedia transmission
applications over indoor wireless channels has increased tremensdously. These kinds of channels are usually distorted by the combined effects of interference, noise and multipath fading. To overcome these effects, we designed an image transmission system by using the techniques of MAP source-controlled channel coding [1] with the inter-leaving process. The system block diagram is shown in Figure 1.The input medical image is compressed by a subband coding technique known as embedded zerotree wavelet algorithm [2][3]. This compression technique is suggested by the MPEG-4 standard [4]. The image is decomposed into the lowest frequency subband (LFS) and higher frequency subbands (HFS).To increase the reliability of transmission, the binary sequence of HFS is di-vided into the variable length of packets. These binary sequence packets are transformed into symbol packets (2 bits/symbol). Then, the MPEG-4 symbol stream is passed through the channel encoder, the recon_gurable random interleaver and the memoryless modulator. The rate polynomial
Manuscript received October 18, 2012; revised November 20, 2012. The authors are with the Department of Electrical Engineering, Faculty
of Engineering, Kasetsart University, Bangkok, Thailand (e-mail: [email protected]; [email protected]).
convolutional encoder over ring of Z4 (RCE) and CPFSK with , are selected as the channel encoder and the modulator, respectively. The CPFSK system is decomposed into a continuous phase encoder (CPE) and a memoryless modulator (MM)[5]. The overall encoder are the combination of the RCE and the CPE. The coded symbol HFS packets from the overall encoder are then passed through a reconfigurable random interleaving process. The MM maps an interleaved-coded symbol into the inphase and quadrature phase components of a baseband CPFSK signal. These two components are subsequently corrupted by noise and distortion from the Nakagami-mblock fading channel. At the receiver, we employ the maximum likelihood (ML) and maximum a posteriori(MAP) decoding, which consists of a demodulation process, the corresponding random deinterleaver, a branchmetric calculator, and a Viterbi decoder. The de-coded4-ary stream is depacketized and fed into a MPEG-4source decoder, resulting in a reconstructed image.
II. SOURCE TRANSITION PROBABILITY MATRIX COMPUTATION AND MAP DECODING
In this section, the computation of the source transition probability matrix (STPM) and the measurement of residual redundancy are discussed. At the receiver, the STPM is necessary to apply MAP decoding. The residual redundancy can be used to approximately indicate the performance improvements. Sayood and Borkenhagen [6] studied redundancy in the DPCM system. The error correcting capability index I was usedas the indicator of performance improvement. Alajaji, Phamdo, Farvardin, and Fuja [7] pointed out that the total residual redundancy ρTcan be expressed as the combination between the redundancy in the form of a nonuniform distribution ρD and in the form of memory ρM. The total redundancy ρTis defined as the difference between a fixed rate R bits/ sample and the minimum rate (entropy rate of a stochastic process ) of theoutput indexed sequence . Note that , representing the minimum number of bit/sample, is defined [8] by
lim 1 , , … , , (1)
where , , … , is the joint entropy of the stochastic process . If the random variables , , … , of the
The Performance Evaluation of Recon_Gurable Random Interleavers with MAP Decoding for MPEG-4 Medical
Image Transmission Systems over Indoor Wireless Channels
Srijidtra Mahapakulchai and Nirawit Sutavimol
International Journal of Future Computer and Communication, Vol. 2, No. 4, August 2013
338DOI: 10.7763/IJFCC.2013.V2.180

process are independent but not identically distributed. We obtain , , … , ∑ , where is the entropy of a discrete random variable . It is obvious that if these random variables are independent and identically distributed (i.i.d.), then the entropy rate is . By using chain rule, if is a stationary stochastic process (containing memory), we can express the joint entropy , , … , as [8]
, , … , | , … , , (2)
where | , … , is the conditional entropy. Thus, in this case, the entropy rate islim | , … , . The proof is given by theorem 4.2.3 in [8]. For a stationary (first order) Markov chain with stationary distribution whose componentsare the stationary probabilities of each state, and a transition probability matrix P whose elements are denoted by , we obtain
, , … , lim | |
log 1 (3)
Example Consider the source transition probability matrix
(STPM) of the “Ultrasound” image as
0.0407 0.06030.1019 0.1889 0.0699 0.06780.1656 0.19430.4944 0.38880.3631 0.3620 0.4070 0.39970.3575 0.3383 (4)
The probabilities of being in the particular states 0, 1,2
and 3 are denoted by , , , and , respectively.These stationary probabilities can be computed by solving the Eigen equation , where the Eigenvector corresponding to Eigenvalue=1.Since we also know that 1,we can find the unique solution. In this case, we obtain the stationary probabilities = 0.2843, = 0.3908, = 0.2118 and = 0.1131. The entropy rate is 1.75217 bits/symbol. By assuming that these two Markov sources produce the output indexed sequences at the same fixed rate R = 2, we compute the residual redundancy as = 0.24783 bits/symbol. For the “CTAnkle” image, the STPM can be expressed as
0.3933 0.37360.4310 0.4574 0.0837 0.07760.2701 0.28530.1152 0.11440.0605 0.0546 0.4191 0.40330.2271 0.2338 (5)
In this case, the entropy rate becomes 1.7011bits/symbol.
The corresponding residual redundancyis 0.2989 bits/symbol.
We construct the MAP decoder for the external ring convolutional encoder with CPFSK system. The observed data samples , can be written as , , , , where = 1, 2,., N during the time interval 1 , For a block-fading channel parameter, is a constant
during Ns signal interval. The new branch metric for Viterbi decoder becomes
, , , , , , ,
2 ln , , (6)
where and are the constant fading amplitude during the first and second signal interval, respectively. The details of derivation can be found in [9]. To utilize the source redundancy, the STPM of the image can be applied to the last term of Eq.(6).
III. RECONFIGURABLE RANDOM INTERLEAVERS Like any interleaving process, random interleaving
process can be used to alleviate the lost of data from bursty noise. There are many works which evaluate the performance of random interleavers such as [10] and [11].S. Benedetto and his colleague [10] consider the analysis and design of serial concatenation of interleaved codes. L. Dinoi and S. Benedetto [11] propose the algorithm of designing good semi-random interleavers for both parallel and serially concatenated codes. In this work, we emphasize the use of recon_gurable random interleavers for the variable length of HFS packets, L. The inter-leaving process is done after passing each packet through the rate channel encoder. Therefore, the interleavingrange is twice of the length of each packet. We compute the interleaved data as dINT = dP, where d is a data vector and P is a random matrix. Note that in our case, the size of a data vector d is twice of the packet length, 2L = LT. Moreover, to generate the matrix P, we begin with the identity matrix. Thenwe reorder each row randomly. Furthermore, by simple verification, one can show that the resulting matrix P is unitary i.e. or ,where · is the transpose operation and I is
the identity matrix. This is particularly important since is corresponding to the deinter-leaving operation and can be easily computed by transpose operation rather than the more complicated procedure of inverse matrix computation. For the deinterleaving process, we obtain a data vector by calculating d as d = dINTPT. To reduce the computation of interleaving process, we do not generate the matrix P. Instead, we find the location of deinterleaved data by searching for the location of number 0,1,…,m-1 in the random sequence. In our previous work [12], we observe the significant improvement of system performance when the size of random interleaver is assigned to the whole packet length. The experiment is done for the famous “Lena” image transmitted over the Rician block-fading channels. However, the usage of the interleaver increases the system's complexity. To reduce the complexity, we design the interleaver, which can be reconfigured to any desirable size, Nr.
International Journal of Future Computer and Communication, Vol. 2, No. 4, August 2013
339
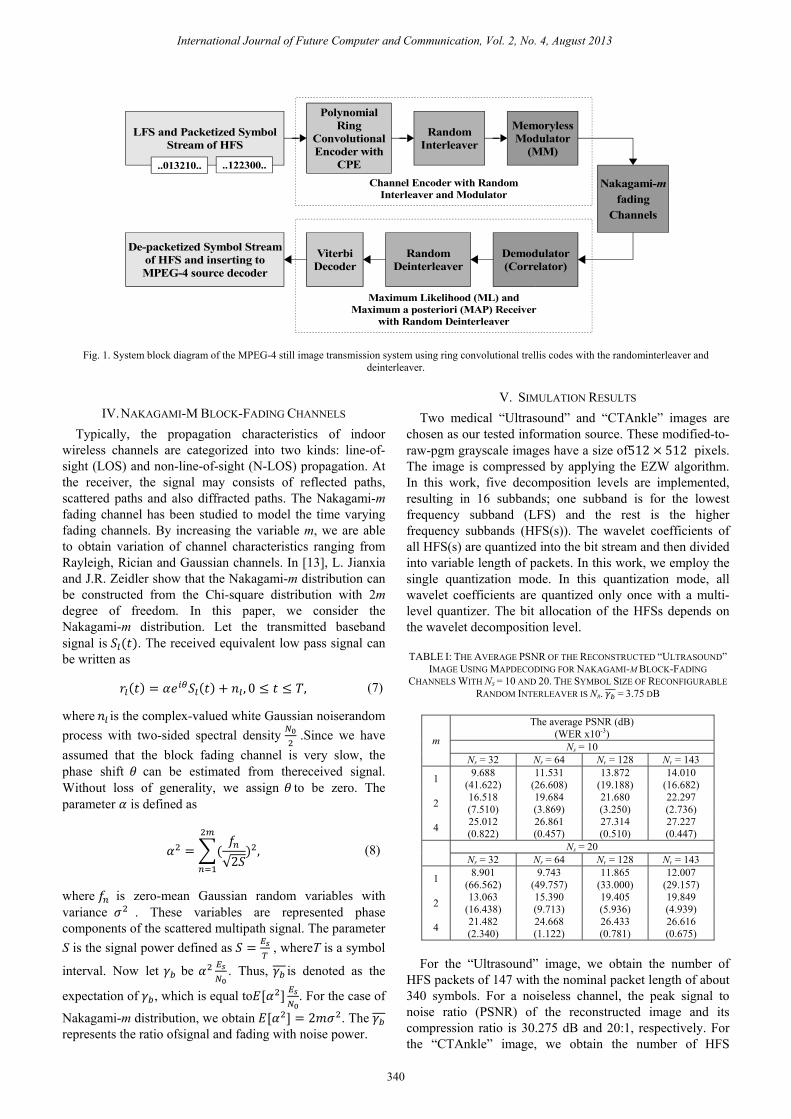
Fig. 1. System block diagram of the MPEG-4 still image transmission system using ring convolutional trellis codes with the randominterleaver and
deinterleaver.
IV. NAKAGAMI-M BLOCK-FADING CHANNELS Typically, the propagation characteristics of indoor
wireless channels are categorized into two kinds: line-of-sight (LOS) and non-line-of-sight (N-LOS) propagation. At the receiver, the signal may consists of reflected paths, scattered paths and also diffracted paths. The Nakagami-m fading channel has been studied to model the time varying fading channels. By increasing the variable m, we are able to obtain variation of channel characteristics ranging from Rayleigh, Rician and Gaussian channels. In [13], L. Jianxia and J.R. Zeidler show that the Nakagami-m distribution can be constructed from the Chi-square distribution with 2m degree of freedom. In this paper, we consider the Nakagami-m distribution. Let the transmitted baseband signal is . The received equivalent low pass signal can be written as
, 0 , (7)
where is the complex-valued white Gaussian noiserandom process with two-sided spectral density .Since we have assumed that the block fading channel is very slow, the phase shift can be estimated from thereceived signal. Without loss of generality, we assign to be zero. The parameter is defined as
√2 , (8)
where is zero-mean Gaussian random variables with variance . These variables are represented phase components of the scattered multipath signal. The parameter S is the signal power defined as , whereT is a symbol
interval. Now let be . Thus, is denoted as the
expectation of , which is equal to . For the case of
Nakagami-m distribution, we obtain 2 . The represents the ratio ofsignal and fading with noise power.
V. SIMULATION RESULTS Two medical “Ultrasound” and “CTAnkle” images are
chosen as our tested information source. These modified-to-raw-pgm grayscale images have a size of512 512 pixels. The image is compressed by applying the EZW algorithm. In this work, five decomposition levels are implemented, resulting in 16 subbands; one subband is for the lowest frequency subband (LFS) and the rest is the higher frequency subbands (HFS(s)). The wavelet coefficients of all HFS(s) are quantized into the bit stream and then divided into variable length of packets. In this work, we employ the single quantization mode. In this quantization mode, all wavelet coefficients are quantized only once with a multi-level quantizer. The bit allocation of the HFSs depends on the wavelet decomposition level. TABLE I: THE AVERAGE PSNR OF THE RECONSTRUCTED “ULTRASOUND”
IMAGE USING MAPDECODING FOR NAKAGAMI-M BLOCK-FADING CHANNELS WITH NS = 10 AND 20. THE SYMBOL SIZE OF RECONFIGURABLE
RANDOM INTERLEAVER IS NR. = 3.75 DB
m
The average PSNR (dB) (WER x10-3)
Ns = 10 Nr = 32 Nr = 64 Nr = 128 Nr = 143
1 9.688 (41.622)
11.531 (26.608)
13.872 (19.188)
14.010 (16.682)
2 16.518 (7.510)
19.684 (3.869)
21.680 (3.250)
22.297 (2.736)
4 25.012 (0.822)
26.861 (0.457)
27.314 (0.510)
27.227 (0.447)
Ns = 20 Nr = 32 Nr = 64 Nr = 128 Nr = 143
1 8.901 (66.562)
9.743 (49.757)
11.865 (33.000)
12.007 (29.157)
2 13.063 (16.438)
15.390 (9.713)
19.405 (5.936)
19.849 (4.939)
4 21.482 (2.340)
24.668 (1.122)
26.433 (0.781)
26.616 (0.675)
For the “Ultrasound” image, we obtain the number of
HFS packets of 147 with the nominal packet length of about 340 symbols. For a noiseless channel, the peak signal to noise ratio (PSNR) of the reconstructed image and its compression ratio is 30.275 dB and 20:1, respectively. For the “CTAnkle” image, we obtain the number of HFS
LFS and Packetized SymbolStream of HFS
PolynomialRing
ConvolutionalEncoder with
CPE
RandomInterleaver
MemorylessModulator
(MM)
Nakagami-mfading
Channels
Demodulator(Correlator)
RandomDeinterleaver
ViterbiDecoder
De-packetized Symbol Streamof HFS and inserting toMPEG-4 source decoder
Maximum Likelihood (ML) andMaximum a posteriori (MAP) Receiver
with Random Deinterleaver
..013210.. ..122300..
Channel Encoder with RandomInterleaver and Modulator
International Journal of Future Computer and Communication, Vol. 2, No. 4, August 2013
340

packets of 158 with the nominal packet length of about 382 symbols. For a noiseless channel, the peak signal to noise ratio (PSNR) of the reconstructed image and its compression ratio is 28.493 dB and 17:1, respectively. For the system channel encoder, we select the 32-state polynomial ring convolutional encoder from our previous work [9] and [12]. Turning to interleaving process, we implement the reconfigurable random interleavers with the variable size of Nr = 32, 64, 128 and 143. Moreover, the Nakagami-m block-fading channels of m = 1, 2, and 4 with Ns = 10 and 20 are considered.
TABLE II: THE AVERAGE PSNR OF THE RECONSTRUCTED “ULTRASOUND”
IMAGE USING MAP DECODING FOR NAKAGAMI-M BLOCK-FADING CHANNELS WITH NS = 10 AND 20. THE SYMBOL SIZE OF RECONFIGURABLE
RANDOM INTERLEAVER IS NR. = 5.00 DB
m
The average PSNR (dB) (WER x10-3)
Ns = 10 Nr = 32 Nr = 64 Nr = 128 Nr = 143
1 11.156 (25.663)
14.189 (14.626)
16.494 (10.638)
16.740 (8.906)
2 20.162 (3.245)
23.433 (1.527)
24.525 (1.603)
25.188 (1.298)
4 28.100 (0.232)
29.029 (0.142)
28.950 (0.192)
29.089 (0.1687)
Ns = 20 Nr = 32 Nr = 64 Nr = 128 Nr = 143
1 10.055 (46.419)
11.187 (31.949)
14.348 (19.606)
14.692 (16.764)
2 15.773 (8.698)
19.118 (4.434)
22.869 (2.738)
23.084 (2.240)
4 25.310 (0.796)
28.089 (0.309)
28.667 (0.270)
28.736 (0.233)
The average word error rates (WER) and peak signal to
noise ratio(PSNR) for the case of the “Ultrasound” image are summarized in Table I and II. In Table I, we observe the system performance for = 3.75 dB with the block-fading Ns = 10 and 20 signal intervals. For the particular Nr, the average PSNRs increase when m goes from 1 to 4. Note that the Nakagami-m distribution is similar to Rayleigh, Rician and Guassian when m = 1, 2 and 4, respectively. For m = 1 with Ns= 10, we gain the PSNRs improvement of about 1.84, 2.34 and 0.13 dB by increasing the Nr from 32 to 64, from 64 to 128, and from 128 to 143, respectively. For m = 2 with Ns= 10, we obtain the maximum increasing of the average PSNR about 3.16 dB when Nr changes from 32 to 64. When the block-fading parameter changes to 20, the average PSNRs of all cases decrease. This is due to the increasing of the burst effect in the channel. The most significant improvement of about 4 dB is shown at m = 2 with Nr changing from 64 to 128. Notice that at m = 4, the average PSNRs of all columns are not much different. It means that for the Gaussian channel, the interleaver may not be much helpful. In Table II, we then increase to 5.00 dB. Again, we observe that the most significant improvements in average PSNRs on both Ns = 10 and 20 are at the same locations as in Table I. For Ns = 10, we obtain the improvement of about 3.27 dB at m = 2 and Nr ranging from 32 to 64. And the improvement of about 3.75 dB is received at Nr going from 64 to 128 for the channel with m = 2 and Ns= 20.
Table III and IV summarize the average WERs and PSNRs for the “CTAnkle” image. In Table III, the simulation results are done with = 3.75 dB and for both
Fig. 2. The reconstructed images are passed through the Nakagami-m
fading channel with m = 2 and Ns = 10. (Left) The = 3.75 dB with Nr = 32. PSNR = 16.57 dB. (Right) The = 3.75 dB with Nr = 64. PSNR =
19.77 dB.
TABLE III: THE AVERAGE PSNR OF THE RECONSTRUCTED “CTANKLE” IMAGE USING MAP DECODING FOR NAKAGAMI-M BLOCK-FADING
CHANNELS WITH NS = 10 AND 20. THE SYMBOL SIZE OF RECONFIGURABLE RANDOM INTERLEAVER IS NR. = 3.75 DB
m The average PSNR (dB) (WER x10-3)
Ns = 10 Nr = 32 Nr = 64 Nr = 128 Nr = 143
1 9.556 (51.454)
11.172 (34.656)
13.291 (22.361)
13.022 (22.147)
2 15.442 (9.773)
17.934 (5.101)
19.904 (3.507)
19.605 (3.404)
4 22.625 (1.348)
24.114 (0.820)
24.594 (0.772)
24.417 (0.762)
Ns = 20 Nr = 32 Nr = 64 Nr = 128 Nr = 143
1 8.502 (78.284)
9.507 (60.358)
11.528 (40.131)
11.505 (37.645)
2 12.868 (20.366)
14.339 (12.462)
17.764 (6.806)
17.902 (6.278)
4 19.405 (3.330)
21.624 (1.703)
23.466 (1.109)
23.483 (1.094)
TABLE IV: THE AVERAGE PSNR OF THE RECONSTRUCTED “CTANKLE”
IMAGE USING MAP DECODING FOR NAKAGAMI-M BLOCK-FADING CHANNELS WITH NS = 10 AND 20. THE SYMBOL SIZE OF RECONFIGURABLE
RANDOM INTERLEAVER IS NR. = 5.00 DB
m
The average PSNR (dB) (WER x10-3)
Ns = 10 Nr = 32 Nr = 64 Nr = 128 Nr = 143
1 10.821 (32.136)
13.168 (19.199)
15.783 (12.304)
15.529 (11.762)
2 18.542 (4.336)
21.223 (2.084)
22.565 (1.699)
22.447 (1.683)
4 25.214 (0.563)
25.989 (0.432)
25.936 (0.451)
25.872 (0.452)
Ns = 20 Nr = 32 Nr = 64 Nr = 128 Nr = 143
1 9.461 (55.035)
11.014 (38.890)
13.441 (23.447)
13.288 (21.649)
2 15.093 (10.768)
17.329 (5.863)
21.022 (3.056)
20.897 (2.816)
4 22.704 (1.307)
24.825 (0.659)
25.632 (0.533)
25.604 (0.541)
Ns= 10 and 20 signal intervals. For m = 1 with Ns= 10, we
gain the noticeable PSNRs improvement of about 1.6 and 2 dB by increasing the Nr from 32 to64 and from 64 to 128, respectively. For m = 2 with Ns= 10, we obtain the most significant improvement of the average PSNR about 2.5 dB when Nr changes from32 to 64. For Ns= 10, the usage of Nr= 143 gives us less average WERs compared to that of Nr= 128. This is what we expect because we employ the longer length of the random interleaver. However, the average PSNRs corresponding to those average WERs are not what we hope for. We obtain less average PSNRs for Nr= 143.For
International Journal of Future Computer and Communication, Vol. 2, No. 4, August 2013
341

Ns= 20, the highest improvement of about 3.4 dB is located at m = 2 with Nr going from 64 to 128. The simulation results for = 5.00 dB are shown in Table IV. Again at m = 2 for both Ns= 10 and 20, we obtain the most significant improvement of about 2.7 dB and3.7 dB for Nr moving from 32 to 64 and from 64 to 128, respectively.
Fig. 2 (Left) and (Right) are the reconstructed images. By increasing the interleaving size Nr from 32 to64, we obtain the PSNR improvement of about 3 dB. The visually noticeable improvement is located around the bottom and also the right hand side of the image. Figures 3 (Left) and (Right) are the reconstructed images. By changing the interleaving size Nr from 64 to 128, we obtain the PSNR improvement of about 3.8 dB. We can observe the visual improvement is around the top-left part of the organ.
Fig. 3. The reconstructed images are passed through the Nakagami-m
fading channel with m = 2 and Ns= 20. (Left) The = 3.75 dB with Nr = 64. PSNR = 18.03 dB. (Right) The = 3.75 dB with Nr = 128. PSNR =
21.88 dB.
VI. CONCLUSION AND FUTURE WORK This correspondence describes the implementation of the
reconfigurable random interleavers and MAP decoding for two medical MPEG-4 images. The system performances are observed over the Nakagami-mblock fading channels. We found that the most significant improvements in average PSNRs of about 2.5-4 dB can be achieved. Note that those improvements happen when the Nakagami-m block fading channel is similar to a Rician fading channel (m= 2). For future works, we will look closely in the channels with m= 1, 1.5, 2 and 2.5, which are all Rician-like fading channels. We hope to find the situation where the interlever can be the most useful.
REFERENCES [1] R. E. V. Dyck, “MPEG-4 image transmission using MAP source-
controlled channel decoding,” IEEE JSAC, vol. 18, pp. 1087-1098, June, 2000.
[2] P. G. Sherwood and K. Zeger, “Progressive Image Coding for Noisy Channels,” IEEE Signal Processing Letter, vol. 4, no. 7, pp. 189-191, Jul. 1997.
[3] H. Man, F. Kossentini, and M. J. T. Smith, \Robust EZW image coding for noisy channels," IEEE Signal Proc. Letters, vol. 4, no. 8, pp. 227-229, Aug. 1997.
[4] ISO/IEC JTC1/SC29/WG11, “Information technology, coding of audio-visual objects: Visual, ISO/IEC 14496-2, Committee Draft,”N2202, Mar. 1998.
[5] B. E. Rimoldi, “A decomposition approach to CPM,”IEEE Trans. Info. Theory, vol. 34, no. 2, pp. 260-270, Mar. 1988.
[6] K. Sayood and J. C. Borkenhagen, “Use of residual redundancy in the design of joint source/channel coders,” IEEETrans. Commun., vol. 39, no. 6, pp. 838-846, Jun. 1991.
[7] F. I. Alajaji, N. Phamdo, N. Farvardin, and T. E. Fuja, “Detection of binary Markov sources over channels with additive Markov noise,” IEEE Trans. Inform. Theory, vol. 42, no. 1, Jan. 1996.
[8] T. M. Cover and J. A. Thomas, Element of Information Theory, Wiley, 1991
[9] S. Mahapakulchai and R. E. V. Dyck, “Design of ring convolutional trellis codes for MAP decoding of MPEG-4 images,” IEEE Trans. Comm., July 2004.
[10] S. Bennedetto, D. Divsalar, G. Montorsi and F. Pollara, “Serial concatenation of interleaved codes: Performance analysis, design, and iterative decoding,” IEEE Trans. Inform. Theory, vol. 44, no. 3, pp. 909-926, May 1998.
[11] L. Dinoi and S. Benedetto, “Variable-size interleaver design for parallel Turbo decoder architectures,” IEEE Trans.Commu., vol. 53, no. 11, pp. 1833-1840, Nov. 2005.
[12] S. Mahapakulchai and C. Charoenlarpnopparut, “MAP Source-controlled Channel Decoding with Interleavers forMPEG-4 Image Indoor Wireless Transmission Systems,” IEICE Transaction on Communications, vol. E92-B, No.10, October 2009.
[13] L. Jianxia and J. R. Zeidler, “A Statisticl simulation model for correlated Nakagami fading channels,” IEEE WCC-ICCT, vol. 2, pp. 1680-1684, 2000.
Srijidtra Mahapakulchai completed her B.Eng degree from Kasetsart University (KU) in 1992. Right after graduation, she joined the faculty member of electrical engineering department at KU. In 1993, she awarded Thai government scholar-ship to pursue her M.S. and Ph.D degrees in the field of communication engineering in the United States of America. She finished her M.S. and Ph.D. degree in electrical engineering from The Pennsylvania State
University. Presently, she is the vice head of Electrical Engineering Department at KU. She teaches undergraduate and graduate courses in digital communication systems. Her area of interest includes wireless channels, detection theory, coding theory, image compression and trans-mission.
International Journal of Future Computer and Communication, Vol. 2, No. 4, August 2013
342