the performance of mesh, shotcrete and membranes for...
TRANSCRIPT

1 INTRODUCTION
It has been recognised for many years that underground mining within Western Australia and elsewhere in the world is progressing to greater depths and the influence of stress on the mining environment is becoming more pronounced. Stress related rock mass degradation and the asso-ciated ground support problems are becoming more common and as such the need to understand the response of ground support to both static and dynamic loading conditions is becoming in-creasingly important (Villaescusa, 2008).
Stress related damage impacts considerably on ground conditions within many West Austral-ian mines thus increasing the need for areal surface support between rock reinforcement ele-ments. Wire mesh is currently the most widely used surface support element used; other types of surface support are mainly shotcrete while thin membranes have been proposed but not yet adopted.
Wire mesh has been used as surface support in mining since the 1950s. Many forms of mesh are used including welded wire mesh, expanded metal mesh and woven (chain link) mesh. Welded wire mesh is the most widely used.
Sprayed Concrete (or shotcrete) was first developed as “Gunite” in the early 1900s. It was modified for mining applications in the 1960s. In the 1980s fibres were added to increase the toughness of the shotcrete. These fibres were initially comprised of steel but later evolved to be made from plastics. The fibre reinforced shotcrete is now commonly called fibrecrete.
The term membrane is a generic term for thin coatings of polymer based material used for areal rock support. Membranes may also be referred to as a thin spray-on liner (TSL). Mem-branes were first used as a form of surface support as early as the 1950s.
The Western Australian School of Mines has undertaken a test program on mesh and sprayed layers (shotcrete and membranes) at its recently developed Static Test Facility (Morton et al.,
The performance of mesh, shotcrete and membranes for surface ground support
E.C. Morton, A.G. Thompson and E. Villaescusa Curtin University of Technology, WA School of Mines, Kalgoorlie, WA, Australia
ABSTRACT: The Western Australian School of Mines (WASM) has developed a facility for the static testing of large scale ground support elements. The samples are loaded using a me-chanical screw feed jack. Instruments measure the displacement and the load being applied. Me-thods have been developed for testing of mesh, shotcrete and membranes. Mesh samples are re-strained on all sides and loaded centrally. A new large scale punch test method has been developed to evaluate shotcrete and membranes. These products are sprayed on to a sandstone substrate containing a centrally located isolated disc. The sprayed product is loaded by displac-ing the disk. The different test methods are described in detail. The test program involved two types of mesh, several shotcrete mix designs with different curing times and one membrane product. The force-displacement responses are used to directly compare the products. The im-plications for implementation of the different ground support products are discussed.
ROCKENG09: Proceedings of the 3rd CANUS Rock Mechanics Symposium, Toronto, May 2009 (Ed: M.Diederichs and G. Grasselli)
PAPER 4022 1

2007). The aim of the program was to develop a method to enable the testing of all surface ground support products under realistic loading scenarios.
2 WASM STATIC TEST FACILITY
In 2005, the Western Australian School of Mines designed, built and commissioned a large scale static test facility. This static test facility, shown in Figure 1 set up for a shotcrete test, comprises two steel frames; a load bearing, upper steel frame used to provide a loading reaction for the screw feed jack and a lower frame used to support the sample. The screw feed jack is driven at a constant displacement rate of 4mm per minute. Load is applied to the sample through a spherical seat to a 300mm square, 35mm thick hardened steel plate. Central displacement is measured using a laser mounted next to the shaft. The resistive force from the sample is meas-ured using a load cell mounted on the shaft behind the loading point. A video camera is used under the test frame to record the sample behaviour.
Clamping frame
Sample support frame
Sample
Load bearing upper frame
Instrumentation Panel
Loading shaft and load cell
LVDT’s
Gears and Motor
Clamping frame
Sample support frame
Sample
Load bearing upper frame
Instrumentation Panel
Loading shaft and load cell
LVDT’s
Gears and Motor
Figure 1. WASM Static test facility.
3 MESH TESTING
Testing has been undertaken on two different mesh types (Figure 2); the standard welded wire mesh used in Western Australian mines utilises 5.6mm diameter galvanised wires welded to form a 100mm square grid pattern and a Geobrugg, patented 4mm diameter high tensile strength wire chain link mesh. The latter mesh consists of wires that are shaped in a zigzag pattern and then woven together to form a diamond grid pattern. The wires are joined at the ends using a specially designed process. In all cases, a nominal 1.3m x 1.3m sample size was tested.
ROCKENG09: Proceedings of the 3rd CANUS Rock Mechanics Symposium, Toronto, May 2009 (Ed: M.Diederichs and G. Grasselli)
PAPER 4022 2

Figure 2. Welded wire mesh and chain link respectively.
3.1 Sample Configuration The welded wire mesh samples were cut from larger sheets and the cross wires marked to enable placement within the mesh frame with the cross wires in contact with the loading plate and oriented across the frame. The chain link samples were oriented with the continuous zigzag wires across the frame.
3.2 Testing Results
In the assessment of any ground support system, the relationship between displacement, force and energy must be assessed in relation to the expected ground reactions. Displacement is influ-enced, sometimes significantly, by the number of failures within the sample. For this reason analysis of the mesh types has been undertaken at rupture. Rupture is defined as the point at which a part of the system breaks. Rupture may or may not correspond to the peak force achieved during the test, but the variability of the sample once rupture has occurred means de-tailed analysis with strong conclusions cannot be achieved. Typical force-displacement reaction curves for welded wire mesh and chain link mesh are shown in Figure 3. The average static rup-ture force for welded wire mesh is 44kN.
0
20
40
60
80
100
120
140
160
0 100 200 300Displacement at loading point (mm)
Forc
e (k
N)
Weld MeshChain Link Mesh
Figure 3. Typical force – displacement static reactions for welded wire mesh and chain link mesh.
ROCKENG09: Proceedings of the 3rd CANUS Rock Mechanics Symposium, Toronto, May 2009 (Ed: M.Diederichs and G. Grasselli)
PAPER 4022 3

The average static rupture force for chain link mesh is 145kN. The average rupture displace-ment for welded wire mesh is 186mm whereas the average static rupture displacement of chain link mesh is 307mm.
Significant differences were observed in the failure mechanisms and locations between welded wire mesh and chain link mesh. The rupture of welded wire mesh always occurred at the boundary on a directly loaded wire. This is a function of the stiff boundary conditions used for testing. The failure mechanism of welded wire mesh, on the other hand, is a measure of the mesh quality. Three different welded wire mesh failure mechanisms were observed (Figure 4); tensile wire failure, weld failure and failure of the wire through the heat affected zone (HAZ). Tensile failure of the wire occurs when the weld strength is less than the strength of the wire.
Figure 4. Welded wire mesh failure mechanisms; L – R tensile wire failure, weld failure and failure of the wire through the HAZ.
Only one failure mechanism was observed for chain link mesh. The chain link mesh failed on the edge of the plate (Figure 5), either as a result of the plate cutting through the wires or as a result of the wires cutting each other at a “link”. This failure mechanism limits the accuracy of the test and causes some variability in the results. Generally only one or two strands broke. Af-ter the first rupture the load dropped completely as a result of plate movement and the test was stopped. This was not considered complete destruction of the mesh.
Figure 5. Chain link failure mechanism.
4 SHOTCRETE TESTING
Testing has been conducted on three different mix designs. All three mixes had a cement con-tent of approximately 15%. Two mixes had 6 kilograms of plastic fibres per cubic metre, how-ever slightly different chemical admixtures and aggregates were used. The slump specified for both these mixes was 70-90mm. The third mix used significantly different sand and gravel ra-tios and chemical admixtures. This mix included 30kg of steel fibre per cubic metre. The slump specified for this mix was approximately 200mm. Testing was conducted at various curing times ranging from 4 hours and 2 weeks.
ROCKENG09: Proceedings of the 3rd CANUS Rock Mechanics Symposium, Toronto, May 2009 (Ed: M.Diederichs and G. Grasselli)
PAPER 4022 4

4.1 Sample preparation The large scale punch test method developed by the Western Australian School of Mines aims to investigate the combined reaction of adhesion and flexural strength. The method involves spraying a shotcrete layer over a thin substrate prepared with a centrally located disc that is cut and isolated from the surrounding substrate.
Sandstone was selected as the most appropriate substrate due to its ready availability in slab form of various uniform thicknesses (20 – 70mm) with the dimensions 1.5m x 1.5m. The natural rough surface texture ensures adhesion of the shotcrete to the substrate. To prepare the substrate, the centre of each slab was marked and then a 500mm diameter disc was formed by drilling through the slab with a large diameter coring bit. The substrates were sprayed with water and then sprayed with the shotcrete. The standard accelerator dosage for the mix was applied. The sample area was 1.5m x 1.5m with realistic spraying conditions used. The substrate was rotated to the steepest possible angle (given site restrictions and safety considerations) to prevent re-bound build up and to provide more realistic spraying conditions (Figure 6).
Once the samples had been sprayed they were placed in a sea container specifically modified to enable a temperature and humidity controlled environment for the curing. The samples were specifically not water cured as this may have increased the hydration of the cement and resulted in a strength increase that would not normally be associated with mining applications. The tem-perature and humidity within the sea container were set to reflect conditions at the site where the sample was sprayed. This information was obtained from the site ventilation officers.
Figure 6. Shotcrete panel spraying.
4.2 Testing Results The results for the three mixes are summarised in Table 1. A typical force-displacement re-sponse is shown in Figure 7.The force-displacement response is divided into three significant parts. The first significant feature is the “rupture” point. This is defined as the first major force related peak and usually relates to the failure of the material. At rupture, none of the tests had visible cracks on the face of the sample but audible cracking was detected indicating that the cement matrix was being fractured. In comparing the rupture force and displacement results for all tests (Figure 8), it was found that rupture displacement was between 1.7 and 4.1mm. The most significant influence on the rupture displacement appears to be the age of the shotcrete. The sample which cured for only 4 hours, ruptured at 5.5mm of displacement. This is likely to be due to the softer nature of the material leading to yielding behaviour rather than the brittle behaviour of samples cured for longer durations.
ROCKENG09: Proceedings of the 3rd CANUS Rock Mechanics Symposium, Toronto, May 2009 (Ed: M.Diederichs and G. Grasselli)
PAPER 4022 5

Table 1. Summary of test results.
Mix Age Average
Thickness (mm)
Rupture Load (kN)
Rupture Displacement
(mm)
Total Displacement
(mm)
Total Energy
(kJ) 1 2 weeks 160 91.19 2.4 71 2.5 1 24 hours 150 84.30 4.1 44 2.0 1 4 hours 35 13.20 5.5 40 0.3 1 5 days 35 6.52 1.8 41 0.4 1 7 days 60 25.11 3.4 58 1.2 2 7 days 60 16.12 2.7 58 1.0 2 7 days 60 21.92 1.8 48 1.0 2 7 days 80 40.89 1.9 76 2.9 3 7 days 75 35.70 1.7 47 1.6
The rupture force was compared with the thickness of the samples as shown in Figure 9. This shows a clear relationship between the rupture force and the thickness. Theoretical considera-tions suggest that the rupture force is equivalent to the square of the thickness.
0
5
10
15
20
25
30
0 20 40 60Displacement at Load Point (mm)
Forc
e (k
N)
Rupture point
Sandstone rupture
Post peak
0
5
10
15
20
25
30
0 20 40 60Displacement at Load Point (mm)
Forc
e (k
N)
Rupture point
Sandstone rupture
Post peak
Figure 7: Typical force displacement curve.
0
20
40
60
80
100
0 1 2 3 4 5 6
Rupture displacement at loading point (mm)
Rup
ture
For
ce (k
N)
Mix 1 Mix 2 Mix 3
Tested at 4 hours. All other tests >24 hours Figure 8. Rupture force – displacement results
ROCKENG09: Proceedings of the 3rd CANUS Rock Mechanics Symposium, Toronto, May 2009 (Ed: M.Diederichs and G. Grasselli)
PAPER 4022 6

0
20
40
60
80
100
0 50 100 150Thickness (mm)
Rup
ture
For
ce (k
N)
Mix 1 Mix 2 Mix 3
Tested at 4 hours. All other tests >24 hours
0
20
40
60
80
100
0 50 100 150Thickness (mm)
Rup
ture
For
ce (k
N)
Mix 1 Mix 2 Mix 3
Tested at 4 hours. All other tests >24 hours
Figure 9. Comparison of rupture force with thickness.
The second significant section of the curve is the post peak reaction. This post peak reaction is often related to the performance of the fibres. The difference between steel and plastic fibre per-formance has still not been confirmed, but observations have shown that the steel fibres pulled through the cement matrix rather than exhibiting tensile failure of the steel. This is indicated by the straightening of the fibre (Figure 10a). The plastic fibres generally elongated and tore result-ing in fraying of the fibres (Figure 10b). It appears that steel fibres may have slightly higher load carrying capacity but the overall displacement capacity of the two fibre types the same. Further observations have shown that the steel fibres are highly susceptible to corrosion once exposed by cracking. One sample was left in the laboratory under atmospheric conditions. Fig-ure 11 shows evidence of surface corrosion after exposure for one month.
The third significant section occurs mid way through the test. This is the point where the sandstone starts cracking. Generally the sandstone begins to crack after 4 – 6mm of deflection of the substrate. This amount of deflection usually occurs between 10mm and 15mm of central displacement, which is beyond the first crack displacement and thus only influences the post peak results for the sample.
Figure 10. Failure of (a) steel fibres and (b) plastic fibres.
ROCKENG09: Proceedings of the 3rd CANUS Rock Mechanics Symposium, Toronto, May 2009 (Ed: M.Diederichs and G. Grasselli)
PAPER 4022 7

Figure 11. Surface corrosion on the steel fibres after atmospheric exposure for one month.
Energy absorption capacity is a measure of the toughness in response to large rock mass move-ments in soft rock, or dynamic loading resulting from the violent failure of over stressed hard rock. Energy values were calculated for each of the tests (Figure 12). It clearly shows that the maximum energy capacity is between 2 and 3kJ for thicker layers whilst thin layers absorb less than 1kJ. In comparison, testing at WASM has shown that welded wire mesh first starts to break at 2kJ whilst high tensile chain link mesh first ruptures at approximately 10kJ (Player et al., 2008).
0.0
0.5
1.0
1.5
2.0
2.5
3.0
0 20 40 60 80 100Displacement at Load Point (mm)
Ene
rgy
(kJ)
150mm 6kg/m3Plastic fibre 24 hrs
80mm 6kg/m3Plastic fibre 7 days
140mm 6kg/m3Plastic fibre 2weeks75mm 30kg/m3Steel fibre 24 hrs
60mm 6kg/m3Plastic fibre 7 days
50mm 6kg/m3Plastic fibre 7 days
35mm 6kg/m3Plastic fibre 5 days
Figure 12. Energy capacity versus displacement capacity of shotcrete.
ROCKENG09: Proceedings of the 3rd CANUS Rock Mechanics Symposium, Toronto, May 2009 (Ed: M.Diederichs and G. Grasselli)
PAPER 4022 8

5 MEMBRANE TESTING
Two different test methods were applied to one membrane product; a beam paver test and a punch test similar to the one used for shotcrete.
5.1 Beam paver test method The first test method involves the beam principle to determine the performance characteristics of the product. The test method involved spraying the membrane over a bed of interlocked pav-ers and applying load to determine the force-displacement response of the product. A review of the ability of the product to bridge cracks, and the penetration of the product into the cracks was completed after the test to determine its interlocking abilities.
Pavers were selected as a base for the initial test program as it was thought that they would provide a reasonable representation of highly jointed rock mass conditions. Zigzag edged pavers were selected to prevent a preferential failure plane forming along the edge of the bricks. Three tests were conducted using the paver test method.
The pavers were laid out onto a 1.6m x 1.6m square wooden pallet. The size of the pavers re-sulted in a sample size of 1.55m x 1.55m. Steel strapping was wrapped around the edge of the pavers and tightened to provide lateral constraint.
The pavers were sprayed with water and the membrane was applied. Testing was undertaken using a displacement rate of 4mm per minute. The final test setup is shown in Figure 13.
5.2 Punch test method
Similarly to shotcrete, the large scale punch test method involved spraying the product over a thin substrate prepared with a centrally located disc that was cut and isolated from the surround-ing substrate. Immediately after spraying, the thickness of the membrane was measured using a small probe on the end of digital callipers. After a specified curing period, the sample was placed on the test frame and load was applied by causing displacement of the disc. Three sam-ples were prepared using this method. The samples were cured for 7 days prior to testing.
Figure 13. Paver test final setup.
ROCKENG09: Proceedings of the 3rd CANUS Rock Mechanics Symposium, Toronto, May 2009 (Ed: M.Diederichs and G. Grasselli)
PAPER 4022 9
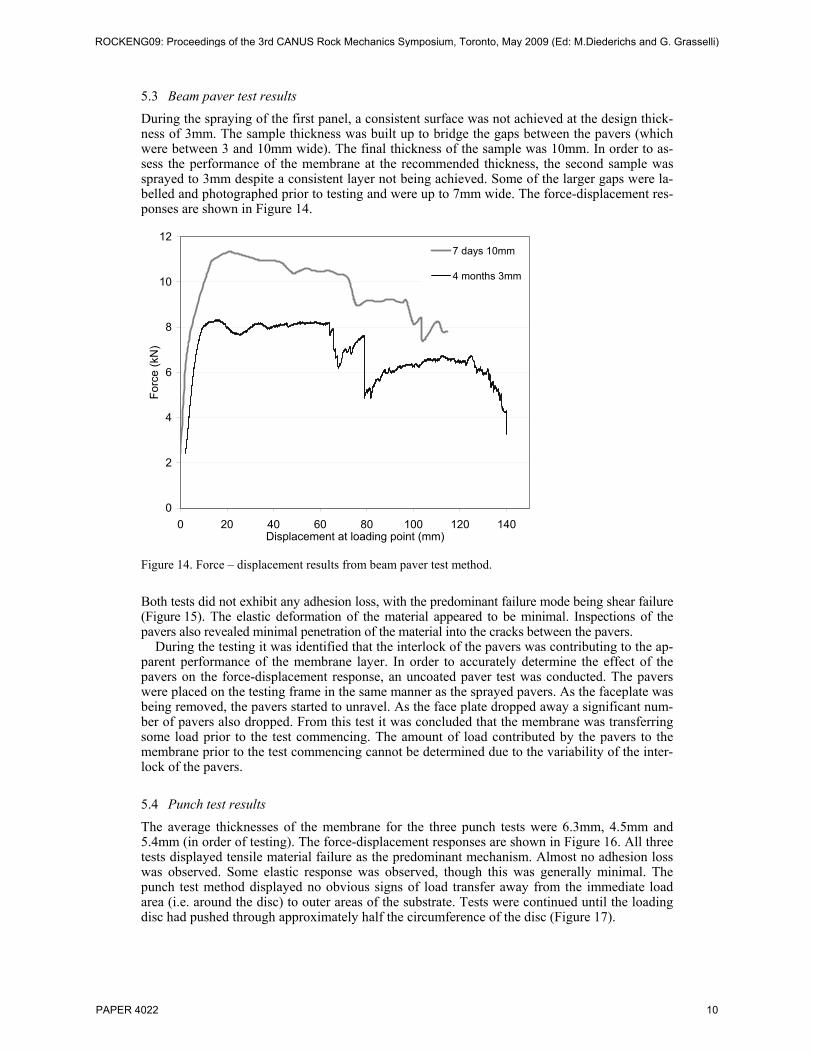
5.3 Beam paver test results During the spraying of the first panel, a consistent surface was not achieved at the design thick-ness of 3mm. The sample thickness was built up to bridge the gaps between the pavers (which were between 3 and 10mm wide). The final thickness of the sample was 10mm. In order to as-sess the performance of the membrane at the recommended thickness, the second sample was sprayed to 3mm despite a consistent layer not being achieved. Some of the larger gaps were la-belled and photographed prior to testing and were up to 7mm wide. The force-displacement res-ponses are shown in Figure 14.
0
2
4
6
8
10
12
0 20 40 60 80 100 120 140Displacement at loading point (mm)
Forc
e (k
N)
7 days 10mm
4 months 3mm
Figure 14. Force – displacement results from beam paver test method.
Both tests did not exhibit any adhesion loss, with the predominant failure mode being shear failure (Figure 15). The elastic deformation of the material appeared to be minimal. Inspections of the pavers also revealed minimal penetration of the material into the cracks between the pavers.
During the testing it was identified that the interlock of the pavers was contributing to the ap-parent performance of the membrane layer. In order to accurately determine the effect of the pavers on the force-displacement response, an uncoated paver test was conducted. The pavers were placed on the testing frame in the same manner as the sprayed pavers. As the faceplate was being removed, the pavers started to unravel. As the face plate dropped away a significant num-ber of pavers also dropped. From this test it was concluded that the membrane was transferring some load prior to the test commencing. The amount of load contributed by the pavers to the membrane prior to the test commencing cannot be determined due to the variability of the inter-lock of the pavers.
5.4 Punch test results The average thicknesses of the membrane for the three punch tests were 6.3mm, 4.5mm and 5.4mm (in order of testing). The force-displacement responses are shown in Figure 16. All three tests displayed tensile material failure as the predominant mechanism. Almost no adhesion loss was observed. Some elastic response was observed, though this was generally minimal. The punch test method displayed no obvious signs of load transfer away from the immediate load area (i.e. around the disc) to outer areas of the substrate. Tests were continued until the loading disc had pushed through approximately half the circumference of the disc (Figure 17).
ROCKENG09: Proceedings of the 3rd CANUS Rock Mechanics Symposium, Toronto, May 2009 (Ed: M.Diederichs and G. Grasselli)
PAPER 4022 10

Figure 15. Shear failure of the sample.
0
1
2
3
4
5
6
7
0 5 10 15 20Displacement at loading point (mm)
Forc
e (k
N)
7 days 4.5mm
7 days 5.6mm
7 days 6.2mm
Figure 16. Force-Displacement results from punch test method.
Figure 17. An example of the sample at the completion of the test.
Figure 18 shows the relationship between measured peak force and the thickness of the material. It can be clearly seen that there is a reduction in the force capacity of the material as thickness increases. This can be directly attributed to the high stiffness and brittle nature of the material as a result of the addition of the cement. At thin thicknesses, the polymer component prevails and
ROCKENG09: Proceedings of the 3rd CANUS Rock Mechanics Symposium, Toronto, May 2009 (Ed: M.Diederichs and G. Grasselli)
PAPER 4022 11

the flexible properties control the product behaviour. As the thickness of the layer increases the cement becomes the dominant material, stiffening the liner and making it more brittle.
0
1
2
3
4
5
6
7
0 2 4 6Thickness (mm)
Peak
For
ce (k
N)
Figure 18. Peak force and thickness relationship.
6 COMPARISON OF PRODUCTS
Figure 19 shows placement capacities of each of the individual products used for rock surface support. Membranes have significantly less force and displacement capacity than both shotcrete and mesh and as such are not recommended to replace mesh or shotcrete under static loading conditions. This is contrary to previous statements where membranes have been promoted as a replacement for shotcrete and mesh (Potvin et al., 2004).
0
10
20
30
40
50
60
0 50 100 150 200Displacement at Load Point (mm)
Forc
e (k
N) 4.5mm membrane 7 days
35mm fibrecrete 4 hrs
60mm fibrecrete 7 days
5.6mm w elded w ire mesh
Low to High Peak Force
1
2
3
4
1
2
3
4
φ
Figure 19. Comparison of performance of weld mesh, shotcrete and a brittle membrane product.
ROCKENG09: Proceedings of the 3rd CANUS Rock Mechanics Symposium, Toronto, May 2009 (Ed: M.Diederichs and G. Grasselli)
PAPER 4022 12

7 CONCLUDING REMARKS
This test program has enabled the comparison of mesh, shotcrete and membranes as rock sur-face support systems. The evaluation of any support system must consider the functions of force, displacement and energy. The punch test showed that the load and displacement capacity of the membrane under discrete loading conditions is minimal. Membranes cannot match the force or displacement properties of shotcrete and mesh and it is questionable as to whether there is value in using this product as a ground support product. Shotcrete, has a limited displacement capacity when compared with mesh,. While shotcrete has the ability to provide immediate sup-port to a rock mass and inhibit loosening, in high deformation environments the limited dis-placement capacity of shotcrete systems may result in a loss of effectiveness. In these circums-tances, shotcrete surface support must be complemented with mesh that has much higher displacement capacities.
ACKNOWLEDGEMENTS
The financial support and encouragement provided by the Australian mining industry and CRC Mining for research at the WA School of Mines are gratefully acknowledged.
REFERENCES
Morton, E, Thompson, A, Villaescusa, E & Roth, A 2007. Testing and analysis of steel wire mesh for mining applications of rock surface support. 11th congress of the International Society for Rock Me-chanics. Ribeiro e Sousa, Olalla and Grossman (ed). Vol.2, July, 1061-1064.
Player, J.R., Villaescusa, E. & Thompson, A.G. 2008. Static and dynamic testing of steel wire mesh for mining applications of rock surface support. 6th International Symposium on Ground Support in Min-ing and Civil Construction, Cape Town, South Africa, Eds. Stacey &Malan, SAIMM:Johannesburg, 693-706.
Potvin, Y, Stacey, D and Hadjigeorgiou, J (ed). 2004. Surface support in mining. ACG Perth. Villaescusa, E. 2008. Ground support research at the WA School of Mines. Invited Paper, 12th Japan
Symposium on Rock Mechanics, Ube, Japan. To be published 2009, Int. J. of the Japanese Committee for Rock Mechanics, Japanese Geotechnical Society:Tokyo.
ROCKENG09: Proceedings of the 3rd CANUS Rock Mechanics Symposium, Toronto, May 2009 (Ed: M.Diederichs and G. Grasselli)
PAPER 4022 13