the performance of russian global depository receipts on the … · 2015-01-02 · this paper...
TRANSCRIPT
The Performance of Russian Global Depository Receipts on the London Stock Exchange
Irina Khindanova
University of Denver
Innokentiy Khindanov AUNIKPLUS
This paper analyzes the performance of Russian Global Depository Receipts listed on the London Stock Exchange. The performance is evaluated assuming two investment strategies: daily portfolio rebalancing and buy-and-hold. Russian GDRs marginally outperform in the short-run and underperform in the long run the UK market, the US market, the Emerging Markets, and the Emerging Markets ADRs. These results resemble the performance of Initial Public Offerings. Russian GDRs outperform to some extent the Russian stock market over the first two trading years. The performance of Russian GDRs varies across industries, depends on raising capital, and is affected by issue timing. INTRODUCTION
This paper analyzes the performance of Russian Global Depository Receipts (GDRs) listed on the London Stock Exchange (LSE) between 2005 and 2011. GDRs are certificates that represent a certain number of foreign shares remaining on deposit with a custodian bank in the company’s home country. GDRs are issued by depository banks and traded in markets outside the company’s home market. The DRs issued by a U.S. depository bank and traded in the U.S. exchanges or in the OTC market are called American Depository Receipts (ADRs). Majority of research on the performance of DRs is focused on ADRs. This paper expands geography of analyzed DRs and examines the performance of Russian DRs on the LSE, the dominant market in Russian securities outside Russia. At the end of 2013, 36 Russian DRs were traded on LSE (LSE, 2014). This study sample includes 31 Russian GDRs issued between 2005 and 2011.
Between 1995 and 2005, the Russian stock market grew at the average annual rate of 50% (Goriaev and Zabotkin, 2006). By 2012, its market capitalization achieved about $875 billion, placing it as the 6th largest emerging market and 15th largest stock market worldwide (World Bank, 2014). A large share of turnover comes from the Depository Receipts trading. In 2005, DRs accounted for 45% of the Russian stock market combined turnover (Goriaev and Zabotkin, 2006). An increased significance of the Russian DRs prompts the analysis of their performance.
Studies of the DRs performance show mixed results. For example, Callaghan, Kleiman, and Tahu (1999) determined that ADRs have positive market-adjusted returns in both short- and long-run investment periods. Whereas Foester and Karolyi (2000) concluded that the ADRs underperform local
Journal of Applied Business and Economics vol. 16(6) 2014 75
comparable firms in the first three trading years. A detailed description of the works on DRs performance is provided in the third section.
A few works study Russian DRs. Smirnova (2004) examined how listing of Russian ADRs impacts prices of underlying shares. The study sample comprised 16 Russian ADRs issued in 1995-2001. She found that the Russian stock market has a negative average abnormal return of -1.045% on the ADR listing day. Companies which listed ADRs in the OTC market had smaller negative stock reaction. More than half of companies exhibited increased local returns volatility after the issuance of ADRs. Jithendranathan (2005) looked at the price links between Russian DRs and the underlying shares. The sample includes 16 DRs traded in 1995-2004. The author did not find any premium/discount between the DRs and the shares. The study results suggest that the host markets do not have a significant influence on the returns of Russian ADRs. Korczak and Bohl (2005) analyzed the cross-listing implications for 33 companies from the Czech Republic, Hungary, Poland, Russia, Slovakia, and Slovenia. The authors reported a market value increase around the cross-listing date. Stock prices significantly increase before listing and hold on afterwards. The average cumulative abnormal return over the 300-day window around the listing was about 26%. Korczak and Bohl found that cross-listing improves the liquidity and pricing efficiency of the home stock market. The trading volume rises and the returns autocorrelations decline after the cross-listing. Smirnova (2008) studied the cross-listing impact on company value and underlying factors for cross-listing decisions. She considered 43 ADRs from the Czech Republic, Hungary, Poland, and Russia, traded in 2000-2003. Smirnova reported an average cross-listing premium of 27.3%, relatively to a set of 123 matching companies that did not issue DRs. Wojcik and Burger (2010) examined geographic patterns of cross-listings from Brazil, Russia, India, and China (BRIC). The authors showed cross-listing companies are relatively big-sized, represent capital-intensive, exporting, and rapidly growing industries. Another finding of the paper was that trading relationships and industrial specialization of the host markets are important factors for choosing the listing markets. Wojcik and Burger determined that cross-listing companies are concentrated in countries’ financial centers, especially in Russia and Brazil.
To our best knowledge, there are no published papers which analyze the performance of the Russian DRs on the London Stock Exchange. The paper fills this gap.
The performance of Russian GDRs is evaluated considering two investment strategies: daily portfolio rebalancing and a buy-and-hold strategy. The evaluation is conducted for both short- and long-term investments periods. The short-term exploration focuses on the performance of GDRs in the first trading month, and the long-term exploration examines the performance over the two first trading years.
The paper is structured as follows. The second section describes the data. The third section provides a literature review. It is followed by a section on a research methodology. The next section analyzes the performance of Russian GDRs. Then the paper examines variations in the performance of Russian GDRs. The last section summarizes findings of the paper. DATA
The study sample includes 31 Russian GDRs issued between 2005 and 2011 and traded on the LSE as Registered Shares. The sample cutoff of 2011 was chosen to have the 2-year trading data for the DR issues. The GDRs were identified using the Bank of New York Mellon directory of Depository Receipts (Bank of New York Mellon, 2013) and cross-referenced with the Thompson Reuters Datastream (Datastream) list of Russian GDRs traded in London (Thompson Reuters Datastream, 2013). The information on prices, trading dates, market values, and size of issues was obtained from the Datastream.
First listings of Russian DRs on the LSE took place in 2005: Novolipetsk Steel (an Industrial Metals & Mining company, DR symbol: NLMK), Sistema (a Mobile Telecom company, DR symbol: SSA), and X5 Retail Group (a Food & Drug Retailer, DR symbol: FIVE). The exchange had the largest volume of Russian GDR issues in 2007: 11 issues. There were no Russian GDR issues in 2009 – the immediate aftermath of the 2007-2008 global financial crisis. The number of new Russian GDRs rebounded to seven in 2011. The analyzed GDRs represent shares of companies from 14 industries (Bank of New York
76 Journal of Applied Business and Economics vol. 16(6) 2014
Mellon, 2013). The best represented industries (with four GDR listings) are Real Estate Investment and Service, Industrial Metals and Mining, and Industrial Transportation. The market values of Russian GDR issues on the first trading day vary from $8.20 million (Sistema, issue year: 2005) to $81.50 billion (Sberbank of Russia, issue year: 2011). 24 Russian companies raised capital with the GDR issues, while seven companies did not raise capital (Bank of New York Mellon, 2013). A list of the considered Russian GDRs is provided in Appendix A.
The performance of Russian GDRs is compared to the performance of five stock markets: (i) a home market - the Russian Federation market; (ii) a host market - the UK market; (iii) a global market indicator - the US market; (iv) peer markets - the Emerging Markets; and (v) peer securities - the Emerging Markets American Depository Receipts. The paper measures stock markets dynamics using the following market indices: Morgan Stanley Capital International (MSCI) index of the Russian stock market, MSCI index of the UK stock market, S&P 500 index, MSCI index of the Emerging Markets, and the Bank of New York Mellon index of the Emerging Markets ADRs. The MSCI Emerging Markets index includes more than 800 securities from 21 markets, which account for about 11 percent of the world equity market capitalization (MSCI, 2014)1. The price levels of the indices were downloaded from the Datastream. REVIEW OF LITERATURE ON THE PERFORMANCE OF DEPOSITORY RECEIPTS
Most of research on the performance of DRs is focused on ADRs. Their findings are mixed. Some researchers find that ADRs outperform host markets while others suggest that ADRs underperform local markets or comparable firms. Several works point at the diversification benefits of ADRs.
Samant and Korth (1998) analyzed the performance of 36 ADRs from the Asia-Pacific region. They found that the systematic risk of the Asia-Pacific ADRs is low relatively to the U.S. and world market indices. Adding the Asia-Pacific ADRs to the U.S. stocks might offer diversification benefits. Callaghan at al. (1999) determined that ADRs have positive market-adjusted returns in both short- and long-run investment periods, and ADRs from emerging markets outperform ADRs from developed countries. Their sample included 66 ADRs listed between1986 and 1993. The authors assumed that one year after the issuance constitutes the long-run. Foester and Karolyi (2000) examined the long-run performance of 333 ADRs traded in 1982-1996. They concluded that the ADRs underperform local comparable firms by 8%-15% over the first three trading years. The authors found that private placement DRs tend to underperform their benchmarks while issues listed on exchanges slightly outperform their benchmarks. The equity offerings from emerging markets with soft accounting rules substantially outperform the benchmarks. Aybar (2002) determined that privatization ADRs issued in 1984-1999 outperform their home country markets but underperform the U.S. market. Another finding of the paper was that privatization ADRs from developed countries do better than the emerging markets privatization ADRs. Shaub (2003) analyzed the investment performance of 179 ADRs traded on the NYSE in 1987-1998. He found that the Initial Public Offering (IPO) ADRs outperform Seasoned Equity Offerings (SEO) in the short run, whereas the IPOs underperform SEOs in the long run (in two and three years after the issuance). The combined sample of ADRs underperformed the S&P 500 index over both short- and long-run periods. The emerging markets ADRs underperformed the S&P 500 index by about 28% during the first three trading years. The developed markets ADRs did relatively better. They underperformed the S&P 500 index by 12%. Boye (2007) compared the performance of Mexican ADRs to the U.S. stock market. His sample included 24 Mexican ADRs listed on the NYSE and the NASDAQ in 1992-2001. The author compared Mexican ADRs to a portfolio of four U.S. stocks from the same industry and close by market capitalization. He found that the volatility of Mexican ADRs is might be higher than for the compared U.S. companies. Only three Mexican ADRs exhibited higher returns. Boye (2007) concluded that returns of Mexican ADRs are low compared to their risks. Elliott and Schaub (2009) also analyzed the performance of Mexican ADRs on the NYSE. Their sample comprises 27 Mexican ADRs listed on NYSE in 1990-2002. The authors estimated that the Mexican ADRs underperform the S&P 500 index by about 21% over the three years following the issuance date. The segmentation of the Mexican ADRs by the issue type revealed that IPOs underperformed the market by about 27%, while SEOs behave similarly
Journal of Applied Business and Economics vol. 16(6) 2014 77
to the U.S. market. The authors highlighted that issue timing impacts the performance of the Mexican ADRs. The issues traded during the bull market (before January 1, 1998) underperformed the S&P 500 index by about 32%, whereas during the bear market (after January 1, 1998) the Mexican ADRs outperformed the S&P 500 index by more than 27%. This countercyclical pattern suggests diversification benefits of Mexican ADRs. Schaub (2010) also pointed at the diversification benefits of the Chinese ADRs. The DRs traded during the bull market (before January 1, 1998) underperformed the S&P 500 index by nearly 26%, while during the bear market (after January 1, 1998) the Chinese ADRs outperformed the S&P 500 index by more than 40%. The sample covered 19 Chinese ADRs listed on the NYSE from January 1, 1990 till December 31, 2002. The combined sample performed similarly to the S&P 500 index. The author reported regional performance variations. The ADRs from Hong Kong underperformed the market, the ADRs from other parts of China outperformed. Schaub (2011) again emphasized the market timing impact on the DR performance. He considered the UK ADRs traded on the NASDAQ in 1990-2002. ADRs traded before 1998 exhibited returns similar to the NASDAQ index, but ADRs traded after January 1, 1998, outperformed the NASDAQ over the three-year period by about 39%. The combined sample outperformed the NASDAQ in the first trading month by 8.81%, at the end of the first three trading years – by about 20%. PERFORMANCE STUDY METHODOLOGY
The paper evaluates the performance of Russian GDRs considering two investment strategies: daily portfolio rebalancing and a buy-and-hold strategy. A comparison of the daily portfolio rebalancing is based on a common stocks and ADRs performance measure - cumulative average daily adjusted returns (Ritter, 1991; Callaghan at al., 1999; Schaub, 2003, 2010, 2011; Elliot and Schaub, 2009). The buy-and-hold strategy is evaluated employing a wealth relative measure following Ritter (1991). He used wealth relatives to analyze the performance of Initial Public Offerings (IPOs).
The two investment strategies are analyzed over both short- and long-term investments periods. The work assumes that the first trading month comprises a short-run period and two first trading years constitute a long-run period. The closing price of the first trading day is counted as the initial price. The paper’s trading start dates are the Datastream base dates for Russian GDRs2. The first month horizon covers 21 trading days after the issuance date, from day 2 to day 22. The two first trading years include 504 (21days*24months) trading days, from day 2 to day 505.
The empirical analysis begins with calculating daily raw returns for Russian GDRs and for five benchmark market indices for the entire two-year period. The daily returns on GDRs and indices are used to derive the daily benchmark-adjusted returns:
𝑥𝑟𝑖𝑚𝑡 = 𝑟𝑖𝑡 − 𝑟𝑖𝑚𝑡 , (1) where 𝑥𝑟𝑖𝑚𝑡 is the benchmark-adjusted return for Depository Receipt (DR) i relatively to the benchmark market index m for day t; 𝑟𝑖𝑡 is the daily raw return for DR i on day t; 𝑟𝑖𝑚𝑡 is the daily return on the market index m on day t of DR i; i = 1, …, 31; m = MSCIRU, MSCIUK, SP500, MSCIEM, BNYEMKT; t = 1, …, 504. MSCIRU denotes the MSCI index of the Russian stock market, MSCIUK is the MSCI index of the UK stock market, SP500 means the S&P 500 index, MSCIEM stands for the MSCI index of the Emerging Markets, and BNYEMKT implies the Bank of New York Mellon index of the Emerging Markets ADRs.
The daily average benchmark-adjusted returns are computed as arithmetic averages of the daily adjusted returns:
𝐴𝑅𝑚𝑡 = ∑ 𝑥𝑟𝑖𝑚𝑡31𝑖=131
, (2)
78 Journal of Applied Business and Economics vol. 16(6) 2014
where 𝐴𝑅𝑚𝑡 is the average benchmark-adjusted return relatively to index m on day t, 𝑥𝑟𝑖𝑚𝑡 is the daily benchmark-adjusted return for Depository Receipt (DR) i relatively to the benchmark market index m on day t, m = MSCIRU, MSCIUK, SP500, MSCIEM, BNYEMKT; t = 1, …, 504.
In order to assess the Russian GDRs performance under the daily portfolio rebalancing strategy, the paper estimates daily cumulative benchmark-adjusted returns:
𝐶𝐴𝑅𝑚𝑡 = ∑ 𝐴𝑅𝑚𝑗𝑡𝑗=1 , (3)
where 𝐶𝐴𝑅𝑚𝑡 is the daily cumulative benchmark-adjusted return relatively to index m on day t; 𝐴𝑅𝑚𝑗 is average benchmark-adjusted return relatively to index m on day j; m = MSCIRU, MSCIUK, SP500, MSCIEM, BNYEMKT; t = 1, …, 504. The positive cumulative adjusted return 𝐶𝐴𝑅𝑚𝑡 indicates that the Russian GDRs outperformed market m over the t-day period assuming the daily portfolio rebalancing. Whereas the negative cumulative adjusted return 𝐶𝐴𝑅𝑚𝑡 means that the Russian GDRs underperformed market m over the t-day period. Detailed interpretation of derived cumulative adjusted returns is provided in the next section.
The buy-and-hold strategy analysis requires calculating the holding period returns on Russian GDRs and on benchmark market indices. The paper calculates the total returns over two investment periods: short-term (first trading month) and long-term (two first trading years):
𝑅𝑖,1𝑚𝑜𝑛𝑡ℎ = (𝑃𝑖,21 − 𝑃𝑖,0)/𝑃𝑖,0, (4) 𝑅𝑖𝑚,1𝑚𝑜𝑛𝑡ℎ = (𝑃𝑖𝑚,21 − 𝑃𝑖𝑚,0)/𝑃𝑖𝑚,0, (5) 𝑅𝑖,2𝑦𝑒𝑎𝑟 = (𝑃𝑖,504 − 𝑃𝑖,0)/𝑃𝑖,0, (6) 𝑅𝑖𝑚,2𝑦𝑒𝑎𝑟 = (𝑃𝑖𝑚,504 − 𝑃𝑖𝑚,0)/𝑃𝑖𝑚,0, (7)
where 𝑅𝑖,1𝑚𝑜𝑛𝑡ℎ is the total return on DR i over the first trading month; 𝑃𝑖,0 is the closing price on the issue day of DR i; 𝑃𝑖,21 is the closing price on the 21st day from the issuance date (the last day of the first trading month) for DR i; 𝑅𝑖𝑚,1𝑚𝑜𝑛𝑡ℎ is the total return for index m over the first trading month of DR i; 𝑃𝑖𝑚,0 is the closing price level for index m on the first trading day of DR i; 𝑃𝑖𝑚,21 is the closing price level for index m on the 21st day from the issuance date for DR i; 𝑅𝑖,2𝑦𝑒𝑎𝑟 is the 2-year total return on DR i; 𝑃𝑖,504 is the closing price on the last day of the 2-year trading period for DR i; 𝑅𝑖𝑚,2𝑦𝑒𝑎𝑟 is the total return for index m over the first two years of trading DR i; 𝑃𝑖𝑚,504 is the closing price level for index m on the last day of the 2-year trading period for DR i; i = 1, …, 31; m = MSCIRU, MSCIUK, SP500, MSCIEM, BNYEMKT.
The average holding period total returns on DRs and indices are computed as arithmetic averages of the individual holding period total returns:
𝑅�1𝑚𝑜𝑛𝑡ℎ = ∑ 𝑅𝑖,1𝑚𝑜𝑛𝑡ℎ31𝑖=1
31 , (8)
𝑅�𝑚,1𝑚𝑜𝑛𝑡ℎ = ∑ 𝑅𝑖𝑚,1𝑚𝑜𝑛𝑡ℎ31𝑖=1
31, (9)
𝑅�2𝑦𝑒𝑎𝑟 = ∑ 𝑅𝑖,2𝑦𝑒𝑎𝑟31𝑖=1
31 , (10)
𝑅�𝑚,2𝑦𝑒𝑎𝑟 = ∑ 𝑅𝑖𝑚,2𝑦𝑒𝑎𝑟31𝑖=1
31, (11)
Journal of Applied Business and Economics vol. 16(6) 2014 79
where 𝑅�1𝑚𝑜𝑛𝑡ℎis the average first month total return on Russian GDRs; 𝑅𝑖,1𝑚𝑜𝑛𝑡ℎ is the first month return for DR i; 𝑅�𝑚,1𝑚𝑜𝑛𝑡ℎis the average first month total return on benchmark index m; 𝑅𝑖𝑚,1𝑚𝑜𝑛𝑡ℎ is the total return for index m over the first trading month of DR i; 𝑅�2𝑦𝑒𝑎𝑟 is the average 2-year total return on Russian GDRs; 𝑅𝑖,2𝑦𝑒𝑎𝑟 is the 2-year total return on DR i; 𝑅�𝑚,2𝑦𝑒𝑎𝑟 is the average 2-year total return on benchmark index m; 𝑅𝑖𝑚,2𝑦𝑒𝑎𝑟 is the total return for index m over the first two years of trading DR i; m = MSCIRU, MSCIUK, SP500, MSCIEM, BNYEMKT.
The performance of Russian GDRs under the buy-and-hold strategy is compared using the wealth relative measures following Ritter (1991):
𝑊𝑅𝑚,1𝑚𝑜𝑛𝑡ℎ = 1+𝑅�1𝑚𝑜𝑛𝑡ℎ1+𝑅�𝑚,1𝑚𝑜𝑛𝑡ℎ
, (12)
𝑊𝑅𝑚,2𝑦𝑒𝑎𝑟 = 1+𝑅�2𝑦𝑒𝑎𝑟
1+𝑅�𝑚,2𝑦𝑒𝑎𝑟 , (13)
where 𝑊𝑅𝑚,1𝑚𝑜𝑛𝑡ℎ is the first trading month wealth relative associated with the benchmark market m, 𝑅�1𝑚𝑜𝑛𝑡ℎ is the average first month total return on Russian GDRs, 𝑅�𝑚,1𝑚𝑜𝑛𝑡ℎ is the average first month total return on benchmark index m, 𝑊𝑅𝑚,2𝑦𝑒𝑎𝑟 is the 2-year wealth relative associated with the benchmark market m, 𝑅�2𝑦𝑒𝑎𝑟 is the average 2-year total return on Russian GDRs, 𝑅�𝑚,2𝑦𝑒𝑎𝑟 is the average 2-year total return on benchmark index m. If the wealth relative 𝑊𝑅𝑚 is more than 1, that implies that the Russian GDRs outperformed market m under the buy-and-hold strategy. While the wealth relative 𝑊𝑅𝑚 below 1 means that the Russian GDRs underperformed market m. PERFORMANCE OF RUSSIAN GDRS
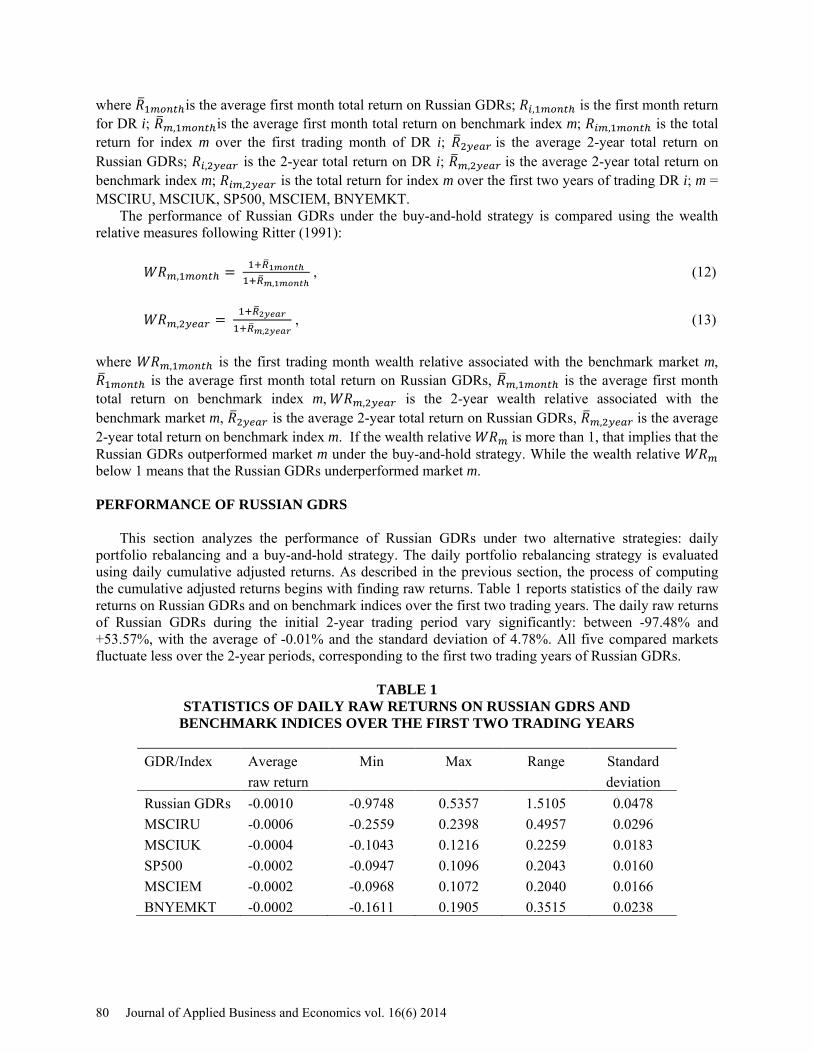
This section analyzes the performance of Russian GDRs under two alternative strategies: daily portfolio rebalancing and a buy-and-hold strategy. The daily portfolio rebalancing strategy is evaluated using daily cumulative adjusted returns. As described in the previous section, the process of computing the cumulative adjusted returns begins with finding raw returns. Table 1 reports statistics of the daily raw returns on Russian GDRs and on benchmark indices over the first two trading years. The daily raw returns of Russian GDRs during the initial 2-year trading period vary significantly: between -97.48% and +53.57%, with the average of -0.01% and the standard deviation of 4.78%. All five compared markets fluctuate less over the 2-year periods, corresponding to the first two trading years of Russian GDRs.
TABLE 1 STATISTICS OF DAILY RAW RETURNS ON RUSSIAN GDRS AND
BENCHMARK INDICES OVER THE FIRST TWO TRADING YEARS
GDR/Index Average Min Max Range Standard raw return
deviation
Russian GDRs -0.0010 -0.9748 0.5357 1.5105 0.0478 MSCIRU -0.0006 -0.2559 0.2398 0.4957 0.0296 MSCIUK -0.0004 -0.1043 0.1216 0.2259 0.0183 SP500 -0.0002 -0.0947 0.1096 0.2043 0.0160 MSCIEM -0.0002 -0.0968 0.1072 0.2040 0.0166 BNYEMKT -0.0002 -0.1611 0.1905 0.3515 0.0238
80 Journal of Applied Business and Economics vol. 16(6) 2014

The markets have narrower ranges of daily returns and lower standard deviations. Two most volatile markets are the Russian stock market and the ADRs from emerging markets. The returns on their indices change in the following ranges: (i) MSCIRU: -25.59% to +23.98%, (ii) BNYEMKT: -16.11% to 19.05%. Other three indices (MSCIUK, SP500, MSCIEM) have close statistics. Their daily returns change from about -10% to about +11%.
Daily raw returns on GDRs and indices are used to find the daily benchmark-adjusted returns (xrimt), see formula (1) in the previous section. The daily average benchmark-adjusted returns (ARt) are computed as arithmetic averages of the daily adjusted returns, following formula (2). The cumulative average adjusted returns (CARt) with respect to five benchmark indices are calculated using formula (3). Tables B.1 - B.10 in Appendix B provide daily average benchmark-adjusted returns, standard deviations, cumulative average adjusted returns, and their t-statistics. Tables B.1 - B.5 show the daily adjusted returns in the first trading month (short-term investment period), while Tables B.6 – B.10 include the daily adjusted returns at the end of months over the first two trading years (the long-term investment period).
In order to assess the performance of Russian GDRs in the short-run, we examine the first month adjusted returns. Daily average adjusted returns do not differ much across indices. They vary between 0.07% and 1.3%, see Table 2. The lowest average return was for the SP500-adjusted values: -1.17%. The highest average return was for the MSCIUK-adjusted values: 1.52%. The first month cumulative adjusted returns are positive, with an exception of the marginally negative MSCIRU- and SP500- adjusted returns on Day 16 (-0.01% and -0.03%, respectively), see Figure 1 and Table 2. The magnitudes of the cumulative adjusted returns are small: between -0.03% and 2.97%. At the end of the first trading month, the cumulative adjusted returns with respect to all five markets vary between 1.53% and 2.81%.
TABLE 2 STATISTICS OF DAILY ADJUSTED RETURNS IN THE FIRST TRADING MONTH
Index Daily average adjusted return Cumulative adjusted return
Average Min Max Average Min Max On day 21
MSCIRU 0.0007 -0.0061 0.0150 0.0137 -0.0001 0.0211 0.0153 MSCIUK 0.0013 -0.0093 0.0152 0.0173 0.0061 0.0297 0.0281 SP500 0.0009 -0.0117 0.0150 0.0132 -0.0003 0.0214 0.0183 MSCIEM 0.0010 -0.0076 0.0126 0.0163 0.0042 0.0253 0.0216 BNYEMKT 0.0009 -0.0096 0.0133 0.0144 0.0014 0.0241 0.0194
The standard deviations of daily adjusted returns in Tables B.1 – B.5 are large comparing to the daily
average adjusted returns. Only a few t-statistics have absolute values above 1.697 (the critical value at the 10% significance level for the degree of freedom of 30), what means that daily average adjusted returns and cumulative adjusted returns are statistically insignificant in the first month3. Hence, the short-term investment performance of Russian GDRs does not differ statistically from the market’s performance assuming the daily portfolio rebalancing.
Figure 2 illustrates the 2-year period cumulative adjusted returns relatively to five markets. The cumulative adjusted returns are positive in initial trading months, become negative, and exhibit a declining trend in later months, suggesting that the Russian GDRs underperform the considered markets in the long-run. The cumulative adjusted returns relatively to the MSCIRU index are insignificant as their t-statistics have absolute values below 1.697, see Table B.6. Although the MSCIRU-adjusted cumulative returns become negative from the 98th trading day, we cannot claim the Russian GDRs underperform the Russian stock market. The t-statistics of cumulative adjusted returns with respect to the MSCIUK, SP500, MSCIEM, and BNYEMKT indices in Tables B.7 – B.10 have absolute values above 1.697 in later months of the 2-year period, what means that daily cumulative adjusted returns are statistically significant. Hence, we can say that the Russian GDRs underperform the UK, US, Emerging stock markets
Journal of Applied Business and Economics vol. 16(6) 2014 81

FIGURE 1 CUMULATIVE ADJUSTED RETURNS OVER THE FIRST TRADING MONTH
FIGURE 2 CUMULATIVE ADJUSTED RETURNS OVER THE FIRST TWO TRADING YEARS
82 Journal of Applied Business and Economics vol. 16(6) 2014
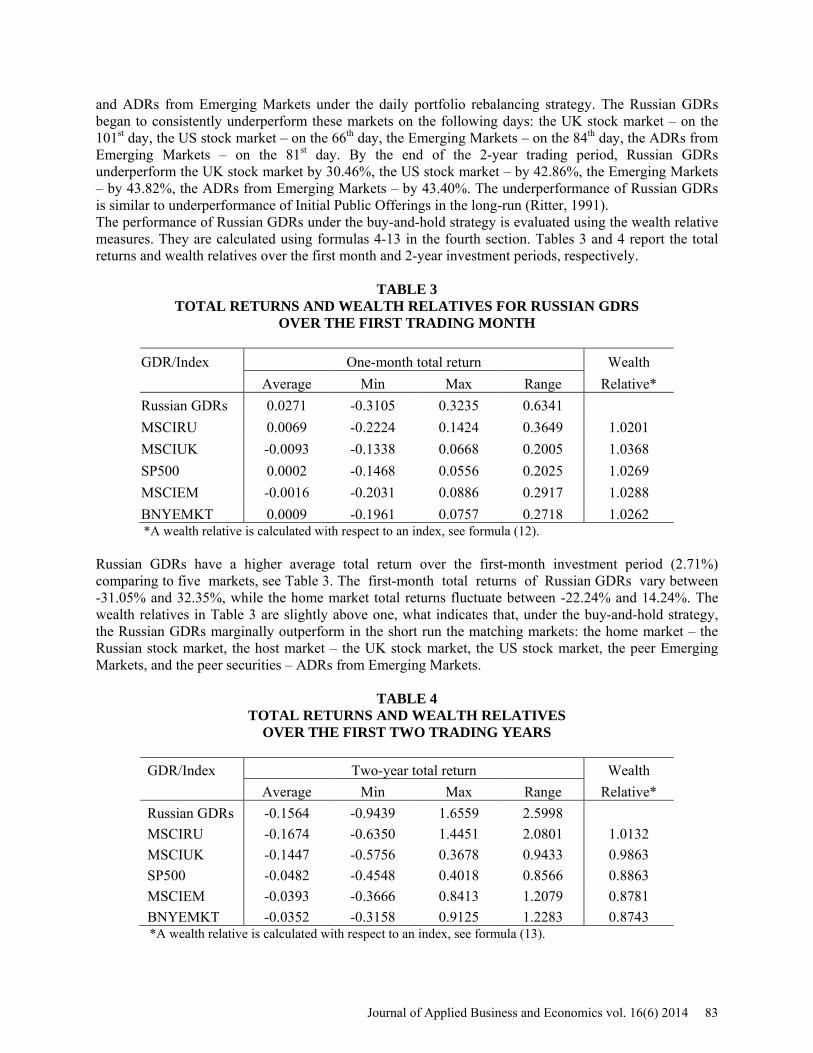
and ADRs from Emerging Markets under the daily portfolio rebalancing strategy. The Russian GDRs began to consistently underperform these markets on the following days: the UK stock market – on the 101st day, the US stock market – on the 66th day, the Emerging Markets – on the 84th day, the ADRs from Emerging Markets – on the 81st day. By the end of the 2-year trading period, Russian GDRs underperform the UK stock market by 30.46%, the US stock market – by 42.86%, the Emerging Markets – by 43.82%, the ADRs from Emerging Markets – by 43.40%. The underperformance of Russian GDRs is similar to underperformance of Initial Public Offerings in the long-run (Ritter, 1991). The performance of Russian GDRs under the buy-and-hold strategy is evaluated using the wealth relative measures. They are calculated using formulas 4-13 in the fourth section. Tables 3 and 4 report the total returns and wealth relatives over the first month and 2-year investment periods, respectively.
TABLE 3 TOTAL RETURNS AND WEALTH RELATIVES FOR RUSSIAN GDRS
OVER THE FIRST TRADING MONTH
GDR/Index One-month total return Wealth Average Min Max Range Relative* Russian GDRs 0.0271 -0.3105 0.3235 0.6341
MSCIRU 0.0069 -0.2224 0.1424 0.3649 1.0201 MSCIUK -0.0093 -0.1338 0.0668 0.2005 1.0368 SP500 0.0002 -0.1468 0.0556 0.2025 1.0269 MSCIEM -0.0016 -0.2031 0.0886 0.2917 1.0288 BNYEMKT 0.0009 -0.1961 0.0757 0.2718 1.0262 *A wealth relative is calculated with respect to an index, see formula (12).
Russian GDRs have a higher average total return over the first-month investment period (2.71%) comparing to five markets, see Table 3. The first-month total returns of Russian GDRs vary between -31.05% and 32.35%, while the home market total returns fluctuate between -22.24% and 14.24%. The wealth relatives in Table 3 are slightly above one, what indicates that, under the buy-and-hold strategy, the Russian GDRs marginally outperform in the short run the matching markets: the home market – the Russian stock market, the host market – the UK stock market, the US stock market, the peer Emerging Markets, and the peer securities – ADRs from Emerging Markets.
TABLE 4 TOTAL RETURNS AND WEALTH RELATIVES
OVER THE FIRST TWO TRADING YEARS
GDR/Index Two-year total return Wealth Average Min Max Range Relative* Russian GDRs -0.1564 -0.9439 1.6559 2.5998
MSCIRU -0.1674 -0.6350 1.4451 2.0801 1.0132 MSCIUK -0.1447 -0.5756 0.3678 0.9433 0.9863 SP500 -0.0482 -0.4548 0.4018 0.8566 0.8863 MSCIEM -0.0393 -0.3666 0.8413 1.2079 0.8781 BNYEMKT -0.0352 -0.3158 0.9125 1.2283 0.8743 *A wealth relative is calculated with respect to an index, see formula (13).
Journal of Applied Business and Economics vol. 16(6) 2014 83

The 2-year total returns of Russian GDRs change between -94.39% and 165.59%, with the average of -15.64%, see Table 4. The home market total returns fluctuate between -63.50% and 144.51%. The wealth relative with respect to the Russian stock market in Table 4 is marginally above one. Thus, the Russian GDRs outperform to some extent the home market in the long run under the buy-and-hold strategy. The wealth relatives with respect to other four markets in Table 4 are below one, indicating that, in the long-run, Russian GDRs underperform the UK stock market, the US stock market, the Emerging Markets, and the Emerging Markets ADRs. The underperformance relatively to the UK stock market is marginal. The wealth relative is the lowest with respect to the Bank of New York Mellon index of the Emerging Markets ADRs. Thus, the Russian GDRs performed the worst with respect to the peer securities. VARIATIONS IN THE PERFORMANCE OF RUSSIAN GDRS
High standard deviations and wide ranges of the Russian GDRs returns suggest that the performance across them varies significantly. This hypothesis is supported by Fedorov and Sarkissian’s (2000) observations of the substantial cross-industry and market capitalization variations in the Russian stock market. Goriaev and Zabotkin (2006) state a significant part of the cross-sectional variance in the Russian stocks returns is explained by the variance in returns between industries. This section analyzes how the investment returns of the GDRs are associated with industries, raising capital, and issue timing (in 2007-2008, before 2007 and after 2008). The analysis is based on a comparison of wealth relative measures with respect to three markets: the Russian stock market (represented by the MSCIRU index), the UK stock markets (represented by the MSCIUK index), and the Bank of New York Mellon index of ADRs from the Emerging Markets (BNYEMKT).
The Russian GDRs listed on the London Stock Exchange are from 14 industries. The best represented industries (with four GDR listings) are Real Estate Investment and Service, Industrial Metals and Mining, and Industrial Transportation. The analysis focuses on industries with at least two GDRs traded for at least two years. Nine industries meet these conditions. Table 5 shows the first month total returns for Russian GDRs by industries and the indices returns corresponding to GDRs trading times. The Food & Drug Retailers GDRs have the highest first month average total return of 16.72%, followed by the Industrial Transportation GDRs with the average of 14.97%. The Chemicals and Electricity GDRs have lowest average returns: -11.43% and -10.44%, respectively. Note that the markets returns are also low during the Chemicals trading times, MSCIRU: -10.23%, MSCIUK: -9.73, BNYEMKT: -11.90%.
TABLE 5 INDUSTRIES FIRST MONTH TOTAL RETURNS
Industry Number of First month average total returns
GDRs GDRs MSCIRU MSCIUK BNYEMKT
Chemicals 3 -0.1143 -0.1023 -0.0973 -0.1199 Real Estate Investment & Service 4 -0.0167 0.0095 0.0068 0.0263 Industrial Metals & Mining 4 0.0576 0.0377 0.0180 0.0630 Food Producers 2 -0.0039 -0.1494 -0.0490 -0.1253 Food & Drug Retailers 3 0.1672 0.0376 -0.0143 0.0258 Oil & Gas Producers 2 0.0346 0.0834 -0.0014 0.0106 Electricity 2 -0.1044 -0.0122 0.0225 0.0064 Industrial Transportation 4 0.1497 0.0759 -0.0004 0.0052 Banks 3 -0.0077 -0.0297 -0.0127 -0.0047
84 Journal of Applied Business and Economics vol. 16(6) 2014
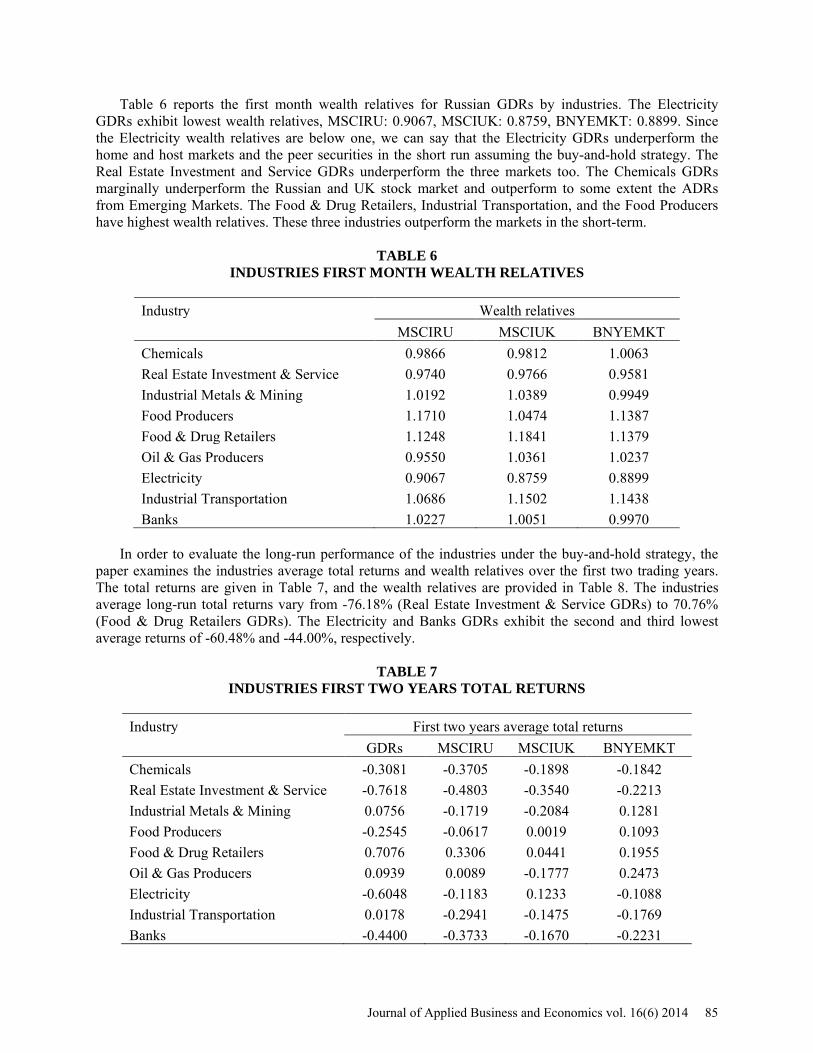
Table 6 reports the first month wealth relatives for Russian GDRs by industries. The Electricity GDRs exhibit lowest wealth relatives, MSCIRU: 0.9067, MSCIUK: 0.8759, BNYEMKT: 0.8899. Since the Electricity wealth relatives are below one, we can say that the Electricity GDRs underperform the home and host markets and the peer securities in the short run assuming the buy-and-hold strategy. The Real Estate Investment and Service GDRs underperform the three markets too. The Chemicals GDRs marginally underperform the Russian and UK stock market and outperform to some extent the ADRs from Emerging Markets. The Food & Drug Retailers, Industrial Transportation, and the Food Producers have highest wealth relatives. These three industries outperform the markets in the short-term.
TABLE 6 INDUSTRIES FIRST MONTH WEALTH RELATIVES
Industry Wealth relatives
MSCIRU MSCIUK BNYEMKT
Chemicals 0.9866 0.9812 1.0063 Real Estate Investment & Service 0.9740 0.9766 0.9581 Industrial Metals & Mining 1.0192 1.0389 0.9949 Food Producers 1.1710 1.0474 1.1387 Food & Drug Retailers 1.1248 1.1841 1.1379 Oil & Gas Producers 0.9550 1.0361 1.0237 Electricity 0.9067 0.8759 0.8899 Industrial Transportation 1.0686 1.1502 1.1438 Banks 1.0227 1.0051 0.9970
In order to evaluate the long-run performance of the industries under the buy-and-hold strategy, the
paper examines the industries average total returns and wealth relatives over the first two trading years. The total returns are given in Table 7, and the wealth relatives are provided in Table 8. The industries average long-run total returns vary from -76.18% (Real Estate Investment & Service GDRs) to 70.76% (Food & Drug Retailers GDRs). The Electricity and Banks GDRs exhibit the second and third lowest average returns of -60.48% and -44.00%, respectively.
TABLE 7 INDUSTRIES FIRST TWO YEARS TOTAL RETURNS
Industry First two years average total returns
GDRs MSCIRU MSCIUK BNYEMKT
Chemicals -0.3081 -0.3705 -0.1898 -0.1842 Real Estate Investment & Service -0.7618 -0.4803 -0.3540 -0.2213 Industrial Metals & Mining 0.0756 -0.1719 -0.2084 0.1281 Food Producers -0.2545 -0.0617 0.0019 0.1093 Food & Drug Retailers 0.7076 0.3306 0.0441 0.1955 Oil & Gas Producers 0.0939 0.0089 -0.1777 0.2473 Electricity -0.6048 -0.1183 0.1233 -0.1088 Industrial Transportation 0.0178 -0.2941 -0.1475 -0.1769 Banks -0.4400 -0.3733 -0.1670 -0.2231
Journal of Applied Business and Economics vol. 16(6) 2014 85
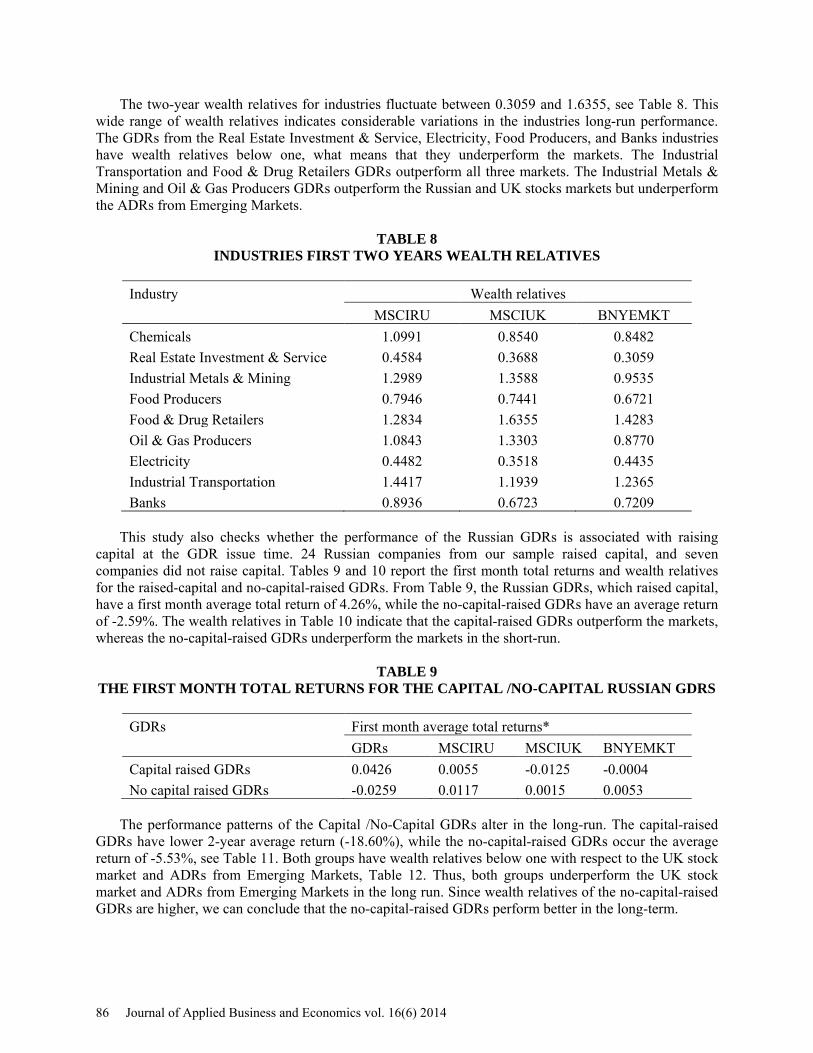
The two-year wealth relatives for industries fluctuate between 0.3059 and 1.6355, see Table 8. This wide range of wealth relatives indicates considerable variations in the industries long-run performance. The GDRs from the Real Estate Investment & Service, Electricity, Food Producers, and Banks industries have wealth relatives below one, what means that they underperform the markets. The Industrial Transportation and Food & Drug Retailers GDRs outperform all three markets. The Industrial Metals & Mining and Oil & Gas Producers GDRs outperform the Russian and UK stocks markets but underperform the ADRs from Emerging Markets.
TABLE 8 INDUSTRIES FIRST TWO YEARS WEALTH RELATIVES
Industry Wealth relatives
MSCIRU MSCIUK BNYEMKT
Chemicals 1.0991 0.8540 0.8482 Real Estate Investment & Service 0.4584 0.3688 0.3059 Industrial Metals & Mining 1.2989 1.3588 0.9535 Food Producers 0.7946 0.7441 0.6721 Food & Drug Retailers 1.2834 1.6355 1.4283 Oil & Gas Producers 1.0843 1.3303 0.8770 Electricity 0.4482 0.3518 0.4435 Industrial Transportation 1.4417 1.1939 1.2365 Banks 0.8936 0.6723 0.7209
This study also checks whether the performance of the Russian GDRs is associated with raising
capital at the GDR issue time. 24 Russian companies from our sample raised capital, and seven companies did not raise capital. Tables 9 and 10 report the first month total returns and wealth relatives for the raised-capital and no-capital-raised GDRs. From Table 9, the Russian GDRs, which raised capital, have a first month average total return of 4.26%, while the no-capital-raised GDRs have an average return of -2.59%. The wealth relatives in Table 10 indicate that the capital-raised GDRs outperform the markets, whereas the no-capital-raised GDRs underperform the markets in the short-run.
TABLE 9 THE FIRST MONTH TOTAL RETURNS FOR THE CAPITAL /NO-CAPITAL RUSSIAN GDRS
GDRs First month average total returns*
GDRs MSCIRU MSCIUK BNYEMKT
Capital raised GDRs 0.0426 0.0055 -0.0125 -0.0004 No capital raised GDRs -0.0259 0.0117 0.0015 0.0053
The performance patterns of the Capital /No-Capital GDRs alter in the long-run. The capital-raised
GDRs have lower 2-year average return (-18.60%), while the no-capital-raised GDRs occur the average return of -5.53%, see Table 11. Both groups have wealth relatives below one with respect to the UK stock market and ADRs from Emerging Markets, Table 12. Thus, both groups underperform the UK stock market and ADRs from Emerging Markets in the long run. Since wealth relatives of the no-capital-raised GDRs are higher, we can conclude that the no-capital-raised GDRs perform better in the long-term.
86 Journal of Applied Business and Economics vol. 16(6) 2014

TABLE 10 THE FIRST MONTH WEALTH RELATIVES FOR
THE CAPITAL /NO-CAPITAL RUSSIAN GDRS
GDRs The first month wealth relatives
MSCIRU MSCIUK BNYEMKT
Capital raised GDRs 1.0369 1.0558 1.0430 No capital raised GDRs 0.9628 0.9726 0.9690
TABLE 11
THE FIRST TWO YEARS TOTAL RETURNS FOR THE CAPITAL /NO-CAPITAL RUSSIAN GDRS
GDRs First two years average total returns*
GDRs MSCIRU MSCIUK BNYEMKT
Capital raised GDRs -0.1860 -0.1763 -0.1709 -0.0470 No capital raised GDRs -0.0553 -0.1370 -0.0550 0.0055 * Indices returns correspond to GDRs trading times
TABLE 12
THE FIRST TWO YEARS WEALTH RELATIVES FOR THE CAPITAL /NO-CAPITAL RUSSIAN GDRS
GDRs Wealth relatives
MSCIRU MSCIUK BNYEMKT
Capital raised GDRs 0.9883 0.9819 0.8542 No capital raised GDRs 1.0947 0.9997 0.9395
The paper analyzed whether the performance of the Russian GDRs is affected by issue timing. The
analysis considered two time periods: (i) 2007-2008 (the financial CRISIS period), (ii) 2005-2006 and 2008-2011 (the NO-CRISIS period). 14 Russian companies from our sample issued DRs during the first period and remaining 17 companies – during the second period. Tables 13 and 14 show the first month and two years wealth relatives for the CRISIS and no-CRISIS issues. The wealth relatives in Table 13 are above one, what suggests that both groups of DRs outperform the markets in the short run. Though, wealth relatives of the NO-CRISIS issues are slightly higher than wealth relatives of the CRISIS issues. It appears that, in the short-term, the NO-CRISIS issues perform better to some extent than the CRISIS issues.
TABLE 13 THE FIRST MONTH WEALTH RELATIVES FOR
THE CRISIS/NO-CRISIS RUSSIAN GDRS
GDRs The first month wealth relatives
MSCIRU MSCIUK BNYEMKT
Issued in 2007 and 2008 (CRISIS) 1.0101 1.0304 1.0130 Issued before 2007 or after 2008 (NO-CRISIS) 1.0283 1.0420 1.0371
Journal of Applied Business and Economics vol. 16(6) 2014 87

The performance patterns of the CRISIS/NO-CRISIS GDRs are not consistent across markets in the long-run. The wealth relatives in Table 14 indicate that the CRISIS Russian GDRs outperform the Russian stock market in the long-run, whereas the NO-CRISIS GDRs underperform. In contrast, the CRISIS Russian GDRs underperform the UK stock market in the long-term, and the NO-CRISIS GDRs outperform. Both groups of Russian GDR issues underperform ADRs from Emerging Markets. Notice that the NO-CRISIS Russian GDRs perform better than the CRISIS GDRs when compared to the UK stock market and ADRs from Emerging Markets.
TABLE 14 THE FIRST TWO YEARS WEALTH RELATIVES FOR
THE CRISIS/NO-CRISIS RUSSIAN GDRS
GDRs Wealth relatives
MSCIRU MSCIUK BNYEMKT
Issued in 2007 and 2008 (CRISIS) 1.1060 0.9299 0.7587 Issued before 2007 or after 2008 (NO-CRISIS) 0.9752 1.0149 0.9408
CONCLUSIONS
This paper analyzes the performance of Russian Global Depository Receipts (GDRs) listed on the London Stock Exchange between 2005 and 2011. The performance is evaluated assuming two alternative investment strategies: daily portfolio rebalancing and buy-and-hold. Assuming the daily portfolio rebalancing: (i) the short-term investment performance of Russian GDRs does not differ statistically from the market’s performance; (ii) the Russian GDRs underperform the UK, US, Emerging stock markets and ADRs from Emerging Markets in the long-term. Under the buy-and-hold strategy, Russian GDRs marginally outperform in the short-run and underperform in the long run four equity markets: the UK market, the US market, the Emerging Markets, and the Emerging Markets ADRs. These results resemble the performance of Initial Public Offerings. Russian GDRs outperform to some extent the Russian stock market over the first two trading years.
The performance of Russian GDRs varies across industries, depends on raising capital, and is affected by issue timing. The Electricity and the Real Estate Investment & Service GDRs underperform the home and host markets and the peer securities over both short- and long- term investment horizons. In contrast, the Food & Drug Retailers and Industrial Transportation GDRs outperform the markets in both short- and long-runs. The capital-raised GDRs outperform the markets, whereas the no-capital-raised GDRs underperform the markets in the short-run. The no-capital-raised GDRs perform better in the long-term. Both CRISIS and NO-CRISIS issues of Russian GDRs outperform the markets in the short run. Interestingly, the CRISIS GDRs outperform and the NO-CRISIS GDRs underperform the Russian stock market in the long-run. The CRISIS Russian GDRs underperform the UK stock market in the long-term, and the NO-CRISIS GDRs outperform. Russian GDR issues underperform ADRs from Emerging Markets in the long run. ENDNOTES
1. The Russian stock market is included in the MSCI Emerging Markets index. 2. The Bank of New York Mellon effective dates for Russian GDRs are a few days off the Datastream base
dates. 3. The low levels of t-statistics are explained by a small sample size (31 GDRs) and by large volatility of
returns across Russian GDRs.
88 Journal of Applied Business and Economics vol. 16(6) 2014
REFERENCES Aybar, C. B. (2002). The long-term performance of privatization-related ADR issues. Emerging Markets
Review, 3, 135-164. Boye, F. (2007). Mexican ADRs in the 90s: As good as expected? Revista de Analisis Economico, 22, (1),
June, 93-120. Bank of New York Mellon, 2013. The complete DR directory.
http://www.adrbnymellon.com/dr_directory.jsp. Accessed on December 5, 2013. Callaghan, J. H., Kleiman, R.T. & Sahu, A.P. (1999). The market-adjusted investment performance of
ADR IPOs and SEOs. Global Finance Journal, 10, (2), 123-145. Elliott, R. S. & Schaub, M. (2009). Market timing and issue type effects on the performance of Mexican
American Depository Receipts listed on the New York Stock Exchange. Journal of Derivatives & Hedge Funds, 15, (3), 206-214.
Fedorov, P. & Sarkissian, S. (2000). Cross-sectional variations in the degree of global integration: The case of Russian equities. Journal of International Financial Markets, Institutions and Money, 10, 131-150.
Foester, S. R. & Karolyi, G.A. (2000). The long-run performance of global equity offerings. Journal of Financial and Quantitative Analysis, 35, (4), 499-528.
Goriaev, A. & Zabotkin, A. (2006). Risks of investing in the Russian stock market: Lessons of the first decade. Emerging Markets Review, 7, 380-397.
Jithendranathan, T. (2005). An empirical study of pricing and trading volume of Russian Depository Receipts. Working paper.
Korczak, P. & Bohl, M. T. (2005). Empirical evidence on cross-listed stocks of Central and Eastern European companies. Emerging Markets Review, 6, 121-137.
London Stock Exchange. (2014). Factsheet. International Order Book. http://www.londonstockexchange.com/products-and-services/trading-services/international-order-book/iob-factsheet.pdf. Accessed on March 9, 2014.
Morgan Stanley Capital International. (2014). MSCI Emerging Markets Indices. http://www.msci.com/products/indices/country_and_regional/em/. Accessed on February 1, 2014.
Ritter, J. R. (1991). The long-run performance of Initial Public Offerings. The Journal of Finance, XLVI, (1), March, 3-27.
Schaub, M. (2003). Investment performance of American Depository Receipts listed on the New York Stock Exchange: Long and short. Journal of Business & Economic Studies, 9, (2), 1-19.
Schaub, M. (2010). A note on the performance of Chinese American Depository Receipts. Applied Economics Letters, 17, 431-435.
Schaub, M. (2011). The performance of NASDAQ-listed UK ADRs: A note. Applied Economics Letters, 8, 1735-1738.
Smirnova, E. (2004). Impact of cross-listing on local stock returns: Case of Russian ADRs. William Davidson Institute Working Paper, 691, May.
Smirnova, E. (2008). Depository receipts and firm value: Evidence from Central Europe and Russia. Emerging Markets Review, 9, 266-279.
Thompson Reuters Datastream. (2013). Exploring equities. Russian Global Depository Receipts traded in London. http://thomsonreuters.com/datastream-professional/. Downloaded on December 21, 2013.
World Bank. (2014). Databank. Market capitalization of listed companies. http://data.worldbank.org/indicator/CM.MKT.LCAP.CD?order=wbapi_data_value_2012+wbapi_data_value+wbapi_data_value-last&sort=desc. Accessed on March 9, 2014.
Wojcik, D. & Burger C. (2010). Listing BRICs: Stock issuers from Brazil, Russia, India, and China in New York, London, and Luxembourg. Economic Geography, 86, (3), 275-296.
Journal of Applied Business and Economics vol. 16(6) 2014 89

APPENDIX A. RUSSIAN GLOBAL DEPOSITORY RECEIPTS TRADED ON THE LONDON STOCK EXCHANGE
Russian GDR, Regular Shares Symbol Industry Acron AKRN Chemicals AFI Development AFID Real Estate Investment & Service Cherkizovo CHE Food Producers Etalon ETLN Real Estate Investment & Service Eurasia Drilling Company EDCL Oil & Gas Producers Federal Grid Company FEES Electricity Global Ports GLPR Industrial Transportation GlobalTrans Investment GLTR Industrial Transportation Hals-Development HALS Real Estate Investment & Service Hydraulic Machines & Systems HMSG Industrial Engineering JSC Russian Grids MRSK Electricity JSC Transcontainer TRCN Industrial Transportation LSR Group LSRG Construction & Materials Magnitogorsk Iron & Steel Works MMK Industrial Metals & Mining Neftynaya Companiya-Rosneft ROSN Oil & Gas Producers Nomos Bank NMOS Banks Novolipetsk Steel NLMK Industrial Metals & Mining Novorossiysk NCSP Industrial Transportation O'Key Group OKEY Food & Drug Retailers OJSC Magnit MGNT Food & Drug Retailers Pharmstandard PHST Pharmacy & Biotechnology PhosAgro PHOR Chemicals PIK Group PIK Real Estate Investment & Service Ros Agro AGRO Food Producers Sberbank of Russia SBER Banks Severstal SVST Industrial Metals & Mining Sistema SSA Mobile Telecom. TMK TMKS Industrial Metals & Mining Uralkali URKA Chemicals VTB Bank VTBR Banks X5 Retail Group FIVE Food & Drug Retailers
Source: Bank of New York Mellon. The complete DR directory
90 Journal of Applied Business and Economics vol. 16(6) 2014

APPENDIX B. ADJUSTED RETURNS FOR RUSSIAN GDRS
TABLE B.1 ADJUSTED RETURNS FOR RUSSIAN GDRS RELATIVELY TO THE MSCI INDEX OF THE RUSSIAN STOCK MARKET (MSCIRU) IN THE FIRST TRADING MONTH
Sample Average Standard t-stat Cumulative t-stat
trading day adjusted deviation
adjusted
return of adjusted
return
(t) ARt returns
CARt 1 0.0073 0.0499 0.8171 0.0073 0.9055
2 0.0053 0.0194 1.5281 0.0126 1.1061 3 0.0067 0.0245 1.5123 0.0193 1.3792 4 0.0015 0.0170 0.4871 0.0208 1.2867 5 -0.0019 0.0174 -0.6022 0.0189 1.0469 6 0.0013 0.0205 0.3610 0.0203 1.0230 7 -0.0061 0.0403 -0.8425 0.0142 0.6618 8 0.0031 0.0187 0.9075 0.0172 0.7526 9 0.0014 0.0272 0.2959 0.0186 0.7691 10 -0.0002 0.0233 -0.0379 0.0185 0.7235 11 0.0026 0.0213 0.6718 0.0211 0.7858 12 -0.0054 0.0180 -1.6863 0.0156 0.5579 13 -0.0035 0.0176 -1.1011 0.0121 0.4168 14 -0.0020 0.0167 -0.6822 0.0101 0.3341 15 -0.0060 0.0269 -1.2396 0.0041 0.1317 16 -0.0042 0.0190 -1.2382 -0.0001 -0.0035 17 0.0084 0.0362 1.2946 0.0083 0.2491 18 0.0010 0.0176 0.3160 0.0093 0.2712 19 -0.0043 0.0186 -1.3005 0.0050 0.1408 20 0.0150 0.0334 2.5063 0.0200 0.5536 21 -0.0047 0.0414 -0.6333 0.0153 0.4131
Journal of Applied Business and Economics vol. 16(6) 2014 91

TABLE B.2 ADJUSTED RETURNS FOR RUSSIAN GDRS RELATIVELY TO THE MSCI INDEX
OF THE UK STOCK MARKET (MSCIUK) IN THE FIRST TRADING MONTH
Sample Average Standard t-stat Cumulative t-stat trading day adjusted deviation
adjusted
return of adjusted
return (t) ARt returns
CARt
1 0.0118 0.0505 1.3037 0.0118 1.4556 2 0.0005 0.0243 0.1115 0.0123 1.0716 3 0.0049 0.0269 1.0143 0.0172 1.2237 4 0.0047 0.0176 1.4990 0.0220 1.3519 5 -0.0016 0.0184 -0.4774 0.0204 1.1222 6 0.0027 0.0205 0.7401 0.0231 1.1612 7 -0.0093 0.0421 -1.2290 0.0138 0.6428 8 -0.0010 0.0215 -0.2463 0.0129 0.5599 9 0.0021 0.0207 0.5686 0.0150 0.6145
10 0.0039 0.0233 0.9351 0.0189 0.7355 11 0.0049 0.0230 1.1861 0.0238 0.8829 12 -0.0041 0.0192 -1.1915 0.0197 0.6993 13 -0.0054 0.0187 -1.5997 0.0143 0.4884 14 -0.0022 0.0133 -0.9076 0.0121 0.3996 15 -0.0054 0.0298 -1.0073 0.0067 0.2144 16 -0.0007 0.0199 -0.1934 0.0061 0.1864 17 0.0132 0.0319 2.3104 0.0193 0.5754 18 0.0022 0.0175 0.6986 0.0215 0.6229 19 -0.0069 0.0185 -2.0858 0.0145 0.4103 20 0.0152 0.0371 2.2773 0.0297 0.8178 21 -0.0016 0.0419 -0.2079 0.0281 0.7560
92 Journal of Applied Business and Economics vol. 16(6) 2014
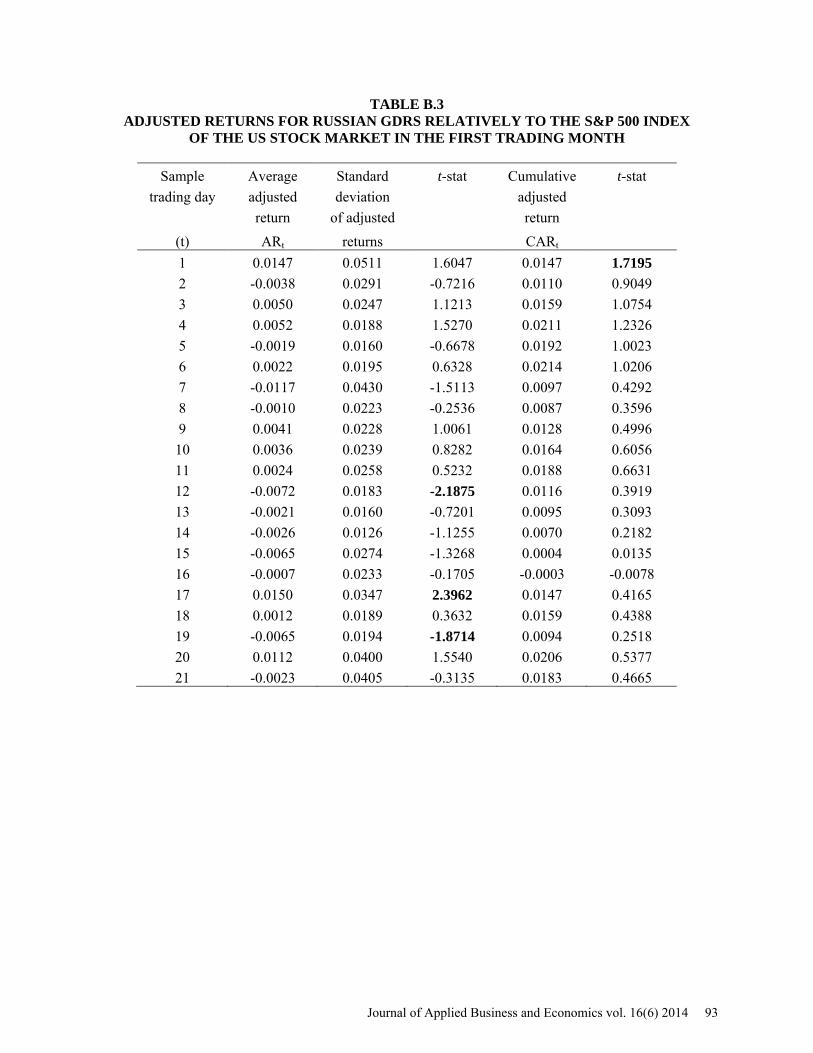
TABLE B.3 ADJUSTED RETURNS FOR RUSSIAN GDRS RELATIVELY TO THE S&P 500 INDEX
OF THE US STOCK MARKET IN THE FIRST TRADING MONTH
Sample Average Standard t-stat Cumulative t-stat trading day adjusted deviation
adjusted
return of adjusted
return (t) ARt returns
CARt
1 0.0147 0.0511 1.6047 0.0147 1.7195 2 -0.0038 0.0291 -0.7216 0.0110 0.9049 3 0.0050 0.0247 1.1213 0.0159 1.0754 4 0.0052 0.0188 1.5270 0.0211 1.2326 5 -0.0019 0.0160 -0.6678 0.0192 1.0023 6 0.0022 0.0195 0.6328 0.0214 1.0206 7 -0.0117 0.0430 -1.5113 0.0097 0.4292 8 -0.0010 0.0223 -0.2536 0.0087 0.3596 9 0.0041 0.0228 1.0061 0.0128 0.4996 10 0.0036 0.0239 0.8282 0.0164 0.6056 11 0.0024 0.0258 0.5232 0.0188 0.6631 12 -0.0072 0.0183 -2.1875 0.0116 0.3919 13 -0.0021 0.0160 -0.7201 0.0095 0.3093 14 -0.0026 0.0126 -1.1255 0.0070 0.2182 15 -0.0065 0.0274 -1.3268 0.0004 0.0135 16 -0.0007 0.0233 -0.1705 -0.0003 -0.0078 17 0.0150 0.0347 2.3962 0.0147 0.4165 18 0.0012 0.0189 0.3632 0.0159 0.4388 19 -0.0065 0.0194 -1.8714 0.0094 0.2518 20 0.0112 0.0400 1.5540 0.0206 0.5377 21 -0.0023 0.0405 -0.3135 0.0183 0.4665
Journal of Applied Business and Economics vol. 16(6) 2014 93
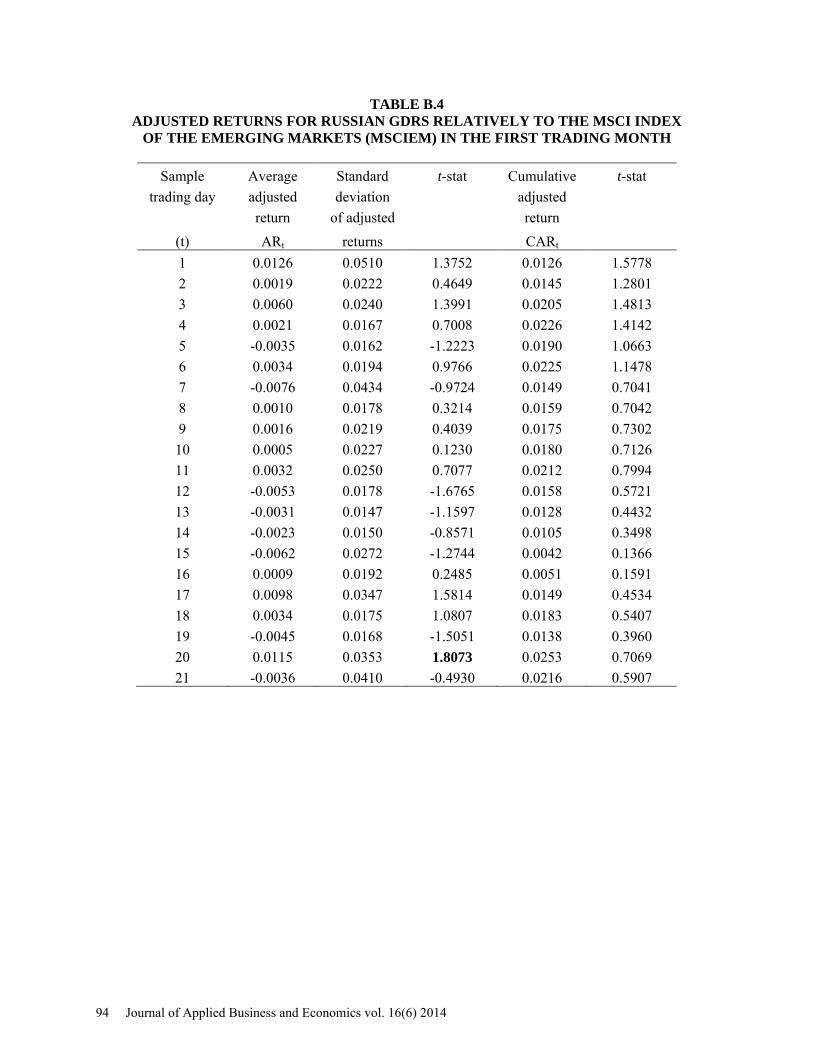
TABLE B.4 ADJUSTED RETURNS FOR RUSSIAN GDRS RELATIVELY TO THE MSCI INDEX
OF THE EMERGING MARKETS (MSCIEM) IN THE FIRST TRADING MONTH
Sample Average Standard t-stat Cumulative t-stat trading day adjusted deviation
adjusted
return of adjusted
return (t) ARt returns
CARt
1 0.0126 0.0510 1.3752 0.0126 1.5778 2 0.0019 0.0222 0.4649 0.0145 1.2801 3 0.0060 0.0240 1.3991 0.0205 1.4813 4 0.0021 0.0167 0.7008 0.0226 1.4142 5 -0.0035 0.0162 -1.2223 0.0190 1.0663 6 0.0034 0.0194 0.9766 0.0225 1.1478 7 -0.0076 0.0434 -0.9724 0.0149 0.7041 8 0.0010 0.0178 0.3214 0.0159 0.7042 9 0.0016 0.0219 0.4039 0.0175 0.7302 10 0.0005 0.0227 0.1230 0.0180 0.7126 11 0.0032 0.0250 0.7077 0.0212 0.7994 12 -0.0053 0.0178 -1.6765 0.0158 0.5721 13 -0.0031 0.0147 -1.1597 0.0128 0.4432 14 -0.0023 0.0150 -0.8571 0.0105 0.3498 15 -0.0062 0.0272 -1.2744 0.0042 0.1366 16 0.0009 0.0192 0.2485 0.0051 0.1591 17 0.0098 0.0347 1.5814 0.0149 0.4534 18 0.0034 0.0175 1.0807 0.0183 0.5407 19 -0.0045 0.0168 -1.5051 0.0138 0.3960 20 0.0115 0.0353 1.8073 0.0253 0.7069 21 -0.0036 0.0410 -0.4930 0.0216 0.5907
94 Journal of Applied Business and Economics vol. 16(6) 2014
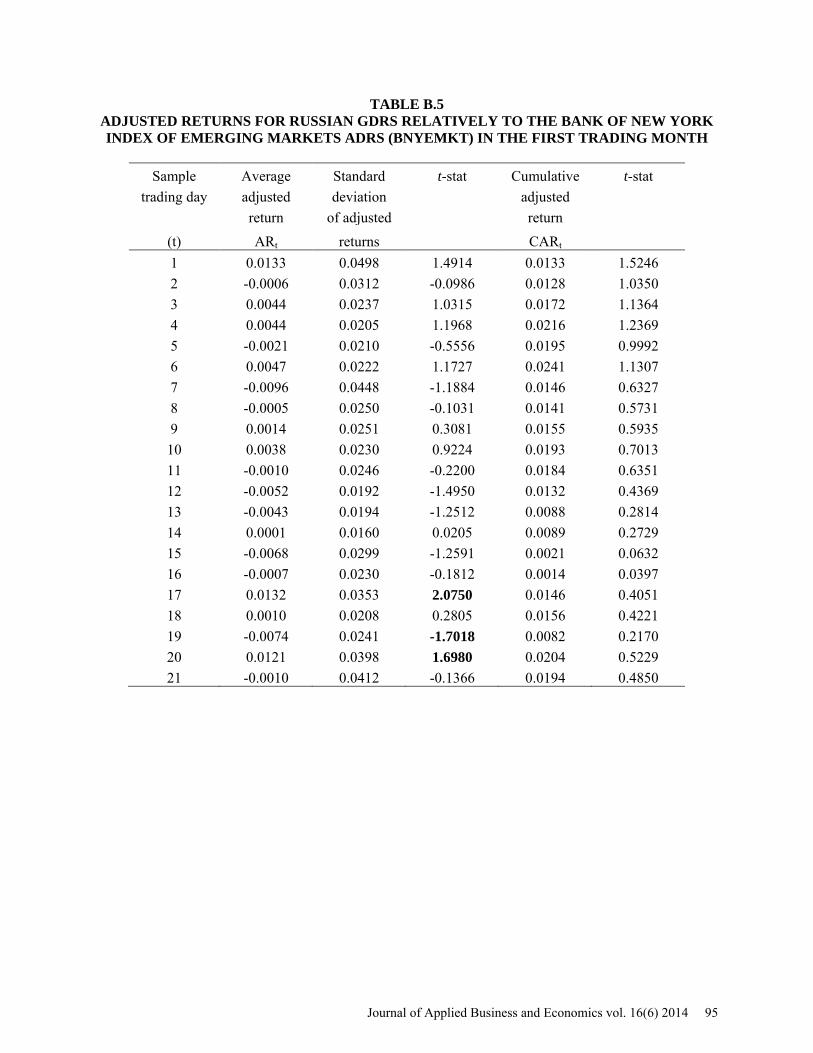
TABLE B.5 ADJUSTED RETURNS FOR RUSSIAN GDRS RELATIVELY TO THE BANK OF NEW YORK INDEX OF EMERGING MARKETS ADRS (BNYEMKT) IN THE FIRST TRADING MONTH
Sample Average Standard t-stat Cumulative t-stat
trading day adjusted deviation
adjusted
return of adjusted
return
(t) ARt returns
CARt 1 0.0133 0.0498 1.4914 0.0133 1.5246
2 -0.0006 0.0312 -0.0986 0.0128 1.0350 3 0.0044 0.0237 1.0315 0.0172 1.1364 4 0.0044 0.0205 1.1968 0.0216 1.2369 5 -0.0021 0.0210 -0.5556 0.0195 0.9992 6 0.0047 0.0222 1.1727 0.0241 1.1307 7 -0.0096 0.0448 -1.1884 0.0146 0.6327 8 -0.0005 0.0250 -0.1031 0.0141 0.5731 9 0.0014 0.0251 0.3081 0.0155 0.5935 10 0.0038 0.0230 0.9224 0.0193 0.7013 11 -0.0010 0.0246 -0.2200 0.0184 0.6351 12 -0.0052 0.0192 -1.4950 0.0132 0.4369 13 -0.0043 0.0194 -1.2512 0.0088 0.2814 14 0.0001 0.0160 0.0205 0.0089 0.2729 15 -0.0068 0.0299 -1.2591 0.0021 0.0632 16 -0.0007 0.0230 -0.1812 0.0014 0.0397 17 0.0132 0.0353 2.0750 0.0146 0.4051 18 0.0010 0.0208 0.2805 0.0156 0.4221 19 -0.0074 0.0241 -1.7018 0.0082 0.2170 20 0.0121 0.0398 1.6980 0.0204 0.5229 21 -0.0010 0.0412 -0.1366 0.0194 0.4850
Journal of Applied Business and Economics vol. 16(6) 2014 95
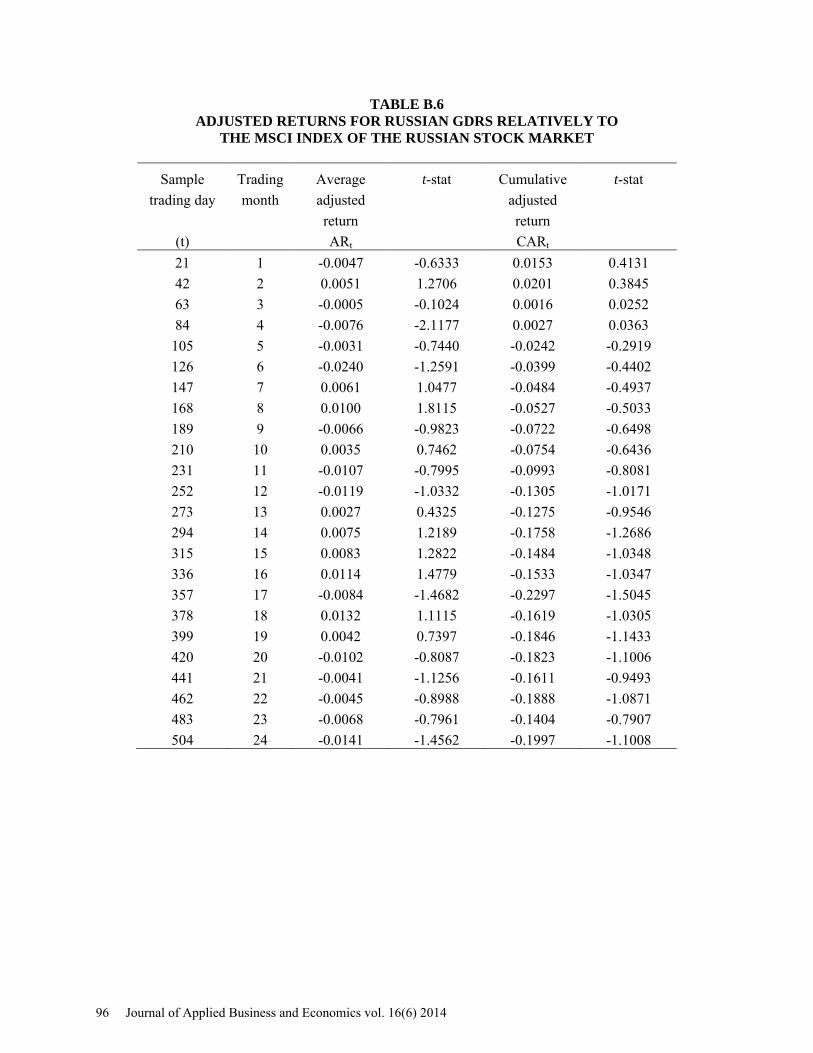
TABLE B.6 ADJUSTED RETURNS FOR RUSSIAN GDRS RELATIVELY TO
THE MSCI INDEX OF THE RUSSIAN STOCK MARKET
Sample Trading Average t-stat Cumulative t-stat trading day month adjusted
adjusted
return return (t)
ARt
CARt
21 1 -0.0047 -0.6333 0.0153 0.4131 42 2 0.0051 1.2706 0.0201 0.3845 63 3 -0.0005 -0.1024 0.0016 0.0252 84 4 -0.0076 -2.1177 0.0027 0.0363
105 5 -0.0031 -0.7440 -0.0242 -0.2919 126 6 -0.0240 -1.2591 -0.0399 -0.4402 147 7 0.0061 1.0477 -0.0484 -0.4937 168 8 0.0100 1.8115 -0.0527 -0.5033 189 9 -0.0066 -0.9823 -0.0722 -0.6498 210 10 0.0035 0.7462 -0.0754 -0.6436 231 11 -0.0107 -0.7995 -0.0993 -0.8081 252 12 -0.0119 -1.0332 -0.1305 -1.0171 273 13 0.0027 0.4325 -0.1275 -0.9546 294 14 0.0075 1.2189 -0.1758 -1.2686 315 15 0.0083 1.2822 -0.1484 -1.0348 336 16 0.0114 1.4779 -0.1533 -1.0347 357 17 -0.0084 -1.4682 -0.2297 -1.5045 378 18 0.0132 1.1115 -0.1619 -1.0305 399 19 0.0042 0.7397 -0.1846 -1.1433 420 20 -0.0102 -0.8087 -0.1823 -1.1006 441 21 -0.0041 -1.1256 -0.1611 -0.9493 462 22 -0.0045 -0.8988 -0.1888 -1.0871 483 23 -0.0068 -0.7961 -0.1404 -0.7907 504 24 -0.0141 -1.4562 -0.1997 -1.1008
96 Journal of Applied Business and Economics vol. 16(6) 2014
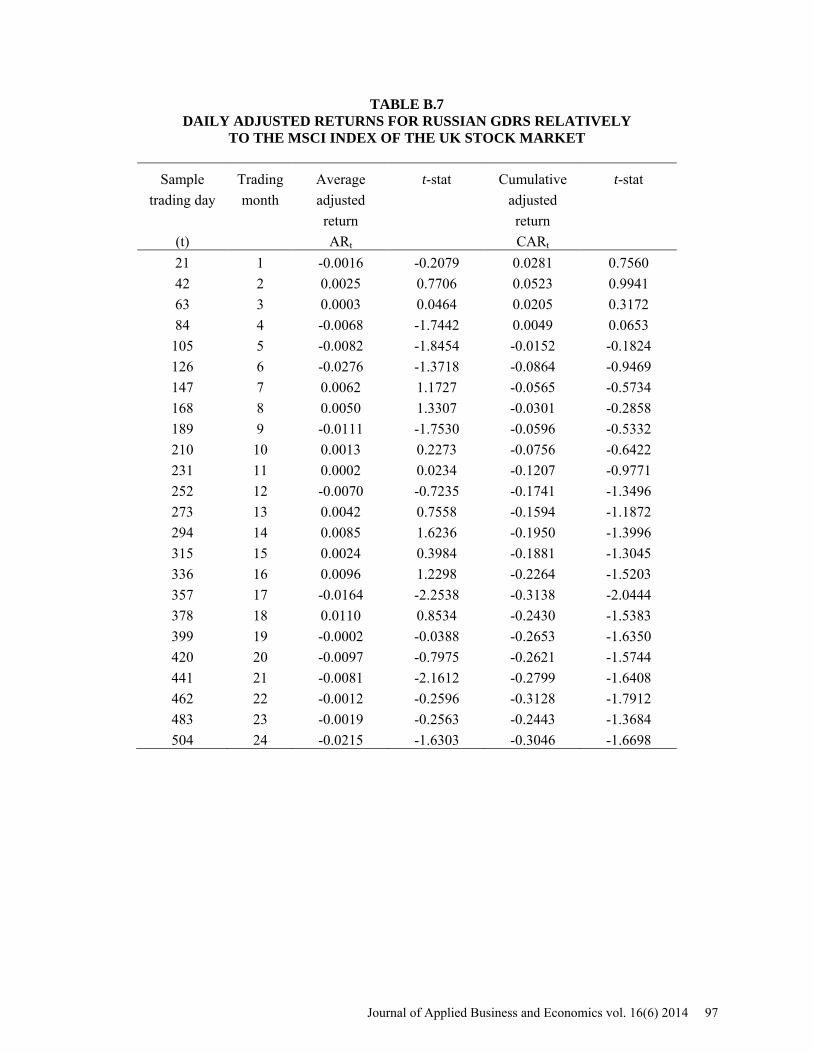
TABLE B.7 DAILY ADJUSTED RETURNS FOR RUSSIAN GDRS RELATIVELY
TO THE MSCI INDEX OF THE UK STOCK MARKET
Sample Trading Average t-stat Cumulative t-stat trading day month adjusted
adjusted
return return (t)
ARt
CARt
21 1 -0.0016 -0.2079 0.0281 0.7560 42 2 0.0025 0.7706 0.0523 0.9941 63 3 0.0003 0.0464 0.0205 0.3172 84 4 -0.0068 -1.7442 0.0049 0.0653
105 5 -0.0082 -1.8454 -0.0152 -0.1824 126 6 -0.0276 -1.3718 -0.0864 -0.9469 147 7 0.0062 1.1727 -0.0565 -0.5734 168 8 0.0050 1.3307 -0.0301 -0.2858 189 9 -0.0111 -1.7530 -0.0596 -0.5332 210 10 0.0013 0.2273 -0.0756 -0.6422 231 11 0.0002 0.0234 -0.1207 -0.9771 252 12 -0.0070 -0.7235 -0.1741 -1.3496 273 13 0.0042 0.7558 -0.1594 -1.1872 294 14 0.0085 1.6236 -0.1950 -1.3996 315 15 0.0024 0.3984 -0.1881 -1.3045 336 16 0.0096 1.2298 -0.2264 -1.5203 357 17 -0.0164 -2.2538 -0.3138 -2.0444 378 18 0.0110 0.8534 -0.2430 -1.5383 399 19 -0.0002 -0.0388 -0.2653 -1.6350 420 20 -0.0097 -0.7975 -0.2621 -1.5744 441 21 -0.0081 -2.1612 -0.2799 -1.6408 462 22 -0.0012 -0.2596 -0.3128 -1.7912 483 23 -0.0019 -0.2563 -0.2443 -1.3684 504 24 -0.0215 -1.6303 -0.3046 -1.6698
Journal of Applied Business and Economics vol. 16(6) 2014 97
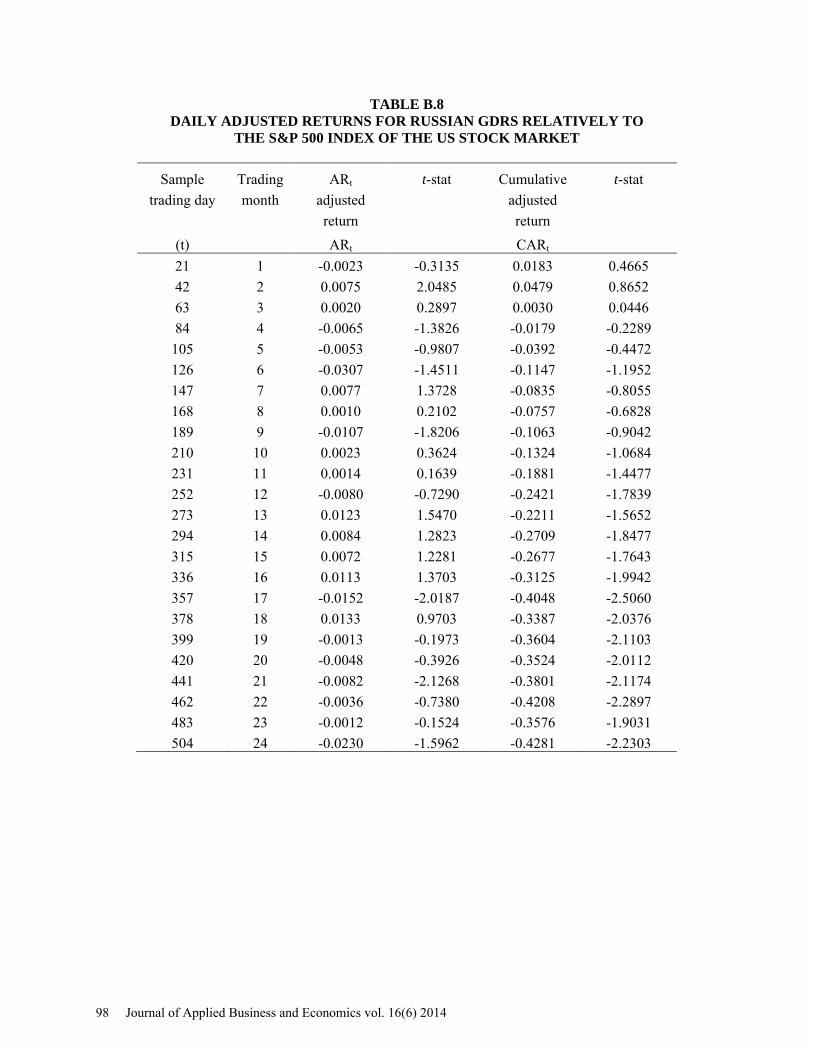
TABLE B.8 DAILY ADJUSTED RETURNS FOR RUSSIAN GDRS RELATIVELY TO
THE S&P 500 INDEX OF THE US STOCK MARKET
Sample Trading ARt t-stat Cumulative t-stat trading day month adjusted
adjusted
return
return (t)
ARt
CARt
21 1 -0.0023 -0.3135 0.0183 0.4665 42 2 0.0075 2.0485 0.0479 0.8652 63 3 0.0020 0.2897 0.0030 0.0446 84 4 -0.0065 -1.3826 -0.0179 -0.2289
105 5 -0.0053 -0.9807 -0.0392 -0.4472 126 6 -0.0307 -1.4511 -0.1147 -1.1952 147 7 0.0077 1.3728 -0.0835 -0.8055 168 8 0.0010 0.2102 -0.0757 -0.6828 189 9 -0.0107 -1.8206 -0.1063 -0.9042 210 10 0.0023 0.3624 -0.1324 -1.0684 231 11 0.0014 0.1639 -0.1881 -1.4477 252 12 -0.0080 -0.7290 -0.2421 -1.7839 273 13 0.0123 1.5470 -0.2211 -1.5652 294 14 0.0084 1.2823 -0.2709 -1.8477 315 15 0.0072 1.2281 -0.2677 -1.7643 336 16 0.0113 1.3703 -0.3125 -1.9942 357 17 -0.0152 -2.0187 -0.4048 -2.5060 378 18 0.0133 0.9703 -0.3387 -2.0376 399 19 -0.0013 -0.1973 -0.3604 -2.1103 420 20 -0.0048 -0.3926 -0.3524 -2.0112 441 21 -0.0082 -2.1268 -0.3801 -2.1174 462 22 -0.0036 -0.7380 -0.4208 -2.2897 483 23 -0.0012 -0.1524 -0.3576 -1.9031 504 24 -0.0230 -1.5962 -0.4281 -2.2303
98 Journal of Applied Business and Economics vol. 16(6) 2014
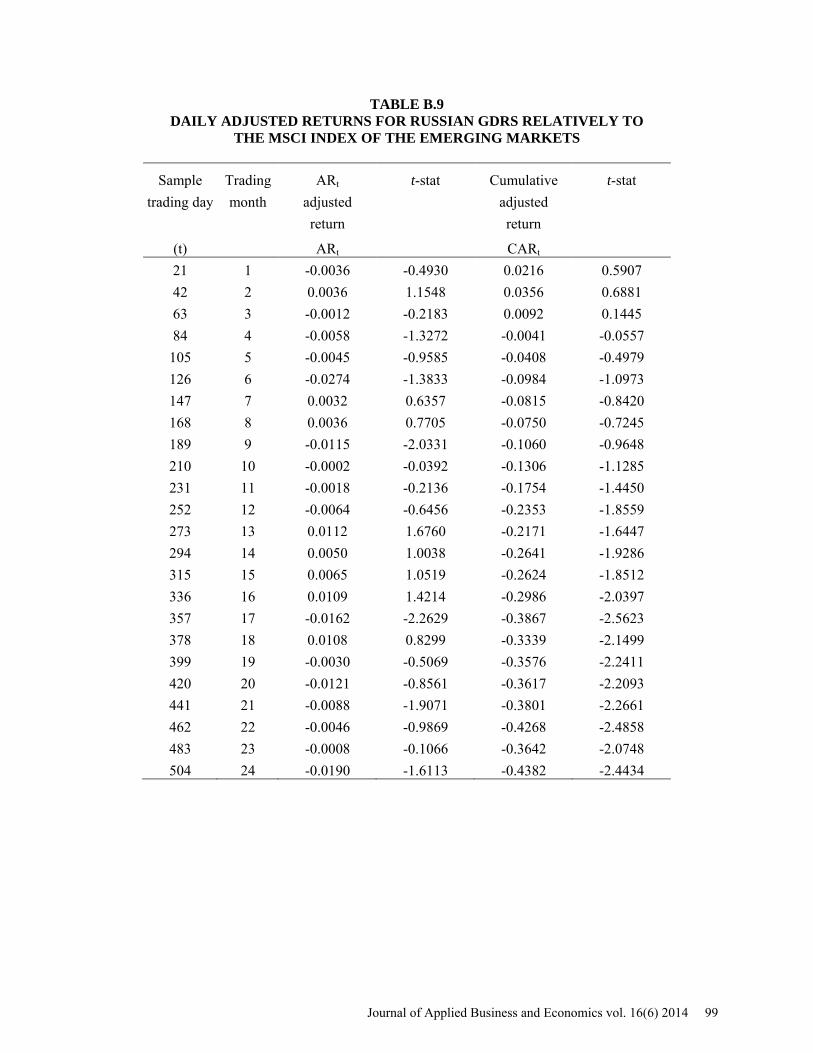
TABLE B.9 DAILY ADJUSTED RETURNS FOR RUSSIAN GDRS RELATIVELY TO
THE MSCI INDEX OF THE EMERGING MARKETS
Sample Trading ARt t-stat Cumulative t-stat trading day month adjusted
adjusted
return
return (t)
ARt
CARt
21 1 -0.0036 -0.4930 0.0216 0.5907 42 2 0.0036 1.1548 0.0356 0.6881 63 3 -0.0012 -0.2183 0.0092 0.1445 84 4 -0.0058 -1.3272 -0.0041 -0.0557
105 5 -0.0045 -0.9585 -0.0408 -0.4979 126 6 -0.0274 -1.3833 -0.0984 -1.0973 147 7 0.0032 0.6357 -0.0815 -0.8420 168 8 0.0036 0.7705 -0.0750 -0.7245 189 9 -0.0115 -2.0331 -0.1060 -0.9648 210 10 -0.0002 -0.0392 -0.1306 -1.1285 231 11 -0.0018 -0.2136 -0.1754 -1.4450 252 12 -0.0064 -0.6456 -0.2353 -1.8559 273 13 0.0112 1.6760 -0.2171 -1.6447 294 14 0.0050 1.0038 -0.2641 -1.9286 315 15 0.0065 1.0519 -0.2624 -1.8512 336 16 0.0109 1.4214 -0.2986 -2.0397 357 17 -0.0162 -2.2629 -0.3867 -2.5623 378 18 0.0108 0.8299 -0.3339 -2.1499 399 19 -0.0030 -0.5069 -0.3576 -2.2411 420 20 -0.0121 -0.8561 -0.3617 -2.2093 441 21 -0.0088 -1.9071 -0.3801 -2.2661 462 22 -0.0046 -0.9869 -0.4268 -2.4858 483 23 -0.0008 -0.1066 -0.3642 -2.0748 504 24 -0.0190 -1.6113 -0.4382 -2.4434
Journal of Applied Business and Economics vol. 16(6) 2014 99

TABLE B.10 DAILY ADJUSTED RETURNS FOR RUSSIAN GDRS RELATIVELY TO
THE BANK OF NEW YORK MELLON OF EMERGING MARKETS ADRS
Sample Trading ARt t-stat Cumulative t-stat trading day month adjusted
adjusted
return
return (t)
ARt
CARt
21 1 -0.001 -0.137 0.019 0.485 42 2 0.006 1.614 0.032 0.573 63 3 0.003 0.420 0.005 0.071 84 4 -0.007 -1.412 -0.016 -0.198
105 5 -0.005 -1.009 -0.054 -0.608 126 6 -0.027 -1.288 -0.116 -1.188 147 7 0.006 1.166 -0.101 -0.956 168 8 0.003 0.606 -0.101 -0.894 189 9 -0.010 -1.694 -0.129 -1.075 210 10 0.002 0.311 -0.154 -1.218 231 11 -0.004 -0.421 -0.203 -1.536 252 12 -0.014 -1.137 -0.263 -1.901 273 13 0.010 1.389 -0.238 -1.651 294 14 0.007 0.958 -0.289 -1.934 315 15 0.008 1.255 -0.283 -1.827 336 16 0.012 1.511 -0.321 -2.012 357 17 -0.015 -1.669 -0.406 -2.466 378 18 0.015 1.129 -0.342 -2.018 399 19 0.000 0.058 -0.363 -2.088 420 20 -0.009 -0.735 -0.368 -2.062 441 21 -0.010 -2.633 -0.388 -2.122 462 22 -0.003 -0.640 -0.435 -2.325 483 23 -0.001 -0.155 -0.371 -1.939 504 24 -0.024 -1.499 -0.434 -2.220
100 Journal of Applied Business and Economics vol. 16(6) 2014